a study of low-performing schools, high … reports...a study of low-performing schools,...
TRANSCRIPT
A Study of Low-Performing Schools, High-Performing Schools, and
High-Performing Learning Communities
Merrill L. Meehan Director of Evaluation
Kimberly S. Cowley
Research & Evaluation Specialist
AEL P.O. Box 1348
Charleston, WV 25325 U.S.A.
Paper Presented at the Hawaii International Conference on Education
Waikiki, Hawaii January 7-10, 2003
AEL is a catalyst for schools and communities to build lifelong learning systems that harness resources, research, and practical wisdom. AEL serves as the Regional Educational Laboratory (REL) for Kentucky, Tennessee, Virginia, and West Virginia. For these same four states, it operates the Eisenhower Regional Consortium for Mathematics and Science Education. In addition, it serves as the Region IV Comprehensive Center and operates the ERIC Clearinghouse on Rural Education and Small Schools. AEL houses the Institute for the Advancement of Emerging Technologies in Education (IAETE) and the Institute for the Advancement of Research in Education (IARE). The REL contract includes a Technology Specialty for the nation’s system of 10 Regional Educational Laboratories. Information about AEL projects, programs, and services is available by writing, calling, or visiting AEL’s Web site.
Post Office Box 1348
Charleston, West Virginia 25325-1348 304-347-0400 800-624-9120
304-347-0487 (fax) [email protected]
www.ael.org
© 2002 by AEL This publication is based on work sponsored wholly or in part by the Kentucky Department of Education. Its contents do not necessarily reflect the views of the Kentucky Department of Education.
AEL is an Equal Opportunity/Affirmative Action Employer
TABLE OF CONTENTS INTRODUCTION Purpose and Objectives ................................................................................................................ 1 METHODS .......................................................................................................................................... 3 Sample Schools ............................................................................................................................ 3 Low-Performing Schools ................................................................................................. 3 High-Performing Schools................................................................................................. 3 Instrument..................................................................................................................................... 4 Data Collection and Analyses ...................................................................................................... 5 RESULTS .......................................................................................................................................... 6 Low-Performing Schools ............................................................................................................. 6 High-Performing Schools........................................................................................................... 11 Cross-State Comparisons ........................................................................................................... 15 CONCLUSIONS................................................................................................................................ 16 RECOMMENDATIONS................................................................................................................... 18 REFERENCES .................................................................................................................................. 20
i
LIST OF TABLES
1: AEL CSIQ Median Scale Scores by State ................................................................................. 6 2: AEL CSIQ Descriptive Statistics for Alabama Low-Performing Schools Consistently Above or Below Median Scores ........................................................................... 7 3: AEL CSIQ Descriptive Statistics for Kentucky High-Performing Schools Consistently Above or Below Median Scores ......................................................................... 12
LIST OF FIGURES 1: AEL CSIQ Spread of Scale Scores for Alabama Low-Performing Schools Consistently Above or Below the Median Scale Scores............................................................ 8 2: AEL CSIQ Box Plots for Alabama Low-Performing Schools Consistently Scoring Above or Below Median Scale Scores..................................................................................... 10 3: AEL CSIQ Spread of Scale Scores for Kentucky High-Performing Schools Consistently Above or Below the Median Scale Scores.......................................................... 13 4: AEL CSIQ Box Plots of Kentucky High-Performing Schools Consistently Scoring Above or Below Median Scale Scores..................................................................................... 14 5: AEL CSIQ Mean Scale Scores by State .................................................................................. 15
ii

INTRODUCTION The targets of educational reform in the United States have shifted dramatically over the past decades. In the 1960s, educational reform focused most directly on classroom teachers, both inservice and preservice, through competency/performance-based teacher education efforts and other such innovations. In the 1970s, reform efforts moved to students through programs such as minimum competency tests and increased graduation requirements. In the 1980s, the popularity of the effective schools research studies and the publication of A Nation at Risk (National Commission on Excellence in Education, 1983) moved the reform target to the school itself. This shift to the schools continued in the 1990s when such terms as “reforming schools” and “restructuring schools” were popular. In the new millennium, there continues to be interest in improving schools as measured by the results of student achievement on standardized tests. But what about the school faculty’s perceptions regarding their collective efficacy to teach students and their school’s organizational effectiveness? Miskel, McDonald, and Bloom (1983) state that “Perceived organizational effectiveness is the subjective evaluation of a school’s productivity, adaptability, and flexibility” (p. 55). Bandura (1982) writes “Perceived collective efficacy will influence what people choose to do as a group, how much effort they put into it, and their staying power when the group fails to produce results” (p. 143). What is the role of the school faculty in reform efforts? Increasingly, academics and practitioners are looking at nonstructural aspects of schooling as the “doors” to educational improvement (Joyce, 1991). Such doors include the shared norms, knowledge, and skills of teachers (Elmore, 1995). Restructuring of schools, therefore, needs to be balanced by “reculturing” of school faculties (Fullan, 1996; Hargreaves, 1994). Thus, while present educational reform efforts concentrate on school results as evidenced by students’ test scores, there is a need to be able to measure the school staff’s perceptions of their abilities to move into and remain in a mode of continuous learning and improvement, which is one form of reculturing. AEL’s reculturing conceptual framework for schools in a mode of continuous learning and improvement consists of six key concepts. These concepts include shared leadership, effective teaching, school/family/community connections, purposeful student assessment, shared goals for earning, and learning culture. Purpose and Objectives The purpose of this study was to investigate differences among professional staffs’ perceptions of being in a continuous learning and improvement mode in low-performing schools, high-performing schools, and high-performing learning communities. The schools in this study were identified by staff in state departments of education as being either low- or high-performing in terms of student achievement and candidates for high-performing learning communities were identified as a result of this study. Five objectives were identified to address the purpose of this study. The first objective was to administer the AEL Continuous School Improvement Questionnaire (AEL CSIQ) to the professional staff of the schools identified as low-performing in one state and high-performing in
1
another state. The second objective was to identify those schools within each state with scores consistently above or below the median on the six scales of the instrument. The third objective was to inspect the range of scores within each state for any overlap between the two groups of consistently above and below the median for each scale. The fourth objective was to identify from the high-performing schools those that are classified as high-performing learning communities. The fifth objective was to study and compare the descriptive statistics of the scale scores across states.
2
METHODS
This section presents explanations of the two samples of schools in the study, the instrument completed by the schools’ staffs, and the methods of administering the instrument and data analyses. Sample Schools Two samples of schools were used in this study, both identified by staff in their State Departments of Education (SDE). One sample of low-performing schools was identified by the Alabama SDE staff while the other sample of high-performing schools was identified by Kentucky SDE staff. The process used for identifying each sample is explained below. Low-Performing Schools. The 45 low-performing schools in this study were identified by the Alabama SDE staff from all the schools in the state (approximately 1,470). Schools in Alabama must set a student achievement goal each year related to their Scholastic Achievement Test-9 (SAT-9) scores. Schools must design an improvement plan to reach their goal and they must show progress toward that goal each year. Alabama SDE staff monitor each school’s progress toward their student achievement goal. Based on the SDE monitoring of schools’ progress toward their SAT-9 scores, schools not making satisfactory progress are placed on “Academic Caution.” There are three levels of Academic Caution for Alabama schools: Alert 1, Alert 2, and Alert 3 (the worst status). Basically, the “Alert” status number signifies how many years the school has missed their SAT-9 school improvement goal. Alert 3 schools can be taken over by the state. At the end of the 2001/2002 academic school year there were 119 Alabama schools on Academic Caution. None was on the Alert 3 status. To assist schools to meet their school improvement goal and be taken off the Academic Caution list, the Alabama SDE staff planned several interventions for the principals of the schools to choose for participation. One of those interventions for Academic Caution principals was participation in the year-long Alabama Leadership Academy starting in the summer of 2002. The 45 low-performing Alabama schools in this study were identified as being on either Academic Caution, Alert 1 or Alert 2, and whose principal chose to spend the next year in the Alabama Leadership Academy, starting in the summer of 2002, in order to improve their practice and thereby improve their school’s academic status with the state. High-Performing Schools. The 48 high-performing schools in this study were identified by staff in the Kentucky SDE from the population of all Kentucky schools (approximately 1,420). Criteria used for selecting these high-performing schools at each of three building levels (elementary, middle, and high) are described below.
1. Only schools with 1999-2000 standardized test data for all students and for students participating in a program for struggling learners were included.
3
2. Only schools with relatively large populations of students qualifying for the free and reduced lunch program were included; i.e., elementary schools with more than 25% eligibility, middle schools with more than 20% eligibility, and high schools with more than 10% eligibility.
3. Remaining schools were rank ordered from highest to lowest based on the
overall academic index score for all students (this index included scores for reading, math, social studies, science, writing, arts and humanities, and practical living/vocational studies).
4. Data on the number of students in programs for struggling learners, the
number of students in the free and reduced lunch program, and the number of African American students were inspected.
5. Schools were placed in two groups: (a) schools where students in programs
for struggling learners, free/reduced lunch students, and African American students were all scoring within 10 points of the school average and (b) schools where students in the same subgroupings were scoring more than 10 points below the school average.
6. Schools were selected from each grouping that were generally representative
of Kentucky schools and students on the basis of geography and demography. Thus, all the Kentucky schools in this study were identified as being relatively high performing based on their overall academic school index scores. One group was also relatively successful with struggling learners and minority and economically disadvantaged students; the other group was relatively successful with some students, but not as successful with struggling learners and minority and economically disadvantaged youth. A sample of 48 schools was drawn from the remaining schools that met all of the above criteria, with 24 schools in each of the two achievement groupings. The 24 schools per group included 12 elementary, 6 middle, and 6 high schools. It should be noted the achievement gap difference was not a part of this study: All 48 Kentucky schools were studied as one group. Instrument The AEL Continuous School Improvement Questionnaire (AEL CSIQ), the instrument employed in this study, was developed to measure a K-12 faculty’s commitment to continuous learning and improvement. The conceptual framework for this instrument consists of six key concepts: shared leadership, effective teaching, school/family/community connections, purposeful student assessment, shared goals for learning, and learning culture. This 60-item self-report inventory has demonstrated valid and reliable results in several previous settings (Meehan, Cowley, Wiersma, Orletsky, Sattes, & Walsh, 2002). The AEL CSIQ contains six scales representing the six key concepts, each composed of 10 items with Likert-type response options of 1 (Not present) to 6 (Present to a high degree). All items are in the same direction; none is reverse-scored. School performance on the instrument is a function of the combined perceptions of the professional staff (Meehan, Wiersma, Cowley, Craig, Orletsky, & Childers, 2002).
4
Data Collection and Analyses Regarding data collection for both states, a school contact person was identified to work with AEL staff in the administration of the AEL CSIQ. AEL staff assembled school packets that included copies of the instrument for all professional staff and a cover letter containing directions for administering and returning the completed questionnaires. AEL staff then scored and analyzed the data and prepared individual school reports, which contained scores for the six scales. The vast majority of the schools completed and returned their instruments in the planned three-month period of October through December 2001. However, a few schools did not and follow-up procedures with school contacts produced the remaining sets of questionnaires in January 2002.
All 45 of the Alabama low-performing schools whose principals participated in the Alabama Leadership Academy completed and returned the instrument. A total of 47 of the 48 Kentucky high-performing schools completed and returned the instrument. Data from these 92 schools then were aggregated and merged into one file that comprised the final data set for this study.
This was a descriptive study of 92 schools—45 low-performing and 47 high-
performing—in two states whose staff completed the same instrument. The instrument yielded six scale scores. With respect to data analyses, first, median scores were determined by state for each of the six AEL CSIQ scales. Second, schools that consistently scored above the six medians and schools that consistently scored below those medians were identified within each state. Third, figures displaying the spread of scores and box plots, one for each scale, were generated and analyzed for the two groups within each state (those schools consistently above the medians and those schools consistently below the medians). Fourth, those Kentucky schools that were consistently above the median scale scores were classified as high-performing learning communities for subsequent analyses. Fifth, descriptive statistics and a chart of mean scale scores were generated and analyzed for the two states.
5
RESULTS
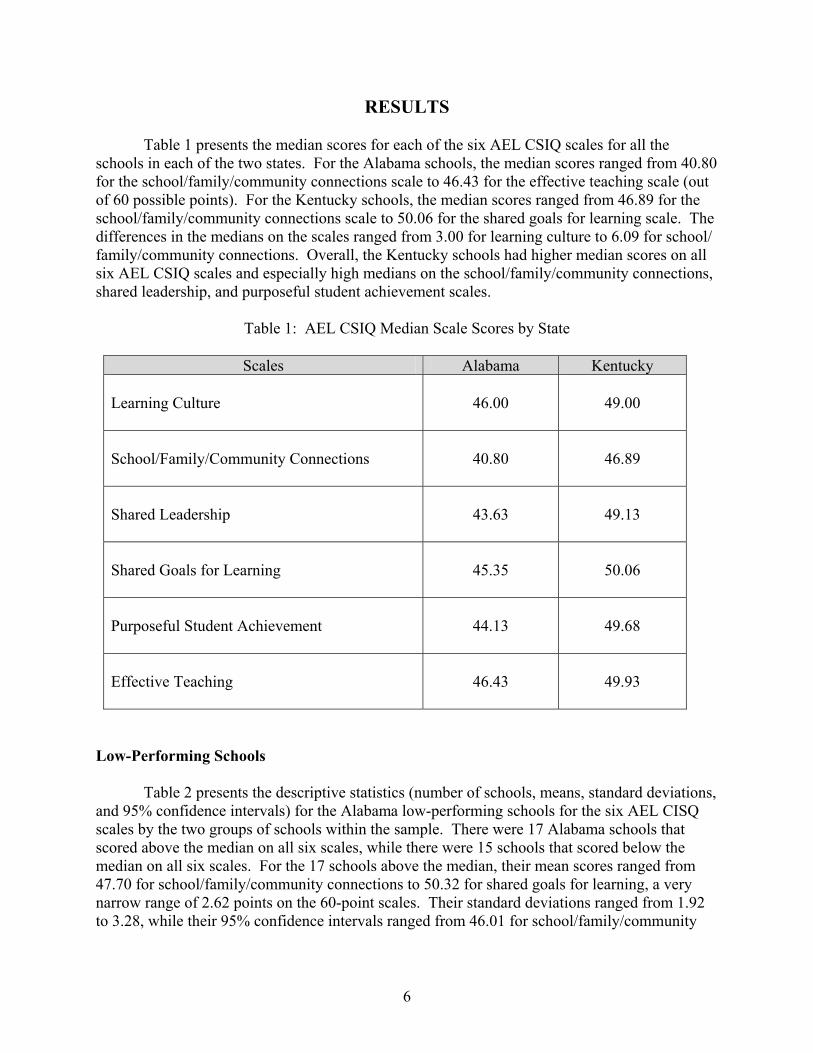
Table 1 presents the median scores for each of the six AEL CSIQ scales for all the schools in each of the two states. For the Alabama schools, the median scores ranged from 40.80 for the school/family/community connections scale to 46.43 for the effective teaching scale (out of 60 possible points). For the Kentucky schools, the median scores ranged from 46.89 for the school/family/community connections scale to 50.06 for the shared goals for learning scale. The differences in the medians on the scales ranged from 3.00 for learning culture to 6.09 for school/ family/community connections. Overall, the Kentucky schools had higher median scores on all six AEL CSIQ scales and especially high medians on the school/family/community connections, shared leadership, and purposeful student achievement scales.
Table 1: AEL CSIQ Median Scale Scores by State
Scales Alabama Kentucky Learning Culture
46.00
49.00
School/Family/Community Connections
40.80
46.89
Shared Leadership
43.63
49.13
Shared Goals for Learning
45.35
50.06
Purposeful Student Achievement
44.13
49.68
Effective Teaching
46.43
49.93
Low-Performing Schools
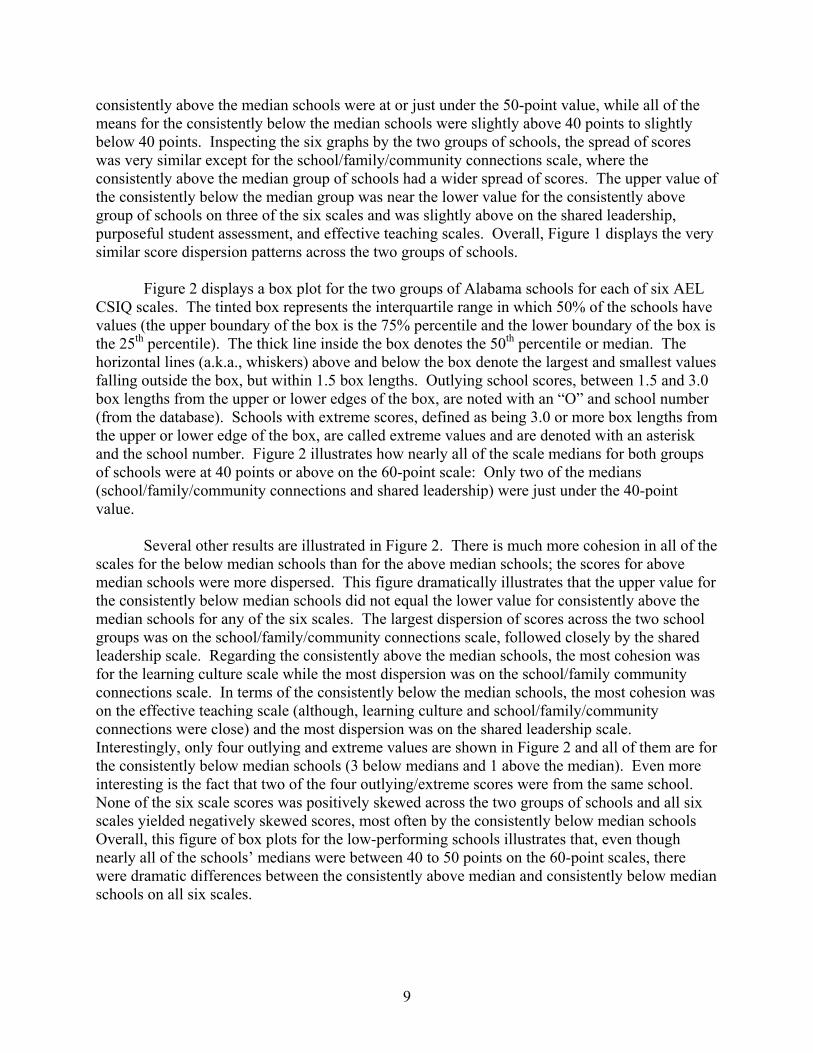
Table 2 presents the descriptive statistics (number of schools, means, standard deviations, and 95% confidence intervals) for the Alabama low-performing schools for the six AEL CISQ scales by the two groups of schools within the sample. There were 17 Alabama schools that scored above the median on all six scales, while there were 15 schools that scored below the median on all six scales. For the 17 schools above the median, their mean scores ranged from 47.70 for school/family/community connections to 50.32 for shared goals for learning, a very narrow range of 2.62 points on the 60-point scales. Their standard deviations ranged from 1.92 to 3.28, while their 95% confidence intervals ranged from 46.01 for school/family/community
6
connections to 51.39 for shared goals for learning. For the 15 schools below the median, their mean scores ranged from 38.12 for school/family/community connections to 43.81 for effective teaching; standard deviations ranged from 1.43 to 2.68; and their 95% confidence intervals ranged from 37.15 to 44.91. Overall, across the two groups of schools, school/family/ community connections had the lowest mean scores, while shared goals for learning (consistently above) and effective teaching (consistently below) had the highest mean scores. The second and third largest standard deviations were for the shared leadership scale. The most interesting result with the 95% confidence intervals was that none of the upper values for the consistently below schools were close to the lower values for the consistently above schools on any of the six AEL CSIQ scales: The closest was a 4.10 difference on the effective teaching scale.
Table 2: AEL CSIQ Descriptive Statistics for Alabama Low-Performing Schools
Consistently Above or Below Median Scores
95% Conf. Intervals Scales
Grouping
N
Mean
Standard Deviation Lower Upper
Consistently Above Median
17 49.75 2.02 48.71 50.78 Learning Culture Consistently
Below Median 15 42.55 1.43 41.76 43.35
Consistently Above Median
17 47.70 3.28 46.01 49.39 School/ Family/ Community Connections
Consistently Below Median
15 38.12 1.75 37.15 39.09
Consistently Above Median
17 49.08 2.88 47.60 50.56 Shared Leadership
Consistently Below Median
15 38.91 2.68 37.43 40.40
Consistently Above Median
17 50.32 2.10 49.24 51.39 Shared Goals for Learning
Consistently Below Median
15 41.77 1.54 40.92 42.62
Consistently Above Median
17 49.29 2.36 48.08 50.50 Purposeful Student Assessment Consistently
Below Median 15 41.38 1.83 40.37 42.39
Consistently Above Median
17 49.99 1.92 49.01 50.98 Effective Teaching
Consistently Below Median
15 43.81 1.99 42.70 44.91
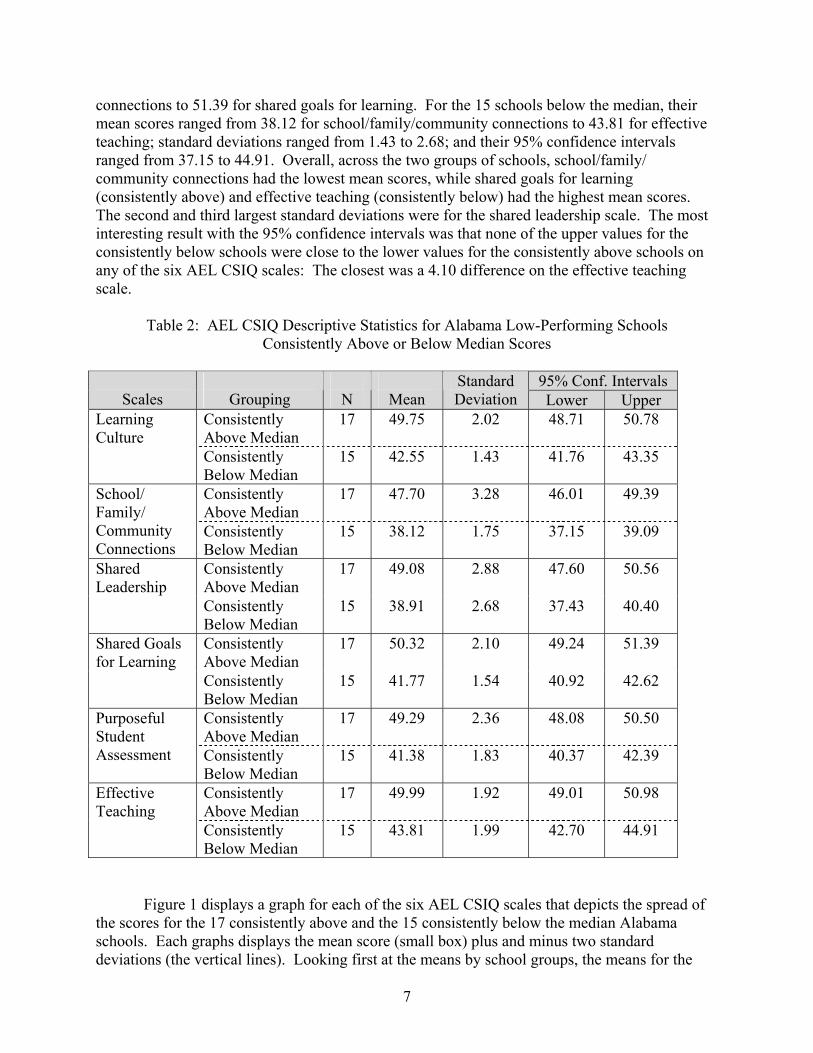
Figure 1 displays a graph for each of the six AEL CSIQ scales that depicts the spread of the scores for the 17 consistently above and the 15 consistently below the median Alabama schools. Each graphs displays the mean score (small box) plus and minus two standard deviations (the vertical lines). Looking first at the means by school groups, the means for the
7
1517N =
Below MedianAbove Median
Mea
n +/
- 2 S
td. D
ev.:
Lea
rnin
g C
ultu
re60
50
40
30
20
101517N =
Below MedianAbove Median
Mea
n +/
- 2 S
td. D
ev.:
S/F
/C C
onne
ctio
ns
60
50
40
30
20
10
1517N =
Below MedianAbove Median
Mea
n +/
- 2 S
td. D
ev.:
Sha
red
Lead
ersh
ip
60
50
40
30
20
101517N =
Below MedianAbove Median
Mea
n +/
- 2 S
td. D
ev.:
Sha
red
Goa
ls fo
r Lea
rnin
g 60
50
40
30
20
10
1517N =
Below MedianAbove Median
Mea
n +/
- 2 S
td. D
ev.:
Stu
dent
Ass
essm
ent
60
50
40
30
20
101517N =
Below MedianAbove Median
Mea
n +/
- 2 S
td. D
ev.:
Eff
ectiv
e Te
achi
ng
60
50
40
30
20
10
Figure 1: AEL CSIQ Spread of Scale Scores for Alabama Low-Performing Schools
Consistently Above or Below the Median Scale Scores
8
consistently above the median schools were at or just under the 50-point value, while all of the means for the consistently below the median schools were slightly above 40 points to slightly below 40 points. Inspecting the six graphs by the two groups of schools, the spread of scores was very similar except for the school/family/community connections scale, where the consistently above the median group of schools had a wider spread of scores. The upper value of the consistently below the median group was near the lower value for the consistently above group of schools on three of the six scales and was slightly above on the shared leadership, purposeful student assessment, and effective teaching scales. Overall, Figure 1 displays the very similar score dispersion patterns across the two groups of schools.
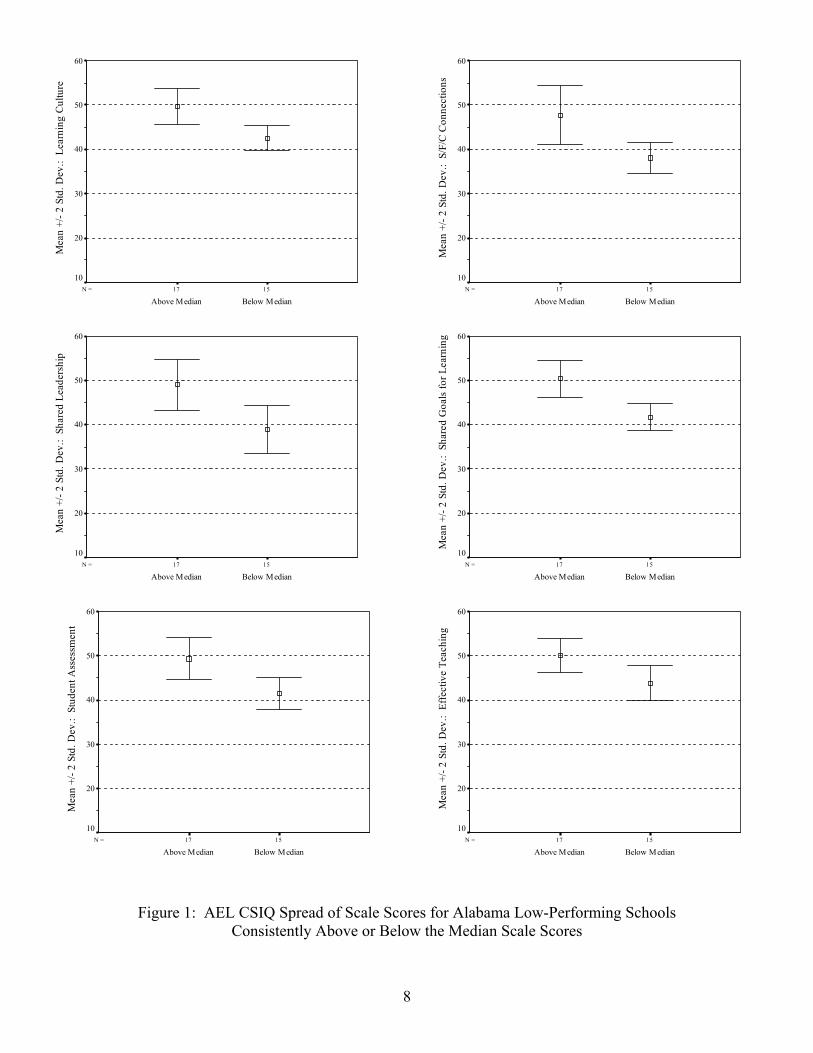
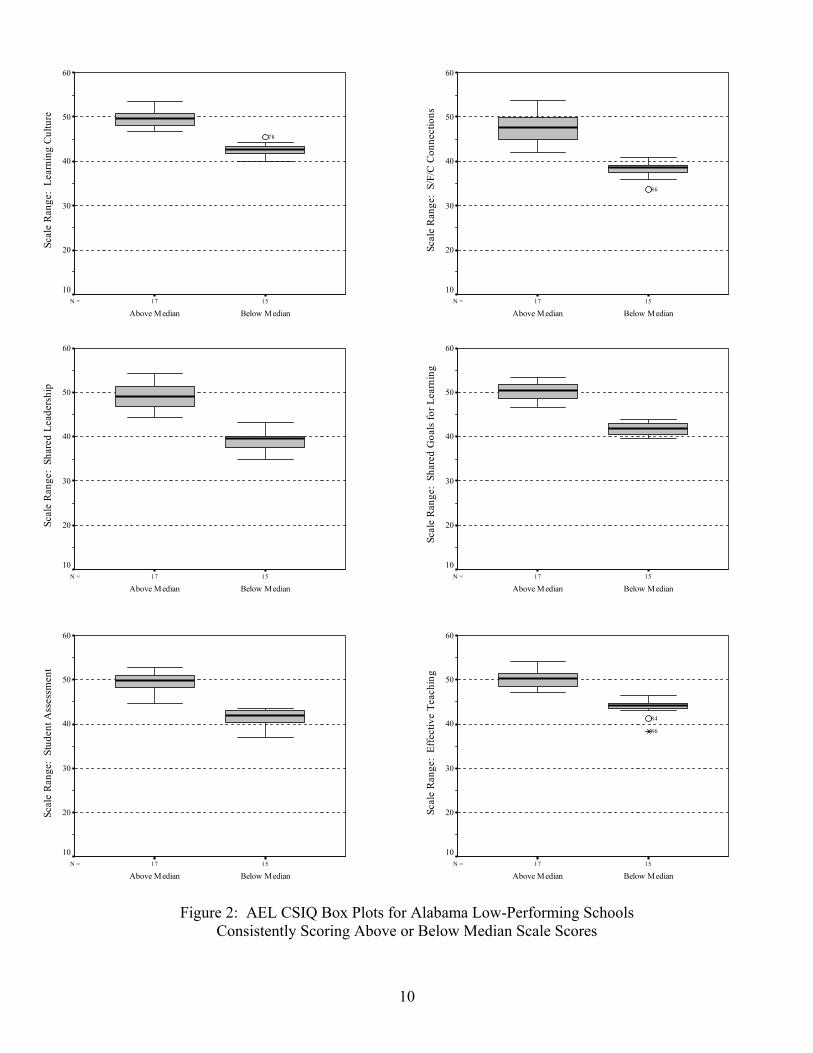
Figure 2 displays a box plot for the two groups of Alabama schools for each of six AEL
CSIQ scales. The tinted box represents the interquartile range in which 50% of the schools have values (the upper boundary of the box is the 75% percentile and the lower boundary of the box is the 25th percentile). The thick line inside the box denotes the 50th percentile or median. The horizontal lines (a.k.a., whiskers) above and below the box denote the largest and smallest values falling outside the box, but within 1.5 box lengths. Outlying school scores, between 1.5 and 3.0 box lengths from the upper or lower edges of the box, are noted with an “O” and school number (from the database). Schools with extreme scores, defined as being 3.0 or more box lengths from the upper or lower edge of the box, are called extreme values and are denoted with an asterisk and the school number. Figure 2 illustrates how nearly all of the scale medians for both groups of schools were at 40 points or above on the 60-point scale: Only two of the medians (school/family/community connections and shared leadership) were just under the 40-point value.
Several other results are illustrated in Figure 2. There is much more cohesion in all of the
scales for the below median schools than for the above median schools; the scores for above median schools were more dispersed. This figure dramatically illustrates that the upper value for the consistently below median schools did not equal the lower value for consistently above the median schools for any of the six scales. The largest dispersion of scores across the two school groups was on the school/family/community connections scale, followed closely by the shared leadership scale. Regarding the consistently above the median schools, the most cohesion was for the learning culture scale while the most dispersion was on the school/family community connections scale. In terms of the consistently below the median schools, the most cohesion was on the effective teaching scale (although, learning culture and school/family/community connections were close) and the most dispersion was on the shared leadership scale. Interestingly, only four outlying and extreme values are shown in Figure 2 and all of them are for the consistently below median schools (3 below medians and 1 above the median). Even more interesting is the fact that two of the four outlying/extreme scores were from the same school. None of the six scale scores was positively skewed across the two groups of schools and all six scales yielded negatively skewed scores, most often by the consistently below median schools Overall, this figure of box plots for the low-performing schools illustrates that, even though nearly all of the schools’ medians were between 40 to 50 points on the 60-point scales, there were dramatic differences between the consistently above median and consistently below median schools on all six scales.
9
1517N =
Below MedianAbove Median
Scal
e R
ange
: Le
arni
ng C
ultu
re
60
50
40
30
20
10
78
1517N =
Below MedianAbove Median
Scal
e R
ange
: S/
F/C
Con
nect
ions
60
50
40
30
20
10
86
1517N =
Below MedianAbove Median
Scal
e R
ange
: Sh
ared
Lea
ders
hip
60
50
40
30
20
10
1517N =
Below MedianAbove Median
Scal
e R
ange
: Sh
ared
Goa
ls fo
r Lea
rnin
g
60
50
40
30
20
10
1517N =
Below MedianAbove Median
Scal
e R
ange
: St
uden
t Ass
essm
ent
60
50
40
30
20
10
1517N =
Below MedianAbove Median
Scal
e R
ange
: Ef
fect
ive
Teac
hing
60
50
40
30
20
10
84
86
Figure 2: AEL CSIQ Box Plots for Alabama Low-Performing Schools Consistently Scoring Above or Below Median Scale Scores
10
High-Performing Schools
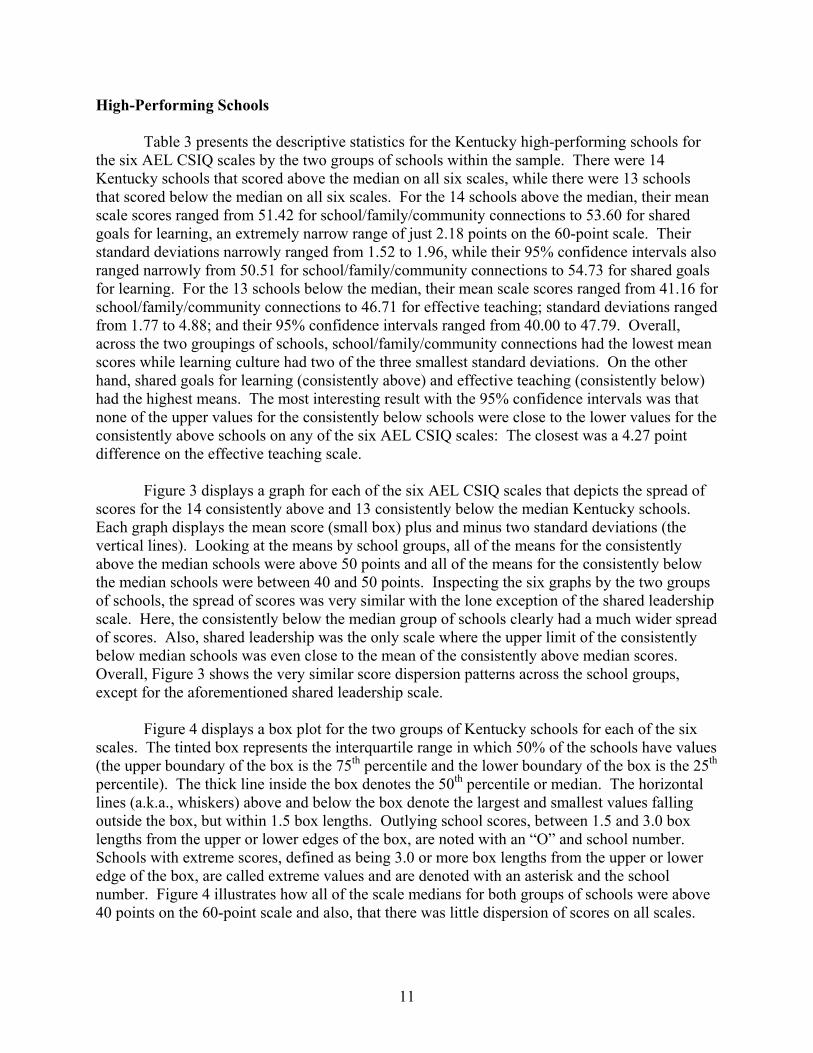
Table 3 presents the descriptive statistics for the Kentucky high-performing schools for the six AEL CSIQ scales by the two groups of schools within the sample. There were 14 Kentucky schools that scored above the median on all six scales, while there were 13 schools that scored below the median on all six scales. For the 14 schools above the median, their mean scale scores ranged from 51.42 for school/family/community connections to 53.60 for shared goals for learning, an extremely narrow range of just 2.18 points on the 60-point scale. Their standard deviations narrowly ranged from 1.52 to 1.96, while their 95% confidence intervals also ranged narrowly from 50.51 for school/family/community connections to 54.73 for shared goals for learning. For the 13 schools below the median, their mean scale scores ranged from 41.16 for school/family/community connections to 46.71 for effective teaching; standard deviations ranged from 1.77 to 4.88; and their 95% confidence intervals ranged from 40.00 to 47.79. Overall, across the two groupings of schools, school/family/community connections had the lowest mean scores while learning culture had two of the three smallest standard deviations. On the other hand, shared goals for learning (consistently above) and effective teaching (consistently below) had the highest means. The most interesting result with the 95% confidence intervals was that none of the upper values for the consistently below schools were close to the lower values for the consistently above schools on any of the six AEL CSIQ scales: The closest was a 4.27 point difference on the effective teaching scale.
Figure 3 displays a graph for each of the six AEL CSIQ scales that depicts the spread of scores for the 14 consistently above and 13 consistently below the median Kentucky schools. Each graph displays the mean score (small box) plus and minus two standard deviations (the vertical lines). Looking at the means by school groups, all of the means for the consistently above the median schools were above 50 points and all of the means for the consistently below the median schools were between 40 and 50 points. Inspecting the six graphs by the two groups of schools, the spread of scores was very similar with the lone exception of the shared leadership scale. Here, the consistently below the median group of schools clearly had a much wider spread of scores. Also, shared leadership was the only scale where the upper limit of the consistently below median schools was even close to the mean of the consistently above median scores. Overall, Figure 3 shows the very similar score dispersion patterns across the school groups, except for the aforementioned shared leadership scale.
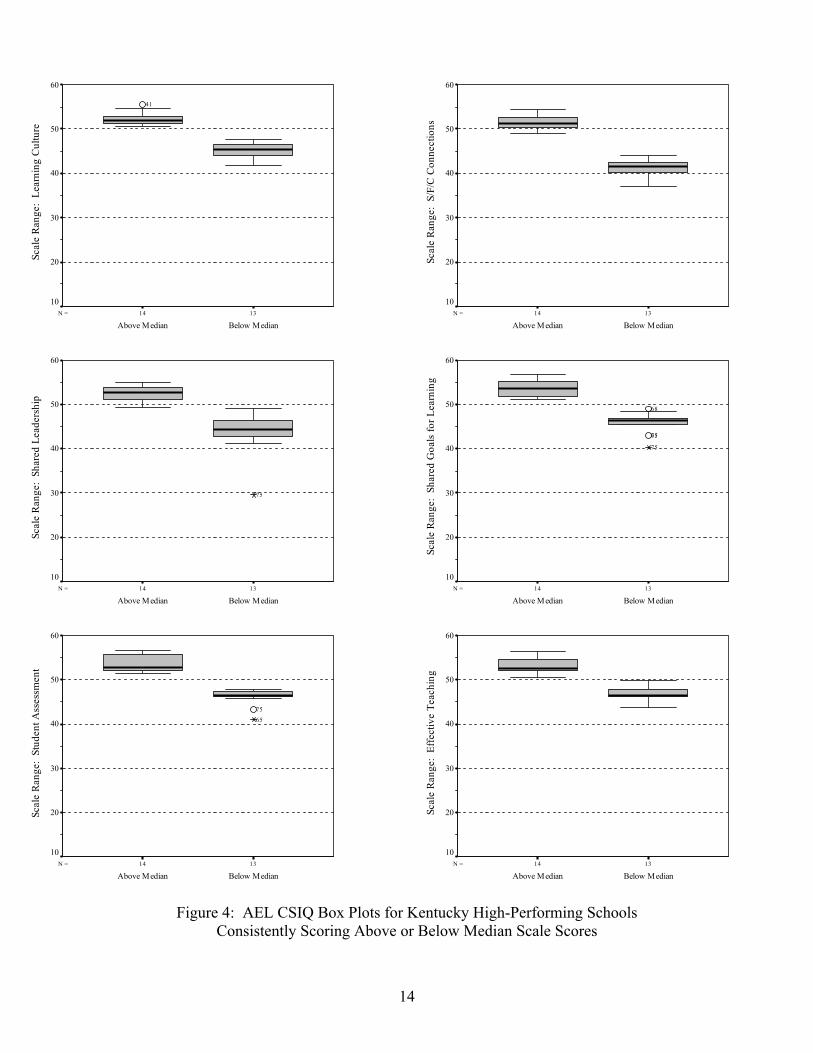
Figure 4 displays a box plot for the two groups of Kentucky schools for each of the six
scales. The tinted box represents the interquartile range in which 50% of the schools have values (the upper boundary of the box is the 75th percentile and the lower boundary of the box is the 25th percentile). The thick line inside the box denotes the 50th percentile or median. The horizontal lines (a.k.a., whiskers) above and below the box denote the largest and smallest values falling outside the box, but within 1.5 box lengths. Outlying school scores, between 1.5 and 3.0 box lengths from the upper or lower edges of the box, are noted with an “O” and school number. Schools with extreme scores, defined as being 3.0 or more box lengths from the upper or lower edge of the box, are called extreme values and are denoted with an asterisk and the school number. Figure 4 illustrates how all of the scale medians for both groups of schools were above 40 points on the 60-point scale and also, that there was little dispersion of scores on all scales.
11
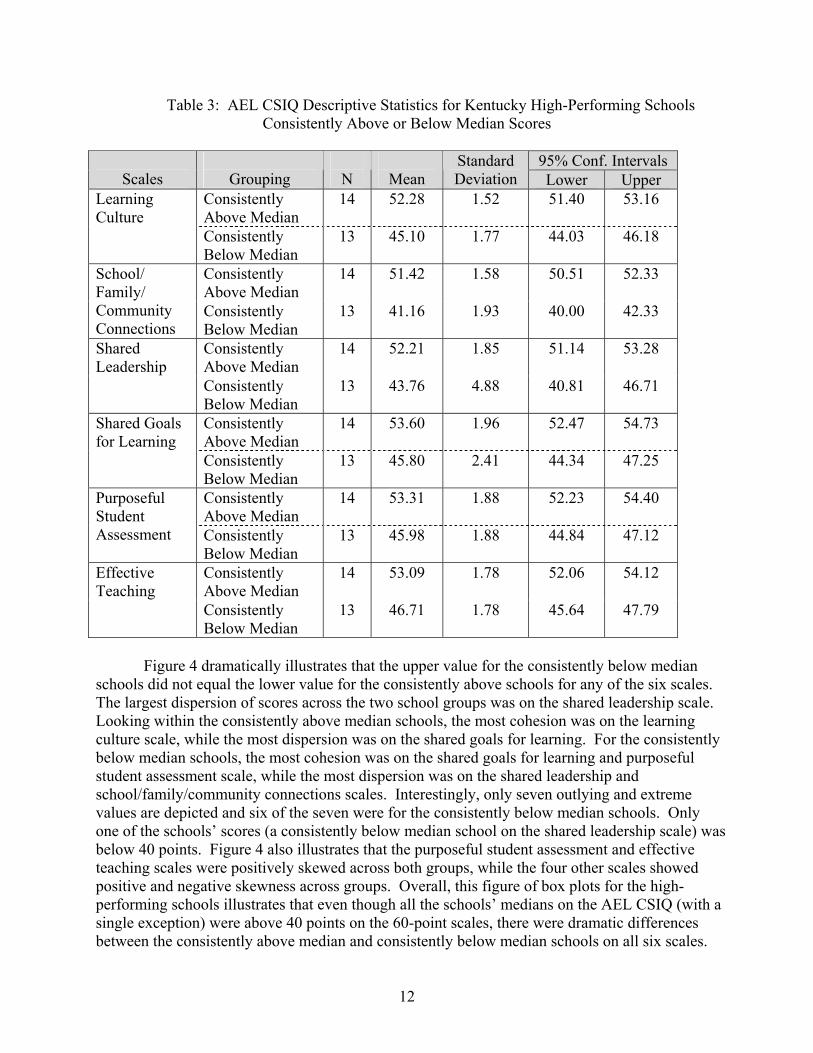
Table 3: AEL CSIQ Descriptive Statistics for Kentucky High-Performing Schools Consistently Above or Below Median Scores
95% Conf. Intervals
Scales
Grouping
N
Mean Standard Deviation Lower Upper
Consistently Above Median
14 52.28
1.52
51.40
53.16
Learning Culture Consistently
Below Median 13 45.10
1.77
44.03
46.18
Consistently Above Median
14 51.42
1.58
50.51
52.33
School/ Family/ Community Connections
Consistently Below Median
13 41.16
1.93
40.00
42.33
Consistently Above Median
14 52.21
1.85
51.14
53.28
Shared Leadership
Consistently Below Median
13 43.76
4.88
40.81
46.71
Consistently Above Median
14 53.60
1.96
52.47
54.73
Shared Goals for Learning
Consistently Below Median
13 45.80
2.41
44.34
47.25
Consistently Above Median
14 53.31
1.88
52.23
54.40
Purposeful Student Assessment Consistently
Below Median 13 45.98
1.88
44.84
47.12
Consistently Above Median
14 53.09
1.78
52.06
54.12
Effective Teaching
Consistently Below Median
13 46.71
1.78
45.64
47.79
Figure 4 dramatically illustrates that the upper value for the consistently below median
schools did not equal the lower value for the consistently above schools for any of the six scales. The largest dispersion of scores across the two school groups was on the shared leadership scale. Looking within the consistently above median schools, the most cohesion was on the learning culture scale, while the most dispersion was on the shared goals for learning. For the consistently below median schools, the most cohesion was on the shared goals for learning and purposeful student assessment scale, while the most dispersion was on the shared leadership and school/family/community connections scales. Interestingly, only seven outlying and extreme values are depicted and six of the seven were for the consistently below median schools. Only one of the schools’ scores (a consistently below median school on the shared leadership scale) was below 40 points. Figure 4 also illustrates that the purposeful student assessment and effective teaching scales were positively skewed across both groups, while the four other scales showed positive and negative skewness across groups. Overall, this figure of box plots for the high-performing schools illustrates that even though all the schools’ medians on the AEL CSIQ (with a single exception) were above 40 points on the 60-point scales, there were dramatic differences between the consistently above median and consistently below median schools on all six scales.
12
1314N =
Below MedianAbove Median
Mea
n +/
- 2 S
td. D
ev.:
Lea
rnin
g C
ultu
re60
50
40
30
20
101314N =
Below MedianAbove Median
Mea
n +/
- 2 S
td. D
ev.:
S/F
/C C
onne
ctio
ns
60
50
40
30
20
10
1314N =
Below MedianAbove Median
Mea
n +/
2 S
td. D
ev.:
Sha
red
Lead
ersh
ip
60
50
40
30
20
10
1314N =
Below MedianAbove Median
Mea
n +/
- 2 S
td. D
ev.:
Sha
red
Goa
ls fo
r Lea
rnin
g 60
50
40
30
20
10
1314N =
Below MedianAbove Median
Mea
n +/
- 2 S
td. D
ev.:
Stu
dent
Ass
essm
ent
60
50
40
30
20
10
1314N =
Below MedianAbove Median
Mea
n +/
- 2 S
td. D
ev.:
Eff
ectiv
e Te
achi
ng
60
50
40
30
20
10
Figure 3: AEL CSIQ Spread of Scale Scores for Kentucky High-Performing Schools
Consistently Above or Below the Median Scale Scores
13
1314N =
Below MedianAbove Median
Scal
e R
ange
: Le
arni
ng C
ultu
re
60
50
40
30
20
10
41
1314N =
Below MedianAbove Median
Scal
e R
ange
: S/
F/C
Con
nect
ions
60
50
40
30
20
10
1314N =
Below MedianAbove Median
Scal
e R
ange
: Sh
ared
Lea
ders
hip
60
50
40
30
20
10
75
1314N =
Below MedianAbove Median
Scal
e R
ange
: Sh
ared
Goa
ls fo
r Lea
rnin
g
60
50
40
30
20
10
6571
75
68
1314N =
Below MedianAbove Median
Scal
e R
ange
: St
uden
t Ass
essm
ent
60
50
40
30
20
10
75
65
1314N =
Below MedianAbove Median
Scal
e R
ange
: Ef
fect
ive
Teac
hing
60
50
40
30
20
10
Figure 4: AEL CSIQ Box Plots for Kentucky High-Performing Schools Consistently Scoring Above or Below Median Scale Scores
14
Cross-State Comparisons
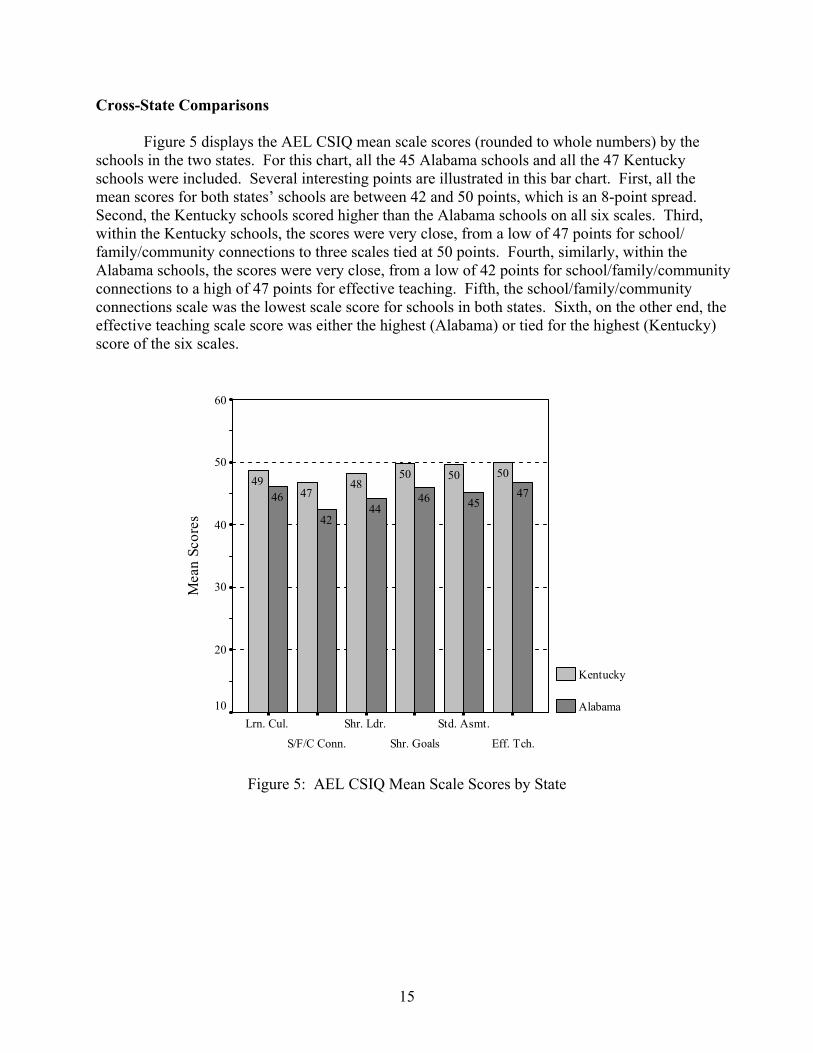
Figure 5 displays the AEL CSIQ mean scale scores (rounded to whole numbers) by the schools in the two states. For this chart, all the 45 Alabama schools and all the 47 Kentucky schools were included. Several interesting points are illustrated in this bar chart. First, all the mean scores for both states’ schools are between 42 and 50 points, which is an 8-point spread. Second, the Kentucky schools scored higher than the Alabama schools on all six scales. Third, within the Kentucky schools, the scores were very close, from a low of 47 points for school/ family/community connections to three scales tied at 50 points. Fourth, similarly, within the Alabama schools, the scores were very close, from a low of 42 points for school/family/community connections to a high of 47 points for effective teaching. Fifth, the school/family/community connections scale was the lowest scale score for schools in both states. Sixth, on the other end, the effective teaching scale score was either the highest (Alabama) or tied for the highest (Kentucky) score of the six scales.
Eff. Tch.
Std. Asmt.
Shr. Goals
Shr. Ldr.
S/F/C Conn.
Lrn. Cul.
Mea
n Sc
ores
60
50
40
30
20
10
Kentucky
Alabama
474546
4442
46
50505048
4749
Figure 5: AEL CSIQ Mean Scale Scores by State
15
CONCLUSIONS Before stating the conclusions from this study, a note about the schools in the study is required. While the lists of low-performing schools in Alabama and high-performing schools in Kentucky were prepared by staff in the respective state departments of education based on criteria that they developed, this is in no way implying that there only are schools of the type identified in each state. That is, because Alabama SDE staff happened to identify low-performing schools in the state for improvement purposes doesn’t mean that they don’t have any high-performing schools. Quite the contrary, Alabama has identified exemplary schools for other purposes. Similarly, because Kentucky SDE staff happened to identify high-performing schools in the state based on explicit criteria doesn’t mean that there are no low-performing schools in the state. In fact, Kentucky SDE staff have identified low-performing schools over the years and those schools have been offered various forms of incentives and assistance to improve. Keeping the above in mind, several important conclusions can be drawn from this study. Within a sample of schools identified as being low-performing from one state, the AEL CSIQ differentiated between the school professional staff’s level of commitment to continuous learning and improvement on the six scales of shared leadership, effective teaching, school/ family/community connections, purposeful student assessment, shared goals for learning, and learning culture. Similarly, within a sample of schools identified as being high-performing from another state, the AEL CSIQ differentiated between the professional staff’s level of commitment to continuous learning and improvement on the six scales of shared leadership, effective teaching, school/family/community connections, purposeful student assessment, shared goals for learning, and learning culture. Across both states, professional staff identified the area of school/family/community connections as being the area most in need of learning and improvement compared the other five areas measured by the AEL CSIQ. Even though the mean scores on the AEL CSIQ tend to be rather high on the 60-point scale and despite the rather narrow spread of scores across scales and samples of schools, nonetheless, the AEL CSIQ does differentiate professional staffs’ commitment to continuous learning and improvement within schools similarly classified in terms of their academic performance. The relative high scores on the scales of the AEL CSIQ may be a function of the self-report nature of the instrument and the fact that none of the 60 items are reverse-scored. Professional staff in schools identified as being high-performing on the basis of students’ academic performance always scored higher on the AEL CSIQ scales than the professional staff in schools identified as being low-performing on the basis of students’ academic performance. Therefore, we conclude that measuring a faculty’s commitment to continuous learning and improvement is one effective way to assess the reculturing of the school’s professional staff.
16
Finally, and most important in our opinion, assuming the key components of high-performing learning communities to be high levels of student achievement and professional staff’s commitment to continuous learning and improvement, this study showed that high-performing schools are not necessarily high-performing learning communities.
17
RECOMMENDATIONS
Based on the results and conclusions from this study, several recommendations can be made. This study involved schools identified as low performing in one state and high performing in another state with different criteria being used across the states. A reasonable recommendation would be to conduct a similar study but with both the low-performing schools and the high-performing schools being from the same state with common criteria/measures used for the identification process. Another recommendation would be to repeat this study with schools in other states. Of course, a much better design would be to combine this recommendation with the one noted above to yield a multiple-state, multiple-level school performance design. The schools in each state could be ordered from highest to lowest on the academic performance measures used to place them in their respective samples. Also, the faculty’s score on each AEL CSIQ scale could be used to place the schools in a rank order from highest to lowest. Then, rank order correlations could be computed for the academic index rank and the rank for each scale. This should be completed for each state separately because the samples were drawn using different criteria. Fourteen of the 47 high-performing schools in Kentucky scored above the median score on all six AEL CSIQ scales. Clearly these 14 schools are candidates for being labeled high-performing learning communities. However, simply being above the median may not be enough for schools to receive such a label. The recommendation here is for AEL researchers to compare scores from these 14 schools with the scores of other schools previously identified as high-performing learning communities using the same instrument. After a standard has been established from the comparisons, then some of these 14 schools may be labeled high-performing learning communities and have empirical reasons for such. The Alabama schools all were identified as being low-performing at one time and then received various forms of school improvement assistance, including their principals participating in a year-long leadership training experience. One recommendation would be to re-administer the AEL CSIQ in those same schools to determine if there were any shifts in the faculty’s commitment to continuous learning and improvement over time. The Kentucky schools in this study were evenly split in terms of their students’ performance based on special subgroups. That is, all the schools were identified as being high-performing, but half had minimum achievement gaps by minority and disadvantaged subgroups of students while the other half had large achievement gaps. These minimum and large achievement gap differences were suppressed in this study. A recommendation is to conduct a study of the differences on professional staff’s commitment to continuous learning and improvement, as measured by the AEL CSIQ, between the minimum and large achievement gap Kentucky schools.
18
Similar to the above, the levels of the schools (elementary, middle, and high) were known but not studied in this effort. It is recommended that a study of the differences in the high-performing schools by building levels be conducted. Too, the interactions of building level and achievement gap difference could be investigated. Last, little is known about a high-performing school faculty’s commitment to continuous learning and improvement over time. Use of the AEL CSIQ to date has been to capture “snapshots” of faculties (although, the longitudinal assessment of faculties with the AEL CSIQ is underway in Tennessee). This recommendation calls for a re-administration of the AEL CSIQ to the staff in the schools in Kentucky.
19
20
REFERENCES
Bandura, A. (1982). Self-efficacy mechanism in human agency. American Psychologist, 37, 122-147.
Elmore, R. (1995). Structural reform in educational practice. Educational Researcher, 24(9),
23-26. Fullan, M. G. (1996). Turning systematic thinking on its head. Phi Delta Kappan, 77(6), 420-
423. Hargreaves, A. (1994). Changing teachers, changing times. London: Cassell. Joyce, B. R. (1991). The doors to school improvement. Educational Leadership, 14(3), 10-12. Meehan, M. L., Cowley, K. S., Wiersma, W., Orletsky, S. R., Sattes, B. D., & Walsh, J. A. (July
2002). Development and testing of an instrument measuring a school faculty’s commitment to continuous learning and improvement. Paper presented at the 11th annual CREATE national evaluation institute, Boise, ID.
Meehan, M. L., Wiersma, W., Cowley, K. S., Craig, J. R., Orletsky, S. R., & Childers, R. D.
(July 2002). School faculty as a high-performing learning community: Normative data from 132 schools. Paper presented at the 11th annual CREATE national evaluation institute, Boise, ID.
Miskel, C., McDonald, D., & Bloom, S. (1983). Structural and expectancy linkages within
schools and administrative effectiveness. Educational Administration Quarterly, 19(1), 49-82.
National Commission on Excellence in Education. (1983). A nation at risk: The imperative for
educational reform. Washington, DC: U.S. Department of Education, U.S. Government Printing Office.