a statistical approach for x-ray image measurements
TRANSCRIPT
8/17/2019 A Statistical Approach for X-Ray image measurements
http://slidepdf.com/reader/full/a-statistical-approach-for-x-ray-image-measurements 1/8
8/17/2019 A Statistical Approach for X-Ray image measurements
http://slidepdf.com/reader/full/a-statistical-approach-for-x-ray-image-measurements 2/8
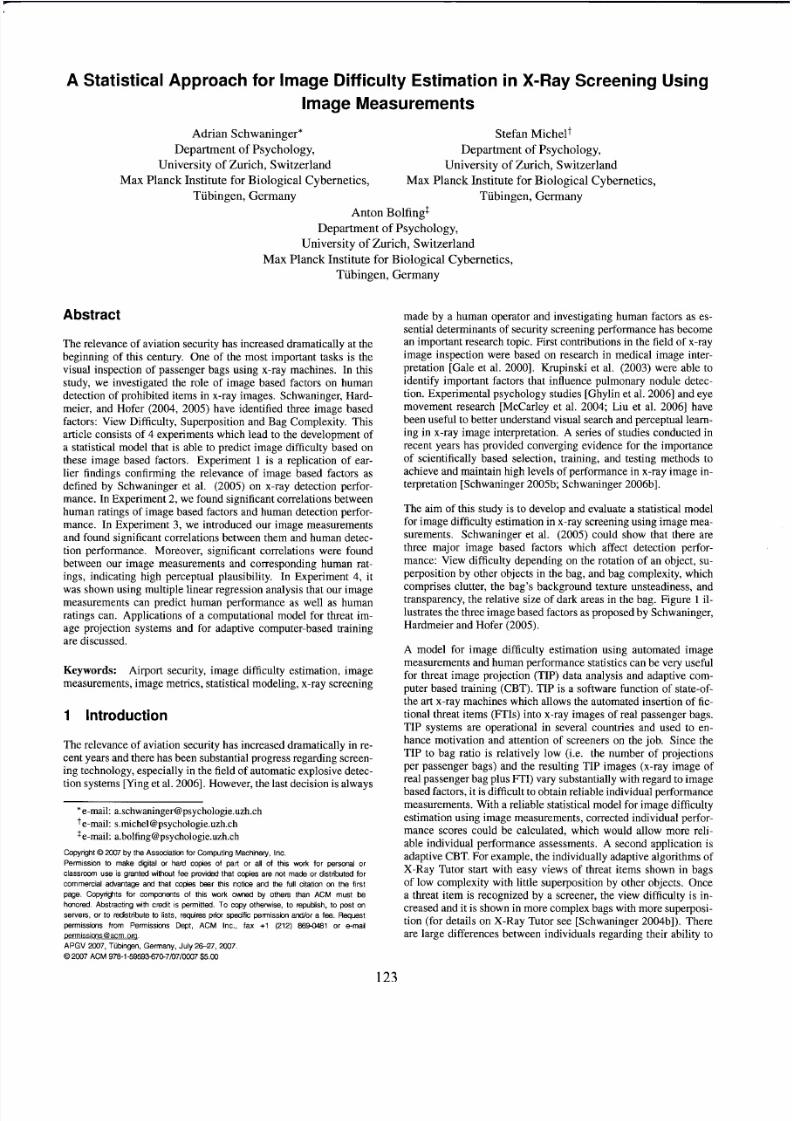
Figure 1: Illustration of the three major image based factors sug-gested by Schwaninger, Hardmeier and Hofer (2005).
cope with image-based factors (Schwaninger et al., 2005). There-fore, a good model for image difficulty estimation using automatedimage measurements of image-based factors could be very usefulfor enhancing such individually adaptive training algorithms.
The study is sectioned into four experiments. The first experimentis a replication of earlier findings [Schwaninger et al. 2005a] to con-firm the relevance and relative independence of image based factorsin predicting human performance. The second experiment aims
to estimate the subjective perceptual plausibility of the underlyingimage based factors by correlating them with the average hit rate( p(hit)), i.e. percent detection per image averaged across partici-pants. Threat images were rated for view difficulty, superposition,clutter, transparency and general difficulty. Images of harmlessbags were rated for clutter, transparency, and general difficulty. Thecorrelation between these ratings and human detection performancereflects the relative importance of each image based factor. We thendeveloped statistical formulae and automated image measurementsfor the above mentioned image based factors. Experiment 3 wasdesigned to estimate the perceptual plausibility of these computergenerated estimates. We correlated the computer-based estimateswith the corresponding human ratings to determine whether ourcomputer-based algorithms correspond with human perception. Fi-nally, in Experiment 4 we compared a model using computer-basedestimates to a model based on human ratings of the image basedfactors.
2 Experiment 1
2.1 Method
Experiment 1 is a replication of the study by Schwaninger et al.(2005), who identified image based factors for threat item detectionin x-ray image screening. Two important differences need to bementioned. In view of possible applications in TIP systems, we are
mainly interested in predicting the percentage of correct responsesto images containing a threat item. Therefore, we use the hit rateinstead of d as the variable to be predicted. In our previous stud-ies, we used the signal detection measure d = z (H ) − z (F A)whereas z (H ) refers to the z-transformed hit rate and z (F A) to thez-transformed false alarm rate [Green and Swets 1966]. Secondly,only novices and no experts are tested because we want to examineimage based factors independent of expertise.
2.1.1 Participants
Twelve undergraduate students in psychology from the Universityof Zurich participated in this experiment (5 females). None of themhas had any previous experience with visual inspection of x-ray im-ages.
2.1.2 Materials
The X-Ray Object Recognition Test (X-Ray ORT) wasused to mea-sure detection performance. This test has been designed to analyzethe influence of image based effects view difficulty, superpositionand bag complexity on human detection performance when visu-ally inspecting x-ray images of passenger bags. Inspired by signaldetection theory [Green and Swets 1966], the X-Ray ORT consists
of two sets of 128 x-ray images. One set contains harmless bagswithout a threat item (N-trials, for noise). The other set containsthe same bags, each of them with a threat (SN-trials, for signal-plus-noise). Only guns and knives of typical familiar shapes areused. This is important because the X-Ray ORT is designed tomeasure cognitive visual abilities to cope with effects of viewpoint,superposition, and bag complexity independent of specific visualknowledge about threat objects. The X-Ray ORT consists of 256items (x-ray images) given by the following test design: 16 threatitem exemplars (8 guns, 8 knives) x 2 view difficulty levels x 2 bagcomplexity levels x 2 superposition levels x 2 trial types (SN andN-trials). The construction of the items in all image based factorcombinations as shown above was lead by visual plausibility crite-ria. After choosing two sets of x-ray images of harmless bags withdifferent parameter values in bag complexity, the sixteen fictionalthreat items were projected into the bags in two different view diffi-
culties at two locations with different superposition each. The termfictional threat items (FTIs) is commonly used in connection withTIP systems as discussed in the introduction. For further detailson the X-Ray ORT see [Hardmeier et al. 2005; Schwaninger et al.2005a]. Stimuli were displayed on 17” TFT screens at a distanceof about 100cm, so that the x-ray images subtended approximately10-12 degrees of visual angle. The computer program measuredoutcome (hit, miss, false alarm, correct rejection) and the responsetimes from image onset to final decision button press.
2.1.3 Procedure
X-ray images of passenger bags were shown for a maximum dis-play duration of 4 seconds. Note that at airport security controls thehuman operators (screeners) usually have only 3-6 seconds to in-
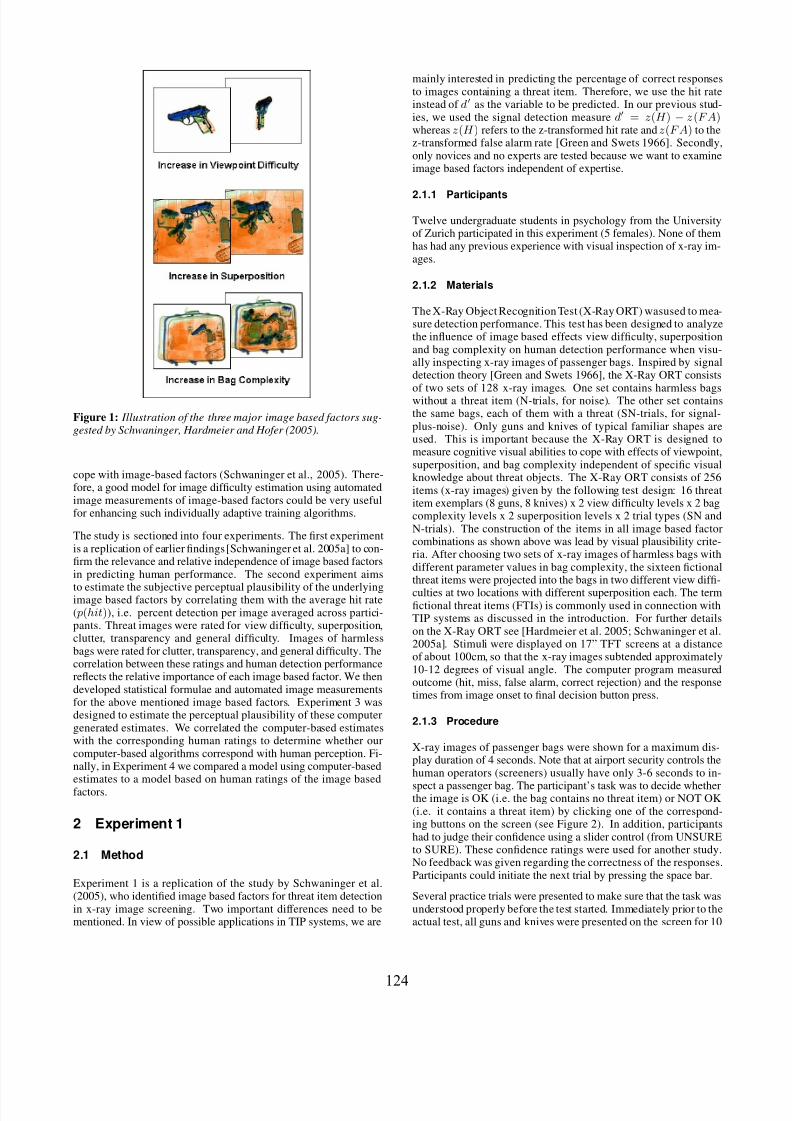
spect a passenger bag. The participant’s task was to decide whetherthe image is OK (i.e. the bag contains no threat item) or NOT OK(i.e. it contains a threat item) by clicking one of the correspond-ing buttons on the screen (see Figure 2). In addition, participantshad to judge their confidence using a slider control (from UNSUREto SURE). These confidence ratings were used for another study.No feedback was given regarding the correctness of the responses.Participants could initiate the next trial by pressing the space bar.
Several practice trials were presented to make sure that the task wasunderstood properly before the test started. Immediately prior to theactual test, all guns and knives were presented on the screen for 10
124
8/17/2019 A Statistical Approach for X-Ray image measurements
http://slidepdf.com/reader/full/a-statistical-approach-for-x-ray-image-measurements 3/8
Figure 2: Screenshot of an X-Ray ORT trial showing an x-ray im-age of a passenger bag containing a gun. Response buttons and slider control are aligned at the bottom of the screen.
seconds, respectively. This was done to minimize any effects of threat item knowledge. Half of the items were shown in easy viewand the other half in difficult view.
2.2 Results
2.2.1 Descriptive Results
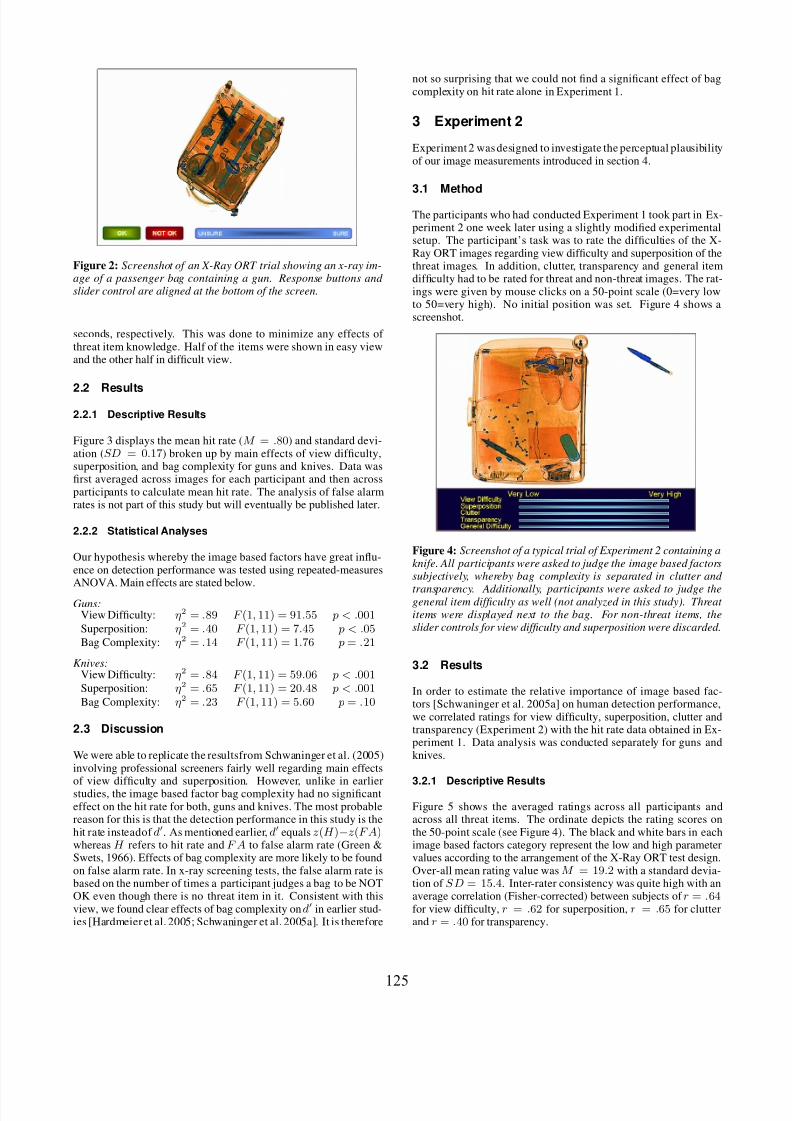
Figure 3 displays the mean hit rate (M = .80) and standard devi-ation (SD = 0.17) broken up by main effects of view difficulty,superposition, and bag complexity for guns and knives. Data wasfirst averaged across images for each participant and then acrossparticipants to calculate mean hit rate. The analysis of false alarmrates is not part of this study but will eventually be published later.
2.2.2 Statistical Analyses
Our hypothesis whereby the image based factors have great influ-ence on detection performance was tested using repeated-measuresANOVA. Main effects are stated below.
Guns:View Difficulty: η2 = .89 F (1, 11) = 91.55 p < .001Superposition: η2 = .40 F (1, 11) = 7.45 p < .05Bag Complexity: η2 = .14 F (1, 11) = 1.76 p = .21
Knives:View Difficulty: η2 = .84 F (1, 11) = 59.06 p < .001Superposition: η2 = .65 F (1, 11) = 20.48 p < .001Bag Complexity: η2 = .23 F (1, 11) = 5.60 p = .10
2.3 Discussion
We were able to replicate the resultsfrom Schwaninger et al. (2005)involving professional screeners fairly well regarding main effects
of view difficulty and superposition. However, unlike in earlierstudies, the image based factor bag complexity had no significanteffect on the hit rate for both, guns and knives. The most probablereason for this is that the detection performance in this study is thehit rate insteadof d. As mentioned earlier, d equals z (H )−z (F A)whereas H refers to hit rate and F A to false alarm rate (Green &Swets, 1966). Effects of bag complexity are more likely to be foundon false alarm rate. In x-ray screening tests, the false alarm rate isbased on the number of times a participant judges a bag to be NOTOK even though there is no threat item in it. Consistent with thisview, we found clear effects of bag complexity on d in earlier stud-ies [Hardmeier et al. 2005; Schwaninger et al. 2005a]. It is therefore
not so surprising that we could not find a significant effect of bagcomplexity on hit rate alone in Experiment 1.
3 Experiment 2
Experiment 2 was designed to investigate the perceptual plausibilityof our image measurements introduced in section 4.
3.1 Method
The participants who had conducted Experiment 1 took part in Ex-periment 2 one week later using a slightly modified experimentalsetup. The participant’s task was to rate the difficulties of the X-Ray ORT images regarding view difficulty and superposition of thethreat images. In addition, clutter, transparency and general itemdifficulty had to be rated for threat and non-threat images. The rat-ings were given by mouse clicks on a 50-point scale (0=very lowto 50=very high). No initial position was set. Figure 4 shows ascreenshot.
Figure 4: Screenshot of a typical trial of Experiment 2 containing a
knife. All participants were asked to judge the image based factorssubjectively, whereby bag complexity is separated in clutter and
transparency. Additionally, participants were asked to judge thegeneral item difficulty as well (not analyzed in this study). Threat items were displayed next to the bag. For non-threat items, theslider controls for view difficulty and superposition were discarded.
3.2 Results
In order to estimate the relative importance of image based fac-tors [Schwaninger et al. 2005a] on human detection performance,we correlated ratings for view difficulty, superposition, clutter andtransparency (Experiment 2) with the hit rate data obtained in Ex-periment 1. Data analysis was conducted separately for guns andknives.
3.2.1 Descriptive Results
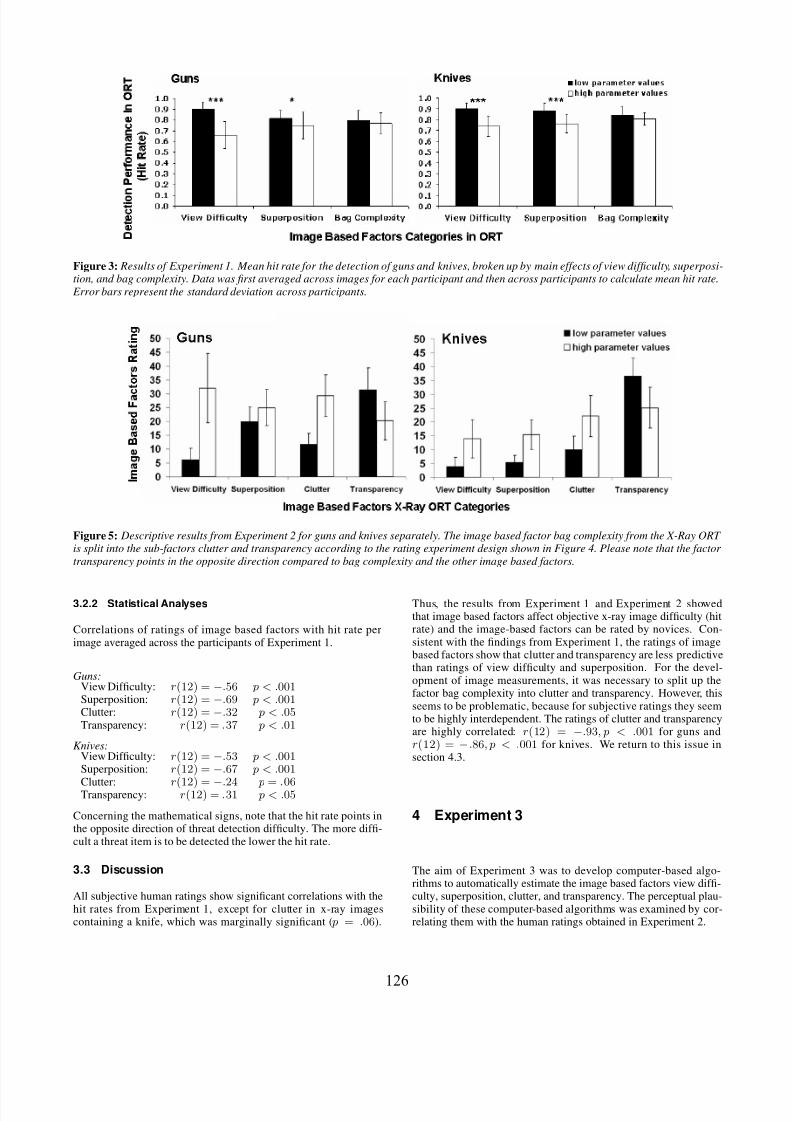
Figure 5 shows the averaged ratings across all participants andacross all threat items. The ordinate depicts the rating scores onthe 50-point scale (see Figure 4). The black and white bars in eachimage based factors category represent the low and high parametervalues according to the arrangement of the X-Ray ORT test design.Over-all mean rating value was M = 19.2 with a standard devia-tion of S D = 15.4. Inter-rater consistency was quite high with anaverage correlation (Fisher-corrected) between subjects of r = .64for view difficulty, r = .62 for superposition, r = .65 for clutterand r = .40 for transparency.
125
8/17/2019 A Statistical Approach for X-Ray image measurements
http://slidepdf.com/reader/full/a-statistical-approach-for-x-ray-image-measurements 4/8
Figure 3: Results of Experiment 1. Mean hit rate for the detection of guns and knives, broken up by main effects of view difficulty, superposi-tion, and bag complexity. Data was first averaged across images for each participant and then across participants to calculate mean hit rate.
Error bars represent the standard deviation across participants.
Figure 5: Descriptive results from Experiment 2 for guns and knives separately. The image based factor bag complexity from the X-Ray ORT is split into the sub-factors clutter and transparency according to the rating experiment design shown in Figure 4. Please note that the factor
transparency points in the opposite direction compared to bag complexity and the other image based factors.
3.2.2 Statistical Analyses
Correlations of ratings of image based factors with hit rate perimage averaged across the participants of Experiment 1.
Guns:View Difficulty: r(12) = −.56 p < .001Superposition: r(12) = −.69 p < .001Clutter: r(12) = −.32 p < .05Transparency: r(12) = .37 p < .01
Knives:View Difficulty: r(12) = −.53 p < .001Superposition: r(12) = −.67 p < .001
Clutter: r(12) = −.24 p = .06Transparency: r(12) = .31 p < .05
Concerning the mathematical signs, note that the hit rate points inthe opposite direction of threat detection difficulty. The more diffi-cult a threat item is to be detected the lower the hit rate.
3.3 Discussion
All subjective human ratings show significant correlations with thehit rates from Experiment 1, except for clutter in x-ray imagescontaining a knife, which was marginally significant ( p = .06).
Thus, the results from Experiment 1 and Experiment 2 showedthat image based factors affect objective x-ray image difficulty (hitrate) and the image-based factors can be rated by novices. Con-sistent with the findings from Experiment 1, the ratings of imagebased factors show that clutter and transparency are less predictivethan ratings of view difficulty and superposition. For the devel-opment of image measurements, it was necessary to split up thefactor bag complexity into clutter and transparency. However, thisseems to be problematic, because for subjective ratings they seemto be highly interdependent. The ratings of clutter and transparencyare highly correlated: r(12) = −.93, p < .001 for guns andr(12) = −.86, p < .001 for knives. We return to this issue insection 4.3.
4 Experiment 3
The aim of Experiment 3 was to develop computer-based algo-rithms to automatically estimate the image based factors view diffi-culty, superposition, clutter, and transparency. The perceptual plau-sibility of these computer-based algorithms was examined by cor-relating them with the human ratings obtained in Experiment 2.
126
8/17/2019 A Statistical Approach for X-Ray image measurements
http://slidepdf.com/reader/full/a-statistical-approach-for-x-ray-image-measurements 5/8
4.1 Method
All image measurements developed for this purpose are based ontheoretical considerations. Different algorithm parameters were op-timized by maximizing the correlations between the image-basedfactors estimates and detection performance measures derived fromearlier X-Ray ORT findings from x-ray screening experts.
4.1.1 Statistical estimates and image measurements for im-
age based factors
View Difficulty
Even with the aid of 3D volumetric models, it is not (yet) possi-ble to satisfyingly determine the degree of a 3-dimensional rotation(view difficulty) of a physical threat item automatically from its2-dimensional x-ray image [Mahfouz et al. 2005]. Additional dif-ficulties regarding image segmentation arise from the very hetero-geneous backgrounds of x-ray images, compare [Sluser and Paran-
jape 1999]. Therefore, this image based factor is not (yet) beingcalculated by image processing, but statistically from X-Ray ORTdetection performance data obtained in Experiment 1.
V Dj =
4
i=1
HitRi − HitRj
3 (1)
Equation 1 shows the calculation of the image based factor viewdifficulty, whereas i is the summation index ranging from 1 to 4 (2bag complexities x 2 superpositions), j denotes the index numberof the x-ray image in question (one threat exemplar in one of thetwo views), HitRj is its average hit rate across all participants and’4’ is the number of the bags each FTI was projected into. In orderto avoid a circular argument in the statistical model (multiple linearregression, see Experiment 4) by partial inclusion of the criterionvariable into a predictor, the hit rate of the one item in question isexcluded from this estimate.
It is important to understand that this concept of view difficultyis not just reflecting the degree of rotation of an object. In that
case there would be two parameter values for all threat exemplarsonly. View difficulty as it is conceptualized here reflectsinnate viewdifficulty attributes unique to each exemplar view separately.
Superposition
This image based factor refers to how much the pixel intensities atthe location of the FTI in the threat bag image differ from the pixelintensities at the same location in the same bag without the FTI.Equation 2 shows the image measurement formula for superposi-tion. I SN (x, y) denotes the pixel intensities of a threat image andI N (x, y) denotes the pixel intensities of the corresponding harm-less bag.
SP =
x,y I SN (x, y) − I N (x, y)
2
(2)
It should be noted that this mathematical definition of superpositionis dependent on the size of the threat item in the bag. For furtherdevelopment of the computational model it is conceivable to splitup superposition and the size of the threat item into two separateimage based factors. Measurement of superposition would requirehaving both the bag with the FTI and without. For both applicationsmentioned in the introduction, this is possible with current TIP andCBT technology. In TIP, the FTI, its location, the bag with andwithout the FTI are recorded. In several CBT systems, the sameinformation is recorded and stored, too.
Clutter
This image based factor is designed to express bag item propertieslike its textural unsteadiness, disarrangement, chaos or just clutter.In terms of the bag images presented, this factor is closely related tothe amount of items in the bag as well as to their structures in termsof complexity and fineness. The method used in this study is basedon the assumption, that such texture unsteadiness can be describedmathematically in terms of the amount of high frequency regions.
CL =x,y
I hp(x, y) (3)
where I hp(x, y) = I N ∗ F −1(hp(f x, f y))
Equation 3 shows the image measurement formula for clutter. Itrepresents a convolution of the empty bag image (N for noise) withthe convolution kernel derived from a high-pass filter in the Fourierspace. I N denotes the pixel intensities of the harmless bag image.F −1 denotes the inverse Fourier transformation. hp(f x, f y) repre-sents a high-pass filter in the Fourier space (see Appendix).
Transparency
The image based factor transparency reflects the extent to which
x-rays are able to penetrate objects in a bag. This depends on thespecific material density of these objects. These attributes are rep-resented in x-ray images as different degrees of luminosity. Heavymetallic materials such as lead are known to be very hard to be pen-etrated by x-rays and therefore appear as dark areas on the x-rayimages.
T R =
x,y(I N (x, y) < threshold)
x,y(I N (x, y) < 255) (4)
Equation 4 shows the image measurement formula for trans-parency. I N (x, y) denotes the pixel intensities of the harmless bag.threshold is the pixel intensity threshold beneath which the pixelsare counted. The implementation of the image measurement for the
image based factor transparency is simply achieved by counting thenumber of pixels being darker than a certain threshold (e.g. < 65)relative to the bag’s overall size ( < 255, non-white pixels).
4.2 Results
To examine perceptual plausibility of the computer-based measure-ments, we correlated them with the corresponding averaged ratingsfrom Experiment 2.
4.2.1 Statistical Analyses
Pearson’s product-moment correlations between the calculatedmeasurements and the corresponding human ratings’ mean valueswere applied for each image based factor dimension separately.
Guns:View Difficulty: r(12) = −.62 p < .001Superposition: r(12) = −.54 p < .001Clutter: r(12) = .16 p = .20Transparency: r(12) = −.69 p < .001
Knives:View Difficulty: r(12) = −.47 p < .001Superposition: r(12) = −.44 p < .001Clutter: r(12) = .18 p = .16Transparency: r(12) = −.63 p < .001
127
8/17/2019 A Statistical Approach for X-Ray image measurements
http://slidepdf.com/reader/full/a-statistical-approach-for-x-ray-image-measurements 6/8
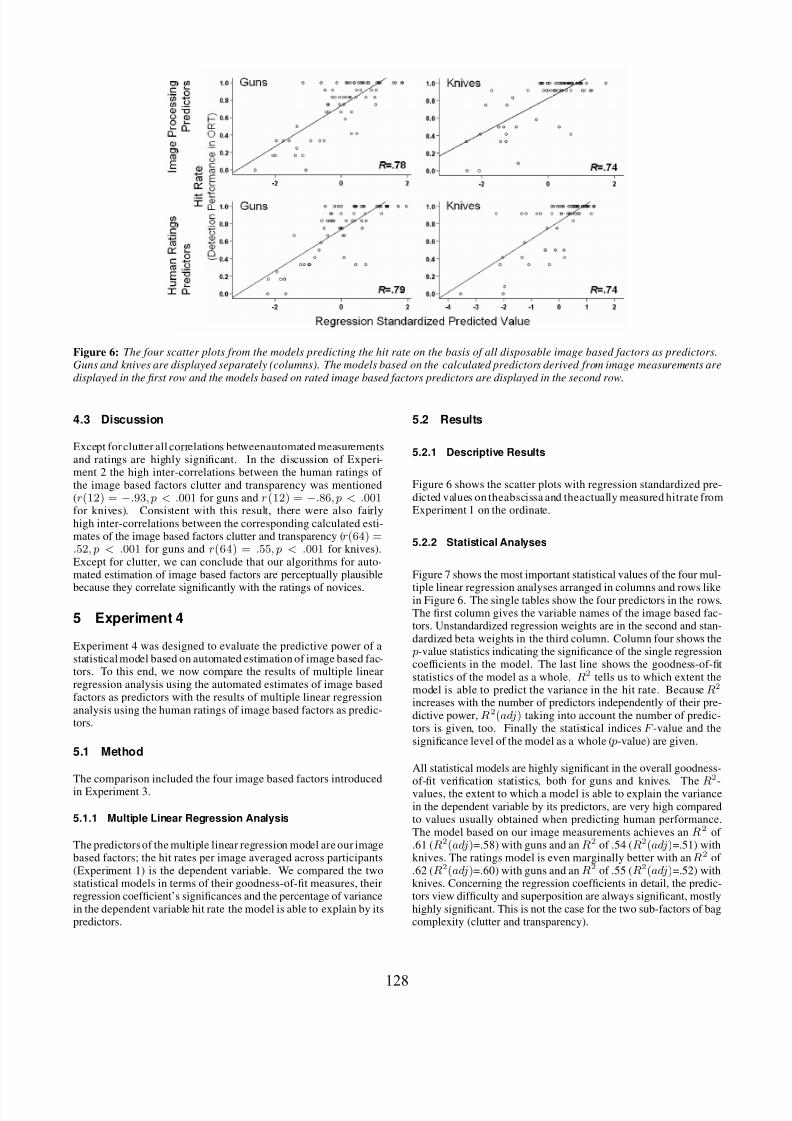
Figure 6: The four scatter plots from the models predicting the hit rate on the basis of all disposable image based factors as predictors.Guns and knives are displayed separately (columns). The models based on the calculated predictors derived from image measurements are
displayed in the first row and the models based on rated image based factors predictors are displayed in the second row.
4.3 Discussion
Except for clutter all correlations betweenautomated measurementsand ratings are highly significant. In the discussion of Experi-ment 2 the high inter-correlations between the human ratings of the image based factors clutter and transparency was mentioned(r(12) = −.93, p < .001 for guns and r(12) = −.86, p < .001for knives). Consistent with this result, there were also fairlyhigh inter-correlations between the corresponding calculated esti-mates of the image based factors clutter and transparency (r(64) =.52, p < .001 for guns and r(64) = .55, p < .001 for knives).Except for clutter, we can conclude that our algorithms for auto-mated estimation of image based factors are perceptually plausible
because they correlate significantly with the ratings of novices.
5 Experiment 4
Experiment 4 was designed to evaluate the predictive power of astatistical model based on automated estimation of image based fac-tors. To this end, we now compare the results of multiple linearregression analysis using the automated estimates of image basedfactors as predictors with the results of multiple linear regressionanalysis using the human ratings of image based factors as predic-tors.
5.1 Method
The comparison included the four image based factors introducedin Experiment 3.
5.1.1 Multiple Linear Regression Analysis
The predictors of the multiple linear regression model are our imagebased factors; the hit rates per image averaged across participants(Experiment 1) is the dependent variable. We compared the twostatistical models in terms of their goodness-of-fit measures, theirregression coefficient’s significances and the percentage of variancein the dependent variable hit rate the model is able to explain by itspredictors.
5.2 Results
5.2.1 Descriptive Results
Figure 6 shows the scatter plots with regression standardized pre-dicted values on theabscissa and theactually measured hitrate fromExperiment 1 on the ordinate.
5.2.2 Statistical Analyses
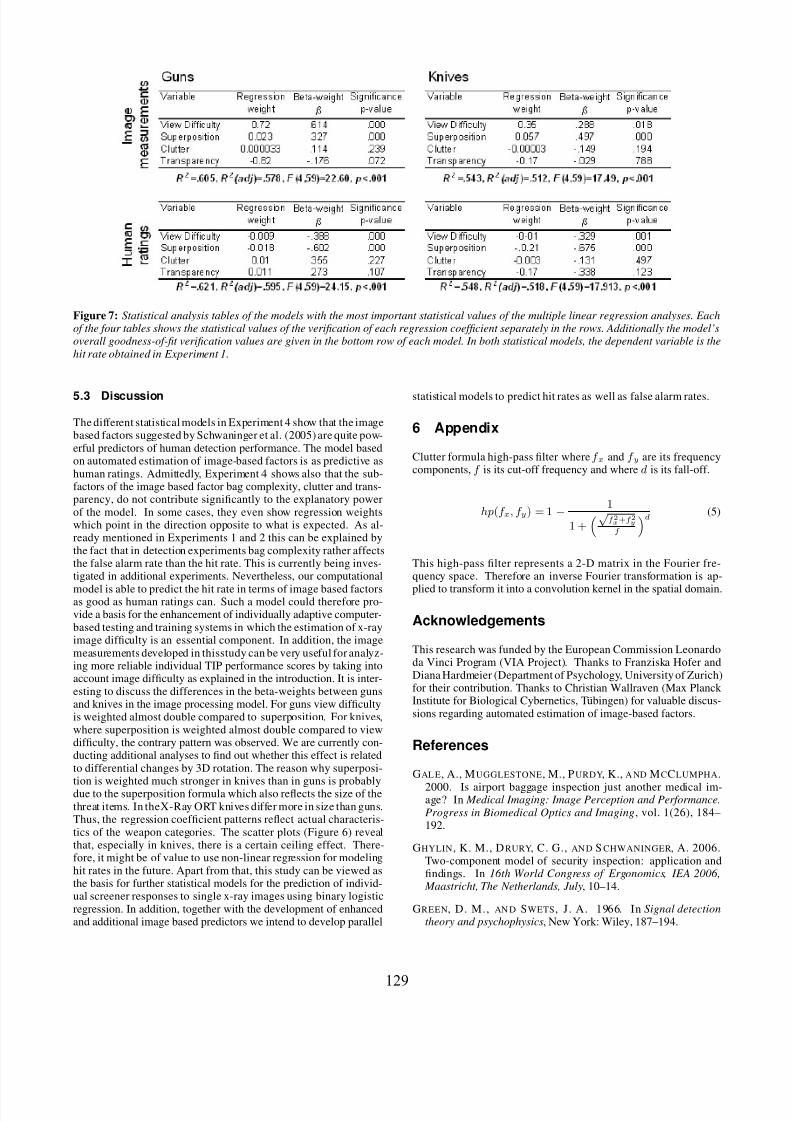
Figure 7 shows the most important statistical values of the four mul-
tiple linear regression analyses arranged in columns and rows likein Figure 6. The single tables show the four predictors in the rows.The first column gives the variable names of the image based fac-tors. Unstandardized regression weights are in the second and stan-dardized beta weights in the third column. Column four shows the p-value statistics indicating the significance of the single regressioncoefficients in the model. The last line shows the goodness-of-fitstatistics of the model as a whole. R2 tells us to which extent themodel is able to predict the variance in the hit rate. Because R2
increases with the number of predictors independently of their pre-dictive power, R2(adj) taking into account the number of predic-tors is given, too. Finally the statistical indices F -value and thesignificance level of the model as a whole ( p-value) are given.
All statistical models are highly significant in the overall goodness-
of-fit verification statistics, both for guns and knives. The R
2
-values, the extent to which a model is able to explain the variancein the dependent variable by its predictors, are very high comparedto values usually obtained when predicting human performance.The model based on our image measurements achieves an R2 of .61 (R2(adj)=.58) with guns and an R2 of .54 (R2(adj)=.51) withknives. The ratings model is even marginally better with an R2 of .62 (R2(adj)=.60) with guns and an R2 of .55 (R2(adj)=.52) withknives. Concerning the regression coefficients in detail, the predic-tors view difficulty and superposition are always significant, mostlyhighly significant. This is not the case for the two sub-factors of bagcomplexity (clutter and transparency).
128
8/17/2019 A Statistical Approach for X-Ray image measurements
http://slidepdf.com/reader/full/a-statistical-approach-for-x-ray-image-measurements 7/8
Figure 7: Statistical analysis tables of the models with the most important statistical values of the multiple linear regression analyses. Eachof the four tables shows the statistical values of the verification of each regression coefficient separately in the rows. Additionally the model’soverall goodness-of-fit verification values are given in the bottom row of each model. In both statistical models, the dependent variable is the
hit rate obtained in Experiment 1.
5.3 Discussion
The different statistical models in Experiment 4 show that the imagebased factors suggested by Schwaninger et al. (2005) are quite pow-erful predictors of human detection performance. The model basedon automated estimation of image-based factors is as predictive ashuman ratings. Admittedly, Experiment 4 shows also that the sub-factors of the image based factor bag complexity, clutter and trans-parency, do not contribute significantly to the explanatory powerof the model. In some cases, they even show regression weightswhich point in the direction opposite to what is expected. As al-ready mentioned in Experiments 1 and 2 this can be explained bythe fact that in detection experiments bag complexity rather affectsthe false alarm rate than the hit rate. This is currently being inves-tigated in additional experiments. Nevertheless, our computational
model is able to predict the hit rate in terms of image based factorsas good as human ratings can. Such a model could therefore pro-vide a basis for the enhancement of individually adaptive computer-based testing and training systems in which the estimation of x-rayimage difficulty is an essential component. In addition, the imagemeasurements developed in thisstudy can be very useful for analyz-ing more reliable individual TIP performance scores by taking intoaccount image difficulty as explained in the introduction. It is inter-esting to discuss the differences in the beta-weights between gunsand knives in the image processing model. For guns view difficultyis weighted almost double compared to superposition. For knives,where superposition is weighted almost double compared to viewdifficulty, the contrary pattern was observed. We are currently con-ducting additional analyses to find out whether this effect is relatedto differential changes by 3D rotation. The reason why superposi-
tion is weighted much stronger in knives than in guns is probablydue to the superposition formula which also reflects the size of thethreat items. In theX-Ray ORT knives differ more in size than guns.Thus, the regression coefficient patterns reflect actual characteris-tics of the weapon categories. The scatter plots (Figure 6) revealthat, especially in knives, there is a certain ceiling effect. There-fore, it might be of value to use non-linear regression for modelinghit rates in the future. Apart from that, this study can be viewed asthe basis for further statistical models for the prediction of individ-ual screener responses to single x-ray images using binary logisticregression. In addition, together with the development of enhancedand additional image based predictors we intend to develop parallel
statistical models to predict hit rates as well as false alarm rates.
6 Appendix
Clutter formula high-pass filter where f x and f y are its frequencycomponents, f is its cut-off frequency and where d is its fall-off.
hp(f x, f y) = 1 − 1
1 +√
f 2x+f 2
y
f
d (5)
This high-pass filter represents a 2-D matrix in the Fourier fre-quency space. Therefore an inverse Fourier transformation is ap-
plied to transform it into a convolution kernel in the spatial domain.
Acknowledgements
This research was funded by the European Commission Leonardoda Vinci Program (VIA Project). Thanks to Franziska Hofer andDiana Hardmeier (Department of Psychology, University of Zurich)for their contribution. Thanks to Christian Wallraven (Max Planck Institute for Biological Cybernetics, Tubingen) for valuable discus-sions regarding automated estimation of image-based factors.
References
GAL E, A., MUGGLESTONE , M., PURDY, K., A ND MCCLUMPHA.
2000. Is airport baggage inspection just another medical im-age? In Medical Imaging: Image Perception and Performance.
Progress in Biomedical Optics and Imaging, vol. 1(26), 184–192.
GHYLIN, K. M., DRURY, C. G., AN D S CHWANINGER, A. 2006.Two-component model of security inspection: application andfindings. In 16th World Congress of Ergonomics, IEA 2006,
Maastricht, The Netherlands, July, 10–14.
GREEN, D. M., AN D SWETS, J. A. 1966. In Signal detectiontheory and psychophysics, New York: Wiley, 187–194.
129
8/17/2019 A Statistical Approach for X-Ray image measurements
http://slidepdf.com/reader/full/a-statistical-approach-for-x-ray-image-measurements 8/8
HARDMEIER, D., HOFER, F., A ND SCHWANINGER, A. 2005. Theobject recognition test ort - a reliable tool for measuring visualabilities needed in x-ray screening. In IEEE ICCST Proceedings,vol. 39, 189–192.
KRUPINSKI, E . A . , B ERGER, W . G . , DALLAS, W. J ., AN D
ROEHRIG, H. 2003. Searching for nodules: What features at-tract attention and influence detection? In Academic Radiology,vol. 10(8), 861–868.
LIU , X., GAL E, A., PURDY, K., AN D SON G, T. 2006. Is that agun? the influence and features of bags and threat items on de-tection performace. In Contemporary Ergonomics, Proceedings
of the Ergonomic Society, 17–22.
MAHFOUZ, M. R., HOFF , W. A., KOMISTEK, R. D., A ND D EN -NI S, D. A. 2005. Effect of segmentation errors on 3d-to-2dregistration of implant models in x-ray images. In Journal of
Biomechanics, vol. 38(2), 229–239.
MCCARLEY, J. S., KRAMER, A. F., W ICKENS, C. D., VIDONI,E. D., A ND B OOT, W. R. 2004. Visual skills in airport-securityscreening. In Psychological Science, vol. 15, 302–306.
SCHWANINGER, A . , HARDMEIER , D., AN D HOFER, F. 2004.Measuring visual abilities and visual knowledge of aviation se-curity screeners. In IEEE ICCST Proceedings, vol. 38, 258–264.
SCHWANINGER, A . , HARDMEIER , D., AN D HOFER, F. 2005.Aviation security screeners visual abilities & visual knowledgemeasurement. In IEEE Aerospace and Electronic Systems,vol. 20(6), 29–35.
SCHWANINGER, A., MICHEL, S., AN D B OLFING, A. 2005. To-wards a model for estimating image difficulty in x-ray screening.In IEEE ICCST Proceedings, vol. 39, 185–188.
SCHWANINGER, A. 2004b. Computer based training: a powerfultool to the enhancement of human factors. In Aviation Security
International, FEB/2004, 31–36.
SCHWANINGER, A. 2005b. Increasing efficiency in airport secu-rity screening. In WIT Transactions on the Built Environment ,vol. 82, 407–416.
SCHWANINGER, A. 2006b. Airport security human factors: Fromthe weakest to the strongest link in airport security screening. InProceedings of the 4th International Aviation Security Technol-ogy Symposium, Washington, D.C., USA, November 27 - Decem-
ber 1, 265–270.
SLUSER, M., A ND PARANJAPE, R. 1999. Model-based probabilis-tic relaxation segmentation applied to threat detection in airportx-ray imagery. In Proceedings of the 1999 IEEE Canadian Con-
ference on Electrical and Computer Engineering.
YIN G, Z., NAIDU, R., A ND C RAWFORD, C. R. 2006. Dual energycomputed tomography for explosive detection. In Journal of X-
Ray Science and Technology, vol. 14(4), 235–256.
130