a statewide telephone survey of utah residents’ attitudes toward recreational trails statewide...
Post on 18-Dec-2015
218 views
TRANSCRIPT
A Statewide Telephone Survey of Utah Residents’ Attitudes
Toward Recreational Trails
Statewide Results
Institute for Outdoor Recreation and Tourism
Utah State University
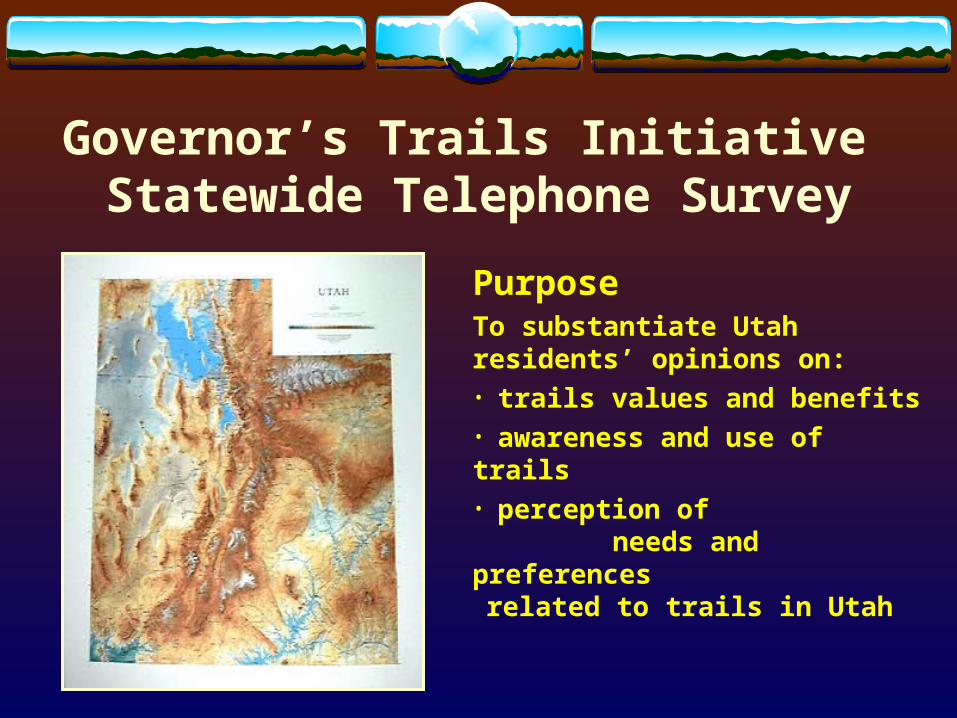
Governor’s Trails Initiative Statewide Telephone Survey
PurposeTo substantiate Utah residents’ opinions on: • trails values and benefits• awareness and use of trails • perception of
needs and preferences related to trails in Utah
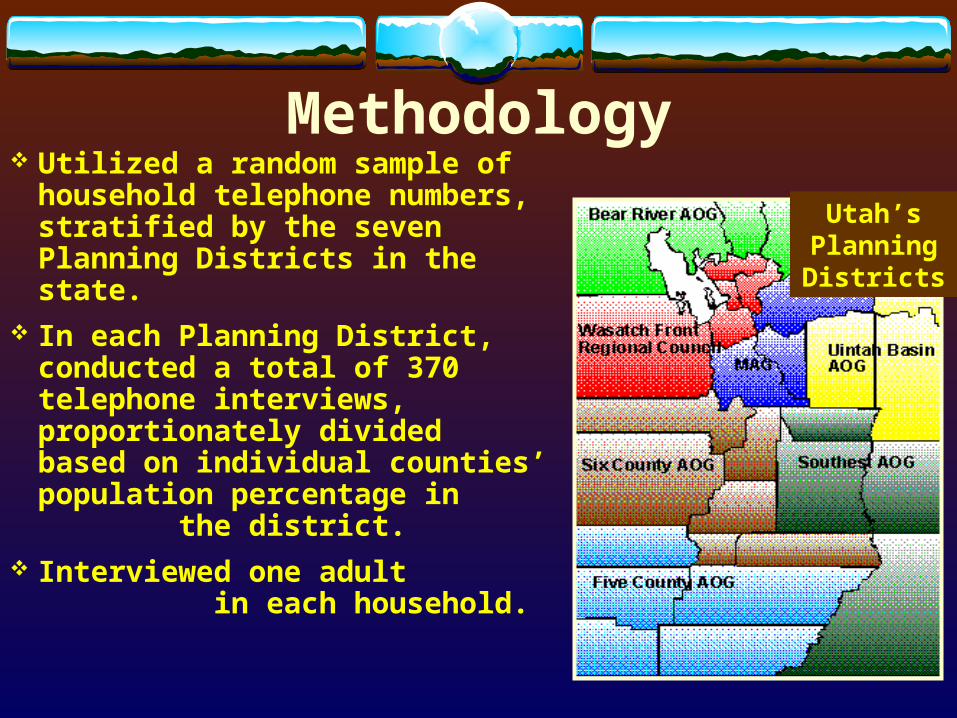
Methodology Utilized a random sample of
household telephone numbers, stratified by the seven Planning Districts in the state.
In each Planning District, conducted a total of 370 telephone interviews, proportionately divided based on individual counties’ population percentage in the district.
Interviewed one adult in each household.
Utah’s Planning Districts
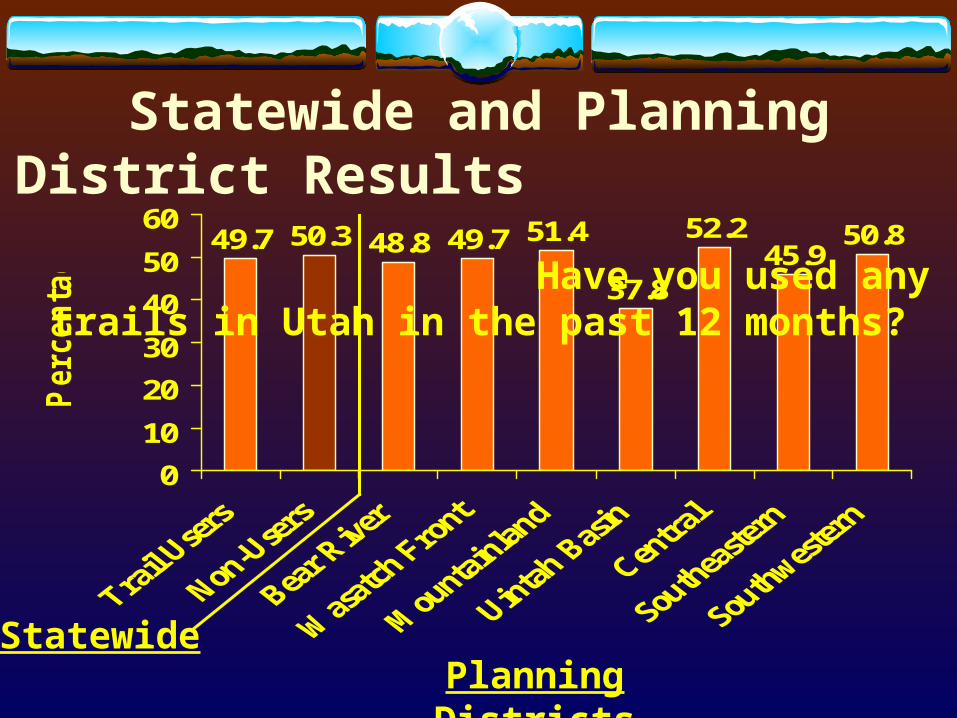
49.7 50.3 48.8 49.7 51.4
37.8
52.245.9
50.8
0
10
20
30
40
50
60
Percen
tage
StatewidePlanning Districts
Statewide and Planning District Results Have you
used any trails in Utah in the past 12 months?
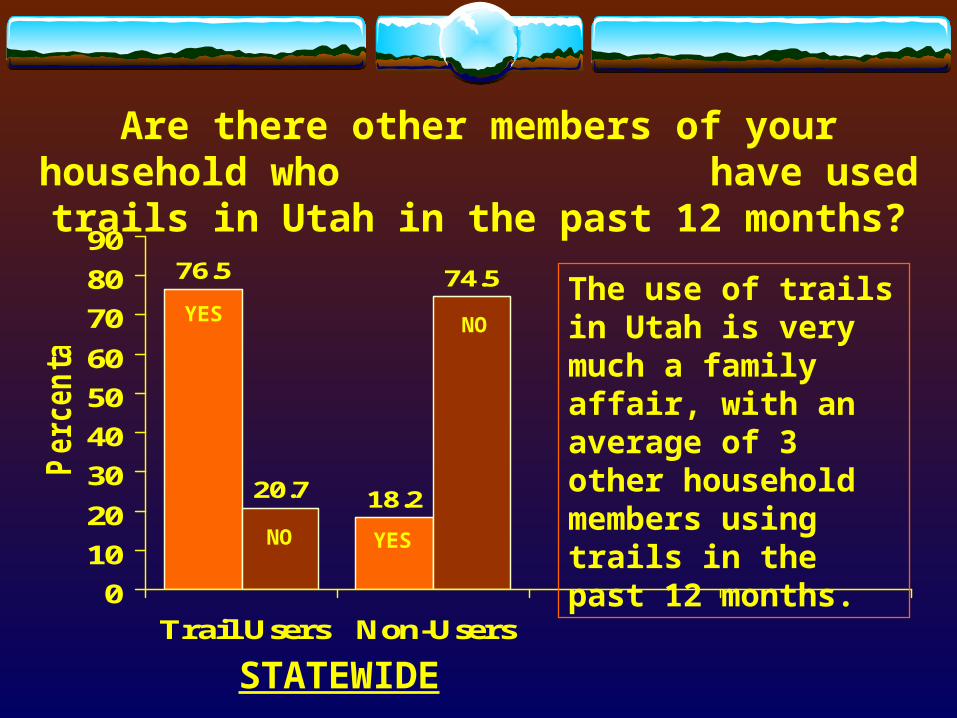
76.5
18.220.7
74.5
0
10
20
30
40
50
60
70
80
90
Trail Users Non-Users
Percen
tage
STATEWIDE
Are there other members of your household who have used trails in Utah in the past 12 months?
YES
YESNO
NO
The use of trails in Utah is very much a family affair, with an average of 3 other household members using trails in the past 12 months.
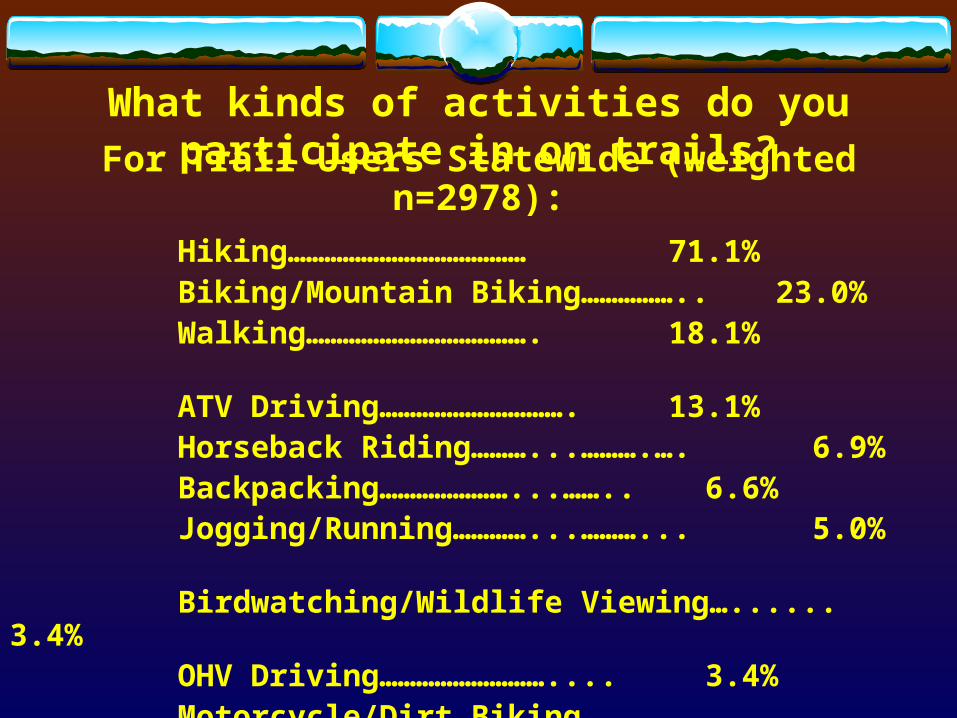
What kinds of activities do you participate in on trails?For Trail Users Statewide (weighted n=2978):
Hiking…………………………………71.1%Biking/Mountain Biking…………….. 23.0% Walking……………………………….18.1% ATV Driving…………………………. 13.1% Horseback Riding………...……….…. 6.9%Backpacking…………………...…….. 6.6%Jogging/Running…………...………... 5.0% Birdwatching/Wildlife Viewing…...... 3.4%OHV Driving……………………….... 3.4% Motorcycle/Dirt Biking……….…...… 2.7%Cross Country Skiing…….…….……. 2.6% Auto Touring………………………… 2.3%Historic/Heritage Activities…….…… 2.2%
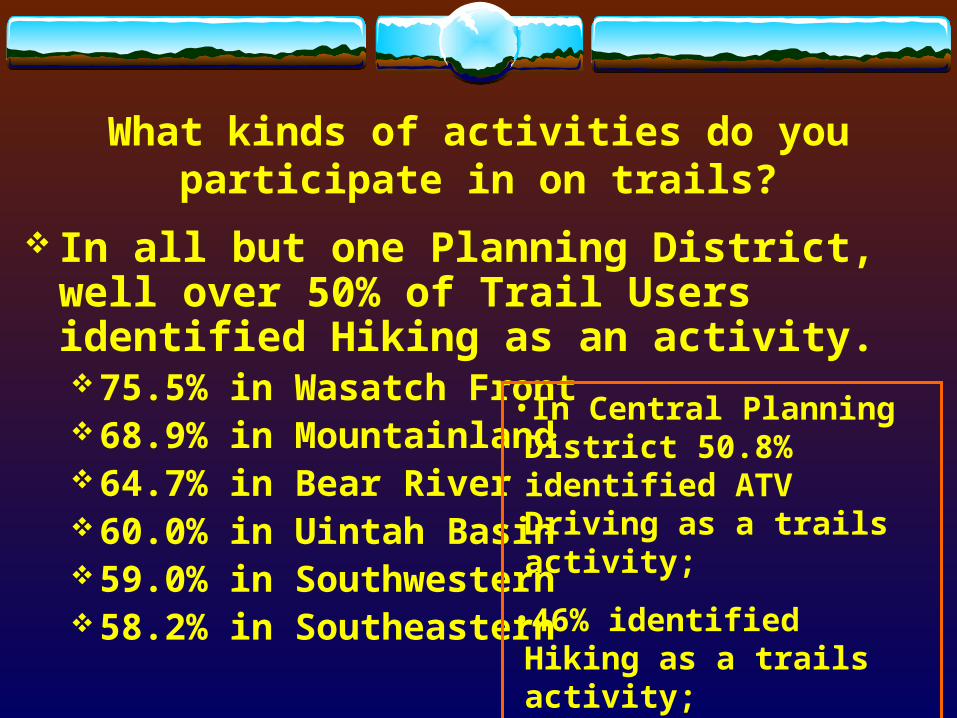
What kinds of activities do you participate in on trails?
In all but one Planning District, well over 50% of Trail Users identified Hiking as an activity.75.5% in Wasatch Front68.9% in Mountainland64.7% in Bear River60.0% in Uintah Basin59.0% in Southwestern58.2% in Southeastern
•In Central Planning District 50.8% identified ATV Driving as a trails activity;
•46% identified Hiking as a trails activity;
•19.1% identified Horseback Riding as a trails activity.
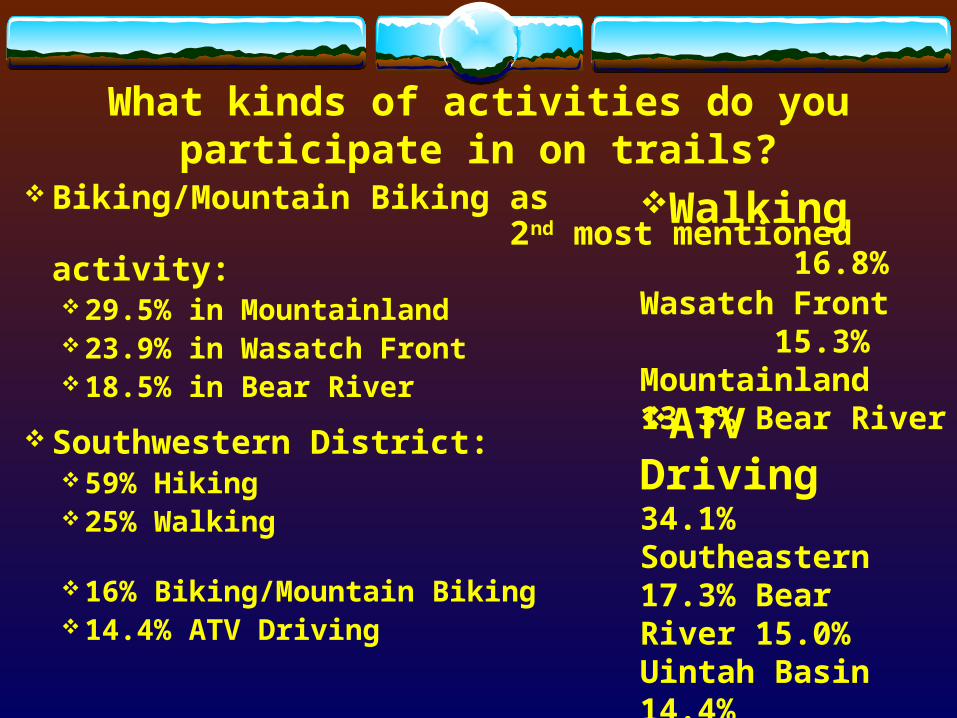
What kinds of activities do you participate in on trails?
Biking/Mountain Biking as 2nd most mentioned activity:29.5% in Mountainland23.9% in Wasatch Front18.5% in Bear River
Southwestern District:59% Hiking25% Walking 16% Biking/Mountain Biking14.4% ATV Driving
Walking 16.8% Wasatch Front 15.3% Mountainland 13.3% Bear River
ATV Driving 34.1% Southeastern 17.3% Bear River 15.0% Uintah Basin 14.4% Southwestern
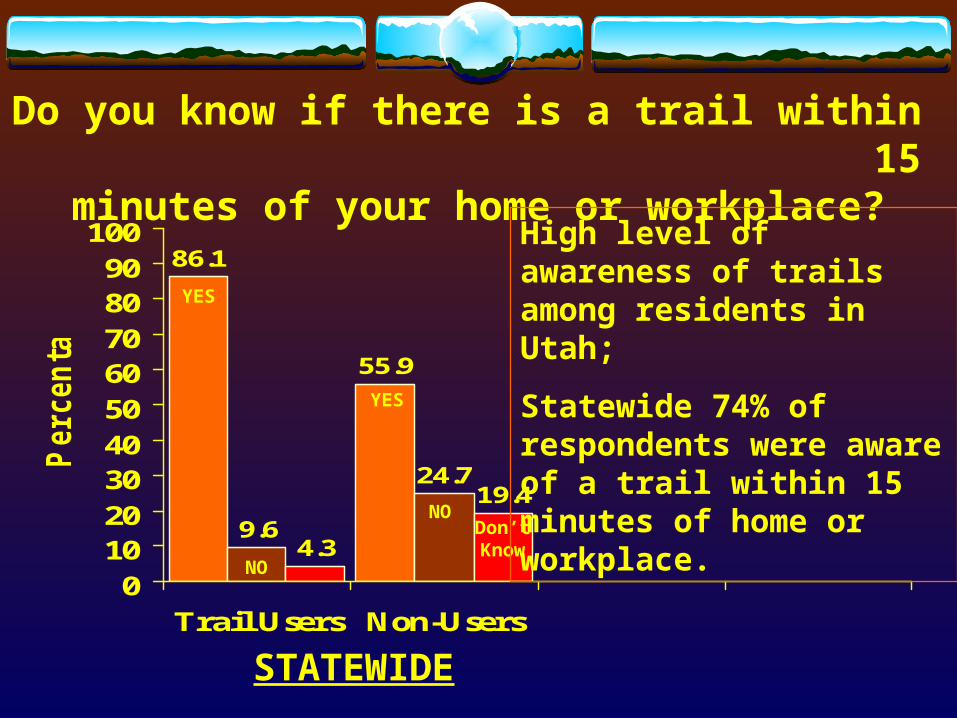
Do you know if there is a trail within 15 minutes of your home or workplace?
86.1
55.9
9.6
24.7
4.3
19.4
0102030405060708090
100
Trail Users Non-Users
Percen
tage
STATEWIDE
YES
NO
YES
NODon’t Know
High level of awareness of trails among residents in Utah;
Statewide 74% of respondents were aware of a trail within 15 minutes of home or workplace.
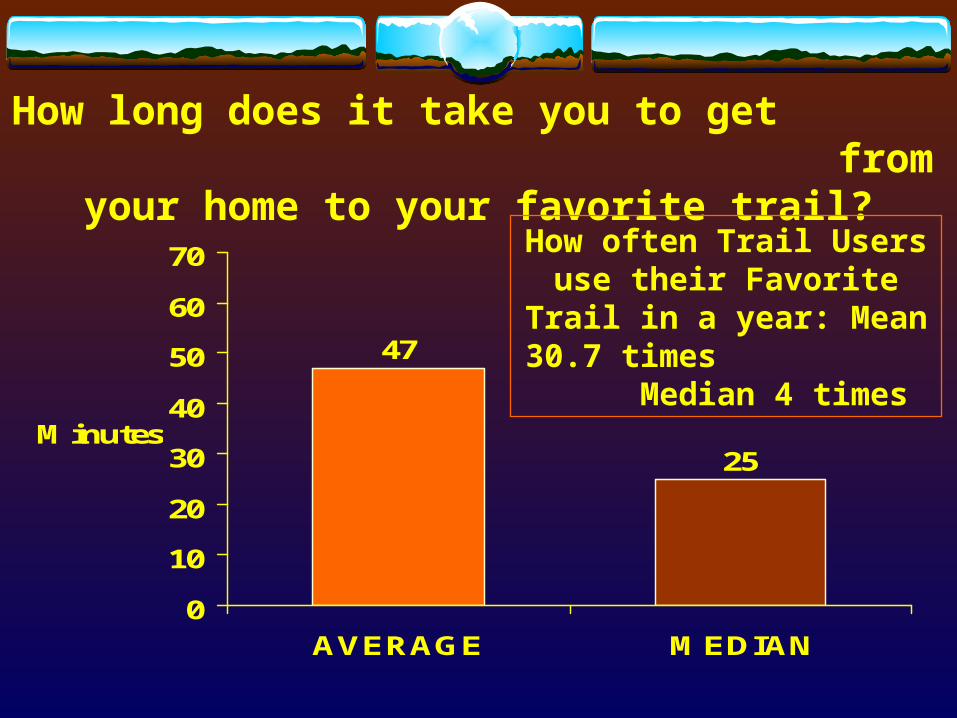
How long does it take you to get from your home to your favorite trail?
47
25
0
10
20
30
40
50
60
70
AVERAGE MEDIAN
Minutes
How often Trail Users use their Favorite Trail in a year:
Mean 30.7 times Median 4 times
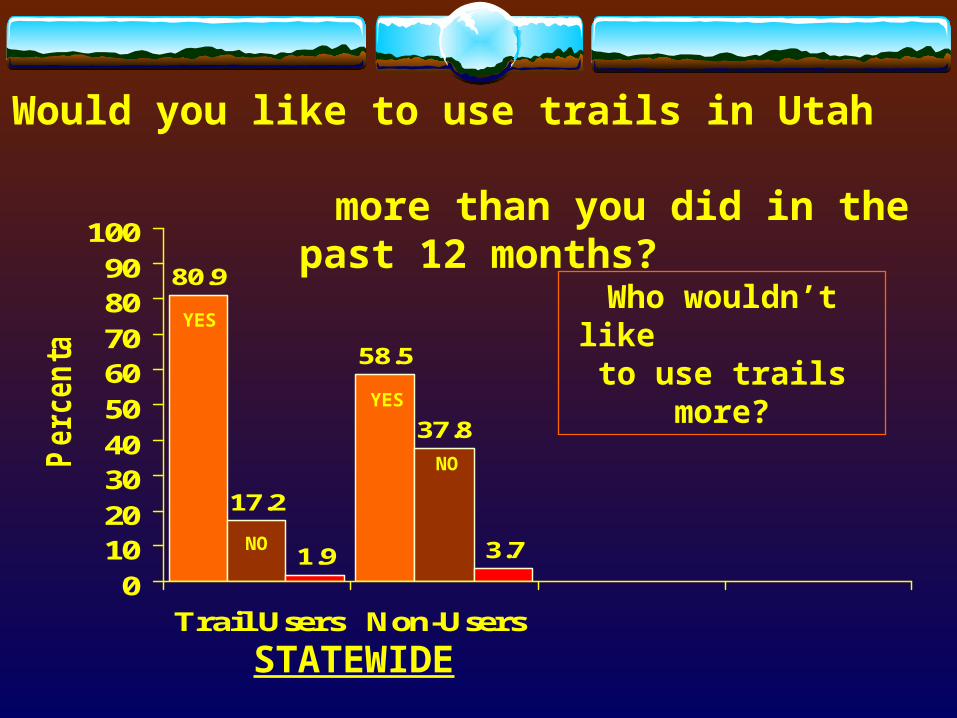
Would you like to use trails in Utah more than you did in the past 12 months?
80.9
58.5
17.2
37.8
1.9 3.7
0102030405060708090
100
Trail Users Non-Users
Percen
tage
STATEWIDE
NO
YES
YES
NO
Who wouldn’t like to use trails more?
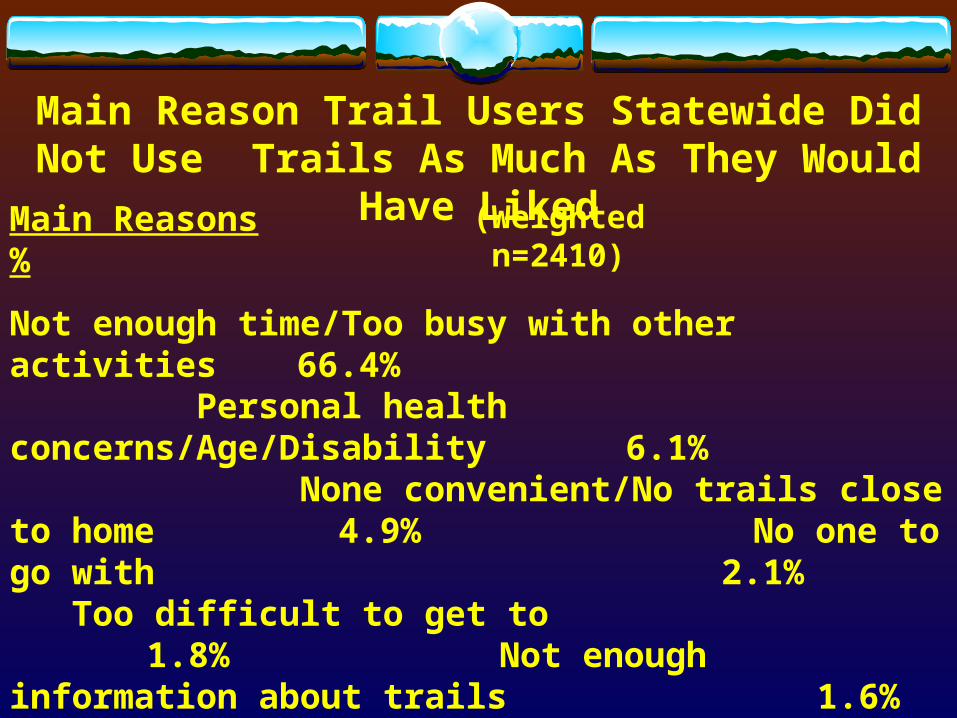
Main Reason Trail Users Statewide Did Not Use Trails As Much As They Would Have Liked
Main Reasons %
Not enough time/Too busy with other activities 66.4% Personal health concerns/Age/Disability
6.1% None convenient/No trails close to home 4.9% No one to go with
2.1% Too difficult to get to 1.8% Not enough
information about trails 1.6% Closed to certain activities 1.4% Don’t know where trails are located 1.3% Not enough money 1.3% New to area 1.0% Other reasons
12.1%
(Weighted n=2410)
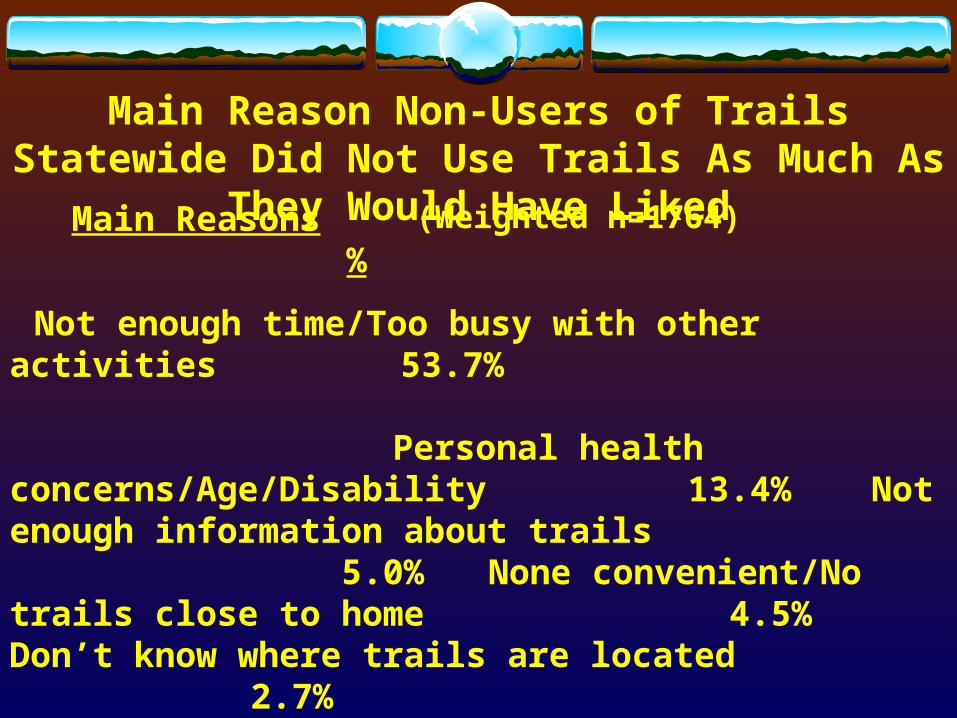
Main Reason Non-Users of Trails Statewide Did Not Use Trails As Much As They Would Have Liked
Main Reasons %
Not enough time/Too busy with other activities 53.7% Personal health concerns/Age/Disability 13.4% Not enough information about trails 5.0% None convenient/No trails close to home 4.5% Don’t know where trails are located 2.7% Traveling out-of-state in the past 12 months 2.7% New to area 2.0% Little or no interest/Do not care for outdoors 1.6%
Too difficult to get to 1.0% Other reasons 13.6%
(Weighted n=1764)
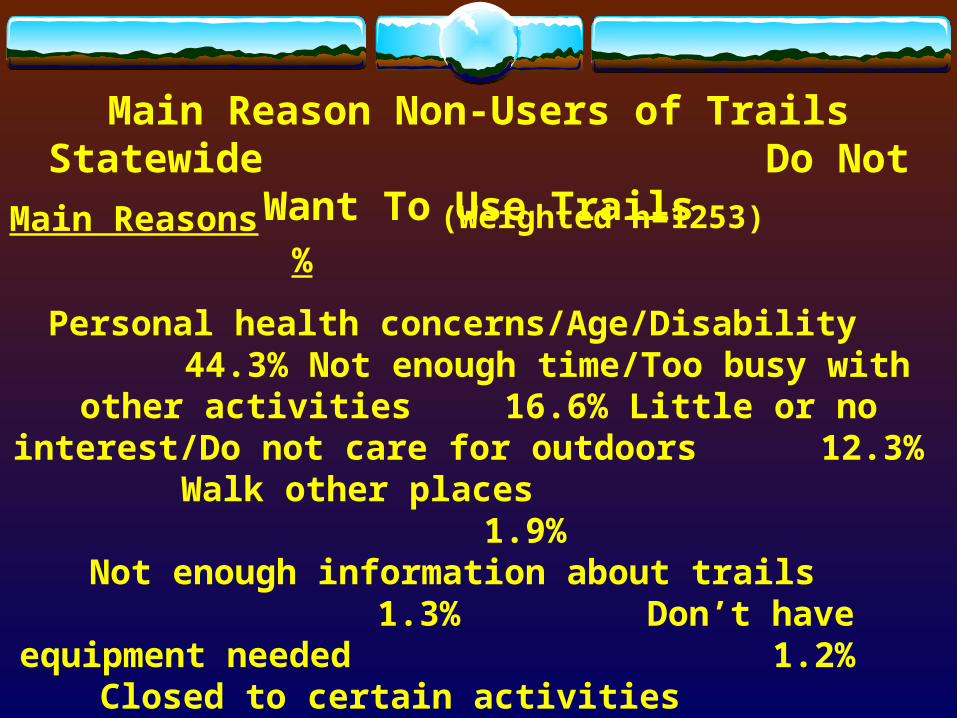
Main Reason Non-Users of Trails Statewide Do Not Want To Use Trails
Main Reasons %
Personal health concerns/Age/Disability 44.3% Not enough time/Too busy with other activities 16.6%
Little or no interest/Do not care for outdoors 12.3% Walk other places 1.9% Not enough information about trails
1.3% Don’t have equipment needed 1.2% Closed to certain activities
1.1% No one to go with 1.1% Too
difficult to get to 1.0% Not safe
1.0% Other reasons 15.9%
(Weighted n=1253)
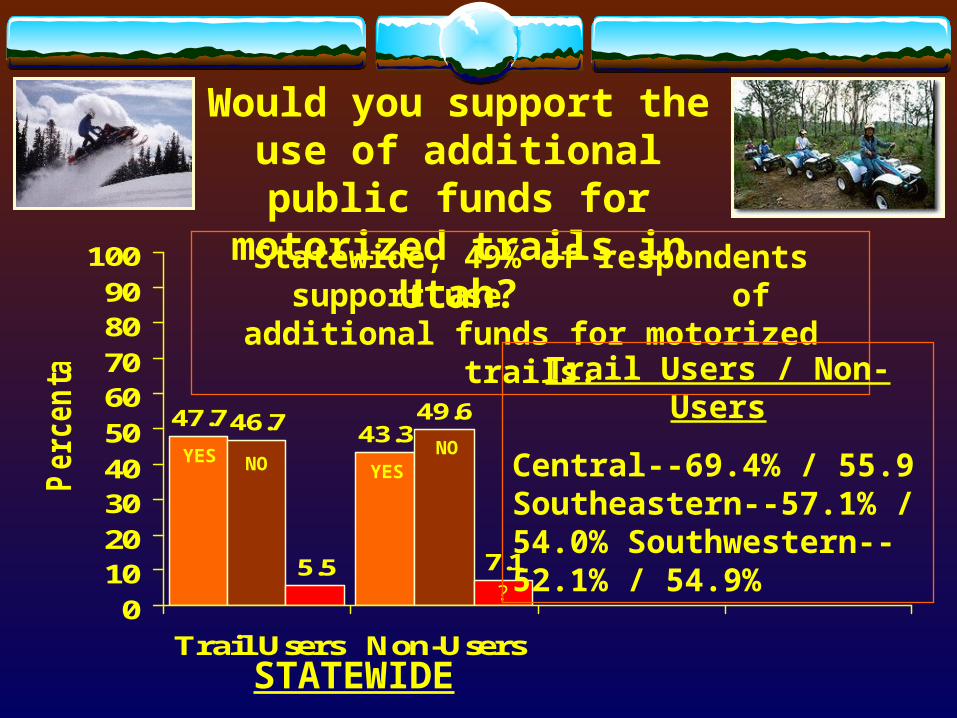
Would you support the use of additional public funds for motorized trails in Utah?
47.743.346.7 49.6
5.5 7.1
0102030405060708090
100
Trail Users Non-Users
Percen
tage
STATEWIDE
NOYESYES
NO
?
Statewide, 49% of respondents support use of additional funds for motorized trails.
Trail Users / Non-Users
Central--69.4% / 55.9 Southeastern--57.1% / 54.0% Southwestern--52.1% / 54.9%
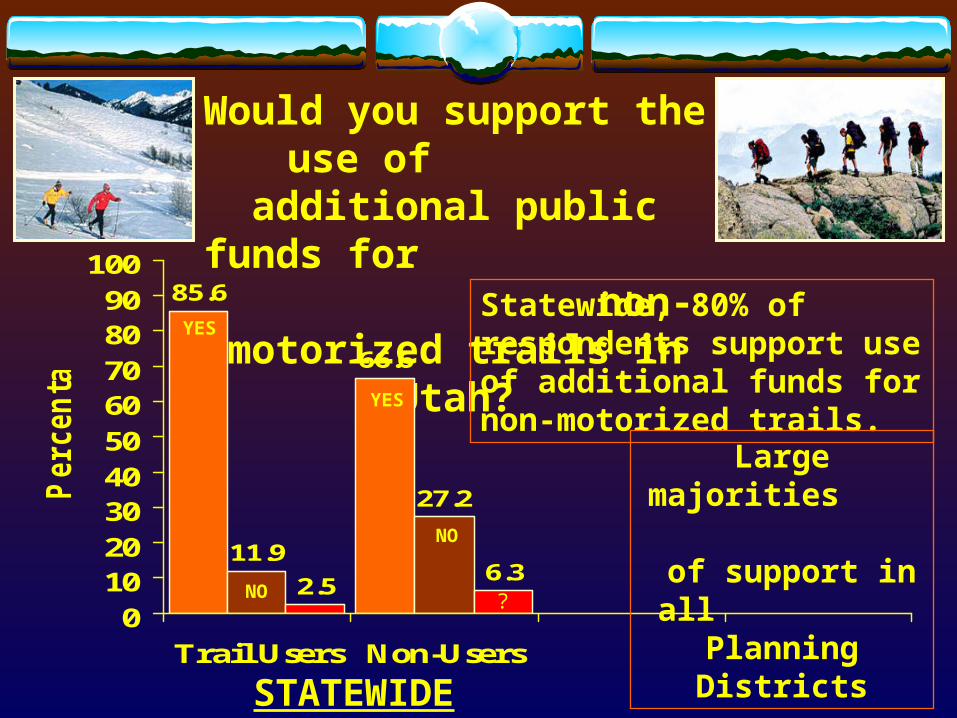
Would you support the use of additional public funds
for non-motorized trails in Utah?
85.6
66.6
11.9
27.2
2.56.3
0102030405060708090
100
Trail Users Non-Users
Percen
tage
STATEWIDE
NO
YES
YES
NO
?
Statewide, 80% of respondents support use of additional funds for non-motorized trails.
Large majorities of support in
all Planning Districts
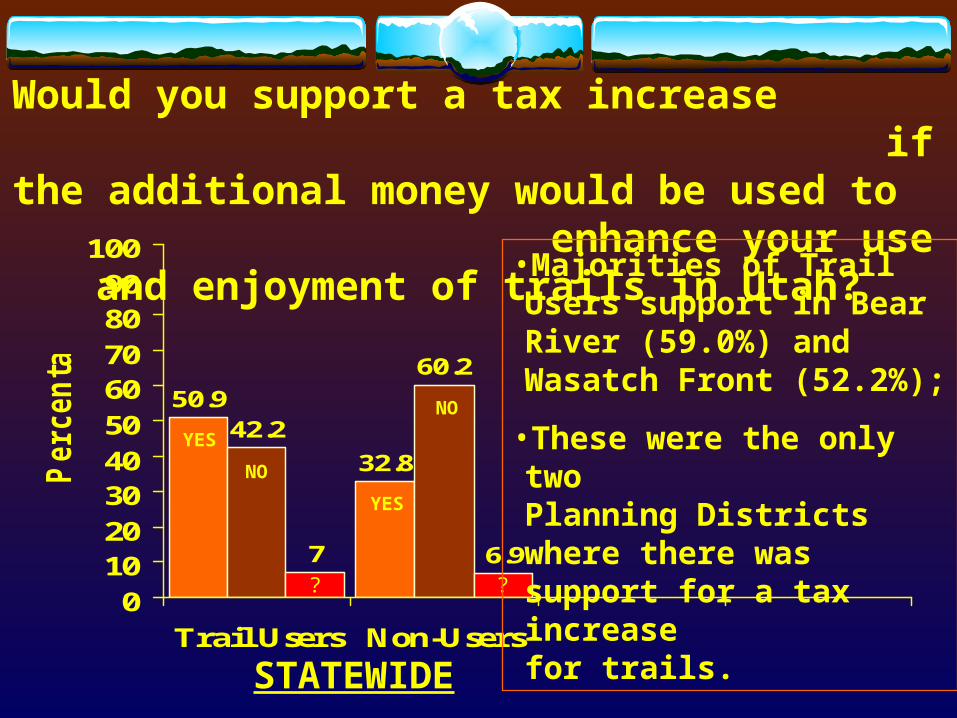
Would you support a tax increase if the additional money would be used to enhance your use and enjoyment of trails in Utah?
50.9
32.8
42.2
60.2
7 6.9
0102030405060708090
100
Trail Users Non-Users
Percen
tage
STATEWIDE
NO
YES
YES
NO
? ?
•Majorities of Trail Users support in Bear River (59.0%) and Wasatch Front (52.2%);
•These were the only two Planning Districts where there was support for a tax increase for trails.
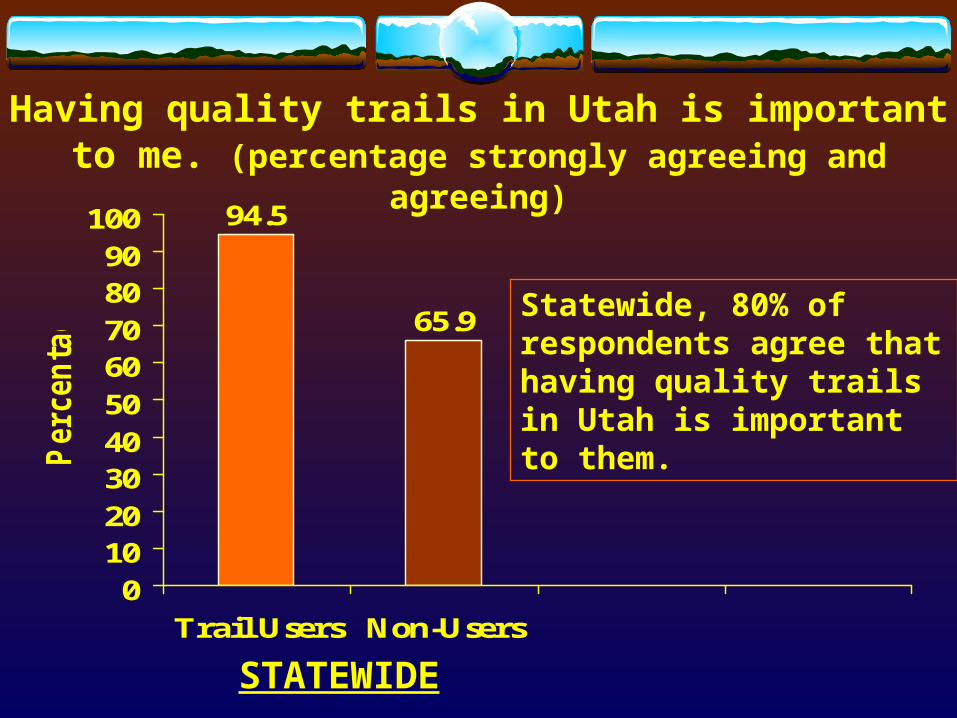
94.5
65.9
0102030405060708090
100
Trail Users Non-Users
Percen
tage
STATEWIDE
Having quality trails in Utah is important to me. (percentage strongly agreeing and agreeing)
Statewide, 80% of respondents agree that having quality trails in Utah is important to them.
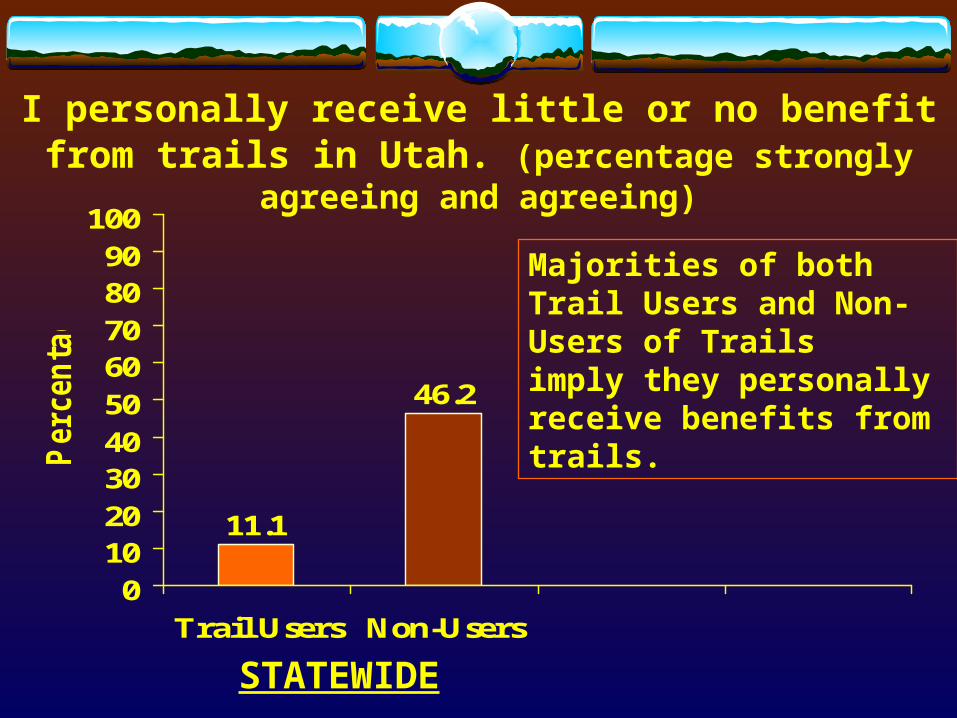
11.1
46.2
0102030405060708090
100
Trail Users Non-Users
Percen
tage
STATEWIDE
I personally receive little or no benefit from trails in Utah. (percentage strongly agreeing and agreeing)
Majorities of both Trail Users and Non-Users of Trails imply they personally receive benefits from trails.
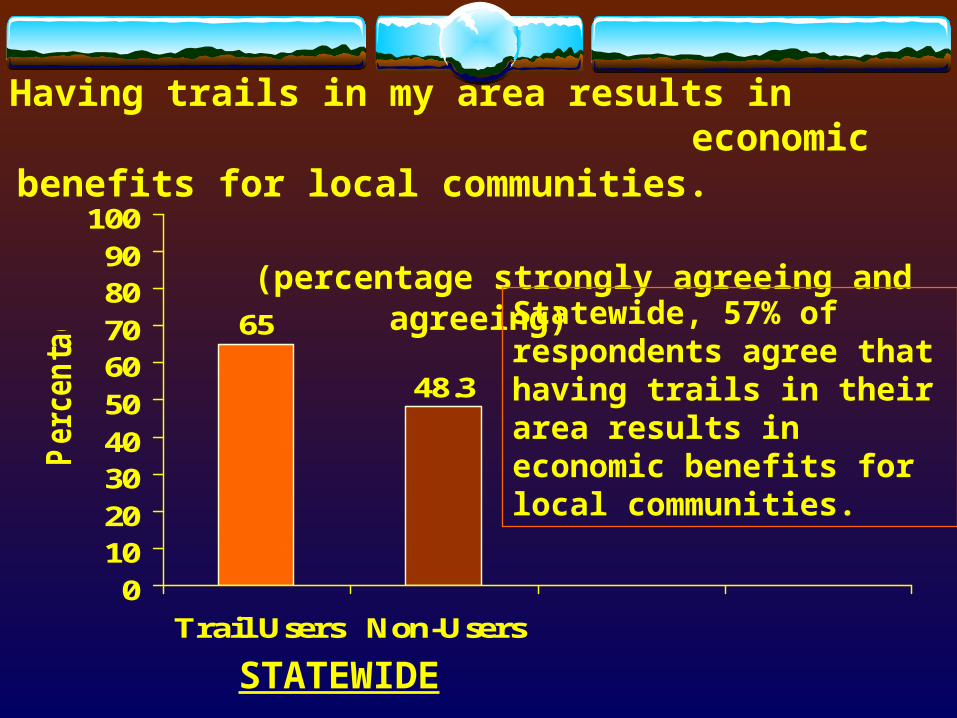
65
48.3
0102030405060708090
100
Trail Users Non-Users
Percen
tage
STATEWIDE
Having trails in my area results in economic benefits for local communities. (percentage strongly agreeing and agreeing)
Statewide, 57% of respondents agree that having trails in their area results in economic benefits for local communities.
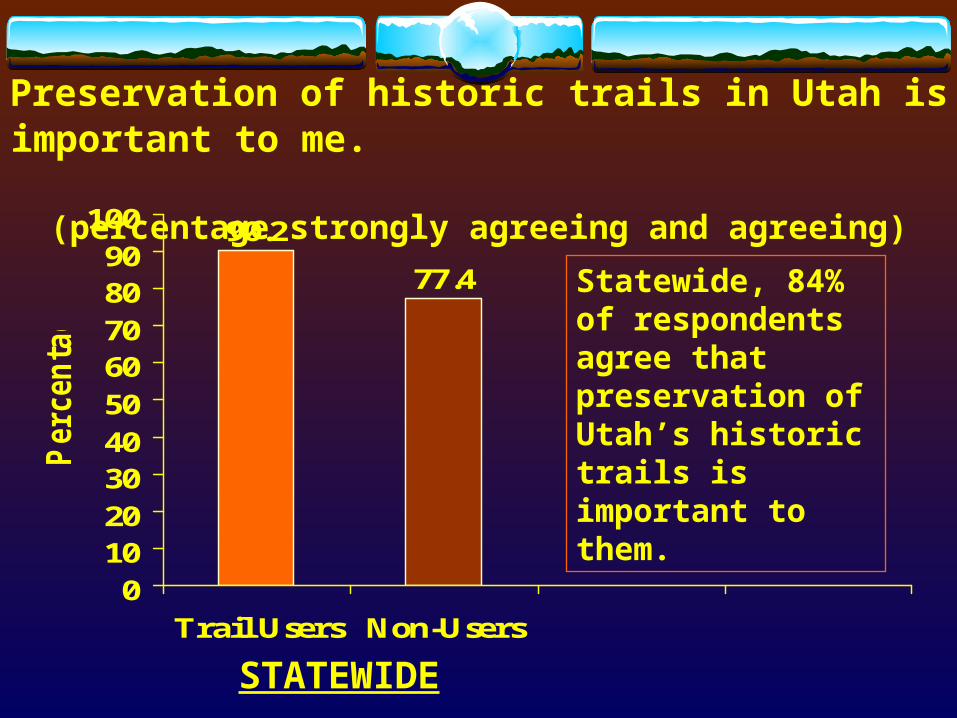
90.2
77.4
0102030405060708090
100
Trail Users Non-Users
Percen
tage
STATEWIDE
Preservation of historic trails in Utah is important to me. (percentage strongly
agreeing and agreeing)
Statewide, 84% of respondents agree that preservation of Utah’s historic trails is important to them.
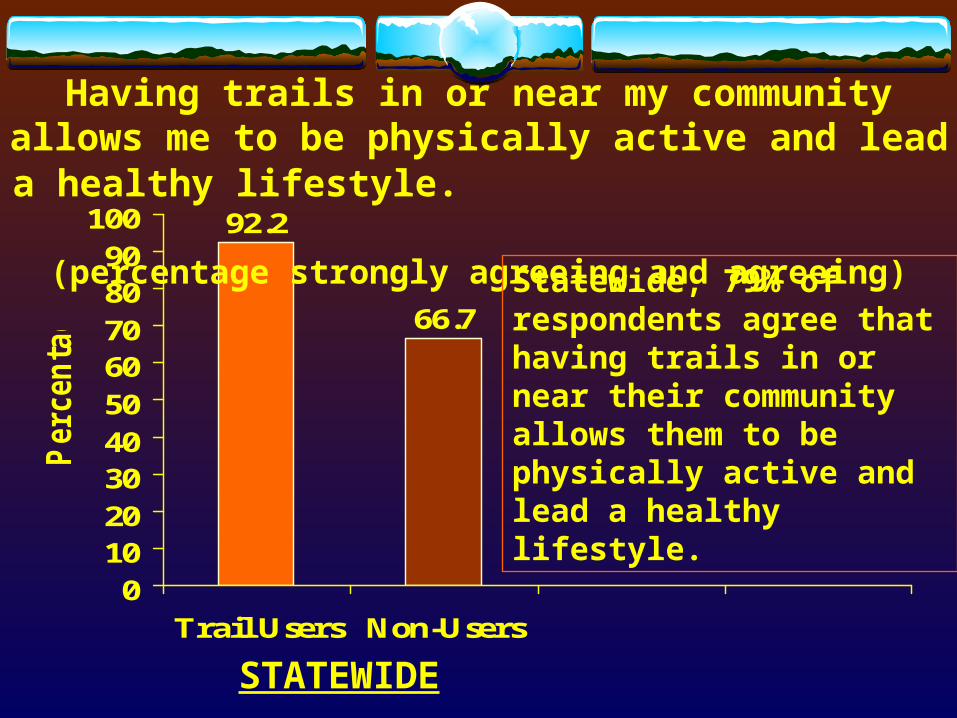
92.2
66.7
0102030405060708090
100
Trail Users Non-Users
Percen
tage
STATEWIDE
Having trails in or near my community allows me to be physically active and lead a healthy lifestyle.
(percentage strongly agreeing and agreeing)
Statewide, 79% of respondents agree that having trails in or near their community allows them to be physically active and lead a healthy lifestyle.
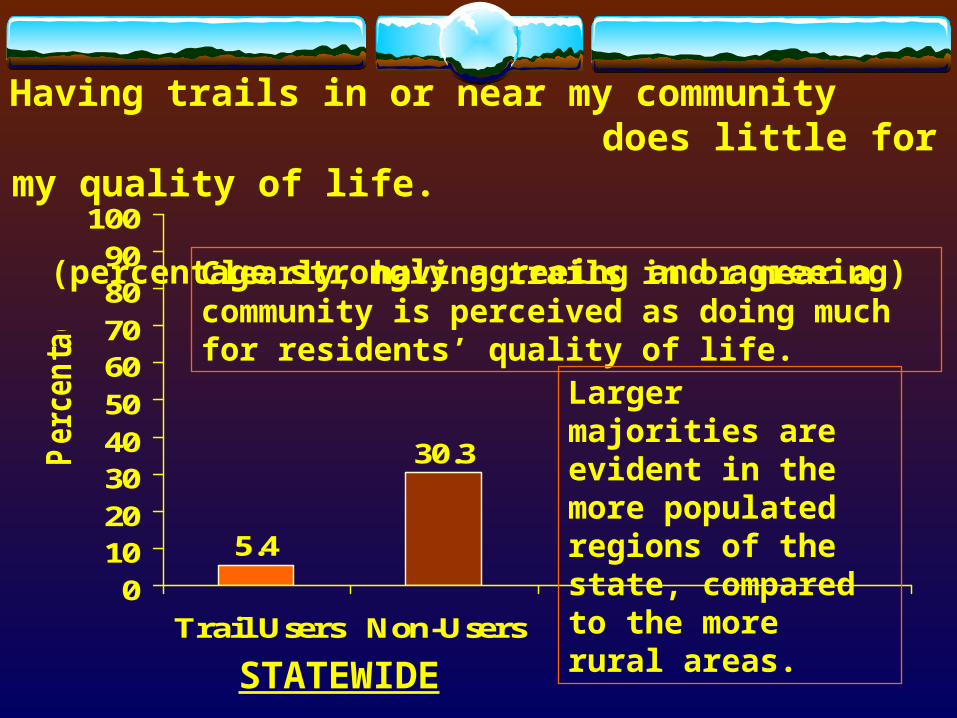
5.4
30.3
0102030405060708090
100
Trail Users Non-Users
Percen
tage
STATEWIDE
Having trails in or near my community does little for my quality of life.
(percentage strongly agreeing and agreeing)
Clearly, having trails in or near a community is perceived as doing much for residents’ quality of life.
Larger majorities are evident in the more populated regions of the state, compared to the more rural areas.
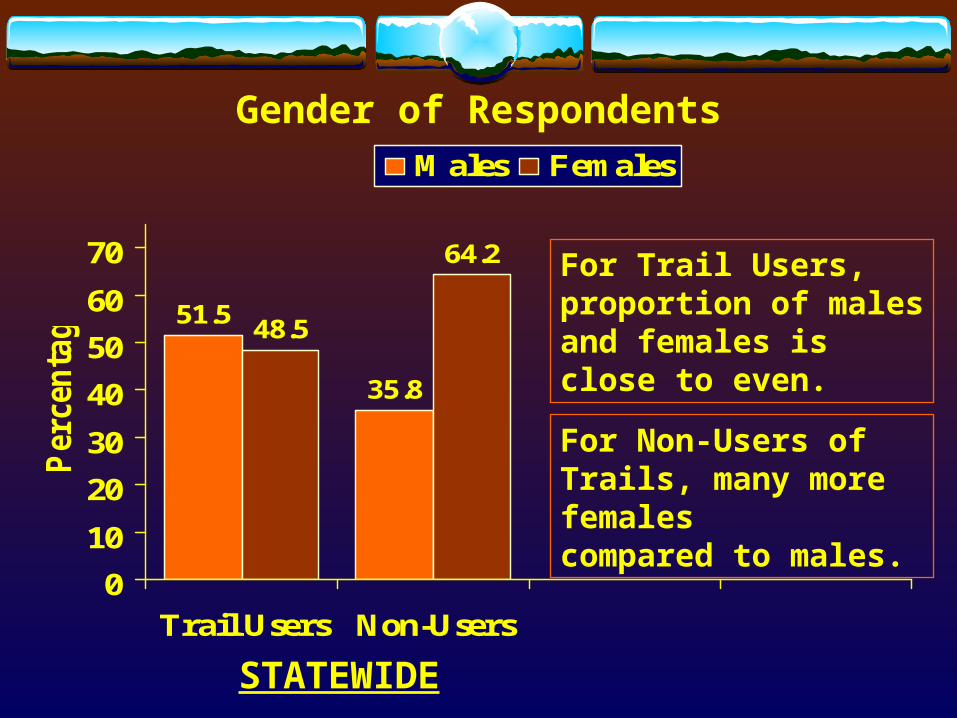
51.5
35.8
48.5
64.2
0
10
20
30
40
50
60
70
Trail Users Non-Users
Per
cen
tage
Males Females
STATEWIDE
Gender of Respondents
For Trail Users, proportion of males and females is close to even.
For Non-Users of Trails, many more females compared to males.
0
5
10
15
20
25
30
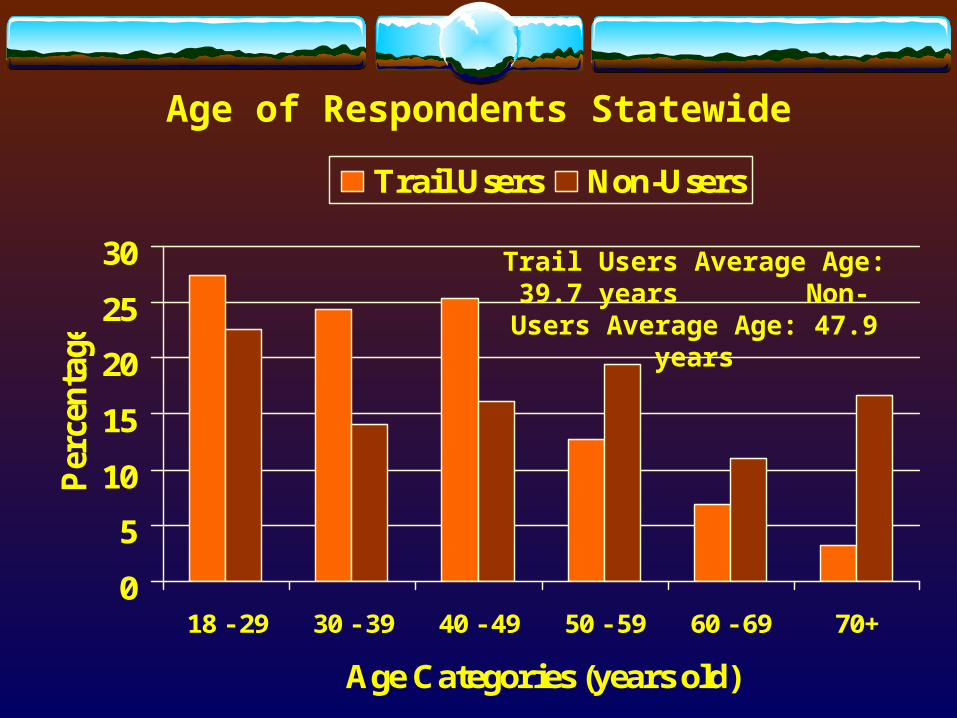
18 - 29 30 - 39 40 - 49 50 - 59 60 - 69 70+
Age Categories (years old)
Per
cen
tage
Trail Users Non-Users
Age of Respondents Statewide
Trail Users Average Age: 39.7 years Non-Users Average Age: 47.9
years
A Statewide Telephone Survey of Utah Residents’ Attitudes
Toward Recreational Trails
Steven W. Burr, DirectorDale J. Blahna, Research Scientist
Douglas Reiter, Research Associate Michael Butkus, Programs Administrator
Institute for Outdoor Recreation and TourismUtah State University5220 Old Main Hill
Logan, Utah 84322-5220(435) 797-7094