a social movement society?: a cross-national analysis of protest potential
TRANSCRIPT
12
Address all correspondence to J. Craig Jenkins, Department of Sociology, Ohio State Uni-versity, 300 Bricker Hall, 190 N. Oval Mall, Ohio State University, Columbus OH 43210; e-mail: [email protected]. Michael Wallace is affiliated with the Department of Sociology, University of Connecticut, Storrs, CT; e-mail: [email protected]. Andrew S. Fullerton is affiliated with the Department of Sociology, Oklahoma State Uni-versity, Stillwater, OK; e-mail: [email protected].
International Journal of Sociology, vol. 38, no. 3, Fall 2008, pp. 12–35.© 2008 M.E. Sharpe, Inc. All rights reserved.ISSN 0020–7659/2008 $9.50 + 0.00.DOI 10.2753/IJS0020-7659380301
J. Craig Jenkins, MiChael WallaCe, and andreW s. Fullerton
A Social Movement Society?A Cross-National Analysis of Protest Potential
ABSTRACT: Some argue that we are experiencing a global shift toward a “so-cial movement society” in which protest is a routine part of political bargaining. Postindustrialism and affluence are seen as combining with the growth of the state and neocorporatist bargaining in creating greater protest potential. We use a multilevel analysis of 41,235 respondents nested within thirty-five countries from the 1990 World Values Survey to examine this question. Net of standard controls for individual-level sources of protest potential, we find that economic affluence, state capacity, women as a percentage of the total labor force, and left corporatism contribute to greater aggregate protest potential. Ethnic grievances stemming from economic discrimination and percentage of Protestants also contribute positively while language dominance suppresses protest potential. Protest potential is an outgrowth of postindustrialism trends, the prevailing control strategy of left parties in neocorporatist states, and long-standing ethnic grievances.
Discussions of contemporary protest have been dominated by microanalyses of the resources, networks, and political attitudes that contribute to protest (e.g., Barnes and Kaase 1979; Crozat 1998; Klandermans 1997; Marsh 1977; Martinez 2005; McAdam and Paulsen 1993; Nepstad 2001; Nepstad and Smith 1999; Norris 1999).
FALL 2008 13
While useful, these arguments leave unaddressed the larger macropolitical and social structural contexts that lie behind the growth and mobilization of protest. Some of these studies (e.g., Crozat 1998; Ingelhart 1990) use individual-level analyses to make claims about the changing macrodeterminants of protest, a technique that fails to distinguish and separately control for individual and structural factors. Protest and the development of a “social movement society” (Meyer and Tarrow 1998) are by many accounts rooted in changes in the social structures, institutions, and political processes of contemporary societies. Arguably, they are also connected to idiosyncratic, but durable, differences among countries in political culture and sociohistorical trajectories.
We address the macrodeterminants of protest by using a multilevel (or hierarchi-cal linear model [HLM]) analysis of the protest potential measures provided in the 1990 wave of the World Values Survey. Protest potential gages the willingness of political actors to resort to unconventional forms of political action (e.g., strikes, boycotts, violence, etc.) as a means of achieving their goals. While willingness to engage in such actions does not equate with actual participation, several studies have demonstrated a strong correlation between protest potential and actual protest actions (Barnes and Kaase 1979; Crozat 1998; Jenkins and Wallace 1996; Marsh 1977; Wallace and Jenkins 1995). Although the incidence of protest participation is often contingent on contextual circumstances (e.g., immediate grievances, co-optable networks, counteractions by opponents, police actions, etc.), protest po-tential provides a broad and reliable societal measure of the likelihood of protest. Dalton and van Sickle (2005) show that aggregate World Values Survey measures of protest correlate positively (r = 0.51) with news-reported protest events on a cross-national basis.
The World Values Survey (WVS) provides a rich opportunity to investigate cross-national variation in protest potential. The WVS provides indicators to derive a protest potential scale for over 40,000 respondents from thirty-five countries, representing all of the major world regions. To this data set, we append country-level measures of political institutions, economic development, and, to tap ethnic grievances and religious background, the cultural/ethnic mix of each country. This permits us to conduct a multilevel analysis that focuses on the macrostructures and processes that shape aggregate protest potential while controlling for the effects of a standard set of individual-level predictors (Barnes and Kaase 1979; Crozat 1998; Norris 1999; Wallace and Jenkins 1995). We use HLM to estimate the country-level effects because this method allows us to control for possible error dependence within countries (DiPrete and Forristal 1994; Hox 2002; Raudenbush and Bryk 2002). Our aim is to see whether economic affluence and social modernization (including postmodernization), democratization, and the structure of political representation, as well as ethnic antagonisms and religious identity influence protest net of indi-vidual determinants. We begin with a brief discussion of macrofactors that should influence protest, identify a standard set of individual-level predictors, and then conduct a multilevel analysis of protest potential.
14 INTERNATIONAL JOURNAL OF SOCIOLOGY
Explanations of Protest
Macrolevel explanations of contemporary social protest can be usefully classified into three broad categories that locate the sources of social protest in the economic, political, and cultural realms of society. Economically, social protest results from the affluence and postindustrialism (or by another term, modernization) that accom-pany contemporary societies. Politically, social protest is an outgrowth of political institutions, democratization, and the state’s capacity to respond to social griev-ances. Culturally, social protest is driven by inherent ethnic, linguistic, and religious cleavages that pervade societies. In our view, these competing explanations are not necessarily conflicting; that is, social protest may derive from some combination of these structural features of society. In the discussion below, we develop each of these strands of argument more fully and seek to develop an interpretation that leaves room for each of them to explain a piece of the puzzle of social protest.
The economic explanation points to broad structural changes, such as postin-dustrialism and economic affluence (Dalton 2002; Inglehart 1990, 1997) as creat-ing a “social movement society” (Meyer and Tarrow 1998). The core idea is that affluence and the growth of postindustrialism have increased economic security, thereby encouraging the adoption of postmaterialist values that place a priority on self-expression. Postmaterialist societies provide safer contexts for the airing of oppositional views and foster a culture where actors are encouraged to express their grievances directly, if not confrontationally, thus increasing the likelihood of protest (Ingelhart 1990, 1997). Nevertheless, despite a common trajectory of postmaterialism, countries should also display wide variation in the expression of protest because of differences in culture, social structure, and history.
A related argument is that the periodic upturns and downturns in the business cycle may affect social protest. Common indicators of economic vibrancy such as unemployment and inflation may affect social protest, but there is disagree-ment about how these may affect protest potential. Some may contend that high unemployment and inflation can accelerate economic grievances and lead to social protest to secure economic relief from the state or actors in the private sector. An opposing view is that economic misery undercuts the accustomed economic security of affluent societies and has a suppressing effect on activism and dissent.
Finally, sectoral shifts in the economy that tend to accompany postmaterialist societies may facilitate social protest. The universal expansion of the service sector is the most pervasive sectoral shift in these societies. Typically, accompanying this shift is a broad influx of women into the labor force. Broader economic participation by women typically foments demands for fuller economic equality and inclusion of women and other groups in political and cultural institutions. These demands for fuller participation may fuel a culture of protest among women and competing groups. In short, this argument suggests that social protest is rooted in the growth of the service sector and the concomitant economic liberation of women.
The second set of arguments is rooted in the political structure and focuses on
FALL 2008 15
political institutions, democratization, and state capacity. One debate focuses on the impact of neocorporatism with some arguing that it reduces protest by channeling the expression of social demands (Schmitter 1981) and limiting the state’s capac-ity to satisfy those demands (Nollert 1995). Others contend that neocorporatism excludes specific groups that are not integrated into corporatist bargaining (Brand 1993; Joppke 1993; Wallace and Jenkins 1995), thus provoking protest. Joppke (1993), for example, compares the antinuclear movements of West Germany and the United States, arguing that the former confronted a neocorporatist state, which excluded movement demands and led to an antistatist protest movement whereas in the United States pluralistic institutions led to eventual accommodation and a moderate movement centered mainly in conventional actions. Still others (e.g., Della Porta and Diani 1999: 202–7; Kriesi et al. 1995; Wilson 1990) argue that the critical factor is not neocorporatism per se but the prevailing control strategy of elites. Where elites adopt an exclusionary strategy toward civil groups, protest is greater (Kriesi 1995). We examine party control of government to see if left-party corporatism has an accommodative effect on protest. Several studies have found left-party control affects welfare spending (Hicks 1999; Huber and Stephens 2001) and the regulation of social demands (Katzenstein 1985; Nollert 1995), which may extend to protest potential.
A related set of political explanations focuses on democratization and state ca-pacity. Several argue that democracy should open up opportunities for protest (Gurr 1989a; Tilly 1978, 2004) and that new democracies provide limited opportunities for protest, in part because of political legacies from the previous autocratic regime, especially conservative authoritarian attitudes among police who are responsible for keeping public order (Flam 1994; Reiter 1998). In addition, strong states en-courage protest by providing a centralized target for opposition and promoting the perception that the state is capable of responding to demands (Tarrow 1998; Tilly and Tarrow 2007). In other words, strong states may possess greater order-keeping capabilities, but they also have greater capacities for responding to social demands, which should increase protest.
The third broad strand of argument is cultural in nature and focuses primarily on ethnic, linguistic, and religious cleavages in society. A core argument is that ethnic discrimination in the economic and political realms of society produces widespread grievances against the dominant group, and thereby protest (Gurr 1989b; Gurr and Harf 1994). A somewhat distinct argument is that ethnic dominance (or the primacy of the largest ethnic group) produces ethnic exclusion and thereby grievances that fuel protest (Jenkins and Kposowa 1990). Vanhanen (1999) goes further to provide a more nuanced argument that ethnic nepotism—or the conflu-ence of racial, linguistic, and religious dominance—contributes to greater social protest and civil disorder. His measure is one of the few that explicitly incorporates language dominance as a potential source of ethnic competition in society. These various layers of ethnic cleavage are overlapping and not mutually exclusive, so we consider each of them in the analysis below.
16 INTERNATIONAL JOURNAL OF SOCIOLOGY
Religious-based arguments may take many forms but one prominent variation contends that Protestant religious heritage contributes to protest. This is consistent with a broader theme in the literature that religious affiliation and commitment play an important role in facilitating social movement activism (McAdam 1982; Smith 1991, 1996; Zald and McCarthy 1987). While the specific thesis connecting Protes-tantism to protest has received little attention, it is consistent with several previous studies. For instance, Nelson, Yokley, and Madron (1973) found that Protestant ministers with a “community problem-solving” role identity were inclined to endorse a protest orientation among their congregation. Lipset (1994) found that Protestant religious heritage is associated globally with democratization. Schofer and Fourcade-Gourinchas (2001) found that a Protestant religious heritage contributes to the density of civic associations and participation. McVeigh and Smith (1999) found that liberal and conservative Protestant groups in the United States were more likely to engage in institutionalized political action, but no more likely to participate in protest than those who had no religious affiliation. However, whether these individual-level results for Protestants apply in a global comparison has not been investigated.
Individual predictors. Drawing on past work, we control for a set of individual predictors that have been found relevant for protest potential. Gender, age, and education have been found by several studies to be relevant for predicting individual protest potential (Barnes and Kaase 1979; Crozat 1998; Dalton 2002; Jenkins and Wallace 1996; Kaase 1990; Martinez 2005; Wallace and Jenkins 1995). Women are typically less likely to engage in protest, which is seen as an aggressive form of political activity (but see Martinez 2005; Wallace and Jenkins 1995). Younger respondents, who tend to be more idealistic and have less material stake in society, are prone to engage in forms of activism that involve confrontation, and, hence, protest with the political establishment. This also taps the idea of generational change, that younger cohorts who come of political age during a period of affluence are more protest prone (Ingelhart 1990), a thesis that is only weakly supported by Kaase’s (1990) analysis of age cohorts. They are also more likely to be biographi-cally available, that is, unmarried and employed less than full-time (McAdam 1988; McAdam and Paulsen 1993; Nepstad and Smith 1999). We also control for religi-osity, which has been found in previous work (Crozat 1998; Wallace and Jenkins 1995) to lower protest potential. Since economic grievances may drive protest, we control for the level of satisfaction with one’s current financial situation. We also control for confidence in political institutions, reasoning that those who lack institutional confidence are more likely to protest authority (Dalton 2002; Ingelhart 1990). Finally, past research has also found that actors who participate in protest are likely to be politically engaged; that is, far from being alienated or nonparticipa-tory, they are typically interested in political issues, they keep abreast of politics through newspapers, radio, or other media outlets, and they talk to friends about politics on a regular basis. Moreover, they typically engage in conventional forms of political participation and seem to resort to protest actions only when they feel
FALL 2008 17
that conventional channels for achieving their goals have been exhausted (Crozat 1998; Jenkins and Wallace 1996; Wallace and Jenkins 1995).
In the analyses below, we address each of the three major macro-level expla-nations of contemporary social protest—economic, political, and cultural—while controlling for the acknowledged effects of individual-level factors. We now turn to a discussion of our data and methods.
Data and Methods
Data
Our individual-level variables were derived from the 1990 wave of the World Values Survey. This study was conducted to provide data on postmaterialist values and political action among respondents in forty-three countries throughout the world. However, eight countries failed to ask questions needed to construct the protest potential scale or other key individual-level variables, so our analysis is limited to thirty-five countries. We took steps to minimize missing data among respondents by using mean substitution for all variables except the dependent variable. This resulted in a Level 1 data set of 41,235 individuals nested in thirty-five countries. To this data set, we appended Level 2 (i.e., country-level) measures tapping the key theoretical dimensions identified above: affluence, political institutions and democratization, and ethnic/religious cleavages. Our primary interest is in iden-tifying macro-level processes affecting individual-level protest potential while controlling for acknowledged individual-level determinants.
Methods
Due to the multilevel nature of our data, we estimate hierarchical linear models using HLM6 (Raudenbush et al. 2004). Since we are using both individual and aggregate variables in our models, the clustering of individual observations within countries violates the assumption of independent errors in ordinary least squares and often leads to underestimated standard errors (DiPrete and Forristal 1994; Hox 2002; Raudenbush and Bryk 2002). HLM corrects for this possibility by explicitly incorporating the hierarchical data structure into the model. It relaxes the assumption of independent errors and relies on a variety of estimation techniques (empirical Bayes, generalized least squares, and maximum likelihood) for different types of parameters and levels of analysis (Mason, Wong, and Entwisle 1983). We use two-tailed tests of statistical significance throughout the analysis.
Dependent measure. Protest potential is measured using responses to four items in the 1990 World Values Survey as to whether respondents are willing to engage or have engaged in these forms of protest: boycotts, lawful demonstrations, unofficial strikes, and occupying buildings.1 After reverse coding, responses are as follows:
18 INTERNATIONAL JOURNAL OF SOCIOLOGY
1 = “would never do”; 2 = “might do”; and 3 = “have done.” We next converted these items into z-scores, then summed and divided by 4 to produce the protest potential scale. Considering that the protest potential scale was constructed across thirty-five very diverse societies, it had a fairly high reliability as indicated by a Cronbach’s alpha of 0.754. Additionally, the alphas for the protest scale within individual country samples are acceptable, ranging from 0.636 (East Germany) to 0.860 (Spain).2 Although some have taken an alternative approach focusing on the contentiousness of these actions by applying Guttman scaling (Barnes and Kaase 1979; Crozat 1998), these efforts have produced only marginal results. It is simpler and more defensible to treat these contentious political actions as separate indicators of an underlying construct that represents protest potential, which is supported by strong additive scaling results. Details about measurement and data sources for the protest potential scale and all other measures are provided in the Appendix.
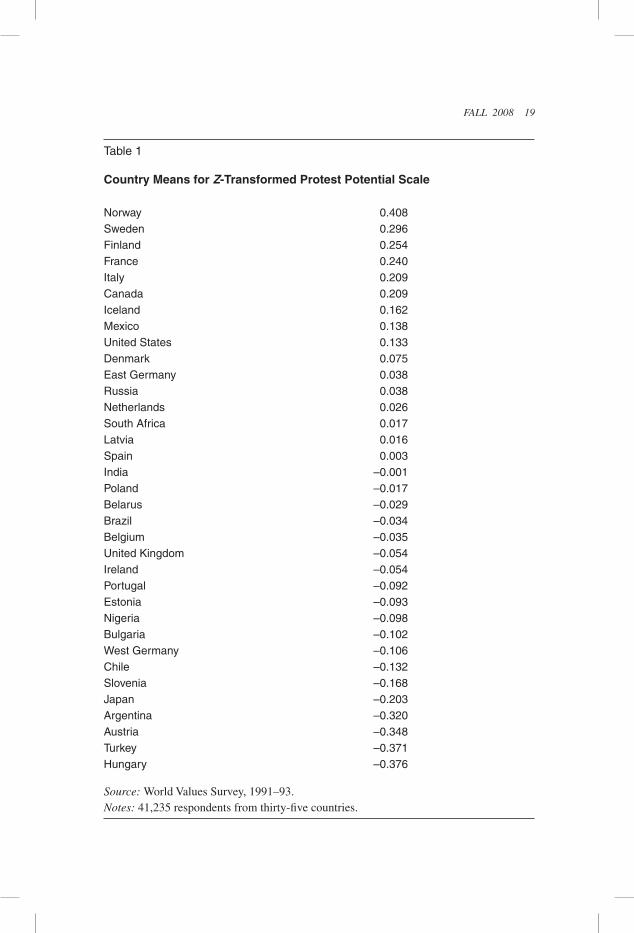
Table 1 provides the country means for the protest potential scale for the thirty-five countries in the analysis. We order these from the highest mean protest potential of 0.408 (Norway) to the lowest of –0.376 (Hungary). As mentioned earlier, these countries represent all of the major world regions with fifteen of Western Europe; all three countries of North America; three of South America; nine of Eastern Eu-rope; two of sub-Saharan Africa; two of Asia; and one of the Middle East/North Africa. While this oversamples Western developed countries, it provides sufficient diversity to capture major global patterns. All eighteen member countries of the Organization for Economic Cooperation and Development (OECD) countries are included and balanced with seventeen less developed countries. Use of the WVS 1990 wave has the virtue of tapping protest potential immediately at the end of the cold war and the major transitions in Eastern Europe.
Independent measures. We begin first with the macromeasures, which we analyze in three theory blocs to represent postindustrialism and affluence, political institu-tions, and ethnic/religious mix. In all of our models, we control for population size, based on 1990 country population (Heston, Summers, and Aten 2002). Population size captures otherwise unmeasured heterogeneity as well as tests the argument that larger countries create a more conducive context for protest. Respondents should feel constrained to avoid protest in small countries by virtue of a sense of small scale and accessibility to the political process.
To capture affluence, we use level of economic development as measured by real gross domestic product (GDP) per capita in 1990 (Heston, Summers, and Aten 2002; Laspeyres index) and average annual economic growth between 1980 and 1992 (Heston, Summer, and Aten 2002). We expect that both of these indicators of affluence should be positively related to protest potential. We include two measures of business cycle fluctuation, unemployment and inflation, both of which are measured as the annual mean for 1988–90 (IMF 2006). These measures of economic fluctuation can be interpreted in two ways. If economic hard times are sources of grievances, they should have positive effects on protest. If, instead, economic hardships undermine the accustomed prosperity of postmaterialist societies, greater unemployment and
FALL 2008 19
Table 1
Country Means for Z-Transformed Protest Potential Scale
Norway 0.408Sweden 0.296Finland 0.254France 0.240Italy 0.209Canada 0.209Iceland 0.162Mexico 0.138United States 0.133Denmark 0.075East Germany 0.038Russia 0.038Netherlands 0.026South Africa 0.017Latvia 0.016Spain 0.003India –0.001Poland –0.017Belarus –0.029Brazil –0.034Belgium –0.035United Kingdom –0.054Ireland –0.054Portugal –0.092Estonia –0.093Nigeria –0.098Bulgaria –0.102West Germany –0.106Chile –0.132Slovenia –0.168Japan –0.203Argentina –0.320Austria –0.348Turkey –0.371Hungary –0.376
Source: World Values Survey, 1991–93.Notes: 41,235 respondents from thirty-five countries.
20 INTERNATIONAL JOURNAL OF SOCIOLOGY
inflation should have negative effects on protest. To capture postindustrialism, we utilized a measure of women as a percentage of the labor force (World Bank 2005). Large-scale entry of women into the labor force typically parallels the growth of the service sector, which is one of the classic indicators of postindustrialism. We expect that this indicator will be positively associated with protest potential.3
One distinguishing component of the political structure when viewed cross-nationally is the presence and degree of corporatism. To capture this dimension, we utilize a measure of left corporatism, which is derived from Hicks and Kenworthy’s (1998: 1642–43) social democratic corporatism scale. This measure is a dummy variable coded 1 for countries that had both left-party control in the late 1980s and above average levels of neocorporatism.4 The legacy of communism is likely to affect the propensity for protest. Formerly communist regimes are likely to have strongly authoritarian tendencies stemming from the communist era with regard to civil expression, especially among the police. We therefore include a dummy vari-able representing postcommunist regimes that transitioned to fledgling democratic or semidemocratic regimes as the cold war wound down in the 1989–93 period (CIA 2001). This is a timely measure because about one-quarter of the countries in our analysis had recently transitioned from communism at the time of our study.
To capture the effects of democratization, we include years of continuous politi-cal democracy as based on Colomer (2001) and Reich (2002). The reintroduction of political democracy in northern Europe after World War II is treated as the starting point for the affected countries. The starting point for full democracy in the United States coincides with women receiving the right to vote in 1921. State capacity represents the “size” of the state and is gauged by real government spending as a percentage of real GDP (1990). We expect that larger states foster greater protest potential because the state is viewed as having the resources to resolve social griev-ances and because larger states serve as more visible targets.
Our third focus is on the cultural influence of ethnic and religious cleavages. We utilize measures of both ethnic political discrimination and ethnic economic discrimination. Each of these is measured as the percentage of the country popula-tion that is a minority group subjected to repressive or exclusionary policies (Gurr et al. 2000). These policies should generate ethnic grievances and thus greater protest potential. Ethnic dominance is tapped by the percent of the population that belongs to the largest ethnicity provided by Barrett, Kurian, and Johnson (2001). To tap the further complexity of ethnic cleavages, we use a measure of language dominance derived from Vanhanen’s (1999) measure of ethnic nepotism. This measure taps the degree to which a single group defined by language constitutes the dominant or majority group and thereby may discriminate against other groups.5 Percent Protestant is measured using indicators for 1990 from the World Christian Encyclopedia (Barrett, Kurian, and Johnson 2001).
In the HLM analyses reported below, we concentrate on the results for level 2 (i.e., country-level) effects as these are the primary focus of the article. However, all of these models control for level 1 (individual-level) variables that have been
FALL 2008 21
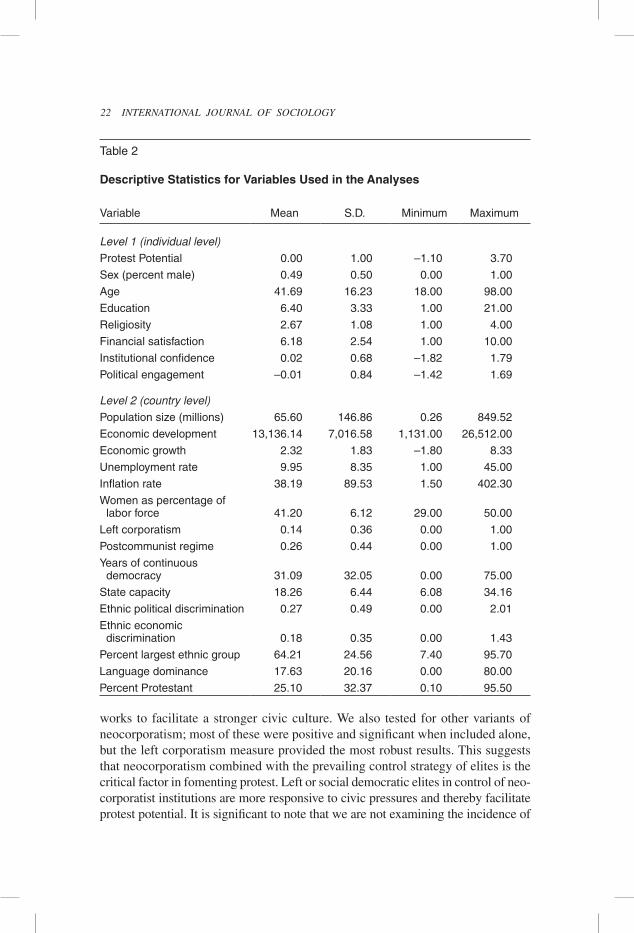
identified in previous research. These individual-level controls include the follow-ing: sex (1 = male; 0 = female), age, education, religiosity (an item that measures the importance of religion in one’s life on a scale from 1 = not at all important to 4 = very important), financial satisfaction (an item that measures the respondent’s financial satisfaction on a scale from 1 = dissatisfied to 10 = satisfied), institu-tional confidence (an index tapping respondents’ expressed confidence in fourteen societal institutions), and political engagement (a three-item index tapping degree of political interest and participation; alpha = 0.784). Descriptive statistics for all level 1 and level 2 variables are shown in Table 2.
Results
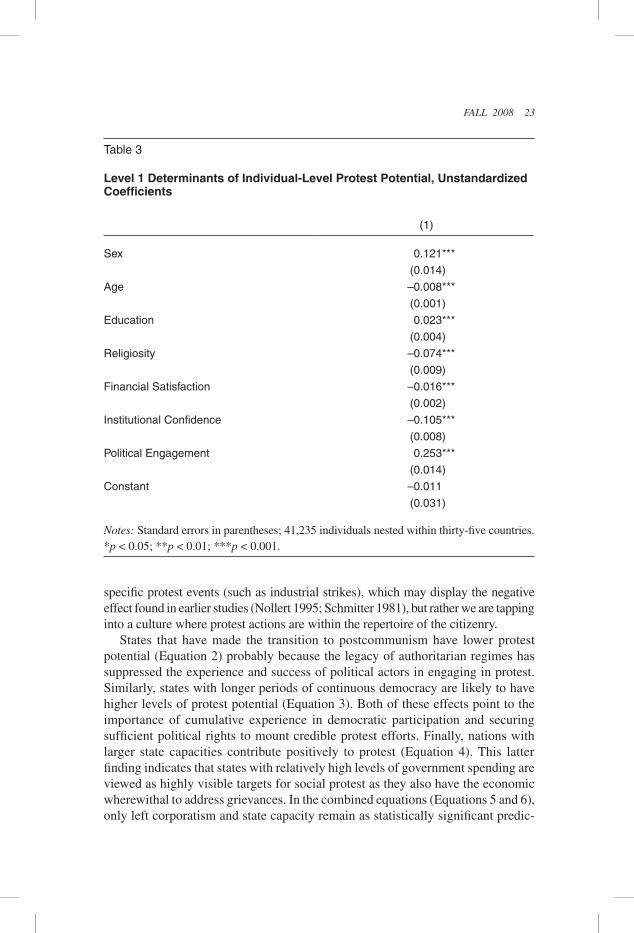
Table 3 provides the results of the individual effects, which mirror past studies. All are statistically significant in the predicted direction. Men, younger respondents, those with greater education, those who are less religious, those with greater financial dissatisfaction, lower institutional confidence, and higher levels of politi-cal engagement have more protest potential. These effects persist throughout the following analyses and are not discussed hereafter to save space.
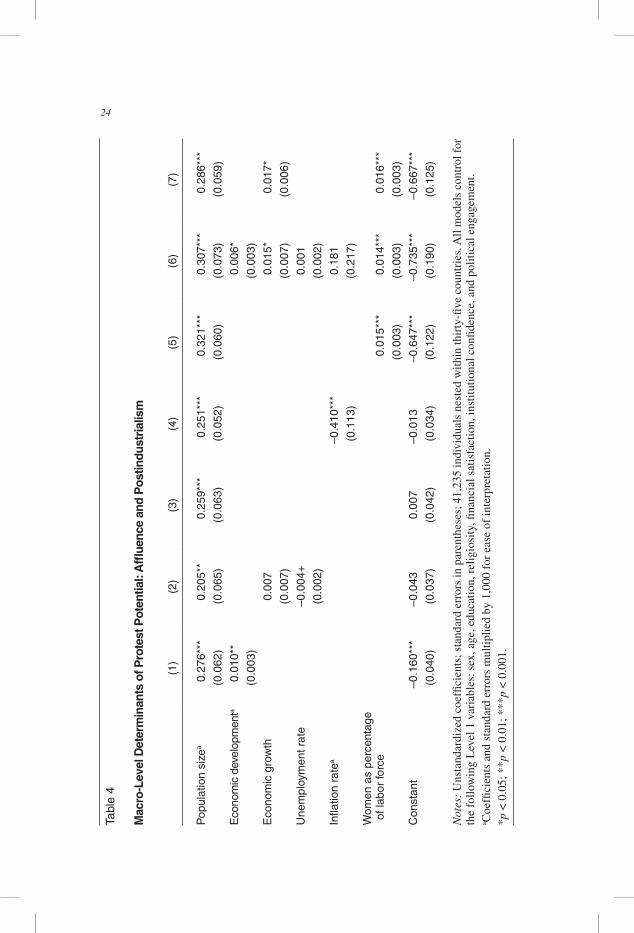
Table 4 shows the effects of affluence and postindustrialism on protest potential. We begin with stepped equations because our country-level n of thirty-five causes a significant risk of multicollinearity. In addition to a persistent positive effect of population size (indicating higher protest potential in larger societies), economic af-fluence as gauged by real GDP per capita contributes to protest potential (Equation 1). Economic growth’s positive effect is nonsignificant initially (Equation 2) but becomes statistically significant in the combined equation (Equation 6) as a fuller set of variables is specified. Unemployment (Equation 3) and inflation (Equation 4) are statistically significant and negative, supporting the affluence thesis that lower unemployment and inflation produce greater protest potential. Both of these disap-pear in the combined equation, indicating that they are less important than other economic factors. Women as a percentage of the total labor force is positive and statistically significant (Equation 5) and survives into the combined equation. We also tested the percentage of service sector employment, which was statistically significant in the predicted direction when included alone, but rendered nonsignifi-cant when women in the labor force was included in the same models. Equation 7 shows a model that combines the effects of the two consistently significant vari-ables, showing that affluence and women’s labor force participation are consistent sources of greater protest potential.
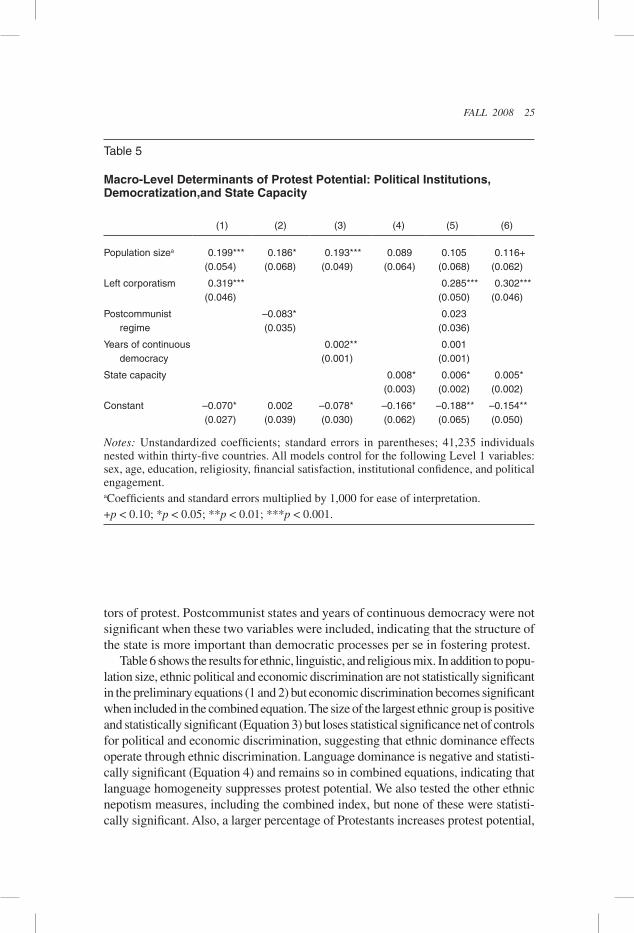
Table 5 shows the results of the political variables. In addition to controlling again for population size, left corporatism has a positive, significant effect on protest potential (Equation 1). Hence, contrary to the exclusion thesis, left corporatism encourages citizens to contemplate protest as a political strategy. This parallels research on welfare spending (Hicks 1999; Huber and Stephens 2001) and civic organizations (Schofer and Fourcade-Gourinchas 2001) where left corporatism
22 INTERNATIONAL JOURNAL OF SOCIOLOGY
works to facilitate a stronger civic culture. We also tested for other variants of neocorporatism; most of these were positive and significant when included alone, but the left corporatism measure provided the most robust results. This suggests that neocorporatism combined with the prevailing control strategy of elites is the critical factor in fomenting protest. Left or social democratic elites in control of neo-corporatist institutions are more responsive to civic pressures and thereby facilitate protest potential. It is significant to note that we are not examining the incidence of
Table 2
Descriptive Statistics for Variables Used in the Analyses
Variable Mean S.D. Minimum Maximum
Level 1 (individual level)Protest Potential 0.00 1.00 –1.10 3.70
Sex (percent male) 0.49 0.50 0.00 1.00
Age 41.69 16.23 18.00 98.00
Education 6.40 3.33 1.00 21.00
Religiosity 2.67 1.08 1.00 4.00
Financial satisfaction 6.18 2.54 1.00 10.00
Institutional confidence 0.02 0.68 –1.82 1.79
Political engagement –0.01 0.84 –1.42 1.69
Level 2 (country level)Population size (millions) 65.60 146.86 0.26 849.52
Economic development 13,136.14 7,016.58 1,131.00 26,512.00
Economic growth 2.32 1.83 –1.80 8.33
Unemployment rate 9.95 8.35 1.00 45.00
Inflation rate 38.19 89.53 1.50 402.30
Women as percentage of labor force 41.20 6.12 29.00 50.00
Left corporatism 0.14 0.36 0.00 1.00
Postcommunist regime 0.26 0.44 0.00 1.00
Years of continuous democracy 31.09 32.05 0.00 75.00
State capacity 18.26 6.44 6.08 34.16
Ethnic political discrimination 0.27 0.49 0.00 2.01
Ethnic economic discrimination 0.18 0.35 0.00 1.43
Percent largest ethnic group 64.21 24.56 7.40 95.70
Language dominance 17.63 20.16 0.00 80.00
Percent Protestant 25.10 32.37 0.10 95.50
FALL 2008 23
specific protest events (such as industrial strikes), which may display the negative effect found in earlier studies (Nollert 1995; Schmitter 1981), but rather we are tapping into a culture where protest actions are within the repertoire of the citizenry.
States that have made the transition to postcommunism have lower protest potential (Equation 2) probably because the legacy of authoritarian regimes has suppressed the experience and success of political actors in engaging in protest. Similarly, states with longer periods of continuous democracy are likely to have higher levels of protest potential (Equation 3). Both of these effects point to the importance of cumulative experience in democratic participation and securing sufficient political rights to mount credible protest efforts. Finally, nations with larger state capacities contribute positively to protest (Equation 4). This latter finding indicates that states with relatively high levels of government spending are viewed as highly visible targets for social protest as they also have the economic wherewithal to address grievances. In the combined equations (Equations 5 and 6), only left corporatism and state capacity remain as statistically significant predic-
Table 3
Level 1 Determinants of Individual-Level Protest Potential, Unstandardized Coefficients
(1)
Sex 0.121***
(0.014)
Age –0.008***
(0.001)
Education 0.023***
(0.004)
Religiosity –0.074***
(0.009)
Financial Satisfaction –0.016***
(0.002)
Institutional Confidence –0.105***
(0.008)
Political Engagement 0.253***
(0.014)
Constant –0.011
(0.031)
Notes: Standard errors in parentheses; 41,235 individuals nested within thirty-five countries.*p < 0.05; **p < 0.01; ***p < 0.001.
24 INTERNATIONAL JOURNAL OF SOCIOLOGYTa
ble
4
Mac
ro-L
evel
Det
erm
inan
ts o
f Pro
test
Pot
entia
l: A
fflue
nce
and
Pos
tindu
stri
alis
m
(1)
(2)
(3)
(4)
(5)
(6)
(7)
Pop
ulat
ion
size
a0.
276*
**0.
205*
*0.
259*
**0.
251*
**0.
321*
**0.
307*
**0.
286*
**
(0.0
62)
(0.0
65)
(0.0
63)
(0.0
52)
(0.0
60)
(0.0
73)
(0.0
59)
Eco
nom
ic d
evel
opm
enta
0.01
0**
0.00
6*
(0.0
03)
(0.0
03)
Eco
nom
ic g
row
th0.
007
0.01
5*0.
017*
(0.0
07)
(0.0
07)
(0.0
06)
Une
mpl
oym
ent r
ate
–0.0
04+
0.00
1
(0.0
02)
(0.0
02)
Infla
tion
rate
a–0
.410
***
0.18
1
(0.1
13)
(0.2
17)
Wom
en a
s pe
rcen
tage
of
labo
r fo
rce
0.01
5***
0.01
4***
0.01
6***
(0.0
03)
(0.0
03)
(0.0
03)
Con
stan
t–0
.160
***
–0.0
430.
007
–0.0
13–0
.647
***
–0.7
35**
*–0
.667
***
(0.0
40)
(0.0
37)
(0.0
42)
(0.0
34)
(0.1
22)
(0.1
90)
(0.1
25)
Not
es:
Uns
tand
ardi
zed
coef
ficie
nts;
sta
ndar
d er
rors
in p
aren
thes
es; 4
1,23
5 in
divi
dual
s ne
sted
with
in th
irty
-five
cou
ntri
es. A
ll m
odel
s co
ntro
l for
th
e fo
llow
ing
Lev
el 1
var
iabl
es: s
ex, a
ge, e
duca
tion,
rel
igio
sity
, fina
ncia
l sat
isfa
ctio
n, in
stitu
tiona
l con
fiden
ce, a
nd p
oliti
cal e
ngag
emen
t.a C
oeffi
cien
ts a
nd s
tand
ard
erro
rs m
ultip
lied
by 1
,000
for
eas
e of
inte
rpre
tatio
n.*p
< 0
.05;
**p
< 0
.01;
***
p <
0.0
01.
FALL 2008 25
tors of protest. Postcommunist states and years of continuous democracy were not significant when these two variables were included, indicating that the structure of the state is more important than democratic processes per se in fostering protest.
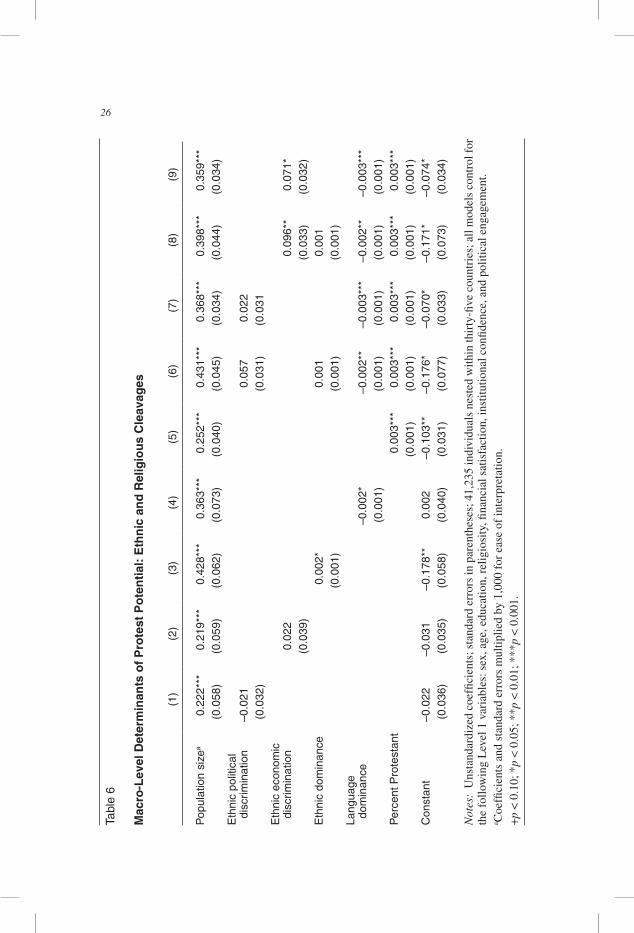
Table 6 shows the results for ethnic, linguistic, and religious mix. In addition to popu-lation size, ethnic political and economic discrimination are not statistically significant in the preliminary equations (1 and 2) but economic discrimination becomes significant when included in the combined equation. The size of the largest ethnic group is positive and statistically significant (Equation 3) but loses statistical significance net of controls for political and economic discrimination, suggesting that ethnic dominance effects operate through ethnic discrimination. Language dominance is negative and statisti-cally significant (Equation 4) and remains so in combined equations, indicating that language homogeneity suppresses protest potential. We also tested the other ethnic nepotism measures, including the combined index, but none of these were statisti-cally significant. Also, a larger percentage of Protestants increases protest potential,
Table 5
Macro-Level Determinants of Protest Potential: Political Institutions, Democratization,and State Capacity
(1) (2) (3) (4) (5) (6)
Population sizea 0.199*** 0.186* 0.193*** 0.089 0.105 0.116+(0.054) (0.068) (0.049) (0.064) (0.068) (0.062)
Left corporatism 0.319*** 0.285*** 0.302***(0.046) (0.050) (0.046)
Postcommunist –0.083* 0.023regime (0.035) (0.036)
Years of continuous 0.002** 0.001democracy (0.001) (0.001)
State capacity 0.008* 0.006* 0.005*(0.003) (0.002) (0.002)
Constant –0.070* 0.002 –0.078* –0.166* –0.188** –0.154**(0.027) (0.039) (0.030) (0.062) (0.065) (0.050)
Notes: Unstandardized coefficients; standard errors in parentheses; 41,235 individuals nested within thirty-five countries. All models control for the following Level 1 variables: sex, age, education, religiosity, financial satisfaction, institutional confidence, and political engagement.aCoefficients and standard errors multiplied by 1,000 for ease of interpretation.+p < 0.10; *p < 0.05; **p < 0.01; ***p < 0.001.
26 INTERNATIONAL JOURNAL OF SOCIOLOGYTa
ble
6
Mac
ro-L
evel
Det
erm
inan
ts o
f P
rote
st P
ote
nti
al:
Eth
nic
an
d R
elig
iou
s C
leav
ages
(1)
(2)
(3)
(4)
(5)
(6)
(7)
(8)
(9)
Pop
ulat
ion
size
a0.
222*
**0.
219*
**0.
428*
**0.
363*
**0.
252*
**0.
431*
**0.
368*
**0.
398*
**0.
359*
**(0
.058
)(0
.059
)(0
.062
)(0
.073
)(0
.040
)(0
.045
)(0
.034
)(0
.044
)(0
.034
)E
thni
c po
litic
al
disc
rimin
atio
n–0
.021
0.05
70.
022
(0.0
32)
(0.0
31)
(0.0
31E
thni
c ec
onom
ic
disc
rimin
atio
n0.
022
0.09
6**
0.07
1*(0
.039
)(0
.033
)(0
.032
)E
thni
c do
min
ance
0.00
2*0.
001
0.00
1(0
.001
)(0
.001
)(0
.001
)La
ngua
ge
dom
inan
ce–0
.002
*–0
.002
**–0
.003
***
–0.0
02**
–0.0
03**
*(0
.001
)(0
.001
)(0
.001
)(0
.001
)(0
.001
)P
erce
nt P
rote
stan
t0.
003*
**0.
003*
**0.
003*
**0.
003*
**0.
003*
**(0
.001
)(0
.001
)(0
.001
)(0
.001
)(0
.001
)C
onst
ant
–0.0
22–0
.031
–0.1
78**
0.00
2–0
.103
**–0
.176
*–0
.070
*–0
.171
* –0
.074
*(0
.036
)(0
.035
)(0
.058
)(0
.040
)(0
.031
)(0
.077
)(0
.033
)(0
.073
)(0
.034
)
Not
es:
Uns
tand
ardi
zed
coef
ficie
nts;
sta
ndar
d er
rors
in p
aren
thes
es; 4
1,23
5 in
divi
dual
s ne
sted
with
in th
irty
-five
cou
ntri
es; a
ll m
odel
s co
ntro
l for
th
e fo
llow
ing
Lev
el 1
var
iabl
es: s
ex, a
ge, e
duca
tion,
rel
igio
sity
, fina
ncia
l sat
isfa
ctio
n, in
stitu
tiona
l con
fiden
ce, a
nd p
oliti
cal e
ngag
emen
t. a C
oeffi
cien
ts a
nd s
tand
ard
erro
rs m
ultip
lied
by 1
,000
for
eas
e of
inte
rpre
tatio
n.+
p <
0.1
0; *
p <
0.0
5; *
*p <
0.0
1; *
**p
< 0
.001
.
FALL 2008 27
which remains statistically significant in the combined equation (5). In the combined equations (6, 7, and 8), ethnic economic discrimination, language dominance, and percent Protestant emerge as the key predictors of protest potential.
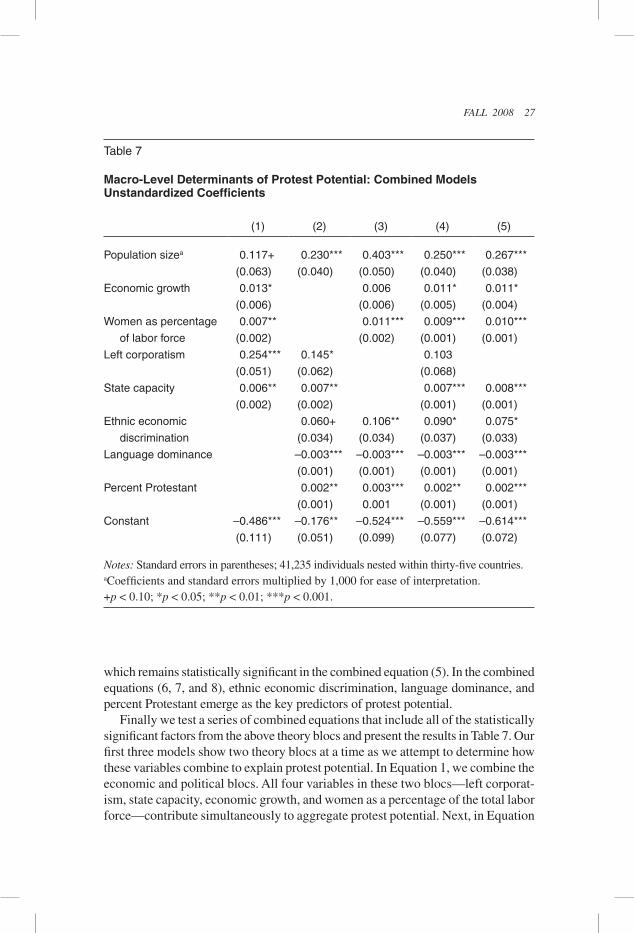
Finally we test a series of combined equations that include all of the statistically significant factors from the above theory blocs and present the results in Table 7. Our first three models show two theory blocs at a time as we attempt to determine how these variables combine to explain protest potential. In Equation 1, we combine the economic and political blocs. All four variables in these two blocs—left corporat-ism, state capacity, economic growth, and women as a percentage of the total labor force—contribute simultaneously to aggregate protest potential. Next, in Equation
Table 7
Macro-Level Determinants of Protest Potential: Combined Models Unstandardized Coefficients
(1) (2) (3) (4) (5)
Population sizea 0.117+ 0.230*** 0.403*** 0.250*** 0.267***
(0.063) (0.040) (0.050) (0.040) (0.038)
Economic growth 0.013* 0.006 0.011* 0.011*
(0.006) (0.006) (0.005) (0.004)
Women as percentage 0.007** 0.011*** 0.009*** 0.010***
of labor force (0.002) (0.002) (0.001) (0.001)
Left corporatism 0.254*** 0.145* 0.103
(0.051) (0.062) (0.068)
State capacity 0.006** 0.007** 0.007*** 0.008***
(0.002) (0.002) (0.001) (0.001)
Ethnic economic 0.060+ 0.106** 0.090* 0.075*
discrimination (0.034) (0.034) (0.037) (0.033)
Language dominance –0.003*** –0.003*** –0.003*** –0.003***
(0.001) (0.001) (0.001) (0.001)
Percent Protestant 0.002** 0.003*** 0.002** 0.002***
(0.001) 0.001 (0.001) (0.001)
Constant –0.486*** –0.176** –0.524*** –0.559*** –0.614***
(0.111) (0.051) (0.099) (0.077) (0.072)
Notes: Standard errors in parentheses; 41,235 individuals nested within thirty-five countries.aCoefficients and standard errors multiplied by 1,000 for ease of interpretation.+p < 0.10; *p < 0.05; **p < 0.01; ***p < 0.001.
28 INTERNATIONAL JOURNAL OF SOCIOLOGY
2, we combine political and cultural theory blocs and find that left corporatism and state capacity are statistically significant along with ethnic economic discrimina-tion, language dominance, and percent Protestant. In Equation 3, combining the economic and cultural variables, we find that women as a percentage of the labor force, ethnic economic discrimination, language dominance, and percent Protestant maintain their significance, but only economic growth becomes nonsignificant. In Equation 4, we add all three theory blocs at once. Here, economic growth returns to statistical significance. All other variables remain statistically significant except for left corporatism. In Equation 5, we drop left corporatism and rerun the models. Our final model indicates that protest potential is positively and significantly im-pacted by population size, economic growth, women as a percentage of the labor force, state capacity, ethnic economic discrimination, and percent Protestant and negatively affected by language dominance. Aggregate protest potential is the result of postindustrialism and affluence, large states, grievances stemming from ethnic discrimination, Protestantism, and language dominance. In analyses not shown here, we also experimented by adding each of the other variables in previous tables to the model in Equation 5 but none of these were statistically significant.
Conclusions
Our results suggest the development of a “social movement society” in which protest has become a routine way of political bargaining. Postindustrialism and affluence contribute to this potential for protest. The growth of women’s participation in the labor force has reduced gender differences in protest and is associated with the growth of the service economy. Employment makes women more like men in regard to political action (Jenkins and Wallace 1996; Wallace and Jenkins 1995) and thus more protest prone. A service economy and affluence mean that citizens are more likely to support postmaterialist values and display greater willingness to engage in protest.
A second force contributing to protest potential is the prevailing control strategy of a left party in control of a neocorporatist state. Neocorporatism alone is less relevant than when it is coupled in this type of regime with left-party elites, who are more responsive to citizen demands and thereby foster greater protest potential. A larger state also provides a centralized target for protest as well as fosters the perception that the state is capable of responding. Recently transitioned postcom-munist regimes dampen protest potential. The longer political democracy has been in place, the greater the protest potential. In sum, political opportunities associated with left-party control, democratization, and a large state facilitate protest potential.
Protest potential is also rooted in ethnic grievances, which appear to stem from ethnic dominance as well as economic discrimination. At the same time, countries with a more dominant single language display lower protest potential. This suggests that linguistic homogeneity dampens protest potential while ethnic discrimination
FALL 2008 29
linked to ethnic dominance fuels it. Protestantism continues to fuel protest potential, presumably because it contributes to a proactive civic culture in which citizens feel empowered to act directly in politics. They go beyond conventional voting and influence methods to be willing to engage in protest and other measures to directly express their views.
The extent to which this “social movement society” is growing is unclear. Comparing multiple panels of World Values data and the Political Action Project data suggests that willingness to engage in more conventional forms of protest has grown in some Western democracies (Crozat 1998; Kaase 1990) and gener-ally increases over time in Dalton and van Sickle’s (2005) measures. Potential for violence and disruptive protest, however, has declined or grown only in a few countries (such as the United States). Future research should address whether protest potential or components of it have actually grown globally in response to democratization, the globalization of mass media, increasing global economic integration, and similar trends. Does the growth of women’s labor force partici-pation and the service industry likewise increase protest potential? Have ethnic grievances grown or become muted in the post–cold war era? Would a broader cross-section of countries with greater representation of South America, Asia, and Africa yield substantially different results? The 2000 and 2005 waves of the World Values project make it feasible to address these and related questions in future research.
Notes
1. We excluded a fifth item about the signing of petitions as it does not represent the degree of contentiousness of these other actions and its inclusion severely weakened the reliability of the protest potential scale.
2. Cronbach’s alphas for the protest potential scale within each of the country samples (from lowest to highest) are as follows: East Germany 0.636; India 0.659; Nigeria 0.661; Portugal 0.669; Slovenia 0.671; Russia 0.678; Belarus 0.686; Iceland 0.687; Brazil 0.687; Latvia 0.688; Estonia 0.693; Hungary 0.697; Sweden 0.704; Norway 0.705; United Kingdom 0.710; Austria 0.727; Denmark 0.743; Japan 0.748; Turkey 0.748; Ireland 0.756; United States 0.758; Finland 0.766; Italy 0.773; Chile 0.780; Bulgaria 0.780; Canada 0.787; West Germany 0.793; Netherlands 0.793; Argentina 0.798; South Africa 0.810; France 0.825; Belgium 0.827; Mexico 0.841; Poland 0.843; and Spain 0.860.
3. In analyses not shown in this article, we also controlled for the percentage of the labor force in the service sector. Consistent with the postindustrialism argument, this measure generally had a positive effect on protest potential, but it tended to become nonsignificant when percentage of women in the labor force was included in the same models.
4. Here again, we experimented with several alternative measures of corporatism that are available in the literature, including, for example, Crepaz’s (1992: 149) measure, which is a derivation of twelve prior studies of neocorporatism. All of these measures yielded similar results, but the left corporatism measure provided the most robust results.
5. Vanhanen’s (1999) composite measure of ethnic nepotism taps dominance by race, religion, and language. The analyses shown in this article focus only on the language dimen-sion of Vanhanen’s measure.
30 INTERNATIONAL JOURNAL OF SOCIOLOGY
References
Barnes, Samuel, and Max Kaase. 1979. Political Action. Beverly Hills, CA: Sage.Barrett, David B.; George T. Kurian; and Todd M. Johnson. 2001. World Christian
Encyclopedia. New York: Oxford University Press.Brand, Karl Werner. 1993. The Political Culture of the New Social Movements. NewYork:
St. Martin’s Press.Central Intelligence Agency (CIA). 2001. CIA World Factbook. Washington, DC:
Government Printing Office.Colomer, Joseph. 2001. Political Institutions: Democracy and Social Choice. New York:
Oxford University Press.Crepaz, M.L. 1992. “Corporatism in Decline?” Comparative Political Studies 24: 139–
68.Crozat, Matthew. 1998. “Are the Times A-Changin’? Assessing the Acceptance of Protest
in Western Democracies.” In A Social Movement Society, ed. D.S. Meyer and S. Tarrow, 59–81. Lanham, MD: Rowman and Littlefield.
Dalton, Russell. 2002. Citizen Politics. 3d ed. Chatham, NJ: Chatham House.Dalton, Russell, and Alexis van Sickle. 2005. “The Resource, Structural and Cultural
Bases of Protest.” Center for the Study of Democracy Paper no. 0511. University of California Irvine.
Della Porta, Donatella, and Mario Diani. 1999. Social Movements: An Introduction. Boston: Blackwell.
———. 2006. Social Movements: An Introduction. 2d ed. Boston: Blackwell.DiPrete, Thomas A., and Jerry D. Forristal. 1994. “Multilevel Models: Methods and
Substance.” Annual Review of Sociology 20: 331–57.Flam, Helena. 1994. “Political Response to the Anti-Nuclear Challenge.” In States and
Anti-Nuclear Movements, ed. Flam, 329–54. Edinburgh: Edinburgh University Press.Gurr, Ted R. 1989a. “Protest and Rebellion in the 1960s.” In Violence in America, ed.
Gurr, 101–30. Beverly Hills, CA: Sage.———. 1989b. Minorities at Risk. Washington, DC: U.S. Institute for Peace.Gurr, Ted R., and Barbara Harff. 1994. Ethnic Conflict in World Politics. Boulder, CO:
Westview.Gurr, Ted R.; Monty Marshall; Anne Pitsch; and Deepa Khosla. 2000. The Minorities at
Risk Project: Phase III. College Park, MD: Center for International Development and Conflict Management, University of Maryland.
Heston, Alan; Robert Summers; and Bettina Aten. 2002. Penn World Table Version 6.1. Center for International Comparisons, University of Pennsylvania (CICUP) (October).
Hicks, Alexander. 1999. Social Democracy and Welfare Capitalism. Ithaca: Cornell University Press.
Hicks, Alexander, and Lane Kenworthy. 1998. “Cooperative Institutions and Political Economic Performance in Affluent Capitalism.” American Journal of Sociology 103: 1632–72.
Hox, Joop. 2002. Multilevel Analysis: Techniques and Applications. Mahwah, NJ: Erlbaum.Huber, Evelyne, and John D. Stephens. 2001. Development and Crisis of the Welfare
State. Chicago: University of Chicago Press.Inglehart, Ronald. 1990. Culture Shift in Advanced Industrial Society. Princeton:
Princeton University Press.———. 1997. Modernization and Post-Modernization. Princeton: Princeton University
Press.International Monetary Fund (IMF). 2006. “Balance of Payments Statistics.”
Washington, DC.
FALL 2008 31
Jenkins, J. Craig, and Augustine Kposowa. 1990. “Explaining Military Coups: Black Africa 1956–1984.” American Sociological Review 55: 861–75.
Jenkins, J. Craig, and Michael Wallace. 1996. “The Generalized Action Potential of Social Movements.” Sociological Forum 11: 183–207.
Joppke, Christian. 1993. Mobilizing Against Nuclear Energy. Berkeley: University of California Press.
Kaase, Max. 1990. “Mass Participation.” In Continuities in Political Action, ed. M.K. Jennings, J.W. van Deth, and S. Barnes, 23–66. New York: de Gruyter.
Katzenstein, Peter. 1985. Small States in World Markets. Ithaca: Cornell University Press.Klandermans, Bert. 1997. The Social Psychology of Protest. Malden, MA: Blackwell.Kriesi, Hanpeter. 1995. “The Political Opportunity Structure of New Social Movements.”
In The Politics of Social Protest, ed. J.C. Jenkins and B. Klandermans, 167–98. Minneapolis: University of Minnesota Press.
Kriesi, Hanpeter; Ruud Koopmans; Jan-Willem Duyvendak; and Marco Guigni. 1995. The New Social Movements of Western Europe. Minneapolis: University of Minnesota Press.
Lipset, Seymour Martin. 1994. “The Social Requisites of Democracy Revisited.” American Sociological Review 59: 1–22.
Mason, William M.; George Y. Wong; and Barbara Entwisle. 1983. “Contextual Analysis Through the Multilevel Linear Model.” Sociological Methodology 14: 72–103.
Marsh, Alan. 1977. Protest and Political Consciousness. Newbury Park, CA: Sage.Martinez, Lisa M. 2005. “Yes We Can: Latino Participation in Unconventional Politics.”
Social Forces 84: 135–55.McAdam, Doug. 1988. Freedom Summer. New York: Oxford University Press.McAdam, Doug, and Ronnelle Paulson. 1993. “Specifying the Relationship Between
Social Ties and Activism.” American Journal of Sociology 99: 640–67.McAdam, Douglas. 1982. Political Process and the Development of Black Insurgency,
1930–1970. Chicago: University of Chicago Press.McVeigh, Rory, and Christian Smith. 1999. “Who Protests in America: An Analysis
of Three Political Alternatives—Inaction, Institutionalized Politics, or Protest.” Sociological Forum 14: 685–702.
Meyer, David S., and Sidney Tarrow, ed. 1998. The Social Movement Society. Lanham, MD: Rowman and Littlefield.
Nelson, Hart M.; Raytha L. Yokley; and Thoms W. Madron. 1973. “Ministerial Roles and Social Actionist Stance: Protestant Clergy and Protest in the Sixties.” American Sociological Review 38: 375–86.
Nepstad, Sharon E. 2001. “The Social Structure of Moral Outrage in Recruitment to the U.S. Central America Peace Movement.” In Passionate Politics, ed. J. Goodwin, J.M. Jasper, and F. Polletta, 158–74. Chicago: University of Chicago Press.
Nepstad, Sharon E., and Christian Smith. 1999. “Rethinking Recruitment to High-Risk/Cost Activism.” Mobilization 4: 24–40.
Nollert, Michael. 1995. “Neocorporatism and Political Protest in the Western Democracies.” In The Politics of Social Protest, ed. J. C. Jenkins and B. Klandermans, 138–64. Minneapolis: University of Minnesota Press.
Norris, Pippa. 1999. Critical Citizens. New York: Oxford University Press.Raudenbush, Stephen W., and Anthony S. Bryk. 2002. Hierarchical Linear Models:
Applications and Data Analysis Methods. 2d ed. Thousand Oaks, CA: Sage.Raudenbush, Stephen; Anthony Bryk; Yuk Fai Cheong; and Richard Congdon. 2004.
HLM 6: Hierarchical Linear and Nonlinear Modeling. Lincolnwood, IL: Scientific Software International.
Reich, Gary. 2002. “Categorizing Political Regimes.” Democratization 9: 1–24.
32 INTERNATIONAL JOURNAL OF SOCIOLOGY
Reiter, Herbert. 1998. “Police and Public Order in Italy, 1944–1948.” In Policing Protest, ed. D. della Porta and H. Reiter, 143–64. Minneapolis: University of Minnesota Press.
Schofer, Evan, and Marion Fourcade-Gourinchas. 2001. “Political and Cultural Bases of Civic Engagement in Comparative Perspective.” American Sociological Review 66: 806–28.
Schmitter, Phillipe. 1981. “Interest Intermediation and Regime Governability in Contemporary Western Europe and North America.” In Organized Interests in Western Europe, ed. S. Berger, 287–327. New York: Cambridge University Press.
Smith, Christian. 1991. The Emergence of Liberation Theology: Radical Religion and Social Movement Theory. Chicago: University of Chicago Press.
———. 1996. Disruptive Religion: The Force of Faith in Social Movement Activism. New York: Routledge.
Tarrow, Sidney. 1998. Power in Movement. New York: Cambridge University Press.Tilly, Charles. 1978. From Mobilization to Revolution. Reading, MA: Addison-Wesley.———. 2004. Contention & Democracy in Europe, 1650–2000. New York: Cambridge
University Press.Tilly, Charles, and Sidney Tarrow. 2007. Contentious Politics. Boulder, CO: Paradigm.Vanhanen, Tutu. 1999. “Domestic Ethnic Conflict and Ethnic Nepotism: A Comparative
Analysis.” Journal of Peace Research 36: 55–73.Wallace, Michael, and J. Craig Jenkins. 1995. “The New Class, Postindustrialism
and Neocorporatism.” In The Politics of Social Protest, ed. J.C. Jenkins and B. Klandermans, 96–137. Minneapolis: University of Minnesota Press.
Wilson, Frank. 1990. “Neo-corporatism and the Rise of New Social Movements.” In Challenging the Political Order, ed. R. J. Dalton and M. Kuechler, 67–83. Cambridge, UK: Polity Press.
World Bank. 2005. World Development Indicators. Washington, DC.Zald, Mayer, and John McCarthy. 1987. “Religious Groups as Crucibles of Social
Movements.” In Social Movements in an Organizational Society, ed. Zald and McCarthy, 67–95. New Brunswick, NJ: Transaction.
FALL 2008 33
Appendix
Measurement of Variables
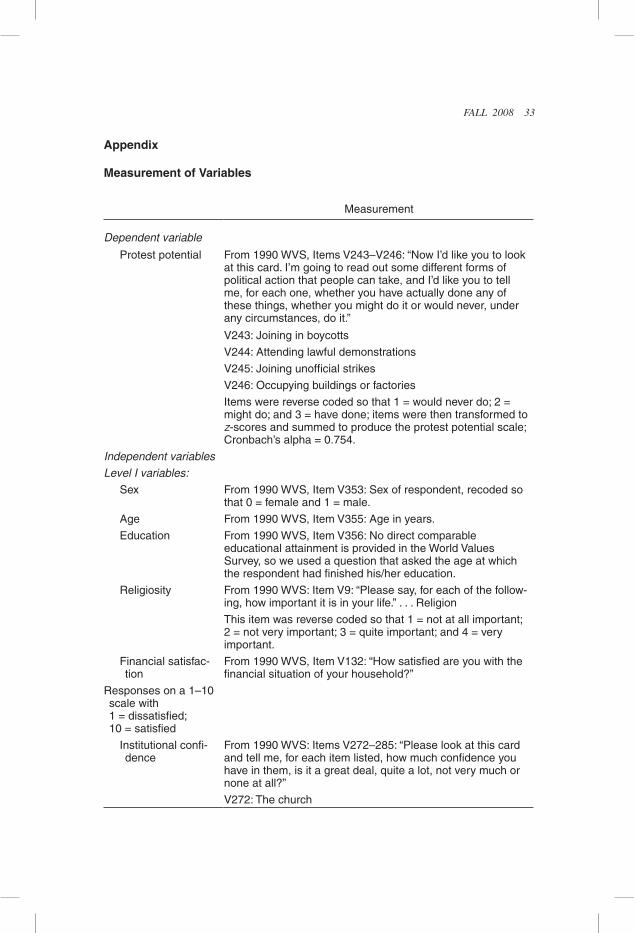
Measurement
Dependent variable
Protest potential From 1990 WVS, Items V243–V246: “Now I’d like you to look at this card. I’m going to read out some different forms of political action that people can take, and I’d like you to tell me, for each one, whether you have actually done any of these things, whether you might do it or would never, under any circumstances, do it.”
V243: Joining in boycotts
V244: Attending lawful demonstrations
V245: Joining unofficial strikes
V246: Occupying buildings or factories
Items were reverse coded so that 1 = would never do; 2 = might do; and 3 = have done; items were then transformed to z-scores and summed to produce the protest potential scale; Cronbach’s alpha = 0.754.
Independent variablesLevel I variables:
Sex From 1990 WVS, Item V353: Sex of respondent, recoded so that 0 = female and 1 = male.
Age From 1990 WVS, Item V355: Age in years.
Education From 1990 WVS, Item V356: No direct comparable educational attainment is provided in the World Values Survey, so we used a question that asked the age at which the respondent had finished his/her education.
Religiosity From 1990 WVS: Item V9: “Please say, for each of the follow-ing, how important it is in your life.” . . . Religion
This item was reverse coded so that 1 = not at all important; 2 = not very important; 3 = quite important; and 4 = very important.
Financial satisfac-tion
From 1990 WVS, Item V132: “How satisfied are you with the financial situation of your household?”
Responses on a 1–10 scale with 1 = dissatisfied; 10 = satisfied
Institutional confi-dence
From 1990 WVS: Items V272–285: “Please look at this card and tell me, for each item listed, how much confidence you have in them, is it a great deal, quite a lot, not very much or none at all?”
V272: The church
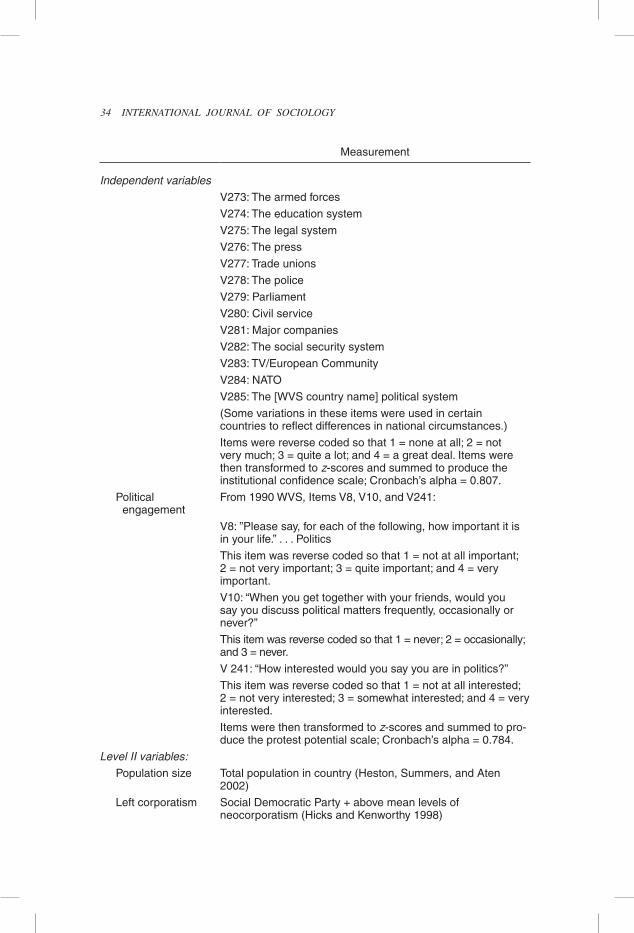
34 INTERNATIONAL JOURNAL OF SOCIOLOGY
Measurement
Independent variablesV273: The armed forces
V274: The education system
V275: The legal system
V276: The press
V277: Trade unions
V278: The police
V279: Parliament
V280: Civil service
V281: Major companies
V282: The social security system
V283: TV/European Community
V284: NATO
V285: The [WVS country name] political system
(Some variations in these items were used in certain countries to reflect differences in national circumstances.)
Items were reverse coded so that 1 = none at all; 2 = not very much; 3 = quite a lot; and 4 = a great deal. Items were then transformed to z-scores and summed to produce the institutional confidence scale; Cronbach’s alpha = 0.807.
Political engagement
From 1990 WVS, Items V8, V10, and V241:
V8: ”Please say, for each of the following, how important it is in your life.” . . . Politics
This item was reverse coded so that 1 = not at all important; 2 = not very important; 3 = quite important; and 4 = very important.
V10: “When you get together with your friends, would you say you discuss political matters frequently, occasionally or never?”
This item was reverse coded so that 1 = never; 2 = occasionally; and 3 = never.
V 241: “How interested would you say you are in politics?”
This item was reverse coded so that 1 = not at all interested; 2 = not very interested; 3 = somewhat interested; and 4 = very interested.
Items were then transformed to z-scores and summed to pro-duce the protest potential scale; Cronbach’s alpha = 0.784.
Level II variables:Population size Total population in country (Heston, Summers, and Aten
2002)
Left corporatism Social Democratic Party + above mean levels of neocorporatism (Hicks and Kenworthy 1998)
FALL 2008 35
Measurement
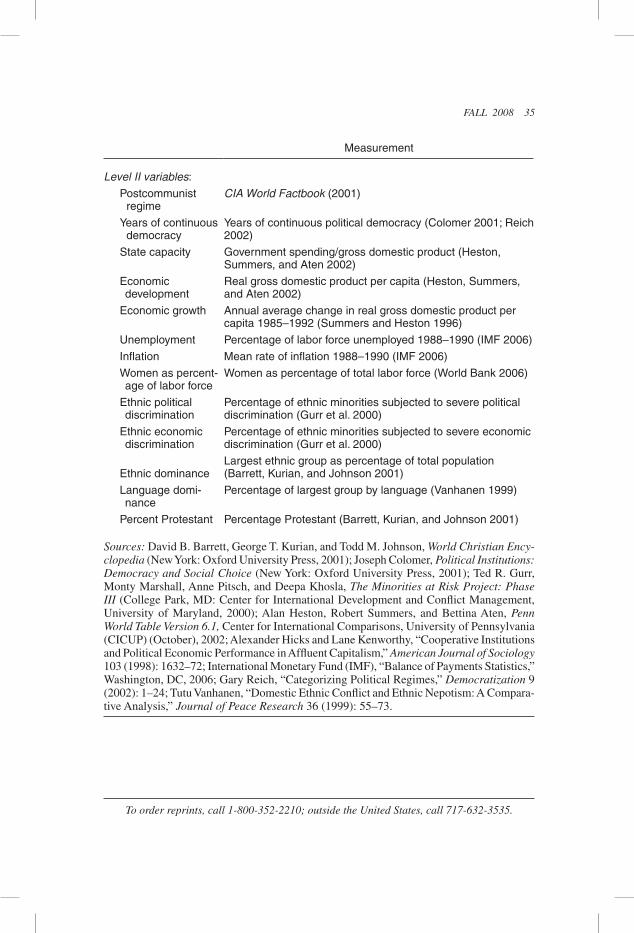
Level II variables:
Postcommunist regime
CIA World Factbook (2001)
Years of continuous democracy
Years of continuous political democracy (Colomer 2001; Reich 2002)
State capacity Government spending/gross domestic product (Heston, Summers, and Aten 2002)
Economic development
Real gross domestic product per capita (Heston, Summers, and Aten 2002)
Economic growth Annual average change in real gross domestic product per capita 1985–1992 (Summers and Heston 1996)
Unemployment Percentage of labor force unemployed 1988–1990 (IMF 2006)
Inflation Mean rate of inflation 1988–1990 (IMF 2006)
Women as percent-age of labor force
Women as percentage of total labor force (World Bank 2006)
Ethnic political discrimination
Percentage of ethnic minorities subjected to severe political discrimination (Gurr et al. 2000)
Ethnic economic discrimination
Percentage of ethnic minorities subjected to severe economic discrimination (Gurr et al. 2000)
Ethnic dominanceLargest ethnic group as percentage of total population (Barrett, Kurian, and Johnson 2001)
Language domi-nance
Percentage of largest group by language (Vanhanen 1999)
Percent Protestant Percentage Protestant (Barrett, Kurian, and Johnson 2001)
Sources: David B. Barrett, George T. Kurian, and Todd M. Johnson, World Christian Ency-clopedia (New York: Oxford University Press, 2001); Joseph Colomer, Political Institutions: Democracy and Social Choice (New York: Oxford University Press, 2001); Ted R. Gurr, Monty Marshall, Anne Pitsch, and Deepa Khosla, The Minorities at Risk Project: Phase III (College Park, MD: Center for International Development and Conflict Management, University of Maryland, 2000); Alan Heston, Robert Summers, and Bettina Aten, Penn World Table Version 6.1, Center for International Comparisons, University of Pennsylvania (CICUP) (October), 2002; Alexander Hicks and Lane Kenworthy, “Cooperative Institutions and Political Economic Performance in Affluent Capitalism,” American Journal of Sociology 103 (1998): 1632–72; International Monetary Fund (IMF), “Balance of Payments Statistics,” Washington, DC, 2006; Gary Reich, “Categorizing Political Regimes,” Democratization 9 (2002): 1–24; Tutu Vanhanen, “Domestic Ethnic Conflict and Ethnic Nepotism: A Compara-tive Analysis,” Journal of Peace Research 36 (1999): 55–73.
To order reprints, call 1-800-352-2210; outside the United States, call 717-632-3535.