a simulation model of a reactor for ethylene oxide production · ethylene oxide was first prepared...
TRANSCRIPT

Postal address Visiting address Telephone P.O. Box 124 Getingevägen 60 +46 46-222 82 85 SE-221 00 Lund, Sweden +46 46-222 00 00 Web address Telefax www.chemeng.lth.se +46 46-222 45 26
A Simulation Model of a reactor for Ethylene Oxide production
by
Hanna Perzon
Department of Chemical Engineering Lund University
June 2015
Supervisor: Assoc. Prof. Christian Hulteberg Co-supervisor: Andreas Friborg Examiner: Assoc. Prof. Mats Galbe

Preface
This thesis has been done at the chemical department of Chemical Engineering at Lund’s University together with AkzoNobel. All the work has been performed at the process department at AkzoNobel in Stenungsund.
I would like to thank AkzoNobel and especially Hendrik van Dam, the manager of the process department how gave me the opportunity to perform the thesis at AkzoNobel. I would like to thank Johan Andersson and the other members and of the process team for all the help during this time.
Special thanks I want to give to my Co-Supervisor, Andreas Friborg at Hansson & Friborg Process Engineering. Andreas has been a great support by contributing with his great knowledge, infinite patience and kindness.
I would also like to thank my supervisor at Lund’s University, Christian Hulteberg for his support during this time.
Last, I would like to thank my family and friends for your support and patient during this time.
Hanna Perzon June 2015 Lund

Abstract This thesis has been performed in the ethylene oxide plant at Akzo Nobel in Stenungsund. Ethylene oxide is an important ethylene based intermediary compound. The primary use for ethylene oxide is in the manufacture of derivatives such as ethylene glycol, surfactants and ethanolamine’s. In the production of ethylene oxide, ethylene and oxygen reacts over a silver catalyst surface. Mainly two reactions occur, partial oxidation of ethylene to ethylene oxide and total oxidation of ethylene to carbon dioxide and water. The largest cost in production of ethylene oxide is ethylene therefore it’s important to optimize the selectivity towards ethylene oxide and thus reduce the consumption of ethylene.
The aim with this thesis was to create a simulation model of the reactor using Aspen Plus® that correlates with reality. This model is then going to be a tool for future investigations of replacements of catalysts. Initially a literature study was made to increase the understanding of the chemical substance present and the mechanism in the reactor.
Part of this project was to find a thermodynamic model that correlate with the system. Based on the literature study an equation of state model, Peng-Robinson or Soave-Redlich-Kwong was the best choice. Both models were tested and they gave similar results. In this simulation Soave-Redlich-Kwong is used. The reason for that is that Soave-Redlich-Kwong is developed to function well together with water which condenses in the heat exchangers after the reactor (simulation model will incorporate more process equipment in future studies) .
Multiple studies have been done to discover the kinetics of the oxidation reactions of ethylene over a silver catalyst. There has been no general agreement among the kinetics equations and mechanisms described. It is agreed that silver can adsorb oxygen in a number of ways and that this phenomenon is the basis of silver’s efficiency in catalyzing the oxidation of ethylene to ethylene oxide.
The simulation was divided in three various operational conditions, start of run, middle of run and end of run. The selectivity and activity decreases over time and the reason is deactivation of the catalyst that occurs due to poisoning and silver sintering.
In the simulation kinetic parameters from the literature was used as a starting point. These parameters were then adjusted to fit the three various operational conditions. The conclusion was that during operational time the activation energy increased for both reactions which have to be compensated with increasing reactor temperature. At the same time the selectivity for producing ethylene oxide decreases, i.e. more carbon dioxide and water are formed. In future catalyst evaluation it is important to establish that the catalyst can operate within flammable limit and within equipment design.

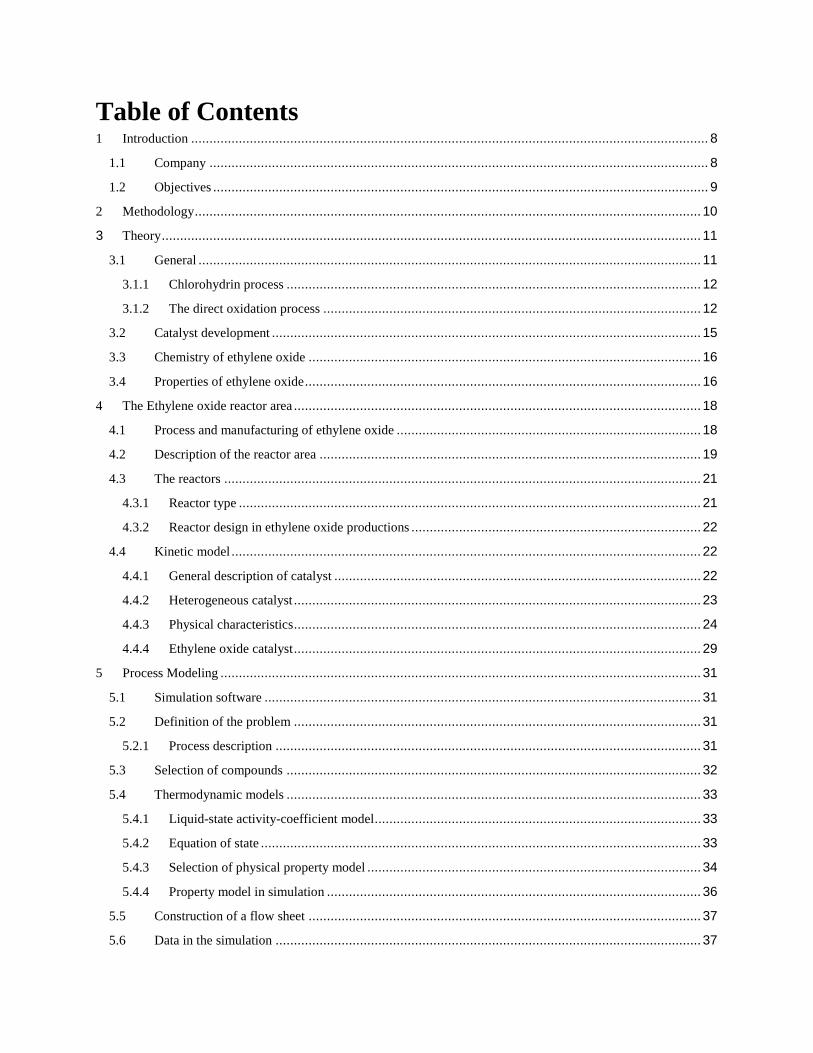
Table of Contents 1 Introduction ............................................................................................................................................. 8
1.1 Company ........................................................................................................................................ 8
1.2 Objectives ....................................................................................................................................... 9
2 Methodology .......................................................................................................................................... 10
3 Theory ................................................................................................................................................... 11
3.1 General ......................................................................................................................................... 11
3.1.1 Chlorohydrin process ................................................................................................................. 12
3.1.2 The direct oxidation process ....................................................................................................... 12
3.2 Catalyst development ..................................................................................................................... 15
3.3 Chemistry of ethylene oxide ........................................................................................................... 16
3.4 Properties of ethylene oxide ............................................................................................................ 16
4 The Ethylene oxide reactor area ............................................................................................................... 18
4.1 Process and manufacturing of ethylene oxide ................................................................................... 18
4.2 Description of the reactor area ........................................................................................................ 19
4.3 The reactors .................................................................................................................................. 21
4.3.1 Reactor type .............................................................................................................................. 21
4.3.2 Reactor design in ethylene oxide productions ............................................................................... 22
4.4 Kinetic model ................................................................................................................................ 22
4.4.1 General description of catalyst .................................................................................................... 22
4.4.2 Heterogeneous catalyst ............................................................................................................... 23
4.4.3 Physical characteristics ............................................................................................................... 24
4.4.4 Ethylene oxide catalyst ............................................................................................................... 29
5 Process Modeling ................................................................................................................................... 31
5.1 Simulation software ....................................................................................................................... 31
5.2 Definition of the problem ............................................................................................................... 31
5.2.1 Process description .................................................................................................................... 31
5.3 Selection of compounds ................................................................................................................. 32
5.4 Thermodynamic models ................................................................................................................. 33
5.4.1 Liquid-state activity-coefficient model ......................................................................................... 33
5.4.2 Equation of state ........................................................................................................................ 33
5.4.3 Selection of physical property model ........................................................................................... 34
5.4.4 Property model in simulation ...................................................................................................... 36
5.5 Construction of a flow sheet ........................................................................................................... 37
5.6 Data in the simulation .................................................................................................................... 37

5.6.1 Kinetics in simulation................................................................................................................. 38
6 Result and Discussion ............................................................................................................................. 40
7 Conclusions ........................................................................................................................................... 49
8 Recommendations for the future .............................................................................................................. 50
9 References ............................................................................................................................................. 51
Appendix 1

8
1 Introduction The background about AkzoNobel and also the objectives of this thesis will be presented in this chapter.
1.1 Company The purpose of this thesis is to develop a simulation model of the ethylene oxide reactor in Aspen Plus®. This reactor model can then be used for studies of future catalyst types. The result from this work will develop a better understanding of the ethylene oxide process and especially the reactor area.
Ethylene oxide is an important ethylene based intermediary compound. [1] The primary use for ethylene oxide is in the manufacture of derivatives such as ethylene glycol, surfactants and ethanolamine’s. [2]
Akzo Nobel is one of the world’s leading industrials companies and is active in the areas Decorative Paint, Performance coatings and Specialty Chemicals. Akzo Nobel’s headquarter is located in Amsterdam, the Netherlands. They operate in 80 countries with 47 000 employees and are consistently ranked as one of the leaders on the Dow Jones sustainability index. AkzoNobel has 3200 employees in Sweden and operate at approximately 15 places. [3]
The history of Akzo Nobel in Stenungsund can be traced back to the beginning of the 1900s century. Mo and Domsjö AB (MoDo) started to prepare sulfite alcohol through fermentation of the rest product in the production of sulfite in Örnsköldsvik. This was the start of the alcohol based production of ethylene oxide. In 1941 MoDo started to produce ethylene oxide for further production of ethylene glycol. In the early 1960th the production of ethylene oxide based from ethanol and chlorohydrin was not considered cost effective. In 1963 MoDo started a production of ethylene oxide based on direct oxidation from ethylene in Stenungsund, Sweden. [4]
Today Akzo Nobel Ethylene and Sulfur Derivatives in Stenungsund consist of one ethylene oxide plant that provides Surface Chemistry and ethylene amines plant with ethylene oxide. Ethylene oxide is raw material for these plants. In addition to the site in Stenungsund a new production site for ethylene amines and ethylene oxide has been built in Ningbo, China.
Picture 1. The Ethylene Oxide reactors at Akzo Nobel in Stenungsund

9
1.2 Objectives The raw materials in the production of ethylene oxide at AkzoNobel are ethylene and oxygen where ethylene is the largest part of the cost, approximately 70% of the raw material. Therefore it is of great interest to optimize and maintain a high selectivity towards ethylene oxide in the reactors and thus reduce the consumption of ethylene. This is possible by replacing the existing catalyst to a catalyst with better selectivity towards ethylene oxide. An exchange of catalyst for a better catalyst often means a change in operating parameters. The aim is to produce more ethylene oxide with a catalyst that can operate within existing design temperature, design pressure and to operate within a safe margin to flammability. An important objective is to extend the life cycle while improving the catalyst performance.
The aim with this project is to create a process simulation model for the reactor system which is consistent with today's catalyst performance. This reactor simulation can also be a tool for future catalyst evaluations.
To be able to create a simulation model which corresponds to reality the following important issues will be studied:
• Find a thermodynamic model that correlate with the system and a description of the benefits of the choice of model.
• Build a static model in Aspen Plus and run it at three various operating conditions. • Create a reactor kinetic model for the reactor system and fin tune it so it will correlate
with the existing catalyst. Key parameters are temperature, selectivity and heat formation.

10
2 Methodology Create a simulation of the reactor system which is in good agreement with existing catalyst performance. The study was divided into the following steps.
1. A time plan A Gant Chart was performed where the main activity’s where listed. Every activity had a time plan with a defined start and end date. (See Appendix 1) Parallel activities and milestones were defined.
2. Literature study A literature study was done in the beginning of the project to increase the knowledge of the reactor kinetics and its thermodynamics.
3. Collecting process data To be able to make a simulation process data and equipment data have to be known. Process data was collected from the Aspen Process Explorer and Process Flow Diagrams. Equipment data was collected from Akzo Nobel plant design documentation system Site base, Akzo Nobel’s archive and from P&ID.
4. Modelling The modeling was made in the process simulation program ASPEN PLUS® 8.2. A model of the reactor was created and adjusted after comparison with data from the process running.
5. Model development Kinetic values from the literature was used and then adjusted to fit this reactor system. Operating modes like start of run, middle of run and end of run was studied.
6. Conclusions and recommendations Finally result and conclusions from the simulations and the literature study was presented. Recommendations and things to consider in future work were presented.

11
3 Theory The theory of the chemistry and the manufacturing process of the ethylene oxide process will be presented in this chapter.
3.1 General Ethylene oxide was first prepared in 1859 by Wurtz using potassium hydroxide solution to eliminate hydrochloric acid from ethylene chlorohydrin. This led to an industrial production of EO (Ethylene Oxide) which began in 1914. The direct catalytic oxidation of ethylene, discovered in 1931 by Leffort, was gradually replaced by the chlorohydrin process. Today EO is produced by direct oxidation of ethylene with air or oxygen. [5] It is these two basic types of processes which have been significant in the commercial manufacturing of ethylene oxide. The chlorohydrin process is the oldest and has by the early 1960s rapidly being phased out and is no longer in use. In table 3.1 an overview of transition from chlorohydrin process to direct oxidation process is shown. The direct oxidation process is more economical and has been an important factor in the tremendous growth of the EO market. [1]
Table 3.1. United States Capacity to produce Ethylene Oxide (thousands of metric tons per annum) [1]
Year Chlorohydrin Direct Oxidation Total 1935 27 0 27 1940 44 5 49 1950 146 68 214 1955 1960 1965 1970 1975 1980
161 252 261 175 91 0
492 696 926 1750 2275 2726
653 948 1187 1925 2366 2726
Ethylene oxide is a product that is consumed all over the world. The Middle East, China and United States stands for the majority of the market. Of the total global ethylene oxide capacity in 2012, 25% is in Middle East, 16% is in China and 12% is in the United States. The rest of Asia accounts for 25% of the world’s capacity. These regions cover 79% of the total world capacity.[6]
In 2012 the major ethylene oxide end products were monoethylene glycol (MEG), diethylene glycol (DEG), and triethylene glycols (TEG). They represented more than 75% of total consumption. [6] MEG is used in fiber manufacture and for antifreeze. DEG is used in fiber industry for production of fabrics and as a tobacco humectant. TEG and DEG are both used for gas treatment. TEG is also used in the manufacturing of cellophane for food. [7]
12
3.1.1 Chlorohydrin process As mentioned in the previous chapter the chlorohydrin process is no longer in use but has a historical value and therefore it will be described in this chapter.
One of the two fundamental reactions that are involved in the production of ethylene oxide by the chlorohydrin process is the reaction of ethylene with hypochlorous acid to form chlorohydrin:
CH2CH2 + HOCl →HOCH2 CH2Cl (1)
The second reaction is that of the chlorohydrin with a base, usually calcium hydroxide, to form ethylene oxide.
HOCH2CH2Cl + ½ Ca(OH)2 → CH2CH2O + ½ CaCl2 + 2 H2O (2)
The chlorohydrin process is carried out in packed towers at 27-43°C and 2-3 atm pressure at a yield of 85-90%. To avoid formation of byproducts (ethylene dichloride, dichlorodiethyle ether etc.) the concentration of chlorohydrin in the chlorohydration reaction solution is maintained below 7 wt.%.
The second step of the process, dehydrochlorination, is accomplished by adding 10 wt.% aqueous slurry of lime to the chlorohydrin solution. The mixture is then heated to just less than 100°C in the hydrolyzer, a cylindrical vessel with a reflux condenser operating at essentially atmospheric pressure. As the chlorohydrin reacts with the dissolved lime ethylene oxide, by-products and some water is formed. The ethylene oxide is removed as a vapor from the partial condenser. The vapor stream from the hydrolyzer is passed through a cooler and partially condensed and then fed to the fractionated section. The purification of the crude ethylene oxide is difficult and requires a number of distillation towers. [1]
As mentioned in the previous chapter MoDo produced ethylene oxide from ethanol. In this process, dehydration of ethanol produces ethylene and water. [4]
C2H5OH → C2H4 + H2O (3)
The subsequent process steps are similar to the chlorohydrin process described above.
3.1.2 The direct oxidation process The first commercial EO process using direct oxidation was developed in the United States by Carbide and Carbon Chemicals Corp. (today Union Carbide Corp.) which started its first plant in 1937 based on the use of air. In 1953 the Scientific Design (SD) air based process was commercialized and by the late 1950s the direct oxidation process started to replace the chlorohydrin process. In 1958 Shell Development introduced the first oxygen based process for direct oxidation of ethylene. In subsequent years the oxygen based process was commercialized by SD/Halcon (1969), Nippon Shokubai (1976), and Union Carbide (1976). [1]

13
The main reason why chlorohydrin process is no longer in use is the economical factor. It is 3-4 times more expensive to produce ethylene oxide by chlorohydrin process than by direct oxidation process. Another disadvantage of the chlorohydrin process is the problem of treating the large waste stream containing calcium chloride and amounts of chlorinated hydrocarbons and glycols. [1] The main disadvantage and inefficiency of the direct oxidation process is the lower selectivity of ethylene oxide per unit of feed ethylene consumed, results from the loss of 20-25% of the ethylene to carbon dioxide and water. [2]
All ethylene oxide direct oxidation plants are based on the original process chemistry discovered by Lefort in 1931. [2] The direct vapor-phase oxidation of ethylene to ethylene oxide over a silver catalyst at 220-300°C and 10-30 bar pressure produces few bi-products other than carbon dioxide and water.
The important reactions that occur are:
Ethylene is oxidized with oxygen over a silver alumina catalyst to form ethylene oxide.
CH2=CH2 + ½ O2 → CH2-CH2O (ΔH = -106,7 kJ/mol) [8] (4)
Ethylene is totally oxidized to form carbon dioxide and water.
CH2CH2 + 3 O2 → 2 CO2 + 2H2O (ΔH = -1323 kJ/mol) [8] (5)
Ethylene oxide is further oxidized to form carbon dioxide and water.
CH2CH2O +5/2 O2→ 2CO2 + 2H2O (ΔH = -1323 kJ/mol)[8] (6)
To prevent further oxidation of ethylene oxide, the ethylene conversion of the commercial process is typically between 10-20% resulting in a recirculated gas loop that is explained further in subsequent chapter. [2] In direct oxidation processes a few ppm of ethyl chloride (2,5-3,0 ppm) or vinyl chloride (4-6 ppm) is added to the gaseous feed to inhibit the complete oxidation reaction and increase selectivity to ethylene oxide. [9] Although small traces of bi-products, usually less than 0,1 % of acetaldehyde and even smaller amount of formaldehyde are also produced. [1]
CH2CH2O → CH3-CHO (Acetaldehyde) (7)
CH3-CHO + 2 1/2 O → 2CO2 + 2H2O (8)
CH2=CH2 + O2 → 2CH2O (Formaldehyde) (9)
The direct oxidation (EO) process can be divided into air- and oxygen based processes.
To describe the process flow of the air- and oxygen based process a flow scheme over the Halcon SD air- and oxidation process is shown in figure 3.1 and can be considered represented for the majority of the ethylene oxide processes.

14
Figure 3.1. Schematic flow diagram of Halcon SD ethylene oxide process using either air or oxygen as the oxidant. [1]
3.1.2.1 Air-Based Direct Oxidation Process Compressed air is first purified to remove contaminants and then mixed with recycled gas and fresh ethylene. [1] Vapor phase oxidation inhibitors such as ethylene dichloride or vinyl chloride or other halogenated compounds are added in the inlet of the reactor to retard carbon dioxide formation. [2] The gas is fed to a multitubed catalytic reactor in which the reactor temperature is controlled with boiling water or circulated non-boiling organic oil on the shell side. If oil is used, it is cooled in a steam generator, producing high pressure steam which is used in the process.
The effluent gas from the main reactor, which now contains ethylene oxide, is cooled in a shell-and-tube heat exchanger with cold reactor feed gas. The cooled gas is then fed in to the main absorber where the ethylene oxide is absorbed in water, produce a dilute aqueous solution. The scrubbed gas from the absorber is then compressed and the major portion of the gas is recycled to the main reactor. A part of the gas flow is sent to secondary (or purge) reactor system to purge both the nitrogen introduced in the air feed and also the carbon dioxide produced in the reactor. [1]

15
3.1.2.2 Oxygen-Based Direct Oxidation Process High purity oxygen is mixed with recycled gas and fresh ethylene and the combined gases are the fed into a multitube reactor similar to the one in the air based process. The effluent gas, containing ethylene oxide is heat exchanged with cold reactor fed gas before it enters the absorber. In the absorber the ethylene oxide is dissolved in the absorber water to produce a dilute aqueous solution. The scrubbed gas is then compressed and recycled to the reactor. A part of the recycle gas is first sent to a CO2 absorber where carbon dioxide produced in the reactor is chemically absorbed in a recirculated solution of hot potassium carbonate. The CO2 lean gas is then returned to the recycled gas and back to the reactor. The CO2-rich carbonate solution is regenerated in the CO2 stripper using steam and the desorbed carbon dioxide is vented out in the top of the column. [1] To avoid accumulation of other inert such as argon which is an impurity in the oxygen supply a small purge of cycle gas is vented to atmosphere or incinerator. If argon is not vented out it can build up to 30-40% in the cycle gas. Because of the lower heat capacity of the argon, the cycle gas may enter the flammable region, and as a result of that the oxygen concentration needs to be decreased in the cycle gas. [2]
3.1.2.3 Air vs Oxygen Process Differences and Economics The differences for all air and oxygen based plants with the same capacity and same type of catalyst are that the oxygen based process yields a higher selectivity and requires less catalyst. The air based process has a higher initial building cost but most of the small to medium plants has a lower run cost. [2] The oxygen based processes need a carbon dioxide removal section, more stainless steel and some expensive instrumentation. For the air based process to achieve the same selectivity it requires more catalyst, more reactors, a multi-stage compressor, air purification unit, and a vent gas treating system and two to three reactor train in series. [1] In spite additional equipment for the air based process the selectivity is less than for an oxygen based process. In 1970 the average selectivity for an air based process is 65-75% and for the oxygen based process around 70-80% [1].
3.2 Catalyst development Mentioned in previous chapter is that ethylene consumption is the major cost in the production of ethylene oxide. It is of large interest to improve the catalyst selectivity towards ethylene oxide. The ethylene oxide catalyst is a supported silver catalyst on an alumina oxide carrier.
Research in the development of ethylene oxide catalyst is under continuous improvements that are shown in figure 3.2. This figure shows the development from CRI, that is one of the ethylene oxide catalyst suppliers.

16
Figure 3.2 Development of ethylene oxide catalyst within CRI (CRI-catalyst Company)
Not all plants run at the same designs and this is the reason why different catalyst types (families) is formed. Recent developments of catalysts for production of ethylene oxides are not only adjusted to fit new designs but also to fit the existing plant design. [10]
3.3 Chemistry of ethylene oxide Ethylene oxide consists of carbon (C), hydrogen (H) and oxygen (O). Ethylene oxide is the simplest cyclic ether and sometimes refers to as oxicrane. It is a colorless gas or liquid and has a sweet, etheric odor. The structure of a molecule is showed in figure 3.3. [5]
Figure 3.3 Molecule of Ethylene Oxide [11]
The C-C bond is short and the bond angles strained. Ethylene Oxide is highly reactive because of the strained ring that can easily be opened. The three-membered ring is opened in most of its reactions. These reactions are very exothermic because of the tremendous ring strain in ethylene oxide.
3.4 Properties of ethylene oxide Mentioned in previous chapter Ethylene oxide is a very reactive molecule which helps make it a versatile and commercially important chemical intermediate. The highly reactive Ethylene Oxide

17
also contributes to hazards of EO like flammability, reactivity, explosive vapor decomposability and toxicity.
Important physical properties of EO are summarized in table 2
Table 2. Physical properties of EO [5]
Mw (g/mol)
Bp at 101.3 kPa (°C)
Mp at 101.3 kPa (°C)
Mp at 101.3 kPa (°C)
Density (kg/m3)
Solubility of Ethylene Oxide in water
44,05 10,8 -112,5 Lower 2,6 Higher 100
882 Soluble

18
4 The Ethylene oxide reactor area This chapter will focus on the reactor area which is also the area that will be in included in the simulation. To get a better overview and understanding of the simulation a short description of the ethylene oxide process will be presented and then the process of the reactor system will be described in detailed.
4.1 Process and manufacturing of ethylene oxide Gas containing ethylene, oxygen, methane, nitrogen, and argon is entering the reactors. The reaction between oxygen and ethylene occurs under a pressure of approximately 20 bars and a temperature of approximately 250°C over a silver catalyst on an alumina oxide carrier. The main reactions are:
C2H4 + ½ O2 → C2H4O (formation of ethylene oxide) (ΔH = -106,7 kJ/mol) [8] (4)
C2H4 + 3 O2 → 2 CO2 + 2 H2O (by products) (ΔH = -1323 kJ/mol) [8] (5)
Traces of formaldehyde and acetaldehyde can also be found.
The process is optimized to get as much ethylene oxide as possible over a catalyst cycle. The process streams exiting the reactors contain 1-3 mol% ethylene oxide. The hot effluent gas is cooled in a shell-and-tube exchanger using the cooled reactor feed stream. The ethylene oxide produced is recovered from the reactor effluent gases. This is accomplished in the absorber by countercurrent scrubbing with cold water. The ethylene oxide is dissolved in the water in the absorber together with some nitrogen, carbon dioxide and traces of ethylene, ethane, and aldehydes. The ethylene oxide in the aqueous stream from the absorber is separated from the stream in a number of distillation steps in the refining area.
The carbon dioxide (CO2) must be removed on a continuous basis in order to maintain an acceptable CO2 concentration in the circulated reactor gas. CO2 affects the activity of the catalyst and therefor a part of the recycled gas leaving the absorber is treated in the carbonate section before it enters the main recycled gas again. The activity is the temperature needed to achieve a desired reaction rate. A lower temperature means a higher catalyst activity. It’s therefore important to keep the CO2 concentration as low as possible to achieve a higher selectivity towards ethylene oxide. Improved selectivity towards ethylene oxide results in less production of CO2. In the carbonate section the carbon dioxide is removed from the recycle gas by chemical reaction with hot aqueous potassium carbonate. The carbon dioxide is rejected from the reaction system after steam stripping the bicarbonate rich solution at approximately atmospheric pressure.
To be able to produce ethylene oxide within the specifications a bleed from the refining area containing ethylene oxide, acetaldehyde and formaldehyde is sent to the glycol section. In the glycol section ethylene oxide reacts to monoethylene glycol (MEG) and diethylene glycol (DEG). Glycols are separated from water by distillation. [11]

19
Figure 4.1 the ethylene oxide process in Stenungsund [11]
4.2 Description of the reactor area The Ethylene Oxide process consists of three loops and a series of distillation towers. The ethylene oxide is produced in the gas loop, the byproduct carbon dioxide is stripped off in the carbonate area and the ethylene oxide is absorbed in the circulating water loop. The rest of this report will focus on the reaction area in the gas loop of the ethylene oxide plant.
Gas containing most ethylene, oxygen, methane, carbon dioxide, argon, nitrogen and water is entering the reactors.
In the reactors ethylene is oxidized over a promoted Ag-catalyst on an alumina oxide carrier. There are mainly three reactions that occur over the silver catalyst, shown in figure 4.2. Partial oxidation of ethylene to ethylene oxide, total oxidation of ethylene to carbon dioxide and the consecutive oxidation of ethylene oxide to carbon dioxide, reaction.
OXYGEN + ETHYLENE
CYCLE GAS LOOP CYCLE WATER LOOP STEAM LOOP
STEAM COMPRESSOR
EO-RICH CYCLE GAS
EO-LEAN CYCLE GAS
GAS COMPRESSOR HEAT EX-
CHANGERSABSORBER STRIPPER
COOLANT
STEAM
REACTORS
COLD EO-RICH CYCLE WATER
HOT EO-LEAN CYCLE WATER
ETHYLENE OXIDE + WATER
HEAT RECOVERY
CYCLE WATER LOOP

20
Reaction 4
C2H4 + O2 C2H4O
Reaction 5 Reaction 6
CO2 + H2O
Figure 4.2 the triangular reaction scheme
All three reactions are exothermic which means that heat is produced. The heat is removed with circulating boiling water on the shell side of the reactors. Some of the circulating water is evaporated to steam which is used in other processes [11].
Chlorides are fed to the reactors as inhibitors. An inhibitor is a substance that is used in catalytic processes to improve the performance of the catalyst and decreases the reaction rate by competing with reactants on the catalyst activity [13]. Common chlorides are ethylene dichloride (EDC), Vinyl chloride (VC) and ethyl chloride (EC). For the hybrid catalyst the chlorides (EDC or EC) acts as promotors [8]. The reason is that the catalyst has been doped with another set of salts (metals, etc.). A promotor is added until a selectivity optimum is reached. More addition would lead to decreasing selectivity [10].
Due to explosion hazards the concentration in the inlet and the outlet of the reactors is strongly controlled not to reach the flammable region. Also the pressure and temperature in the system affect the flammability and is controlled not to exceed the limit of what is acceptable.
The selectivity towards ethylene oxide formation depends on ethylene conversion. Selectivity increases with decreased ethylene conversion. Too low conversion results in too low ethylene oxide concentration in the outlet of the reactors. Thus, ethylene conversion is chosen to achieve ethylene oxide concentration of 1-3 mol% at the outlet of the reactor [8].
The gas in the outlet of the reactors is heat exchanged with the gas stream entering the reactors in two heat exchangers. After the heat exchangers it enters the absorber where the ethylene oxide is absorbed in water and separated downstream in the process.
21
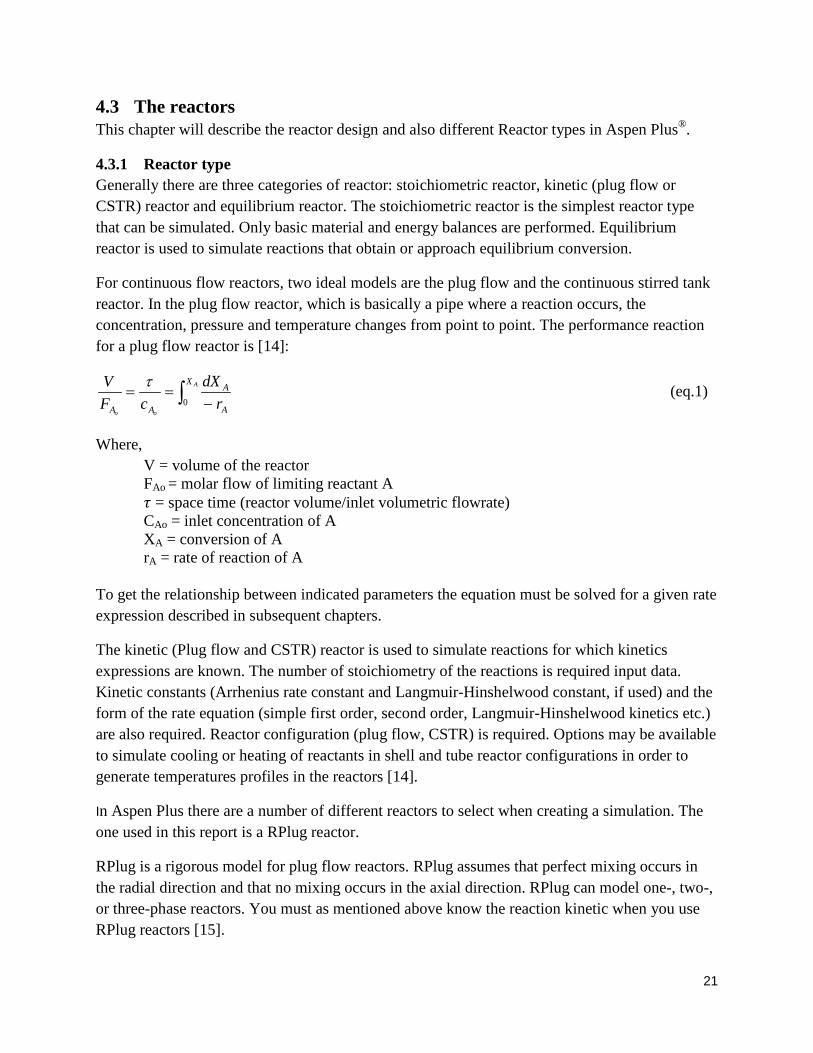
4.3 The reactors This chapter will describe the reactor design and also different Reactor types in Aspen Plus®.
4.3.1 Reactor type Generally there are three categories of reactor: stoichiometric reactor, kinetic (plug flow or CSTR) reactor and equilibrium reactor. The stoichiometric reactor is the simplest reactor type that can be simulated. Only basic material and energy balances are performed. Equilibrium reactor is used to simulate reactions that obtain or approach equilibrium conversion.
For continuous flow reactors, two ideal models are the plug flow and the continuous stirred tank reactor. In the plug flow reactor, which is basically a pipe where a reaction occurs, the concentration, pressure and temperature changes from point to point. The performance reaction for a plug flow reactor is [14]:
∫ −==
A
oo
X
A
A
AA rdX
cFV
0
τ (eq.1)
Where, V = volume of the reactor FAo = molar flow of limiting reactant A 𝜏 = space time (reactor volume/inlet volumetric flowrate) CAo = inlet concentration of A XA = conversion of A rA = rate of reaction of A To get the relationship between indicated parameters the equation must be solved for a given rate expression described in subsequent chapters.
The kinetic (Plug flow and CSTR) reactor is used to simulate reactions for which kinetics expressions are known. The number of stoichiometry of the reactions is required input data. Kinetic constants (Arrhenius rate constant and Langmuir-Hinshelwood constant, if used) and the form of the rate equation (simple first order, second order, Langmuir-Hinshelwood kinetics etc.) are also required. Reactor configuration (plug flow, CSTR) is required. Options may be available to simulate cooling or heating of reactants in shell and tube reactor configurations in order to generate temperatures profiles in the reactors [14].
In Aspen Plus there are a number of different reactors to select when creating a simulation. The one used in this report is a RPlug reactor.
RPlug is a rigorous model for plug flow reactors. RPlug assumes that perfect mixing occurs in the radial direction and that no mixing occurs in the axial direction. RPlug can model one-, two-, or three-phase reactors. You must as mentioned above know the reaction kinetic when you use RPlug reactors [15].

22
4.3.2 Reactor design in ethylene oxide productions The commercial processes operate with a packed-bed multitubular reactor. Reaction temperatures at 200-300°C and pressure around 10-30 bar are typical. The reactor is a shell and tube types, with a couple of thousands tubes, 20-50 mm inner diameter. The undesired complete oxidation of ethylene is the primary source of heat, with a heat of reaction of 1323 kJ/mol compared with the partial oxidation heat of reaction 106,7 kJ/mol. The reactor can be eighther oil cooled or boiler water cooled. Circulated boiler water is more common. Boiling water provides good heat absorption and is safer compared to the oil cooled reactor. The reactor tube length varies between 6-12 meters. The tubes are filled with a silver-based catalyst supported on a carrier material with a diameter of 3-10 mm [2].
A schematic picture is shown in figure 4.3 where a tube in one of the reactors in Akzo Nobel Stenungsund is described. Here the first and last section in the tube is filled with inert (Al2O3) and the reason is to control that the reactions occur at the right place.
Catalyst Inert
Figure 4.3 A reactor tube at Akzo Nobel in Stenungsund
In Akzo Nobel the reactor is cooled with boiler water that is circulating on the shell side of the reactors and is partially evaporated (2-3%) and high pressure steam is produced and used downstream in the process.
4.4 Kinetic model This chapter gives a short introduction of a catalyst and a description of different types of catalysts. The mechanism of the ethylene oxide catalyst is also presented.
4.4.1 General description of catalyst A catalyst is a substance that accelerates a reaction but undergoes no net chemical change. A catalyst acts by providing an alternative reaction path with lower activation energy [18]. When a reaction can proceed by more than one path, a particular catalyst may favor one path over another and thus lead to a product distribution different from an uncatalyzed reaction. A catalytic

23
reaction requires lower activation energy, thus permitting a reduction of temperature at which the reaction can proceed favorably. [17]
There are two different types of catalyst, homogeneous and heterogeneous. A homogeneous catalyst is a catalyst that is in the same phase as the reaction mixture. A heterogeneous catalyst is a catalyst that is in a different phase than the reaction mixture. [18] Similar as a homogeneous catalyst is that a heterogeneous catalyst accelerates the reactions in the system. The ethylene oxide catalyst is a heterogeneous catalyst.
4.4.2 Heterogeneous catalyst A reaction requires energy for the reaction to proceed and this is called activation energy (Ea). There is also an energy (heat, ΔE) given off by reaction and this is independent of the activation energy and is therefore the same with or without catalyst present shown in figure 4.4.
Figure 4.4 Activation energy for an exothermic reaction with and without a heterogeneous catalyst
The characteristics of a heterogeneous catalyst are that at least two phases are involved and that a phase boundary separates the catalyst from the reactants and products. The reactions often take place on a surface.
The rate of reaction is called activity. The catalyst activity can be described as a quantitative measure for how fast the catalyst is capable to transform reactants to products. The reaction rate is generally a function of both temperature and reactant concentrations. [13]
For a solid catalyzed reaction the reaction rate is usually defined based on the mass of catalyst present:
bi
i dtdN
Wr r⋅⋅=
1 (eq.2)
Where,

24
W = mass of catalyst Ni = moles of i formed ρb = bulk catalyst density (mass catalyst/volume reactor) = (1-ԑ)ρcat ρcat = solid catalyst ԑ = void fraction For catalytic reactions, the rate expressions are often quite complicated because the balanced equation is not just one elementary step. The rate expressions are often of the form of Langmuir-Hinshelwood kinetics:
∑
∏
=
=
+= m
jjj
n
iii
i
cK
ckr
i
1
1
]1[ γ
α
(eq.3)
The constant ki and Kj are catalyst specific. The constant must be obtained by fitting reaction data. [14]
The rate constant of most reactions increase as the temperature is raised. It is found experimentally for many reactions that a plot of ln k against 1/T gives a straight line. This behavior is normally expressed mathematically by introducing two parameters, one representing the intercept and the other the slope of the straight line, and this will give the Arrhenius equation [18]:
RTEAk a−= lnln Or written as RT
Ea
Aek−
= (eq.4)
Where, k = rate constant A = pre-exponential factor or frequency factor Ea = activation energy R = gas constant T = temperature High activation energy signifies that the rate constant depends strongly on temperature. [18]
4.4.3 Physical characteristics Most common solid catalysts are employed as porous pellets in a fixed or fluidized bed. Their physical characteristics of major importance are as follows [17]:
• Pellets size • Specific surface area • Pore diameter and distribution

25
• Diffusivity and tortuosity
Catalyst physical characteristics are important when it comes to reactor performance and pressure drop. A higher catalyst density leads to an increased reaction rate and also a higher pressure drop [17].
With no catalyst present the activation energy for oxidation of ethylene to ethylene oxide is higher than for total oxidation of ethylene to CO2 and water. With a silver catalyst the activation energy in both reactions is lowered but more in the reaction to ethylene oxide. The result of a catalyst present is that the selectivity towards ethylene oxide is increased and the temperature is decreased [10].
Silver is the most efficient metal that is used in a catalyst of the direct oxidation of ethylene to ethylene oxide [8]. Silver metal is unique in selectively catalyzing ethylene epoxidation at high rates [9]. Only supported catalysts are preferred because of their superior thermal stability for this application. Chemical and physical properties of the support greatly influence activity and selectivity; chemically-inert, low-surface-area support such as α-Al2O3 and silicon carbide are used, since they favor high selectivity by minimizing side reactions that occur on acidic supports. The most widely used commercial catalyst consists of 13-18% Ag on α-Al2O3 [9]. Due to continuous development of the catalyst to achieve higher selectivity towards ethylene oxide, today’s content of silver is sometimes higher compared to the literature [10].
There are several different types of silver/alumina catalyst but they are proprietary which means that it’s difficult to achieve data on a specific catalyst. The presence of silver reduces the activation energy for both partial oxidation and total oxidation of ethylene to ethylene oxide [10]. In the manufacture of the ethylene oxide catalyst promoters are added to improve the selectivity towards ethylene oxide. Promoters can be salts or alkali- and alkaline-earth metal [8].
4.4.3.1 Catalyst deactivation Over a period of time, however, permanent changes in the catalyst may occur that is called deactivation. [17] Catalyst deactivation may occur as a result of a poisoning by Chlorine (Cl), Sulfur (S), Potassium (K), Sodium (N) and water impurities. Common sources of poisoning are impurities in the feed or by a carryover from the carbonate sections to the reactor gas loop. Blocking of pores from dust formation contributes to catalyst deactivation. Other sources of catalyst deactivation are coke formed from acetylene or heavy hydrocarbons or a result from sintering at hot spots. Sintering can be minimized through precise control of the process parameters and it’s therefore recommended to operate the catalyst at minimum practical temperature. [20] Poisoning of the catalyst affect the performance by blocking the silver surface or by washing off the promoters on the catalyst surface. [10] Number of active catalyst sites are reduced which increases the activation energy.

26
4.4.3.2 Steps in a heterogeneous catalytic reaction A number of physical and chemical steps occur in a heterogeneous catalytic reaction. In order for reactant A to convert at any appreciable rate to product B the following steps occur (also shown in figure 4.5:
1. Film mass transfer of the reactant A, i.e. bulk diffusion of A through a stagnant gas film or boundary layer surrounding the catalyst particle to the external catalyst surface.
2. Diffusion of species A (by either bulk or molecular diffusion) through the porous network of the catalyst to the catalytic surface.
3. Adsorption of A onto the catalyst surface 4. Reaction of A to B on catalytic sites on the catalyst surface. 5. Desorption of the product B molecules from the surface. 6. Diffusion of B through the porous network to the pore mouth. 7. Film mass transfer of the product B, i.e. bulk diffusion of B from the external catalyst
surface through the stagnant gas film to the bulk gas stream.
Figure 4.5 Steps in a heterogeneous catalytic reaction A→B in a porous, supported catalyst. [9]
Steps 1, 2, 6 and 7 are diffusional processes or physical processes having small dependence on temperature. Steps 3, 4 and 5 are chemical processes with large temperature dependences. If the surface chemical processes are assumed to be the rate controlling, the rates of the diffusional processes (Step 1, 2, 6 and 7) will be high enough that they will not affect the rate of reaction. The rate determined steps will then be the rate of adsorption, reaction and desorption processes (Step 3, 4 and 5) [9]. An assumption that adsorption and desorption is fast will give that the reaction is the rate determined step.
4.4.3.3 Adsorption and desorption For heterogeneous catalyzed reactions to take place on solid surface at least one reactant in the gas phase need to be absorbed on the solid surface. The solid surface is either on the outer

27
surface of the catalyst pellet or as a coated inner pore surface of a porous catalyst pellet. The adsorption on a heterogeneous catalyst can be either [13]:
• Physisorption (physical adsorption) In physisorption there is a van der Waal interaction between the absorbate and the substrate. Van der Waals forces are the interactions between molecules that leave their chemical identities essentially unchanged. Van der Waal interaction have a long range but are week, and the energy released when a particle is physisorbed is of the same order magnitude as the enthalpy of condensation. [18]Physical adsorption is independent of physical properties but direct dependent of size of the catalyst surface. The physical adsorption decreases rapidly with increased temperature and above the critical temperature for the absorbed component the adsorption is usually very small [13]. The enthalpy of physisorption is typically values of 20 kJ/mol [18].
• Chemisorption (chemical adsorption) In chemisorption the molecules or atoms stick to the surface by forming a chemical (usually covalent) bond and tend to find sites that maximize their coordination number with the substrate. The enthalpy for the chemisorption is very much greater than for physisorption, and typical values are in the region 200 kJ/mol [18].
Physical adsorption is always exothermic but chemical adsorption is usually very exothermic. The heat of adsorption is a significant attribute for the adsorption and can be used to determine the type of adsorption. Physical adsorption is fast unlike chemical adsorption which is slower and need a certain temperature to reach reasonable reaction speed. [13]
4.4.3.3.1 Adsorption isotherms An adsorption isotherm is at constant temperature the relation between the partial pressure of the substance that’s going to be adsorbed and the adsorbed substance at equilibrium. The extent of surface coverage is normally expressed as the fractional coverage, θ:
avaliblesiteadsorptionofnumberoccupiedsiteadsorptionofnumber
=θ (eq.5)
The variation of θ with pressure at a chosen temperature is called adsorption isotherm. [18]
• Langmuir isotherm The most simple physically and important adsorption isotherm for the heterogeneous catalyst is the one that chemisorption often follows, the Langmuir isotherm. [13] A number of assumptions for the Langmuir isotherm are:
1. Adsorption cannot proceed beyond monolayer coverage. 2. All sites are equivalent and each site cans only accommodate one molecule. 3. The ability of a molecule to adsorb at a given site is independent of the
occupation of neighboring sites. [18]

28
The Langmuir isotherm:
KpKp+
=1
θ (eq.6)
Where,
b
a
kkK =
ka = rate constant for adsorption kb = rate constant for desorption
4.4.3.4 Mechanism of catalysis As has been mentioned in the previous chapter mainly three reactions, (4), (5) and (6) takes place simultaneously at the silver surface. In these reactions ethylene oxide, CO2 and water is formed via reactions shown in figure 4.2.
Multiple studies have been done to discover the kinetics of the oxidation reactions of ethylene over a silver catalyst. There has been no general agreement among the kinetics equations and mechanisms described. Thus it is agreed that silver can adsorb oxygen in a number of ways and that this phenomenon is the basis of silver’s efficiency in catalyzing the oxidation of ethylene to ethylene oxide. The older part of the literature is much concerned about whether molecular or atomic adsorbed oxygen reacts with ethylene to form ethylene oxide. Today experimental results indicate that atomic oxygen is the active spices [19].
Different mechanisms have been described in literature and three of them are described here.
The first mechanism described is that only molecular oxygen reacts to form ethylene oxide and that atomic oxygen reacts to form CO2 and water. When molecular oxygen reacts with ethylene to form ethylene oxide, atomic oxygen is formed. When six atomic oxygen have been formed they can react with ethylene and form CO2 and water. If chlorine/EDC is added to block the adsorption of atomic oxygen (path 5 in table 4.1 is minimized) a selectivity of 85.7% can be reached. Higher selectivity than this is achieved today, shown in figure 3.2.
The second mechanism assumes that molecular oxygen can react to both ethylene oxide and also to CO2 and water. In this mechanism the inhibitor acts by reducing the available space on the surface of the catalyst that is needed to form CO2 and water (path 5 in table 4.1 is minimized). The maximum available selectivity here is also 85.7%.
In the third mechanism, atomic oxygen possible together with subsurface oxygen is part of both partial and total oxidation. The environment determines if formation of ethylene oxide or CO2 and water will take place. Inhibitors, promotors and subsurface oxygen reduce the negative

29
charge of the adsorbed oxygen and favor the reaction to ethylene oxide (path 5 and 6 in table 4.1 are minimized). In this mechanism no upper limit of selectivity is present.
A seventeen step mechanism has been developed from mechanistic research shown in table 4.1. [19]
Table 4.1 Proposed Mechanism for Ethylene Oxidation on Silver adapteda,b
Step Elementary reactions Surface process 1 𝑂2(𝑔) + 𝑠 ↔ 𝑂2𝑠 O2 chemisorption 2 𝑂2𝑠 + 𝑠 ↔ 2 𝑂𝑠 O2 dissociation and formation of surface oxide 3 𝑂2(𝑔) + 2𝑂𝑠 ↔ 2𝑂/𝑂 Adsorbed atomic oxygen (path 4) 4 𝐶2𝐻4(𝑔) + 𝑂𝑠 ↔ 𝐶2𝐻4/𝑂𝑠 Ethylene oxide adsorption (path 4) 5 𝐶2𝐻4/𝑂𝑠 + 𝑂/𝑂𝑠 ↔ 𝐶𝐻2𝐶𝐻2𝑂/𝑂𝑠 + 𝑂𝑠 Formation of oxametallacycle from adsorbed
ethylene 6 𝐶𝐻2𝐶𝐻2𝑂/𝑂𝑠 ↔ 𝐶2𝐻4𝑂/𝑂𝑠 Isomerization of oxametallacycle to EO(path 4) 7 𝐶𝐻2𝐶𝐻2𝑂/𝑂𝑠 ↔ 𝐶𝐻3𝐶𝐻𝑂/𝑂𝑠 Isomerization of oxametallacycle to
Acetaldehyde (path5) 8 9 10 11
12 13 14 15 16 17
𝐶2𝐻4𝑂/𝑂𝑠 ↔ 𝐶2𝐻4𝑂(𝑔) + 𝑂𝑠 𝐶𝐻3𝐶𝐻𝑂/𝑂𝑠 ↔ 𝐶𝐻3𝐶𝐻𝑂(𝑔) + 𝑂𝑠
𝐶𝐻3𝐶𝐻𝑂/𝑂𝑠 + 6𝑂𝑠 ↔ 2𝐶𝑂2𝑠 + 4𝑂𝐻𝑠 + 𝑠 𝐶2𝐻2(𝑔) + 𝑠 ↔ 𝐶2𝐻4𝑠
𝐶2𝐻4/𝑂𝑠 + 𝑂𝑠 ↔ 𝐶𝐻2𝐶𝐻𝑂𝐻/𝑂𝑠 + 𝑠
𝐶𝐻2𝐶𝐻𝑂𝐻/𝑂𝑠 + 𝑂𝑠 ↔ 𝐶𝐻2𝐶𝐻𝑂/𝑂𝑠(𝑔) + 𝑂𝐻𝑠 𝐶𝐻2𝐶𝐻𝑂/𝑂𝑠 + 5𝑂𝑠 ↔ 𝐶𝑂2𝑠 + 3𝑂𝐻𝑠 + 𝑠
2𝑂𝐻𝑠 ↔ 𝐻2𝑂𝑠 + 𝑂𝑠 𝐶𝑂2𝑠 ↔ 𝐶𝑂2(𝑔) + 𝑠 𝐻2𝑂𝑠 ↔ 𝐻2𝑂(𝑔) + 𝑠
Desorption of EO (path 4) Desorption of acetaldehyde (path 5) Total oxidation of acetaldehyde (path 5) Acetylene chemisorption on clean Ag-a nonparticipant Formation of vinyl alcohol (path 6) Isomerization to acetaldehyde (path 6) Total oxidation of acetaldehyde (path 6) H2O formation CO2 desorption/inhibition H2O desorption/inhibition
a Order of steps has been modified slightly for clarity b s denotes a metallic silver site, /Os is a surface oxide Path 4 is epoxidation. Path 5 is total oxidation from ethylene. Path 6 is total oxidation from EO
Analyses of this model say that step (2, 5, 6, 7 and 13) are important in rate and selectivity control. Explanations from literature say that formation of Os is the rate limiting step and formation of Os participates in several of the elementary steps shown in table 4.1. This is the reason why many of the rate equations based on various limiting assumptions only is capable of fitting data over a narrow range of conditions. [9][19]
4.4.4 Ethylene oxide catalyst Silver is the most efficient metal that is used in a catalyst of the direct oxidation of ethylene to ethylene oxide. [8] Silver metal is unique in selectively catalyzing ethylene epoxidation at high rates. [9] The silver catalyst is developed continuously. [8] Only supported catalysts are preferred because of their superior thermal stability for this application. Chemical and physical properties of the support greatly influence activity and selectivity; chemically-inert, low-surface-area support such as α-Al2O3 and silicon carbide are used, since they favor high selectivity by minimizing side reactions that occur on acidic supports. The most widely used commercial

30
catalyst consists of 13-18% Ag on α-Al2O3 . [9] Due to continuous development of the catalyst to achieve higher selectivity towards ethylene oxide, today’s content of Ag is usually higher compared to the literature. [10]
There are several different types of silver/alumina catalyst but they are proprietary which means that it’s difficult to achieve data on a specific catalyst. Therefore data from the literature is used and adjusted to be consistent with the current catalyst.

31
5 Process Modeling This chapter will describe the process modeling. The description will include facts from model selection and modification of compounds and models. A step by step explanation of the modeling simulation will also be part of this chapter.
5.1 Simulation software Today there are several computer-aid process simulation tools active on the market and common in a process engineer’s daily work equipment. A number of process software’s exist on the market today where Chemcad, HYSYS and Aspen Plus are some of the major players on the market. [14]
5.2 Definition of the problem The aim with this process simulation was to establish an ASPEN PLUS® model of the ethylene oxide reactor. The simulation was carried out as a steady-state simulation. Three various operating conditions were studied, start of run, middle of run (after 12 months) and end of run (after 24 months). The simulation should correlate with the real plant so that different operational scenarios shall be consistent with reality. When a simulation that correlates with reality have been found it will be used to investigate future changes of catalyst type.
5.2.1 Process description As has been mentioned before three main reactions take place over a catalyst but to simplify the simulation only two reactions will be involved in the simulation:
Ethylene is oxidized with oxygen over a silver alumina catalyst to ethylene oxide.
CH2=CH2 + ½ O2 → CH2-CH2O (ΔH = -106,7 kJ/mol) [8] (4)
Ethylene is totally oxidized to form carbon dioxide and water.
CH2CH2 + 3 O2 → 2 CO2 + 2H2O (ΔH = -1323 kJ/mol) [8] (5)
It is assumed that both reactions take place on a catalyst to form ethylene oxide and by products (carbon dioxide and water).

32
A picture of the simulation layout is shown in figure 5.1. To simplify the simulation one reactor is used in the simulation.
Feed
Product
Figure 5.1 Simulation layout
5.3 Selection of compounds One of the first steps in the simulation is to identify all chemicals components that shall be involved in the simulation. The Aspen Physical Property System has a built in system for physical property data for many chemicals. The databank associated with Aspen Plus includes all of the components in the simulation shown in figure 5.2
Figure 5.2 Components used in simulation
Reactor

33
5.4 Thermodynamic models In process simulation the selection of a thermodynamic model is important to achieve an accurate process simulation. To select a Thermodynamic model that correlate with the system it requires knowledge of the system and the mixture that is involved in the simulation.
There are two types of fugacity models, equation of state and liquid-state activity-coefficient models. Equation of state is recommended for simple systems (nonpolar, small molecules) and in regions where activity- coefficient models are inappropriate. For complex liquid mixtures, activity-coefficient models are preferred, but only if all of the binary interaction parameters (BIPs) are available.
If the enthalpy of vaporization is an important part of the calculation, simple equation of state should not be used. The better choice in that case would be “latent heat” or “ideal”. [14]
5.4.1 Liquid-state activity-coefficient model For most chemical systems below the critical region, a liquid state activity-Coefficient Model is the best choice. Activity coefficient models can only be used to calculate liquid state fugacity and enthalpies of mixtures. These models give algebraic equations for the activity coefficient (ɣi) as a function of composition and temperature. Since the activity coefficient is a correction factor for the ideal solution model it cannot be used in the supercritical or “noncondensable” components. Activity coefficient correct for deviations of the liquid phase from ideal solution behavior as described in the equation (13) below.
∅𝑖𝑣𝑦𝑖𝑃 = 𝑃𝑖∗𝑥𝑖𝑦𝑖∅𝑖∗𝑒𝑥𝑒 �1𝑅𝑅 ∫ 𝑣𝑖𝑙𝑑𝑃
𝑃𝑃𝑖∗ � (eq.7)
Where ∅𝑖𝑣 is the fugacity coefficient of component i in the vapor phase mixture at temperature T and pressure P, yi is the vapor mole fraction of i, ∅𝑖∗ is the fugacity coefficient of pure i at its vapor pressure at T, 𝑣𝑖𝑙 is the molar volume of pure liquid i at T. [14]
Raoul’s Law is the ratio of the partial vapor pressure of each component to its vapor pressure as a pure liquid, pA/𝑒𝐴∗ and is approximately equal to the mole fraction of A in the liquid mixture. That’s what we call Raoul’s Law, pA = xA𝑒𝐴∗ . [19]The first two terms on either side of the equal sign in equation? Give Raoul’s Law and that the main remaining correction terms is yi, the activity coefficient. Thus, use of an activity coefficient model requires values for the pure component vapor pressure at the temperature of the system. [14]
5.4.2 Equation of state An equation of state is an algebraic equation for the pressure of the mixture as a function of the composition, volume and temperature. Through standards thermodynamic relationships, the fugacity, enthalpy, and so on, can be determined for the mixture. These properties can be calculated for any density and therefore properties for liquid, vapor and supercritical phenomena can then be determined.

34
If the substance is above or near its critical temperature, equation of state must be used. If polar substances such as water are present the user should be extra careful. For most systems containing hydrocarbon or light gases, an equation of state model is the best choice. The initial choice should be the Peng-Robins (PR) or Soave-Redlich-Kwong equation (SRK). They normally use three pure-component parameters per substance and one binary interaction parameter (BIP) per binary pair. The PR and SRK give accurate results in the supercritical region but are known to be poor predictors of enthalpy changes and are not quantitatively accurate for phase equilibria except for light hydrocarbons.
The predicted equilibria are a strong function of the BIP: s. These parameters can be determined by regressions options from experimental phase equilibrium data. The fit gives a first order approximation for the accuracy of the equation of state. If BIPs are provided in the simulator and no obvious choice is to distinguish the choice of equation of state models a separate simulation should be performed for each equation of state model. The difference between the simulations can be used to make a crude measure of the uncertainty. [14]
5.4.3 Selection of physical property model A Property Method is a collection of models and methods used to calculate physical properties. Property methods containing commonly used thermodynamic models are provided in Aspen Plus. The user can use an existing Property method, modify an existing Property method or create a new one. [15]
The physical property models can be divided into the following:
• Ideal • Equation of State Models (EOS) • Activity Coefficient models • Special Models
The choice of model depends on the degree of non-ideal behavior, operating conditions, and availability of parameters. In figure 5.3 a flow chart is presented and by following the flow chart a physical property model that fits the system be chosen. [16]

35
Figure 5.3 Flow chart for the collection of phase equilibria method [16]
A comparison of Equation of State Model and Activity Coefficient Model is presented in table 5.1.
Table 5.1 Comparison between Equation of State and Activity Coefficient models [15]
Equation of State Model Activity Coefficient Model Good for vapor phase modeling and liquid of low polarity
Good for liquid phase modeling only
Limited in ability to represent non-ideal liquids Can represent highly non-ideal liquid Fewer binary parameters required Many binary parameters required Parameters extrapolated reasonable with temperatures
Binary parameters are highly temperature dependent
Consistent in critical region Inconsistent in critical region Examples:
• Peng-Robins (PENG-ROB) • Soave-Redlich Kwong (RK-SOAVE)
Examples: • NRTL • UNIFAC • UNIQUAC • WILSON
5.4.3.1 Redlich-Kwong and Soave- Redlich Kwong The Redlich-Kwong equation is an extension of Van der Waal’s equation. The Redlich-Kwong equation is:
)(2 2/1 bVVTa
baVPTP
+⋅
−= (eq.8)

36
Where, a = 0,427R2𝑇𝑐2,5/Pc
b = 0,08664RTc/Pc P = pressure V = volume The Redlich-Kwong equation is not suitable for use near the critical pressure (Pr > 0,8) or for liquids.
Redlich-Kwong-Soave equation is a modified Redlich-Kwong equation to work better in the critical region and for use with liquids. [16]
It is recommended for hydrocarbon processing applications such as gas processing, refinery and petrochemical processes. Its results are comparable to those of the Standard Peng Robinson equation of state. [15]
5.4.3.2 Standard Peng-Robinson The Peng-Robinson equation is related to the Redlich-Kwong-Soave equation of state and was developed to overcome the instability in the Redlich-Kwong-Soave equation near the critical point. [16]
The standard Peng-Robinson equation of state is the original formulation of the Peng-Robinson equation of state with standard alpha function. It is as for Redlich-Kwong-Soave equation recommended for hydrocarbon processing applications such as gas processing, refinery and petrochemical processes. Its results are comparable to those of the Redlich-Kwong-Soave equation of state. [15]
5.4.4 Property model in simulation In process simulation the selection of a thermodynamic model is important to achieve an accurate process simulation. To select a Thermodynamic model that correlate with the system it requires knowledge of the system and the mixture that is involved in the simulation.
In most of the simulation programs there are built in helps to select a thermodynamic model that is suitable for the system within the simulation. To select the most accurate thermodynamic model a built in system with questions is available in the Aspen Plus® simulation program. The choice from each step is marked with √.
1. Select one of the following options: - Specify component type √ - Specify process type
2. Select the type of component system: - Chemical system - Hydrocarbon System √ - Special (water only, amines, Sour water, carboxylic acid, HF, electrolyte)
37
- Refrigerants 3. Does the mixture contain petroleum assays or pseudo components?
- Yes - No √
Results: Use one of the standard equations of state models, such as PENG-ROB (Peng-Robinson), SRK (Soave-Redlich-Kwong) or LK-PLOCK (Lee-Kesler-Plocker).
The Lee-Kesler-Plocker method can be used in gas-processing and refinery applications but it’s recommended to use Peng Robinson or Soave- Redlich-Kwong instead. [15]
The result from the literature study of thermodynamic models and the built in help in Aspen Plus recommended using a Peng-Robinson or a Soave-Redlich-Kwong equation of state model. In this simulation a SRK (Soave-Redlich-Kwong) model is used.
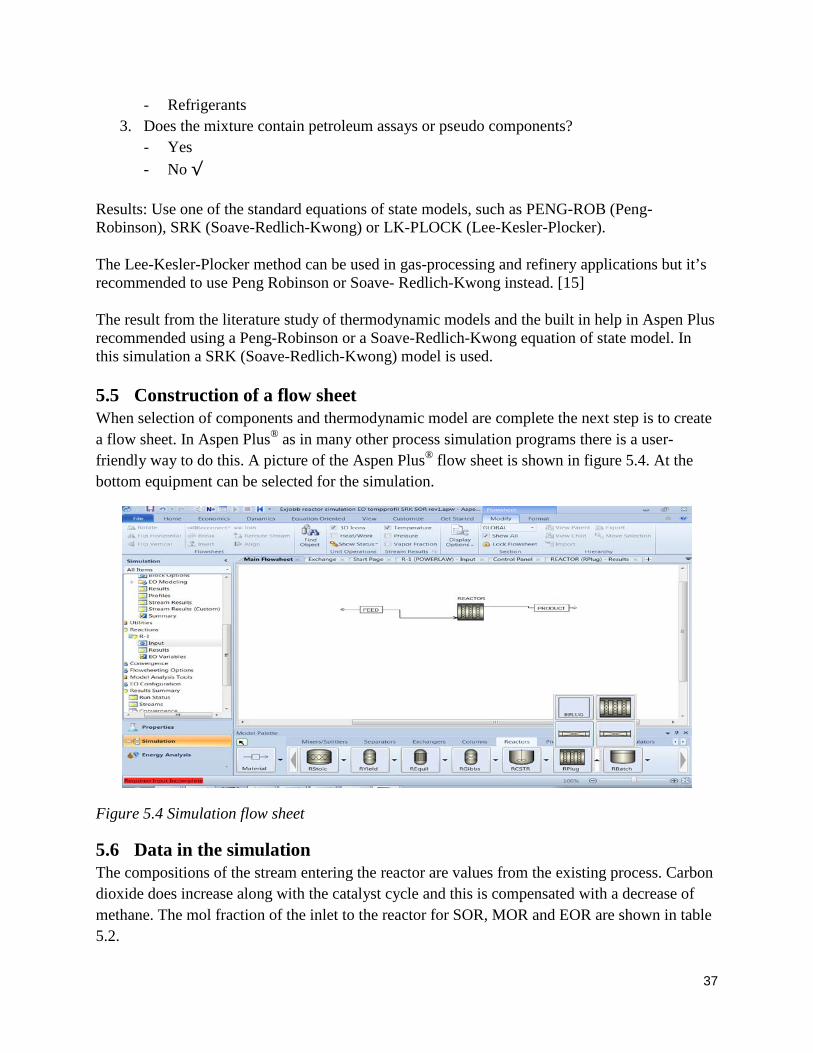
5.5 Construction of a flow sheet When selection of components and thermodynamic model are complete the next step is to create a flow sheet. In Aspen Plus® as in many other process simulation programs there is a user-friendly way to do this. A picture of the Aspen Plus® flow sheet is shown in figure 5.4. At the bottom equipment can be selected for the simulation.
Figure 5.4 Simulation flow sheet
5.6 Data in the simulation The compositions of the stream entering the reactor are values from the existing process. Carbon dioxide does increase along with the catalyst cycle and this is compensated with a decrease of methane. The mol fraction of the inlet to the reactor for SOR, MOR and EOR are shown in table 5.2.

38
Table 5.2 Composition (mol frac.) of the inlet to the reactors at SOR, MOR and EOR [21]
Components SOR (mol frac.) MOR (mol frac.) EOR (mol frac.) EO
Nitrogen Oxygen Ethylene Methane
Carbon dioxide Ethane Water Argon
0.0002 0.05 0.07 0.3
0.44298 0.035 0.02
0.002 0.08
0.0002 0.05 0.07 0.3
0.43298 0.045 0.02
0.002 0.08
0.0002 0.05 0.07 0.3
0.42298 0.055 0.02
0.002 0.08
The temperature profile in the reactor is increased during catalyst time and this is shown for SOR, MOR and EOR in table 5.3. For these profiles, position is specified as fractional distance along the length of the reactor from 0.0 at the inlet to 1.0 at the exit.
Table 5.3 Temperature profiles used in simulation for SOR, MOR and EOR. Positions is specifies as fractional
Position SOR (°C) MOR (°C) EOR (°C) 0.1
0.2 0.3 0.4 0.5 0.6 0.7 0.8 0.9
240 250 255 255 255 255 255 255 255
255 260 265 265 265 265 265 265 265
255 265 270 270 270 270 270 270 270
5.6.1 Kinetics in simulation As mentioned before two reactions, (4) and (5) are considered in the simulation to simplify it. Three different operation scenarios were studied, start of run (SOR), middle of run (MOR) and end of run (EOR). The selectivity towards ethylene oxide is highest in the beginning and decreases during the catalyst cycle. When the selectivity towards ethylene oxide decreases more CO2 and water are produced which results in more heat formation.
To simplify the simulation one reaction of rate equation is used for each reaction (4) and (5). To determine the rate of reaction the power law reaction kinetic is used.
From the Arrhenius equation described in previous chapter the rate constant (k) is increased by increased temperature (T), increased pre-exponential factor (A) or decreased activation energy (E).

39
Kinetic parameters from literature shown in table 5.4 were used as a starting point. To achieve a result that was comparable with reality the kinetic parameters were then adjusted to fit the system.
Table 5.4 Kinetic parameters [20]
Kinetic parameters Literature A4 A5
E4 (kJmol-1) E5 (kJmol-1)
3.1574 x 10⁴
3.2587 x 10⁴ 69.49 81.77
Due to deactivation of the catalyst the temperature in the reactor is increased during operational time. With higher temperature the rate of reaction is increased.
The first step in the simulation was to adjust the kinetic parameters from literature to fit the simulation for start of run (SOR). To increase the formation of ethylene oxide, the activation energy (E4) in reaction (4) was decreased. To decrease the formation of CO2 and water the activation energy for reaction (5) were increased.
The second step in the simulation was to adjust the kinetic parameters from start of run, now with a higher reactor temperature to fit the performance middle of run (MOR). To do this the activation energies for both reactions (E4 and E5) were increased.
The third step in the simulation was to adjust the kinetic parameters from middle of run (MOR), now with an even higher reactor temperature to fit the performance end of run (EOR). To do this the activation energies for both reactions (E4 and E5) were increased.

40
6 Result and Discussion The objective with this thesis was to create a simulation model of an ethylene oxide reactor which is consistent with existing catalyst performance.
To get a model that is consistent with reality, data from PFD:s (process flow diagram) at Akzo Nobel was used as a starting point. These data are shown in table 6.1, 6.2 and 6.3 for start of run, middle of run and end of run.
Table 6.1 Process data for SOR collected from PFD:s at AkzoNobel [21]
Components SOR inlet of the reactor Data from PFD:s at
AkzoNobel
SOR outlet of the reactor Data from PFD:s at
AkzoNobel EO
Nitrogen Oxygen Ethylene Methane
Carbon dioxide Ethane Water Argon
132 20967 33529
125981 102056 23057 900 539
47838
13674 20967 23607
115895 102056 27646 900
2418 47838
Table 6.2 Process data for MOR collected from PFD:s at AkzoNobel [21]
Components MOR inlet of the reactor Data from PFD:s at
AkzoNobel
MOR outlet of the reactor Data from PFD:s at
AkzoNobel EO
Nitrogen Oxygen Ethylene Methane
Carbon dioxide Ethane Water Argon
130 20722 33138
124512 98493 29300 890 533
47281
13672 20722 21917
114047 98493 35079 890
2899 47281

41
Table 6.3 Process data for EOR collected from PFD:s at AkzoNobel [21]
Components EOR inlet of the reactor Data from PFD:s at
AkzoNobel
EOR outlet of the reactor Data from PFD:s at
AkzoNobel EO
Nitrogen Oxygen Ethylene Methane
Carbon dioxide Ethane Water Argon
129 20484 32757
123078 95012 35398
879 527
46736
13671 20484 20089
112190 95012 42504
879 3436
46736
The selectivity for SOR, MOR and EOR calculated from data from PFD:s at AkzoNobel is presented in table 6.4.
Table 6.4 Selectivity calculated with values from Table 6.1, 6.2 and 6.3 [21]
Selectivity SOR
MOR EOR
85,3 % 82,2 %
79,1
The selectivity decreases with time and this is because of deactivation of the catalyst. When selectivity decreases the CO2 and water formation increase as is shown in table 6.1, 6.2 and 6.3.
The next step in the simulation was to collect a thermodynamic model. The selection of an accurate thermodynamic model is essential to create a simulation that corresponds with reality.
The result of a comparison with a Peng-Robinson equation of state models is shown in 6.5 for SOR, 6.6 for MOR and 6.7 for EOR. In table 6.5, 6.6 and 6.7 a comparison of the outlet composition is shown when Soave-Redlich-Kwong and Peng Robinson is used. Everything else is constant and only the physical property model is changed.

42
Table 6.5 Comparison of the outlet composition for SOR when Soave-Redlich-Kwong is used and when Peng Robinson is used
Components SOR outlet of the reactor (kg/h) (Soave-Redlich-Kwong)
SOR outlet of the reactor (kg/h) (Peng Robinson)
EO
Nitrogen Oxygen Ethylene Methane
Carbon dioxide Ethane Water Argon
13400 19979 18910
109130 101367 29469 8578 3583
45585
13575 19978 18700
108976 101367 29602 8578 3638
45584
Table 6.6 Comparison of the outlet composition for MOR when Soave-Redlich-Kwong is used and when Peng Robinson is used
Components MOR outlet of the reactor (kg/h) (Soave-Redlich-Kwong)
MOR outlet of the reactor (kg/h) (Peng Robinson)
EO
Nitrogen Oxygen Ethylene Methane
Carbon dioxide Ethane Water Argon
13350 19754 18703
107665 97962 35883 8481 3763 45071
13514 19754 17866
107517 97962 36017 8481 3819 45071
Table 6.7 Comparison of the outlet composition for EOR when Soave-Redlich-Kwong is used and when Peng Robinson is used
Components EOR outlet of the reactor (kg/h) (Soave-Redlich-Kwong)
EOR outlet of the reactor (kg/h) (Peng Robinson)
EO
Nitrogen Oxygen Ethylene Methane
Carbon dioxide Ethane Water Argon
13514 19534 17120
106079 94633 42205 8387 3961
44569
13680 19534 16900
105926 94633 42351 8387 4021
44569

43
A comparison with values from the PFD:s from AkzoNobel (table 6.1, 6.2, 6.3) and the simulation model with Soave-Redlich-Kwong and Peng Robinson (table 6.5, 6.6, 6.7) tell that the values are not exact but close to each other. Based on the comparison there is nothing to say that one model is better than the other. In this simulation a Soave-Redlich-Kwong equation of state model was chosen. The choice of model was based on the knowledge that Soave-Redlich-Kwong equation of state model is proven to give a better fit of a system which includes condensation of water. This will occur when the simulation is expanded and the heat exchanger downstream of the reactor is included.
The Argon value is high in the simulation and this is because the mol fraction value should be 0.002 instead of 0.02 in table 5.2. This need to be adjusted in future modeling.
Three various operating conditions were studied, Start of Run, Middle of Run and End of Run. In the first step a simulation for Start of Run was created. Start of Run (SOR) which represents the conditions at the beginning of the catalyst cycle. In table 6.8 the kinetic parameters is shown for the literature value and the adjusted value for SOR. The activation energies for partial oxidation and total oxidation were adjusted to fit the conditions at SOR, which is shown in table 6.9.
Table 6.8 Kinetic parameters for the simulation at SOR. The activation energy for partially oxidation is decreased from the literature value. The activation energy for totally oxidation is
increased from the literature value. [20]
Kinetic parameters Literature (starting point) SOR (first step) A4 A5
E4 (kJmol-1) E5 (kJmol-1)
3.1574 x 10⁴
3.2587 x 10⁵ 69.49 81.77
3.1574 x 10⁴
3.2587 x 10⁵ 66.4 94.2
Table 6.9 Composition of the inlet and outlet of the reactor at SOR
Components SOR inlet of the reactor (kg/h) SOR outlet of the reactor (kg/h) EO
Nitrogen Oxygen Ethylene Methane
Carbon dioxide Ethane Water Argon
12.567 19979 31950
120045 101367 21971 8578 514
45585
13400 19979 18910
109130 101367 29469 8578 3583
45585

44
A comparison with values in table 6.1 (PFD: s values from AkzoNobel) and table 6.9 (values from the simulation for SOR) show that the values are close to each other.
Conversion per pass results are presented in table 6.6 for SOR
Table 6.10 Conversion of ethylene and oxygen
Conversion SOR (simulation) SOR (PFD AkzoNobel) Ethylene conversion 8 % 8 %
The ethylene conversions from literature are between 7-15 % [22]. Comparison with simulation and PFD:s from AkzoNobel shows that the values are similar.
In the second step a simulation for Middle of Run was created. Middle of Run (MOR) which represents the conditions when the catalyst has been running for 12 months. In table 6.11 the kinetic parameters is shown for the SOR value and the adjusted value for MOR. The activation energies for partially oxidation and totally oxidation were adjusted to fit the conditions at MOR, which is shown in table 6.12.
Table 6.11 Kinetic parameters for the simulation at MOR. The activation energy for partially oxidation is increased from the SOR value. The activation energy for totally oxidation is
increased from the SOR value.
Kinetic parameters SOR(first step) MOR (second step) A4 A5
E4 (kJmol-1) E5 (kJmol-1)
3.1574 x 10⁴
3.2587 x 10⁵ 66.4 94.2
3.1574 x 10⁴
3.2587 x 10⁵ 67.6 95.7
Shown in table 6.11 is that MOR has higher activation energy than SOR. This is because of deactivation of the catalyst and is compensated with higher temperatures in the reactors, see table 5.3.

45
Table 6.12 Composition of the inlet and outlet of the reactor at MOR
Components MOR inlet of the reactor (kg/h) MOR outlet of the reactor (kg/h) EO
Nitrogen Oxygen Ethylene Methane
Carbon dioxide Ethane Water Argon
12.426 19754 31589
118692 97962 27930 8481 508
45071
13350 19754 18703
107665 97962 35883 8481 3763 45071
A comparison with values in table 6.2 (PFD:s values from AkzoNobel) and table 6.12 (values from the simulation for MOR) show that the values are close to each other. An increase in carbon dioxide and water is a result from a decrease of selectivity due to deactivation of the catalyst.
Conversions per pass results are presented in table 6.13 for MOR.
Table 6.13 Conversion of ethylene and oxygen
Conversion MOR (simulation) MOR (PFD AkzoNobel) Ethylene conversion 9.3 % 8.4 %
Ethylene conversion is a little bit higher in the simulation and the reason is that the simulation needs additional fine tuning.
In the third step a simulation for End of Run was created. End of Run (EOR) which represents the conditions when the catalyst has been running for 24 months. In table 6.14 the kinetic parameters is shown for the MOR value and the adjusted value for EOR. The activation energies for partial oxidation and total oxidation were adjusted to fit the conditions at EOR, which is shown in table 6.15.
Table 6.14 Kinetic parameters for the simulation at EOR. The activation energy for partially oxidation is increased from the EOR value. The activation energy for totally oxidation is
increased from the MOR value.
Kinetic parameters MOR(starting point) EOR (second step) A4 A5
E4 (kJmol-1) E5 (kJmol-1)
3.1574 x 10⁴
3.2587 x 10⁵ 67.6 95.7
3.1574 x 10⁴
3.2587 x 10⁵ 68.1 96.3

46
Shown in table 6.14 is that EOR has higher activation energy than MOR. This is again because of deactivation of the catalyst and is compensated with higher temperatures in the reactors, see table 5.3.
Table 6.15 Composition of the inlet and outlet of the reactor at EOR
Components EOR inlet of the reactor (kg/h) EOR outlet of the reactor (kg/h) EO
Nitrogen Oxygen Ethylene Methane
Carbon dioxide Ethane Water Argon
12.287 19534 31237
117370 94633 33756 8387 502
44569
13514 19534 17120
106079 94633 42205 8387 3961
44569
A comparison with values in table 6.3 (PFD:s values from AkzoNobel) and table 6.15 (values from the simulation for EOR) show that the values are close to each other. An increase in carbon dioxide and water is a result from a decrease of selectivity due to deactivation of the catalyst.
Conversion per pass results are presented in table 6.16 for EOR
Table 6.16 Conversion of ethylene and oxygen
Conversion EOR (simulation) EOR (PFD AkzoNobel) Ethylene conversion 9.6 % 8,9 %
Ethylene conversion is higher in the simulation and the reason is that the simulation needs additional fine tuning.
Three various operating conditions, start of run, middle of run and end of run were studied. Along with the catalyst cycle a decrease in selectivity towards ethylene oxide was seen, showed in figure 6.1.

47
Figure 6.1 The change of selectivity over time
The selectivity’s in the simulation are smaller than the selectivity’s calculated from PFD data from AkzoNobel. This could be that the simulations need additional fine tuning to better suit the reality.
The activation energy is increased over time for both partially oxidation and totally oxidation shown in figure 6.2
Figure 6.2 A change of activation energy for partial oxidation of ethylene to ethylene oxide and total oxidation of ethylene to CO2 and water.
Shown in figure 6.2 is that the activation energy increases over time. The reason for this is deactivation of the catalyst and this need to be compensated with increased temperatures in the reactors, shown in table 5.3.
60
65
70
75
80
85
90
95
100
SOR MOR EOR
Activation energyfor formation of EO
Activation energyfor formation ofCO2 and water

48
An increase in heat formation was seen, shown in figure 6.3.
Figure 6.3 The change of heat duty over time
The selectivity towards ethylene oxide is decreased over time and this is a result from deactivation of the catalyst. When this happens more ethylene is totally oxidized to form carbon dioxide and water and this reaction has a higher heat of reaction compared to when ethylene is oxidized to form ethylene oxide, shown in (4) and (5). The result from this is that more heat is created over time that needs to be cooled off in the reactors.
-24000
-23500
-23000
-22500
-22000
-21500
-21000SOR MOR EOR
Heat duty (kW)
Heat duty

49
7 Conclusions The objective with this thesis was to create a simulation of an ethylene oxide reactor which is consistent with existing catalyst performance.
The selection of an accurate thermodynamic model is essential to create a simulation that corresponds with reality. In this simulation a Soave-Redlich-Kwong equation of state model was chosen. For this simulation a Peng Robinson will give similar results. Soave-Redlich-Kwong was chosen because it is proven to give a better fit of a system which includes condensation of water. This will occur when the simulation is expanded and the heat exchanger downstream of the reactors is included.
As the catalyst ages the activation energies, for both partially oxidation of ethylene to ethylene oxide and fully oxidation of ethylene to CO2 and water increase. The reason for this is deactivation of the catalyst which leads to lower selectivity towards ethylene oxide. To compensate for higher activation energy the temperatures in the reactors needs to be increased. By minimizing the operating temperature, avoid impurities in the feed and to optimize the concentration of chlorides the catalyst can operate for a longer time with an optimized selectivity towards ethylene oxide.
As the catalyst ages the selectivity decreases and this is shown with values from PFD:s at AkzoNobel and also with values from the simulation model. The reason for this is deactivation of the catalyst. The selectivity is a little bit low compared to reality and this can be adjusted by fine tuning the simulation model.
The Argon value is high in the simulation model compared to reality and this is because the mol fraction value should be 0.002 instead of 0.02 in table 5.2. This need to be adjusted in future modeling.
The selectivity towards ethylene oxide is decreased over time and this is a result from deactivation of the catalyst. When this happens more ethylene is totally oxidized to form carbon dioxide and water and this reaction has a higher heat of reaction compared to when ethylene is oxidized to form ethylene oxide, shown in (4) and (5). The result from this is that more heat is created over time that needs to be cooled off in the reactors
There is no general reaction kinetics available in the literature. A result from this work is that it is possible to adjust literature data to suit existing process. The simulation models need more fine tuning in future work.

50
8 Recommendations for the future Catalyst industry do research and continuously develop new catalysts for the ethylene oxide production. For future work to improve selectivity towards ethylene oxide the development of catalyst should be followed. When a new ethylene oxide catalyst is considered it’s important to study the process parameters the specific catalyst requires such as operating temperature, concentrations of ethylene and carbon dioxide. For the economic evaluation it’s important to consider the concentration of silver in the catalyst.
The Argon value is high in the simulation model compared to reality and this is because the mol fraction value should be 0.002 instead of 0.02 in table 5.2. This need to be adjusted in future modeling.
In the evaluation of a new type of catalyst the simulation can be used as a starting point. After new parameters from the catalyst supplier have been inserted in the simulation the kinetic parameters (activation energy) needs to be adjusted to fit the desirable process. After this is done its important is to establish that the catalyst can operate within flammable limit and design parameters of the equipment.

51
9 References
1. John J. McKetta, Encyclopedia of Chemical Processing and Design, volume 20 2. Kirk-Othmer, Encyclopedia of Chemical Technology, volume 9 fourth edition 3. Akzonobel.com 4. Bengt Berglund, Den petrokemiska revolutionen, svensk petrokemisk industri 1960-
2010 5. Ethylene Oxide Product Stewardship Guidance Manual, third edition 6. chemical.ihs.com/CEH/Public/Reports/654.5000/ 7. J. C. Zomerdijk and M. W. Hall. Technology for the Manufacture of Ethylene Oxide 8. Ullmann’s, Encyclopedia of Industrial Chemistry, volume A10, Fifth Completely
Revered Edition 9. C.H Bartholomew and R.J. Farrauto, Fundamentals of Industrial Catalytic Processes,
second edition 10. CRI, Catalyst training material, 2014 11. Introduktionsbok EO/verksamhetssystemet på Akzo Nobel 12. Ethylene Oxide Product Stewardship Guidance Manual, third edition 13. Nils-Åke Danielsson, Kemisk Reaktionsteknik Komplettering, Andra upplagan 14. R. Turton, R.C.Baillie, W.B.Whiting, J.A.Shaeiwitz. Analysis, Synthesis and Design of
Chemical Process, second edition 15. Built in help in Aspen Plus® 16. R K Sinnot, Coulson &Richardson’s Chemical Engineering, volume 6 third edition 17. Robert H. Perry, Don W. Green. Perry’s Chemical Engineer’s Handbook 7th Ed. 18. P.W. Atkins. Physical Chemistry ATKINS 6th Ed. University of Oxford, and Fellow of
Lincoln College 19. C. Stegelmann, N.C Schiodt, C.T. Campbell, P. Stoltze, Microkinetic modeling of
ethylene oxide over silver 20. Xing-Gui Zhou, Wei-Kang Yuan, Optimization of the fixed-bed reactor for ethylene
epoxidation 21. Aspen Process Explorer and Process Flow Diagrams at Akzo Nobel 22. Janet Huang, Gina Tran, Ethylene oxide reactor system jEO & Associates

52
Appendix 1
Thesis: Simulation of a reactor model in EO
Task Days 8 9 10 11 12 13 14 15 16 17 18 19 20 21 22 23 24 25Knowlege of process 15
Literature Study 10
Collecting data of Process 5
Simulation 30
Preperation of presentation 3
Presentation of Theises 1
Report writing 60
Week

53