a set of nutrient limitations trigger yeast cell death in
TRANSCRIPT
HAL Id: hal-01608237https://hal.archives-ouvertes.fr/hal-01608237
Submitted on 26 May 2020
HAL is a multi-disciplinary open accessarchive for the deposit and dissemination of sci-entific research documents, whether they are pub-lished or not. The documents may come fromteaching and research institutions in France orabroad, or from public or private research centers.
L’archive ouverte pluridisciplinaire HAL, estdestinée au dépôt et à la diffusion de documentsscientifiques de niveau recherche, publiés ou non,émanant des établissements d’enseignement et derecherche français ou étrangers, des laboratoirespublics ou privés.
Distributed under a Creative Commons Attribution| 4.0 International License
A set of nutrient limitations trigger yeast cell death in anitrogen-dependent manner during wine alcoholic
fermentationCamille Duc, Martine Pradal, Isabelle Sanchez, Jessica Noble, Catherine
Tesniere, Bruno Blondin
To cite this version:Camille Duc, Martine Pradal, Isabelle Sanchez, Jessica Noble, Catherine Tesniere, et al.. A set ofnutrient limitations trigger yeast cell death in a nitrogen-dependent manner during wine alcoholic fer-mentation. PLoS ONE, Public Library of Science, 2017, 12 (9), 22 p. �10.1371/journal.pone.0184838�.�hal-01608237�
RESEARCH ARTICLE
A set of nutrient limitations trigger yeast cell
death in a nitrogen-dependent manner
during wine alcoholic fermentation
Camille Duc1,2, Martine Pradal1, Isabelle Sanchez1, Jessica Noble2, Catherine Tesnière1,
Bruno Blondin1*
1 UMR SPO, INRA, Montpellier SupAgro, Universite de Montpellier, Montpellier, France, 2 Lallemand SAS,
Blagnac, France
Abstract
Yeast cell death can occur during wine alcoholic fermentation. It is generally considered to
result from ethanol stress that impacts membrane integrity. This cell death mainly occurs
when grape musts processing reduces lipid availability, resulting in weaker membrane resis-
tance to ethanol. However the mechanisms underlying cell death in these conditions remain
unclear. We examined cell death occurrence considering yeast cells ability to elicit an appro-
priate response to a given nutrient limitation and thus survive starvation. We show here that
a set of micronutrients (oleic acid, ergosterol, pantothenic acid and nicotinic acid) in low,
growth-restricting concentrations trigger cell death in alcoholic fermentation when nitrogen
level is high. We provide evidence that nitrogen signaling is involved in cell death and that
either SCH9 deletion or Tor inhibition prevent cell death in several types of micronutrient lim-
itation. Under such limitations, yeast cells fail to acquire any stress resistance and are
unable to store glycogen. Unexpectedly, transcriptome analyses did not reveal any major
changes in stress genes expression, suggesting that post-transcriptional events critical for
stress response were not triggered by micronutrient starvation. Our data point to the fact
that yeast cell death results from yeast inability to trigger an appropriate stress response
under some conditions of nutrient limitations most likely not encountered by yeast in the
wild. Our conclusions provide a novel frame for considering both cell death and the manage-
ment of nutrients during alcoholic fermentation.
Introduction
During wine alcoholic fermentation, yeast cells have to withstand numerous stresses such as
osmotic stress, low pH, high ethanol level and nutrient depletion. Some adaptation to these
stresses is required to maintain high cell viability up to the end of alcoholic fermentation,
allowing complete sugar consumption. Depending on the severity of the stress, yeast cells can
lose their viability, which leads to sluggish or stuck fermentations [1]. Loss of viability during
alcoholic fermentation is usually attributed to an insufficient availability of lipids, specifically
PLOS ONE | https://doi.org/10.1371/journal.pone.0184838 September 18, 2017 1 / 22
a1111111111
a1111111111
a1111111111
a1111111111
a1111111111
OPENACCESS
Citation: Duc C, Pradal M, Sanchez I, Noble J,
Tesnière C, Blondin B (2017) A set of nutrient
limitations trigger yeast cell death in a nitrogen-
dependent manner during wine alcoholic
fermentation. PLoS ONE 12(9): e0184838. https://
doi.org/10.1371/journal.pone.0184838
Editor: Edward J Louis, University of Leicester,
UNITED KINGDOM
Received: April 26, 2017
Accepted: August 29, 2017
Published: September 18, 2017
Copyright: © 2017 Duc et al. This is an open
access article distributed under the terms of the
Creative Commons Attribution License, which
permits unrestricted use, distribution, and
reproduction in any medium, provided the original
author and source are credited.
Data Availability Statement: All relevant data are
within the paper and its Supporting Information
files. The complete microarray data set was
deposited in the Gene Expression Omnibus (GEO)
public repository (accession number GSE95152).
Microarray description is under GEO accession
number GPL17690.
Funding: Lallemand SAS decided to publish the
manuscript. Association Nationale de la Recherche
et de la Technologie: Convention Industrielle de
Formation par la Recherche n˚2014/0017: had no
sterols or unsaturated fatty acids, given that a membrane deficiency in these compounds is
thought to alter cell resistance to ethanol [2].
Recent studies in yeast ageing have provided a novel framework to address the issue of cell
death during fermentation. Actually, the loss of yeast viability in stationary phase can be
addressed as chronological ageing since the survival of individual yeast cells in such non-divid-
ing stationary phase can be used as a measure of the chronological lifespan [3]. An important
conclusion from ageing studies is that yeast resistance to starvation can be influenced by the
nature of the nutrient limiting cell growth [4]. Specifically, depending on nutrient limitation,
yeast cells elicit different physiological responses and are unable to survive when starvation is
due to an unusual nutrient limitation. During evolution, yeast has developed physiological
responses to cope with nutrient limitations it frequently faced in natural environments, such
as carbon, nitrogen, phosphate or sulfate (which will be hereafter described as usual limiting
nutrients) but not for “unusual” limitations in some specific nutrients i.e. resulting from an
induced auxotrophy (termed hereafter unusual limiting nutrients) [4]. Adaptation to starva-
tion has been shown to involve nutrient sensing signaling pathways, i.e. target of rapamycin
(TOR) and protein kinase A (PKA), their inactivation leading to enhanced chronological life-
span [5]. TOR pathway’s activity is modulated by the availability of nitrogen sources during
starvation. In a recent work, Tesnière et al [6] have shown that, during alcoholic fermentation,
the loss of yeast viability associated with yeast growth limitation by ergosterol was modulated
by the medium’s nitrogen content, a high nitrogen level leading to enhanced cell death [6].
Consistent with a key role of TOR/Sch9 signaling in triggering cell death, both Tor inhibition
by rapamycin and SCH9 deletion resulted in increased cell survival. These data pointed to
yeast inability to adapt to ergosterol limitation suggesting that it corresponds to an unusual
nutrient limitation for yeast cells as previously defined. This is indeed consistent with yeast
conditional requirement for ergosterol that restricts the auxotrophy to this compound to
highly anaerobic conditions that are probably only encountered in industrial situations. We
therefore examined whether other nutrients limitation could lead to a similar lack of adapta-
tion to starvation and to a loss of cell viability during alcoholic fermentation. In addition to lip-
ids, yeast is known to require several micronutrients such as thiamin, nicotinic acid,
pantothenic acid, etc. to achieve alcoholic fermentation [7].
Little is known about the effect of growth limitation by these compounds on yeast viability
during alcoholic fermentation. As nutrient disequilibriums leading to these situations are still
not well-known and because the underlying mechanisms are poorly understood, the present
paper aims at clarifying the molecular mechanisms involved in the occurrence of yeast cell
death in response to nutritional unbalances through a combination of functional genomic
approaches. We show here that several micronutrients limitations lead to cell death during
alcoholic fermentations in a nitrogen-dependent manner. We characterized yeast response to
starvation stress through a combination of functional approaches and show that cell death
involves nitrogen signaling associated with an absence of stress response.
Materials and methods
Strains
We used the commercial wine yeast strain Lalvin EC11181, a Saccharomyces cerevisiae strain
isolated in Champagne (France) and manufactured by Lallemand (Montreal). The haploid
strain 59a was obtained after sporulation of Lalvin EC11181 as described by Ambroset et al
[8]. A SCH9-deleted mutant of 59A was generated as described by Tesnière [6]. It was con-
structed by PCR-mediated gene disruption using the loxP-KanMX- loxP cassette of the pUG6
Yeast cell death in wine alcoholic fermentation
PLOS ONE | https://doi.org/10.1371/journal.pone.0184838 September 18, 2017 2 / 22
role in study design, data collection and analysis,
decision to publish, or preparation of the
manuscript.
Competing interests: Jessica Noble and Camille
Duc are employed by Lallemand SAS. We assure
that this does not alter our adherence to PLOS ONE
policies on sharing data and materials.
vector amplified with synthetic primers, to replace the ORF in 59A strain with a gene confering
resistance to G418. Gene disruptions and constructs were confirmed by PCR.
Synthetic culture media
Unless otherwise specified, a synthetic fermentation medium with 425 mg/L assimilable nitro-
gen (SM425) and 23% glucose + fructose (1/1), strictly buffered to pH 3.3 and simulating one
third nitrogen and amino acid concentrations of a standard grape juice was routinely used [9].
This medium contained, per liter: 115 g glucose, 115 g fructose, 6 g citric acid, 6 g DL-malic
acid, 750 mg KH2PO4, 500 mg K2SO4, 250 mg MgSO4.7H2O,155 mg CaCl2.2H2O, 200 mg
NaCl, 4 mg MnSO4.H2O, 4 mg ZnSO4. 7H2O, 1 mg CuSO4.5H2O, 1 mg KI, 0.4 mg
CoCl2.6H2O, 1 mg H3BO3, 1 mg (NH4)6Mo7O24, 20 mg myo-inositol, 2 mg nicotinic acid,
1.5 mg calcium pantothenate, 0.25 mg thiamine- HCl, 0.25 mg pyridoxine and 0.003 mg bio-
tin. It also contained ammoniacal nitrogen and amino acids as nitrogen sources (per liter): 460
mg NH4Cl, 612 mg L-proline, 505 mg L-glutamine, 179 mg L-tryptophane, 145 mg L-alanine,
120 mg L-glutamic acid, 78 mg L-serine, 76 mg L-threonine, 48 mg L-leucine, 45 mg L-aspartic
acid, 45 mg L-valine, 38 mg L-phenylalanine, 374 mg L-arginine, 33 mg L-histidine, 33 mg L-
isoleucine, 31 mg L-methionine, 18 mg L-glycine, 17 mg L-lysine, 18 mg L-tyrosine and 13 mg
L-cysteine. The medium was heat-sterilized (100˚C, 10 min). Lipid factors (LF) were added to
the fermentation medium after sterilization, to a final concentration of 530 mg/L oleic acid
and 15 mg/L ergosterol. To evaluate the adaptation to nutrient limitations, eight main fermen-
tations conditions were established with different concentrations in the culture medium of:
ergosterol at 1.5 mg/L (Erg-: low ergosterol conditions), oleic acid at 18 mg/L (brought as
Tween 801, which is mainly a mix of oleate esters [10] (Ole-: low oleic acid conditions), panto-
thenic acid at 0.02 mg/L (Pan-: low pantothenic acid conditions) and nicotinic acid at 0.08
mg/L) (Nic-: low nicotinic acid conditions) with high: N+ (425 mg/L of yeast assimilable nitro-
gen) or low: N- (71 mg/L of yeast assimilable nitrogen) nitrogen level. Thiamin, biotin and
inositol starvation were also tested in condition of excess nitrogen with a concentration of
respectively 15 μg/L, 0.06 μg/L and 0.2 mg/L.
Fermentation conditions and kinetics
The yeast strain Lalvin EC11181 used in this study was precultured for 24 h at 28˚C in a nutri-
ent medium containing Yeast Nitrogen Base (YNB) (6.7 g/L) without amino acids and glucose
(20 g/L) in Erlenmeyer flasks. When tested, the Tor kinase inhibitor rapamycin was added at
20 nM. The fermentation medium was then inoculated at 106 cell/mL from this preculture.
Yeast cultures were carried out in fermenters (350 mL containing 300 mL or 1.2 L containing
1 L medium), with fermentation locks (CO2 bubbling outlets filled with water). Fermentation
media were routinely de-aerated prior to inoculation by bubbling pure argon for 5 min. Filling
conditions were controlled and fermentations were carried out under anaerobic and isother-
mal conditions (24˚C for 1,2L fermenters and 28˚C for 350 mL fermenters), with permanent
stirring (300 rpm). The amount of CO2 released was calculated from automatic measurements
for 1.2 L fermenter (taken every 20 min) or from manual measurements of fermenter weight
for 350 mL fermenters [11]. For 1.2 L fermenters, the CO2 production rate was calculated by
sliding-window second-order polynomial fitting on the last 11 measurements in a custom-
developed Labview application.
Cell population densities and cell viability determinations
In all the different experiments, cell populations were counted using a Beckman-Coulter elec-
tronic particle counter. Cell viability was determined by flow cytometry using a C6 cytometer
Yeast cell death in wine alcoholic fermentation
PLOS ONE | https://doi.org/10.1371/journal.pone.0184838 September 18, 2017 3 / 22
(Accuri, BD Biosciences): propidium iodide (PI) (Calbiochem) was added to the cell suspen-
sion (5 μL of a 0.1 mg/mL solution), and the samples mixed by gentle shaking. PI is a fluores-
cent nucleic acid stain (excitation 488 nm, emission 575 nm) which cannot penetrate intact
cell membranes. PI flow cytometry analysis was performed 15 min after staining. Fluorescence
data for cells stained by PI were collected in channel FL3. Viability was determined as the per-
centage of intact and fragile cells among all cells [12].
Experimental design for assessing the stress response under
micronutrient starvations
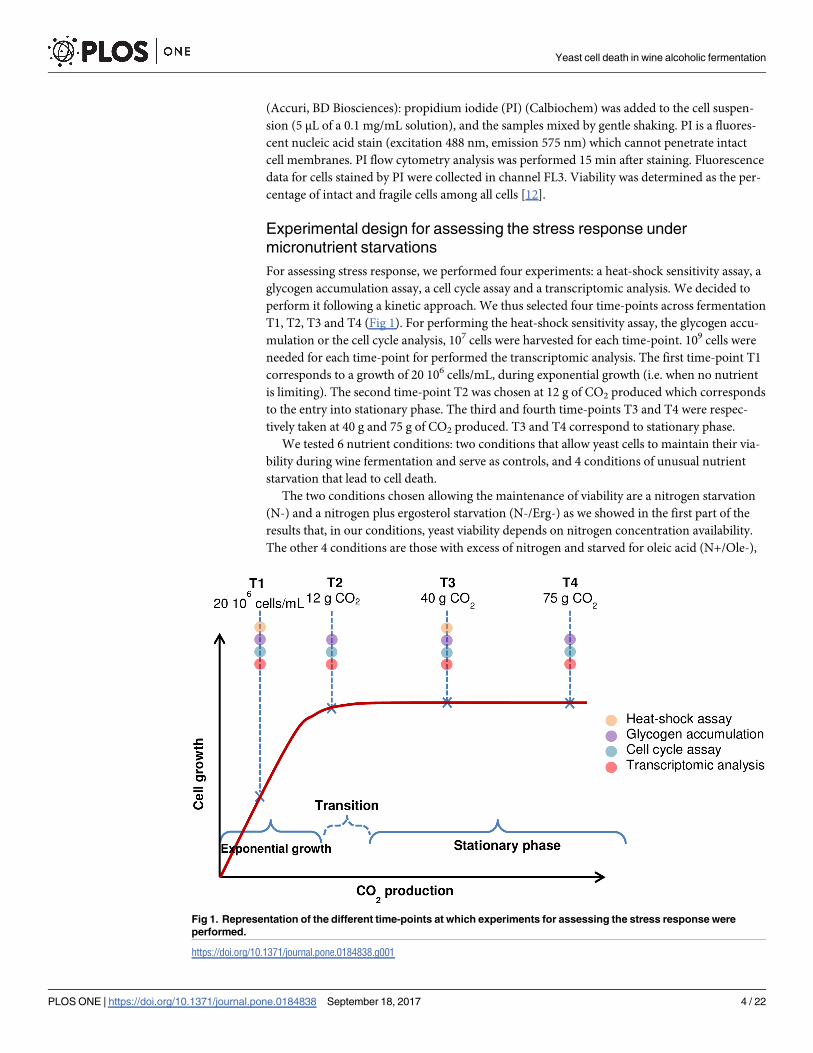
For assessing stress response, we performed four experiments: a heat-shock sensitivity assay, a
glycogen accumulation assay, a cell cycle assay and a transcriptomic analysis. We decided to
perform it following a kinetic approach. We thus selected four time-points across fermentation
T1, T2, T3 and T4 (Fig 1). For performing the heat-shock sensitivity assay, the glycogen accu-
mulation or the cell cycle analysis, 107 cells were harvested for each time-point. 109 cells were
needed for each time-point for performed the transcriptomic analysis. The first time-point T1
corresponds to a growth of 20 106 cells/mL, during exponential growth (i.e. when no nutrient
is limiting). The second time-point T2 was chosen at 12 g of CO2 produced which corresponds
to the entry into stationary phase. The third and fourth time-points T3 and T4 were respec-
tively taken at 40 g and 75 g of CO2 produced. T3 and T4 correspond to stationary phase.
We tested 6 nutrient conditions: two conditions that allow yeast cells to maintain their via-
bility during wine fermentation and serve as controls, and 4 conditions of unusual nutrient
starvation that lead to cell death.
The two conditions chosen allowing the maintenance of viability are a nitrogen starvation
(N-) and a nitrogen plus ergosterol starvation (N-/Erg-) as we showed in the first part of the
results that, in our conditions, yeast viability depends on nitrogen concentration availability.
The other 4 conditions are those with excess of nitrogen and starved for oleic acid (N+/Ole-),
Fig 1. Representation of the different time-points at which experiments for assessing the stress response were
performed.
https://doi.org/10.1371/journal.pone.0184838.g001
Yeast cell death in wine alcoholic fermentation
PLOS ONE | https://doi.org/10.1371/journal.pone.0184838 September 18, 2017 4 / 22
ergosterol (N+/Erg-), pantothenic acid (N+/Pan-) or nicotinic acid (N+/Nic-). The times dur-
ing the fermentation at which the samples were harvested are presented in S1 Table.
Estimation of glycogen accumulation
For each sample, cells were washed with sterile water and stored at -80˚C until used. 2.5 106
cells were dropped on a nitro-cellulose membrane and fixed by vacuum using a Bio-Rad Appa-
ratus. The membrane was exposed 2 min over iodine crystals and pictures directly taken as
described by Enjalbert [13].
Heat-shock sensitivity
For each sample, cells were heat-shocked at 50˚C for 0, 5, 10 and 20 min. Five serial 10-fold
dilutions were spotted onto YEPD plates and growth visualized after 2 days at 28˚C as
described by Klosinska et al [14].
Cell cycle assay
Cell cycle measurements were done by flow cytometry using a C6 cytometer (Accuri, BD Bio-
sciences) according to Delobel and Tesnière [15]. For each sample, cells were centrifuged,
resuspended in 1 mL water and fixed in 8 ml 75% ethanol, added dropwise under continuous
vortexing to avoid cell agglomeration. Samples were stored at least one night at 4˚C. The sam-
ples were then centrifuged for 5 min at 2000 g and cell pellets resuspended in 1 mL PBS and
centrifuged for 1 min at 13000 g at room temperature. The supernatant was discarded and
enzymatic treatments were then performed to eliminate RNAs and proteins: the pellet was
resuspended in 500 mL RNase A (2 mg.mL-1 in 10 mmol.L-1 Tris-Cl and 15 mmol.L-1 NaCl),
incubated for 1 h at 37˚C, and centrifuged; the pellet was resuspended in 200 mL proteinase K
(1 mg.mL-1 in PBS), sonicated for 15 s in an ultrasonic bath (Branson Sonifier), incubated for
1 h at 50˚C and centrifuged. The pellet was resuspended in 500 mL PBS and stored on ice until
analysis. Before analysis, 50 μL of cells were incubated with SYTOX1 Green at 1 μmol.L-1 and
directly observed using the flow cytometer. Fluorescence data for cells stained with SYTOX1
Green were collected in channel FL1.
RNA extraction and microarray assay
Total RNAs were isolated from Lalvin EC11181, at the selected time-points in conditions
detailed previously, by the TRIzol1 method according to Chomczynski and Sacchi [16]. Ali-
quots of 109 cells were harvested and quickly washed with 750 mL cooled (4˚C) DEPC-treated
water. Cells were pelleted and frozen in a -80˚C methanol bath. Frozen cells were mechanically
lysed through vortexing with glass beads (d = 0.3 mm) in 400 mL TRIzol1 (GIBCO BRL) at
4˚C for 15 min. The liquid phase was collected and TRIzol1 added to a 4 mL final volume.
The samples were mixed and incubated for 5 min at room temperature, and 800 mL chloro-
form was added. The mixture was then vortexed, incubated for 3 min and centrifuged (9,000 g
for 15 min). The supernatant was centrifuged again (2,000 g for 2 min) in swing-out buckets.
RNAs were pelleted from 2 ml aliquots of the supernatant by the addition of 2 mL cooled iso-
propanol (-20˚C) and incubated for 10 min. The samples were centrifuged (9,000 g for 10
min) and the resulting nucleic acid pellet was washed twice with 750 mL 75% ethanol/DEPC-
treated water and then dissolved in 150 μL of nuclease-free water (Qiagen). Total RNA from
100 μg aliquots of these preparations was purified with an RNeasy1 mini kit (Qiagen) follow-
ing the RNA cleanup protocol, including membrane DNase digestion. RNAs were eluted with
2 x 30 μL of the provided RNAse-free water. RNA quality was verified through capillary
Yeast cell death in wine alcoholic fermentation
PLOS ONE | https://doi.org/10.1371/journal.pone.0184838 September 18, 2017 5 / 22
electrophoresis using an RNA 6000 Nano LabChip Kit (Agilent Technologies). Samples of 100
ng purified RNA were labelled with Low input Quick Amp Labelling one-colour kit (Agilent
Technologies) according to manufacturer’s recommendations (indirect labelling of mRNAs
with Cyanin 3 dCTP dye). RNAs were hybridized on 8 x 15 k array Agilent standard Yeast V2
Gene Expression Microarrays (Agilent Technologies) for 17 h in a rotating oven at 65˚C fol-
lowing manufacturer’s recommendations. A Genepix 4000B scanner was used for array digita-
lization: laser voltage was set to avoid signal saturation and data were extracted with GenePix1
Pro 7 software (Molecular Devices).
Statistical analysis of microarray data
The R3.1.3 software was used for statistical analyses [17]. The raw microarray data were
imported and normalized with the quantile method for normalization between arrays using
the limma package [18]. On the normalized data set, we analyzed gene expression changes
over time using the maSigPro package and the single series approach. maSigPro is a regres-
sion-based approach to identify genes with temporal expression changes [19]. For the first step
of this method, we defined a binomial regression model for each gene expression over the 4
time-points:
Y ¼ b0 þ b1timeþ b2time2 þ ε
with:
• Y: normalized expression value
• time: the quantitative variable of the time points (min)
• b0: start value
• b1: the slope estimation (induction or repression of the gene)–linear effect
• b2: the shape estimation (first change in the temporal profile)–quadratic effect
• ε are independent N(0,σ2) error terms
We adjusted this model by the least-squared technique for each gene and only genes with
significant changes over time (i.e. with an adjusted p-value threshold of 0.005 corrected by the
Benjamini-Hochberg method) were selected. Then, a variable selection procedure was applied
using stepwise regression to find significant coefficients for each gene (step.method = “back-
ward”, alpha = 0.01). The list of differentially expressed genes according to the slope was gener-
ated and allowed us to define patterns of changes in expression over time (Rsquared
cutoff = 0.8). These patterns were then clustered using a hierarchical classification analysis
with the correlation distance and complete linkage method using cluster v3.0 and displayed
with the JavaTreeView v1.1.5r2 [20,21].
For a functional analysis of the defined clusters, each cluster was analyzed using the web-
based tool Funspec (http://funspec.med.utoronto.ca/; adjusted p.value = 0.05 with a Bonfer-
roni correction method) and genes were classified into functional categories, biological pro-
cesses and protein cellular localizations using the GO database [22]. In order to obtain
individual patterns for some stress (or stress-related) gene expressions (HSP30,HSP12, TPS1,
HSP26,HSP104, SOD2,MSN2,MSN4), the corresponding data were extracted from the tran-
scriptomic analysis.
The complete microarray data set was deposited in the Gene Expression Omnibus (GEO)
public repository (accession number GSE95152). Microarray description is under GEO acces-
sion number GPL17690.
Yeast cell death in wine alcoholic fermentation
PLOS ONE | https://doi.org/10.1371/journal.pone.0184838 September 18, 2017 6 / 22
Results
Identification of micronutrient limitations leading to yeast cell death
during alcoholic fermentation
In order to assess whether micronutrient limitations could trigger yeast cell death during alco-
holic fermentation, strain Lalvin EC11181 was set to ferment in a synthetic fermentation
medium SM425 (containing 425 mg/L of yeast assimilable nitrogen) that mimics a grape must
with various micronutrient limitations. The micronutrient concentrations were initially
defined in order to obtain a loss of viability of at least 50% during the fermentation. We based
our selection on preliminary work and a previous study [6]. In such media, all components
were in excess except the selected micronutrient, which was set at a limiting concentration and
thus was the first nutrient depleted. We examined the response to limitations in ergosterol and
oleic acid (given the yeast cell requirements for these two compounds in anaerobiosis), thia-
min, biotin, inositol, pantothenic acid and nicotinic acid. In the conditions used, yeast growth
was restricted by the availability of the micronutrient (lipid or vitamin) while nitrogen was in
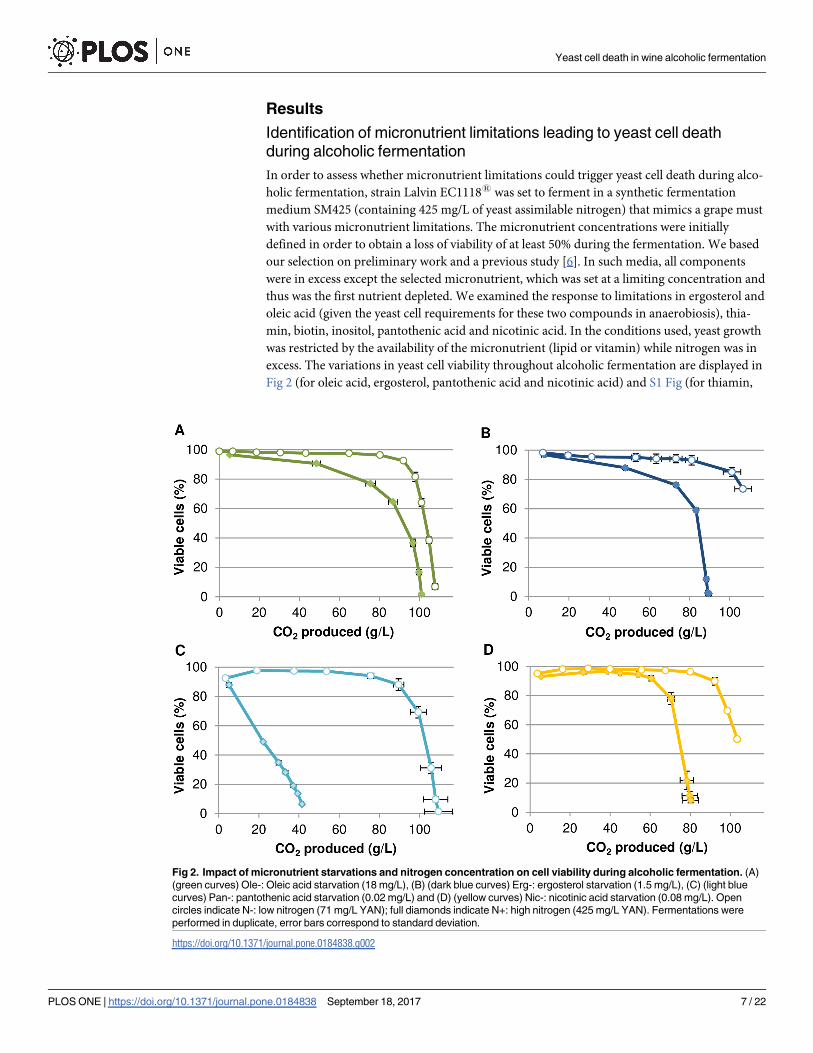
excess. The variations in yeast cell viability throughout alcoholic fermentation are displayed in
Fig 2 (for oleic acid, ergosterol, pantothenic acid and nicotinic acid) and S1 Fig (for thiamin,
Fig 2. Impact of micronutrient starvations and nitrogen concentration on cell viability during alcoholic fermentation. (A)
(green curves) Ole-: Oleic acid starvation (18 mg/L), (B) (dark blue curves) Erg-: ergosterol starvation (1.5 mg/L), (C) (light blue
curves) Pan-: pantothenic acid starvation (0.02 mg/L) and (D) (yellow curves) Nic-: nicotinic acid starvation (0.08 mg/L). Open
circles indicate N-: low nitrogen (71 mg/L YAN); full diamonds indicate N+: high nitrogen (425 mg/L YAN). Fermentations were
performed in duplicate, error bars correspond to standard deviation.
https://doi.org/10.1371/journal.pone.0184838.g002
Yeast cell death in wine alcoholic fermentation
PLOS ONE | https://doi.org/10.1371/journal.pone.0184838 September 18, 2017 7 / 22
biotin and inositol). Since fermentation rates were highly variable among the situations exam-
ined and given the impact of ethanol on cell viability, cell viability is displayed in relation to
the fermentation progress (amount of CO2 released) rather than in relation to time.
Oleic acid, ergosterol, pantothenic acid and nicotinic acid starvations led to cell death dur-
ing fermentation in conditions of excess nitrogen. By contrast, thiamin, biotin and inositol
starvations did not lead to cell death although they resulted in slow fermentations (S1 Fig).
The rate of loss in cell viability differed depending on the micronutrient tested. Oleic acid and
ergosterol starvations resulted in a loss of viability observable after 50 g of CO2 produced (Fig
2A & 2B) while cell death occurred after 60 g of CO2 produced when nicotinic acid was the
limiting nutrient (Fig 2D). Starvation for pantothenic acid led to a loss of viability starting
from the beginning of the fermentation until 40 g of CO2 produced which corresponds to the
arrest of fermentation in this condition (Fig 2C). The three other micronutrients limitations
also resulted in incomplete sugar fermentations (S2 Fig) but with higher CO2 production (Fig
2A, 2B and 2D).
The impact of assimilable nitrogen level on cell death was examined. A low level of nitrogen
(71 mg/L) was defined so that it allowed a growth pattern similar to that obtained in musts lim-
ited by micronutrients and so that cells were starved simultaneously for the given micronutri-
ent and nitrogen (S3 Fig). In such conditions, the biomass formed is equivalent in all
situations so that the amount of micronutrient available per cell is similar independently of the
nitrogen status.
When low nitrogen concentrations were used, cells retained high viability up to the end of
the alcoholic fermentations whatever the micronutrient starvation. Thus, the amount of assim-
ilable nitrogen modulates the yeast cell death associated with micronutrient limitations. These
results indicate that the residual nitrogen sources are involved in triggering cell death when
high nitrogen levels are used. Indeed analyses of nitrogen sources in fermentation media indi-
cate that no residual amino acids or ammonium were available in nitrogen-limited fermenta-
tions while several nitrogen sources were still present in micronutrient-limited ones (S4 Fig).
Assessing the role of nitrogen signaling in the control of the yeast cell
death associated to micronutrient starvations
Since nitrogen availability appeared to play a critical role in the triggering of yeast cell death,
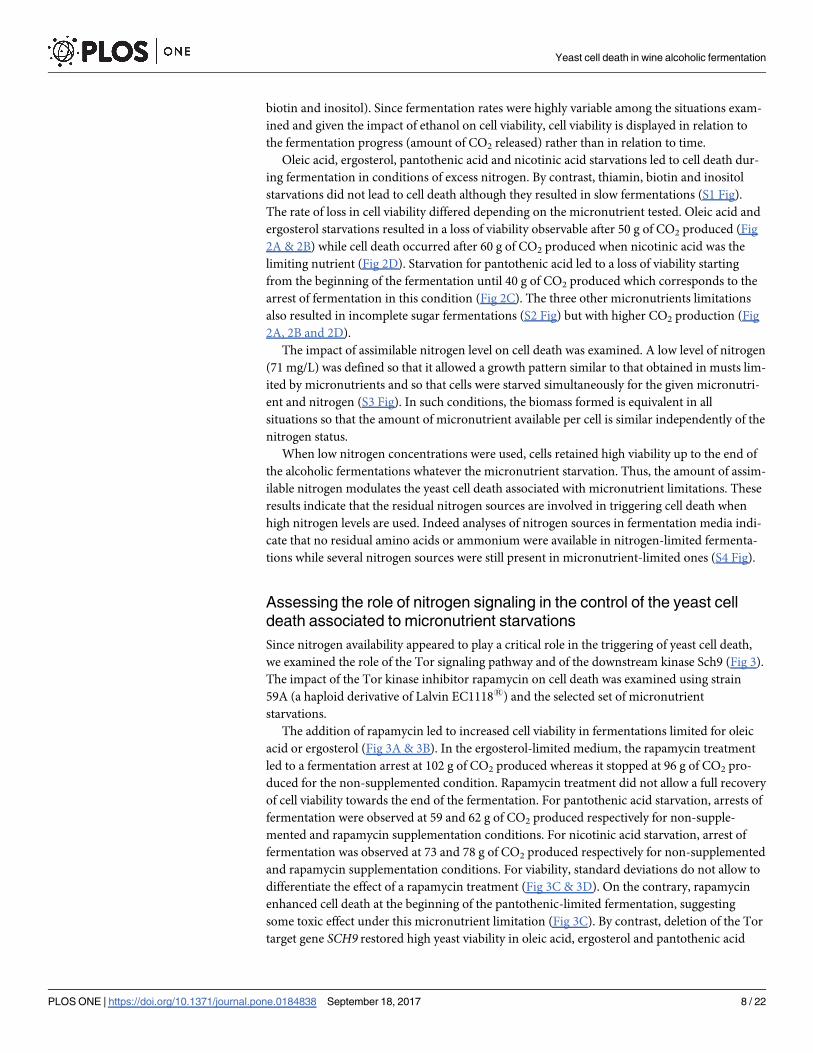
we examined the role of the Tor signaling pathway and of the downstream kinase Sch9 (Fig 3).
The impact of the Tor kinase inhibitor rapamycin on cell death was examined using strain
59A (a haploid derivative of Lalvin EC11181) and the selected set of micronutrient
starvations.
The addition of rapamycin led to increased cell viability in fermentations limited for oleic
acid or ergosterol (Fig 3A & 3B). In the ergosterol-limited medium, the rapamycin treatment
led to a fermentation arrest at 102 g of CO2 produced whereas it stopped at 96 g of CO2 pro-
duced for the non-supplemented condition. Rapamycin treatment did not allow a full recovery
of cell viability towards the end of the fermentation. For pantothenic acid starvation, arrests of
fermentation were observed at 59 and 62 g of CO2 produced respectively for non-supple-
mented and rapamycin supplementation conditions. For nicotinic acid starvation, arrest of
fermentation was observed at 73 and 78 g of CO2 produced respectively for non-supplemented
and rapamycin supplementation conditions. For viability, standard deviations do not allow to
differentiate the effect of a rapamycin treatment (Fig 3C & 3D). On the contrary, rapamycin
enhanced cell death at the beginning of the pantothenic-limited fermentation, suggesting
some toxic effect under this micronutrient limitation (Fig 3C). By contrast, deletion of the Tor
target gene SCH9 restored high yeast viability in oleic acid, ergosterol and pantothenic acid
Yeast cell death in wine alcoholic fermentation
PLOS ONE | https://doi.org/10.1371/journal.pone.0184838 September 18, 2017 8 / 22
starved fermentations. However, no effect was observed in the nicotinic acid limited fermenta-
tion (Fig 3D). These results are consistent with the involvement of Tor/Sch9 signaling in cell
death when yeast cells are starved for oleic acid and ergosterol. They are ambiguous concern-
ing their involvement when cells are starved for pantothenic acid since they show that Sch9 is
involved but that Tor inhibition had no effect. Unexpectedly, these data strongly suggest that
cell death associated with nicotinic starvation does not involve Tor/Sch9 signaling.
Micronutrient limitations fail to trigger phenotypic stress resistance
Since nutrient limitations led to variable ability to cope with fermentation stress and maintain
yeast viability, we examined the impact of nutrients limitations on the triggering of stress
responses. We selected a set of conditions maintaining high viability (N- and N-/Erg-) or lead-
ing to cell death as previously described (N+/Erg-, N+/Ole-, N+/Pan-, N+/Nic-). The patterns
of cell viability during the corresponding fermentations are displayed in S5A Fig. The cell
growth and fermentation rates are shown in S5B and S5C Fig. To address the triggering of the
stress response in this set of conditions, we examined yeast ability to withstand a short heat-
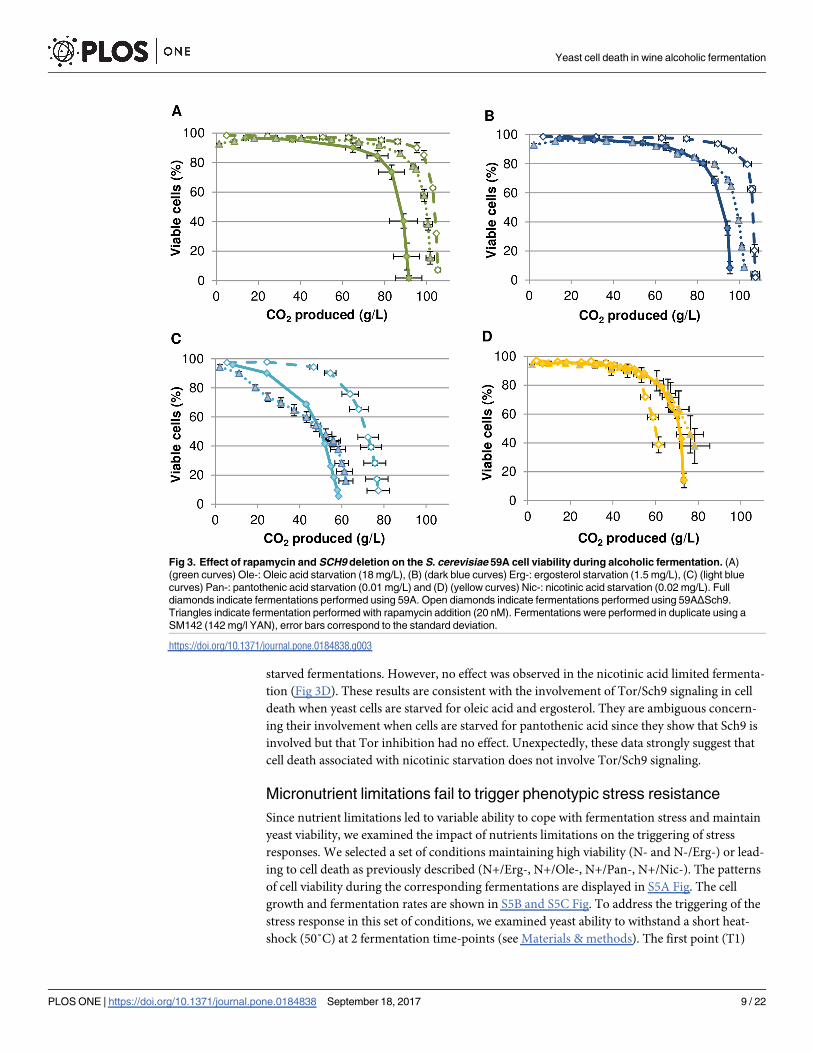
shock (50˚C) at 2 fermentation time-points (see Materials & methods). The first point (T1)
Fig 3. Effect of rapamycin and SCH9 deletion on the S. cerevisiae 59A cell viability during alcoholic fermentation. (A)
(green curves) Ole-: Oleic acid starvation (18 mg/L), (B) (dark blue curves) Erg-: ergosterol starvation (1.5 mg/L), (C) (light blue
curves) Pan-: pantothenic acid starvation (0.01 mg/L) and (D) (yellow curves) Nic-: nicotinic acid starvation (0.02 mg/L). Full
diamonds indicate fermentations performed using 59A. Open diamonds indicate fermentations performed using 59AΔSch9.
Triangles indicate fermentation performed with rapamycin addition (20 nM). Fermentations were performed in duplicate using a
SM142 (142 mg/l YAN), error bars correspond to the standard deviation.
https://doi.org/10.1371/journal.pone.0184838.g003
Yeast cell death in wine alcoholic fermentation
PLOS ONE | https://doi.org/10.1371/journal.pone.0184838 September 18, 2017 9 / 22
examined was during exponential growth (20 106 cells/ml) during which yeast cells do not
experience nutrient starvation and the second point (T3) in stationary phase (at 40 g of CO2
produced) (Fig 4A).
In exponential growth (T1, 20 106 cells/mL), cells did not survive any heat-shock irrespec-
tive of conditions and limiting nutrient. This is consistent with an absence of stress response at
this stage. In stationary phase (T3, 40 g of CO2 produced), cells under nitrogen limitation con-
dition alone were able to withstand heat shock (up to 10 minutes). Moreover, yeast cells lim-
ited for both nitrogen and ergosterol (N-/Erg-) were able to withstand the 20-minute thermal
stress, thus displaying higher stress resistance in this situation. By contrast, yeast in presence of
high nitrogen but starved for oleic acid, ergosterol, pantothenic acid or nicotinic acid (N+/
Erg-, N+/Ole-, N+/Pan-, N+/Nic-) were not able to survive any thermal treatment. Indeed, the
ergosterol-limited condition yielded yeast cells highly sensitive to thermal treatments (they did
not survive a 5-minute shock) while nicotinic acid-limited cells were slightly more resistant.
Fig 4. Assessment of stress resistance triggering during alcoholic fermentation. By (A) heat shock sensitivity
assay and (B) visualization of glycogen storage for N-: low nitrogen, 71 mg/L YAN; N-/Erg-: low nitrogen/low
ergosterol, 71 mg/L YAN, 1.5 mg/L ergosterol; N+/Ole-: high nitrogen/ low oleic acid, 425 mg/L YAN, 18 mg/L oleic
acid; N+/Erg-: high nitrogen/ low ergosterol, 425 mg/L YAN, 1.5 mg/L ergosterol; N+/Pan-: high nitrogen / low
pantothenic acid, 425 mg/L YAN, 0.02 mg/L pantothenic acid and N+/Nic-: high nitrogen/ low nicotinic acid, 425 mg/L
YAN, 0.08 mg/L nicotinic acid.
https://doi.org/10.1371/journal.pone.0184838.g004
Yeast cell death in wine alcoholic fermentation
PLOS ONE | https://doi.org/10.1371/journal.pone.0184838 September 18, 2017 10 / 22
These data indicate that, in our conditions, yeast ability to successfully cope with thermal stress
is strongly dependent on the limiting nutrient. While nitrogen limited condition resulted in
stress-resistant yeast cells, the other nutrient limitations addressed were not able to trigger an
appropriate stress response.
Glycogen accumulation is considered to be a good indicator of yeast stress response [23].
Glycogen storage was monitored by iodine staining of yeast at 4 points of alcoholic fermenta-
tion (Fig 4B). In exponential growth (T1: 20. 106 cells/ml) the glycogen content (revealed by a
yellow tint of the yeasts) was low in all conditions whatever the nutrient limitation. In station-
ary phase (at T2: 12 g, T3: 40 and T4: 75 g of CO2 produced), yeasts starved for nitrogen (N-
and N-/Erg-) displayed an increased content in glycogen, with a brown tint after iodine stain-
ing. However, under single micronutrient limitation for either oleic acid, ergosterol, panto-
thenic acid or nicotinic acid (N+/Erg-, N+/Ole-, N+/Pan-, N+/Nic-), yeast cells did not
accumulate glycogen. These results are consistent with an absence of stress resistance trigger-
ing in stationary phase whenever cell growth is limited by any of the 4 micronutrients tested.
Cell cycle analysis
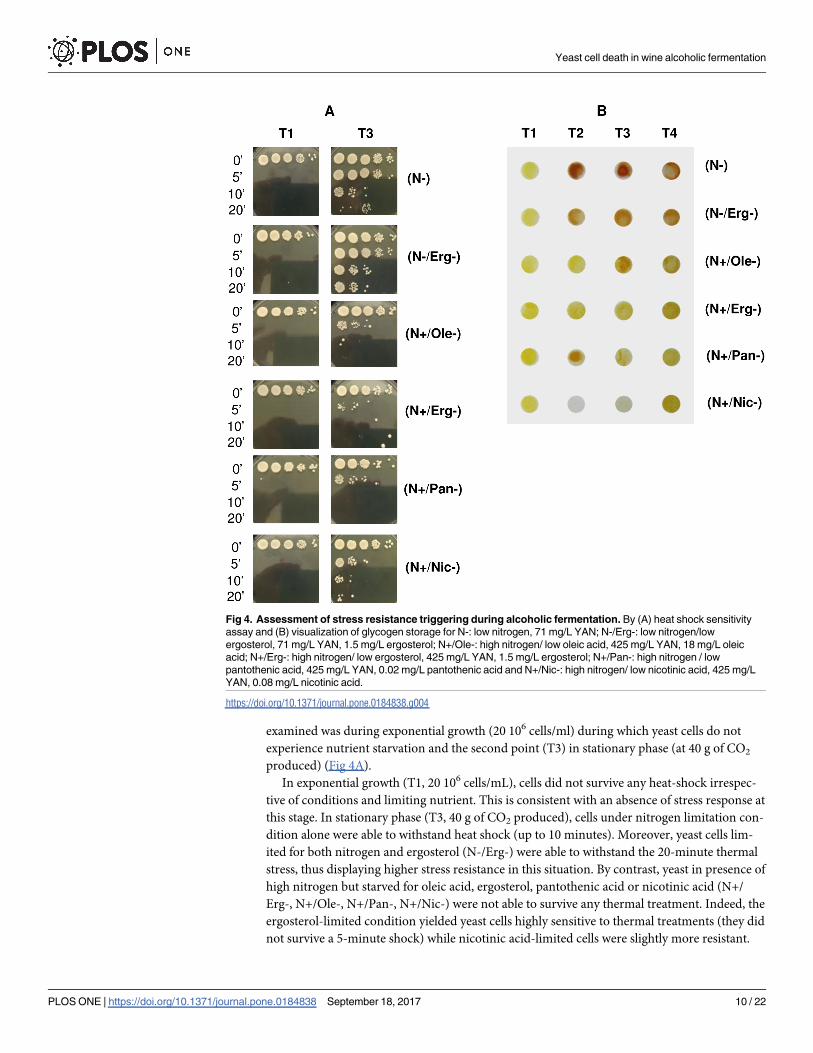
We assessed the ability of yeast cells to arrest their cell cycle in G0/G1 phase upon nutrient
depletion under the various situations (Fig 5). In exponential growth, cells exhibited a similar
DNA content profile in the different conditions, with G1 and G2 peaks consistent with cells in
division. The two nitrogen-limited cultures exhibited a clear cell cycle arrest with cells in G0/
Fig 5. Cell cycle of yeast during alcoholic fermentation in the set of 6 nutrient conditions. Cells were
collected at different times during alcoholic fermentation (T1, 20 106 cells/mL; T2, 12 g CO2 produced; T3, 40 g
CO2 produced; T4, 75 g CO2 produced) for: (A) N-: low nitrogen, 71 mg/L YAN; (B) N-/Erg-: low nitrogen/low
ergosterol, 71 mg/L YAN, 1.5 mg/L ergosterol; (C) N+/Ole-: high nitrogen/ low oleic acid, 425 mg/L YAN, 18 mg/L
oleic acid; (D) N+/Erg-: high nitrogen/ low ergosterol, 425 mg/L YAN, 1.5 mg/L ergosterol; (E) N+/Pan-: high
nitrogen/ low pantothenic acid, 425 mg/L YAN, 0.02 mg/L pantothenic acid and (F) N+/Nic-: high nitrogen/ low
nicotinic acid, 425 mg/L YAN, 0.08 mg/L nicotinic acid. Curves show the mean of two biological replicates.
https://doi.org/10.1371/journal.pone.0184838.g005
Yeast cell death in wine alcoholic fermentation
PLOS ONE | https://doi.org/10.1371/journal.pone.0184838 September 18, 2017 11 / 22
G1 phase (Fig 5A & 5B). A similar behavior was observed for cells starved for nicotinic acid
(N+/Nic-) (Fig 5F). Oleic acid starvation (N+/Ole-) led to a high amount of cells in G2 phase
at 12 g of CO2 (Fig 5C) indicating that some of them were still dividing. In this condition, cells
resumed a G0/G1 arrest at 40 g of CO2 produced. Actually, these cells exhibited a lower DNA
fluorescence peak than cells at G0/G1; the origin of such low fluorescence is unclear although
such results have been previously reported [24]. Ergosterol starvation led mainly to cells
arrested at the G0/G1 phase with however a small fraction in G2 phase (Fig 5D). An even
more pronounced blockade of the cell cycle occurred in the limitation in pantothenic acid
with nearly half of the population arrested in G2 phase (Fig 5E). The analyses point to a hetero-
geneous behavior of cells in these situations with various perturbations of the patterns of cell
cycle arrest.
Changes in the yeast transcriptome in response to nutrient starvations
To get insights into the regulatory mechanisms associated with cell death during alcoholic fer-
mentations, we monitored gene expression in Lalvin EC11181 strain under the six selected
nutrient conditions. In each condition, the first sampling for gene expression was performed
during the growth phase while the 3 others corresponded to cells in stationary phase at differ-
ent levels of fermentation progress (sugar consumption and ethanol amount were similar for
each condition). A linear regression was used to select genes exhibiting a statistically signifi-
cant dependence with time during fermentation (see Material and methods). Thus, 1946 regu-
lated genes were hierarchically classified into 28 clusters with significant dependence on time
for the 6 nutrients conditions tested.
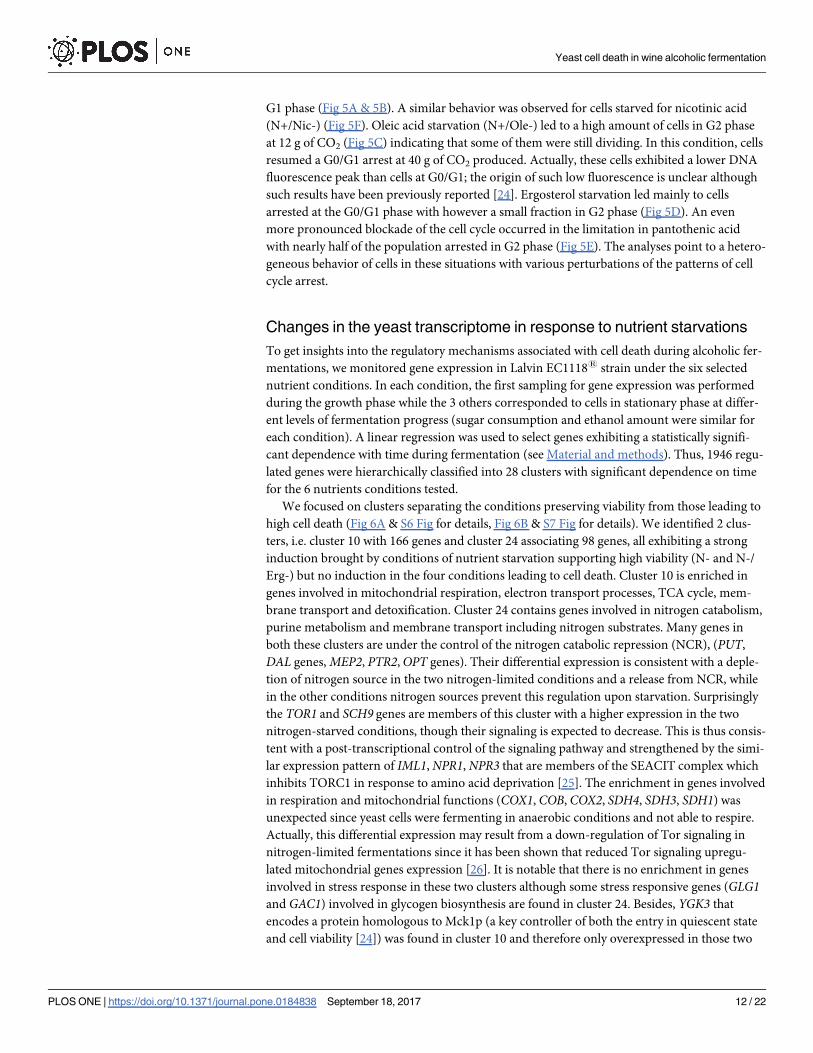
We focused on clusters separating the conditions preserving viability from those leading to
high cell death (Fig 6A & S6 Fig for details, Fig 6B & S7 Fig for details). We identified 2 clus-
ters, i.e. cluster 10 with 166 genes and cluster 24 associating 98 genes, all exhibiting a strong
induction brought by conditions of nutrient starvation supporting high viability (N- and N-/
Erg-) but no induction in the four conditions leading to cell death. Cluster 10 is enriched in
genes involved in mitochondrial respiration, electron transport processes, TCA cycle, mem-
brane transport and detoxification. Cluster 24 contains genes involved in nitrogen catabolism,
purine metabolism and membrane transport including nitrogen substrates. Many genes in
both these clusters are under the control of the nitrogen catabolic repression (NCR), (PUT,
DAL genes,MEP2, PTR2,OPT genes). Their differential expression is consistent with a deple-
tion of nitrogen source in the two nitrogen-limited conditions and a release from NCR, while
in the other conditions nitrogen sources prevent this regulation upon starvation. Surprisingly
the TOR1 and SCH9 genes are members of this cluster with a higher expression in the two
nitrogen-starved conditions, though their signaling is expected to decrease. This is thus consis-
tent with a post-transcriptional control of the signaling pathway and strengthened by the simi-
lar expression pattern of IML1,NPR1,NPR3 that are members of the SEACIT complex which
inhibits TORC1 in response to amino acid deprivation [25]. The enrichment in genes involved
in respiration and mitochondrial functions (COX1, COB, COX2, SDH4, SDH3, SDH1) was
unexpected since yeast cells were fermenting in anaerobic conditions and not able to respire.
Actually, this differential expression may result from a down-regulation of Tor signaling in
nitrogen-limited fermentations since it has been shown that reduced Tor signaling upregu-
lated mitochondrial genes expression [26]. It is notable that there is no enrichment in genes
involved in stress response in these two clusters although some stress responsive genes (GLG1and GAC1) involved in glycogen biosynthesis are found in cluster 24. Besides, YGK3 that
encodes a protein homologous to Mck1p (a key controller of both the entry in quiescent state
and cell viability [24]) was found in cluster 10 and therefore only overexpressed in those two
Yeast cell death in wine alcoholic fermentation
PLOS ONE | https://doi.org/10.1371/journal.pone.0184838 September 18, 2017 12 / 22
conditions that preserve viability. Other stress genes, not found in any clusters, were however
also differentially expressed in the two sets of conditions as for exampleWHI2 which has been
reported to play a role both in stress response and cell death (S8 Fig). To obtain more informa-
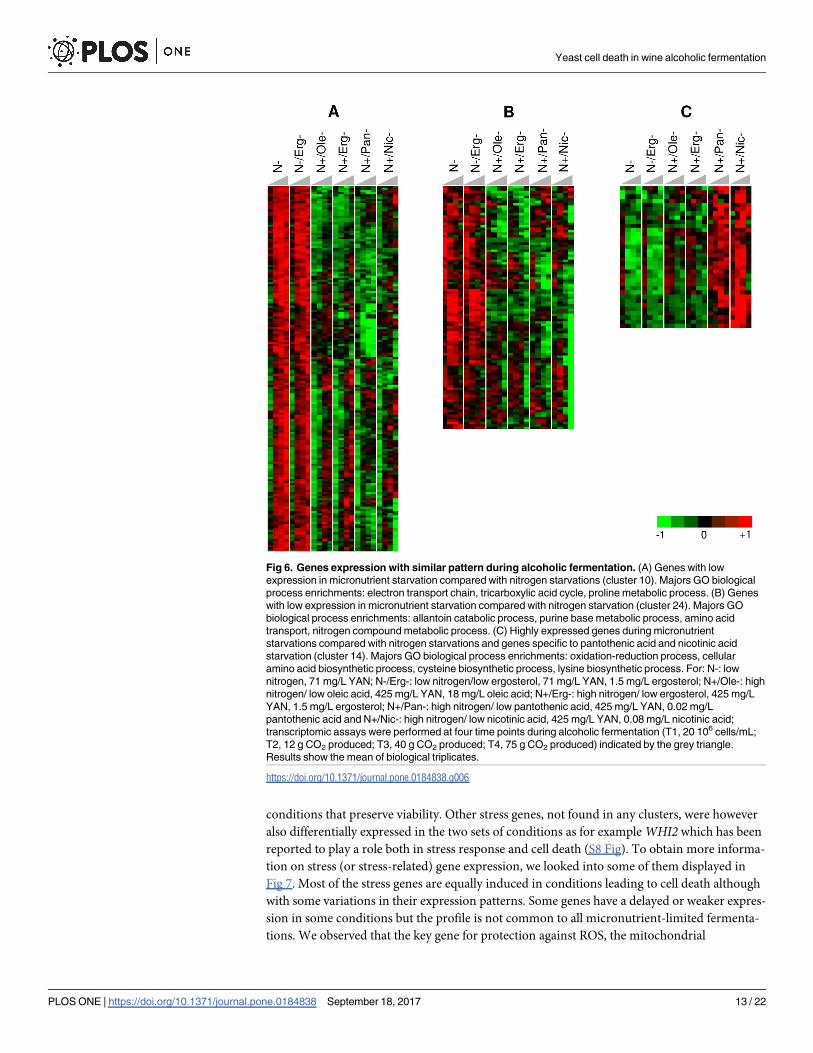
tion on stress (or stress-related) gene expression, we looked into some of them displayed in
Fig 7. Most of the stress genes are equally induced in conditions leading to cell death although
with some variations in their expression patterns. Some genes have a delayed or weaker expres-
sion in some conditions but the profile is not common to all micronutrient-limited fermenta-
tions. We observed that the key gene for protection against ROS, the mitochondrial
Fig 6. Genes expression with similar pattern during alcoholic fermentation. (A) Genes with low
expression in micronutrient starvation compared with nitrogen starvations (cluster 10). Majors GO biological
process enrichments: electron transport chain, tricarboxylic acid cycle, proline metabolic process. (B) Genes
with low expression in micronutrient starvation compared with nitrogen starvation (cluster 24). Majors GO
biological process enrichments: allantoin catabolic process, purine base metabolic process, amino acid
transport, nitrogen compound metabolic process. (C) Highly expressed genes during micronutrient
starvations compared with nitrogen starvations and genes specific to pantothenic acid and nicotinic acid
starvation (cluster 14). Majors GO biological process enrichments: oxidation-reduction process, cellular
amino acid biosynthetic process, cysteine biosynthetic process, lysine biosynthetic process. For: N-: low
nitrogen, 71 mg/L YAN; N-/Erg-: low nitrogen/low ergosterol, 71 mg/L YAN, 1.5 mg/L ergosterol; N+/Ole-: high
nitrogen/ low oleic acid, 425 mg/L YAN, 18 mg/L oleic acid; N+/Erg-: high nitrogen/ low ergosterol, 425 mg/L
YAN, 1.5 mg/L ergosterol; N+/Pan-: high nitrogen/ low pantothenic acid, 425 mg/L YAN, 0.02 mg/L
pantothenic acid and N+/Nic-: high nitrogen/ low nicotinic acid, 425 mg/L YAN, 0.08 mg/L nicotinic acid;
transcriptomic assays were performed at four time points during alcoholic fermentation (T1, 20 106 cells/mL;
T2, 12 g CO2 produced; T3, 40 g CO2 produced; T4, 75 g CO2 produced) indicated by the grey triangle.
Results show the mean of biological triplicates.
https://doi.org/10.1371/journal.pone.0184838.g006
Yeast cell death in wine alcoholic fermentation
PLOS ONE | https://doi.org/10.1371/journal.pone.0184838 September 18, 2017 13 / 22
Fig 7. Expression pattern (arbitrary units) of several stress (or stress-related) genes during alcoholic
fermentation under 6 nutrient starvation conditions. (A) HSP30, (B) HSP12, (C) TPS1, (D) HSP26, (E)
HSP104, (F) SOD2, (G) MSN2, (H) MSN4 for: (red curves) N-: low nitrogen (71 mg/L YAN); (pink curves) N-/
Erg-: low nitrogen/ low ergosterol (71 mg/L YAN, 1.5 mg/L ergosterol); (green curves) N+/Ole-: high nitrogen/
low oleic acid (425 mg/L YAN, 18 mg/L oleic acid); (dark blue curves) N+/Erg-: high nitrogen/ low ergosterol
(425 mg/L YAN, 1.5 mg/L ergosterol); (light blue curves) N+/Pan-: high nitrogen / low pantothenic acid (425
Yeast cell death in wine alcoholic fermentation
PLOS ONE | https://doi.org/10.1371/journal.pone.0184838 September 18, 2017 14 / 22
superoxide dismutase SOD2 [27], displayed a lower or delayed expression in conditions associ-
ated to cell death (Fig 7F). Actually, even if alcoholic fermentation happens under anaerobio-
sis, it has been proposed that the oxidative stress could play a role in alcoholic fermentation
[28,29]. More precisely, this overexpression of SOD2 could be more related to the ethanol
stress-induced programmed cell death which has been shown to be mediated by mitochondria
and by a causal role of ROS [29,30].MSN2 andMSN4, the two main stress transcriptional fac-
tors, are overexpressed under all the conditions (Fig 7G & 7H). The only exception is for nico-
tinic acid starvation under whichMSN4 expression was clearly repressed but seems to be
counteracted byMSN2 overexpression of in this same condition.
Only small clusters were found with genes displaying a reverse behaviour, that is to say a
low expression for the two conditions supporting high viability and an induction in the condi-
tions leading to yeast cell death. Cluster 14 (Fig 6C & S9 Fig for details) contains some genes
displaying such an opposite pattern and is enriched in sulfur metabolism (MET3,10,16 and
CYS4) and amino acids biosynthesis genes (LYS14,20,21). The availability of nitrogen sources
in the fermentation limited by micronutrients can explain part of the response and the expres-
sion of amino acid biosynthetic pathway.
This cluster contains also some genes more specific to nicotinic acid and pantothenic acid
starvations. It includes genes involved in the biosynthesis and transport of NAD (BNA1,
BNA4, NRT1) and overexpressed under such conditions. Their strong expression is consistent
with nicotinic acid limitation and suggests that pantothenic acid-limited cells experience a
similar metabolic state. Among the genes with a similar pattern, RNR4 encoding a ribonucleo-
tide reductase induced by DNA damage could point out to a DNA replication stress since it
has been shown to be associated with cell death [31].
Discussion
Understanding the mechanisms underlying yeast cell death during wine alcoholic fermenta-
tion is of key importance to improve fermentation management and prevent sluggish or stuck
fermentations. Yeast cell death is known to occur under lipid limitation conditions combined
to strong anaerobiosis and is usually considered only as a consequence of membrane dysfunc-
tion due to lipids defects. In a previous work [6], it was shown that ergosterol limitations in
musts were leading to yeast cell death in a nitrogen-controlled manner, pointing out the key
role of nitrogen signaling in such cell death. Based on this observation we have examined here
whether other nutrients limitations could trigger yeast cell death in alcoholic fermentation in a
similar manner. We focused our analyses on micronutrients such as vitamins and growth fac-
tors since they were more likely to correspond to unusual nutrient limitations for yeast, by
contrast to phosphate, carbohydrate or sulfate, starvations which yeast has adapted to through
evolution [4]. Among the 7 micronutrients checked in this study, we show that 4 trigger yeast
cell death when they are in growth-restricting amounts in a nitrogen-rich medium. Two of
them (ergosterol, oleic acid) are lipid growth factors conditional to anaerobic growth and the
other two are vitamins, one (pantothenic acid) being involved in lipid metabolism. Cell death
was therefore observed with some of the micronutrients for which yeast is auxotroph but not
with others (thiamine, biotin) indicating that auxotrophy is not systematically associated with
cell death in these conditions. Yeast obviously adapted to starvation for these latter
mg/L YAN, 0.02 mg/L pantothenic acid); and (yellow curves) N+/Nic-: high nitrogen/ low nicotinic acid (425 mg/
L YAN, 0.08 mg/L nicotinic acid). Data were obained from the transcriptomic analysis. Curves show the mean
of fermentations performed in triplicate, error bars correspond to the standard deviation.
https://doi.org/10.1371/journal.pone.0184838.g007
Yeast cell death in wine alcoholic fermentation
PLOS ONE | https://doi.org/10.1371/journal.pone.0184838 September 18, 2017 15 / 22
compounds. Conversely, ergosterol, oleic acid, pantothenic and nicotinic acid clearly corre-
spond to unusual nutrients limitations for yeast.
The results obtained here show that yeast cell death triggered by all these four micronutri-
ents limitations depends on nitrogen availability. In all cases, excess nitrogen prevented the
triggering of a starvation mechanism that maintains yeast cells alive. Conversely, lowering
nitrogen level restored yeast cell viability. Our experimental set-up, by keeping a constant cell
population, ruled out the possibility that nitrogen could act through a modulation of yeast bio-
mass and available, per-cell quantity of micronutrient. Cell death occurrence was only depen-
dent on the conditions of entry into starvation. These observations are consistent with the idea
that an arrest of growth induced by nitrogen limitation leads to a state of resistance to starva-
tion. It is also in line with the report of Boer et al [4] showing that the first limiting nutrient
triggering the entry into stationary phase determines the fate and survival ability of yeast cells.
Given the impact of nitrogen on cell death, we explored the contribution of the nitrogen
signaling pathway on yeast response. We observed that decreasing TORC1/SCH9 signaling
pathways restored high cell viability in several micronutrient-limited fermentations: viability
was restored by SCH9 deletion in oleic acid, ergosterol and pantothenic acid starvations while
rapamycin prevented cell death in the first two situations. The inconsistency between the
response to SCH9 deletion and rapamycin addition under pantothenic acid limitation was
unexpected and the toxic effect observed with the drug suggests that some other phenomenon
may have interfered in these specific and physiologically extreme conditions. The inefficiency
of SCH9 deletion and rapamycin addition in nicotinic acid limitation is also puzzling and sug-
gests that TORC1/SCH9 signaling was somehow bypassed and that other signaling actors were
involved. Nicotinic acid is connected to NAD metabolism which is itself involved in the regu-
lation of cell longevity [32]. NAD and derived compounds have been shown to modulate vari-
ous cellular function including sirtuin activity and yeast cells ageing [33]. Whether cross-
regulation of these activities with nitrogen signaling can take place deserves additional
investigations.
Although a deviation from the standard signaling scheme may have to be considered in this
latter case, all the other situations are in line with an involvement of TORC1/SCH9 signaling
in cell death as previously described in various contexts [5,6,26,34,35]. Indeed this scheme is
consistent with the transcriptomic analyses, which revealed a clear differential expression of a
large set of genes that are targets of the TORC1/SCH9 signaling pathway (OPT1,OPT2,MEP2or NPR2) in conditions leading to cell death compared to those leading to survival. A high sig-
naling pathway activity likely prevents the adaptation of yeast cells to starvation in micronutri-
ent-limited fermentations.
A key aspect of the adaptation to starvation is thought to be the triggering of an appropri-
ate stress response. Our data show that the diverse nutrient starvations did not trigger an
identical stress response. Yeast cells under nitrogen-limited conditions display a stress
response as shown by their heat shock resistance and by their accumulation of glycogen.
Indeed, stress resistance and storage of glycogen are features of quiescent cells and consistent
with their ability to survive starvation. This ability to survive throughout fermentation was
well correlated with stress resistance but not with the cell cycle status that exhibited heteroge-
neous perturbations in situations associated with cell death. By contrast, yeast cells in fer-
mentations limited for oleic acid, ergosterol, pantothenic acid and nicotinic acid did not
display such stress resistance. We thus attempted to determine whether differences in stress
gene expression could be observed in transcriptomic data. Surprisingly, we did not find spe-
cific enrichments in stress genes in any dataset whatever the type of starvation. Specifically,
stress-responsive genes were not detected, except for some isolated ones, in those clusters
that differentiated the conditions allowing maintenance of viability from those leading to cell
Yeast cell death in wine alcoholic fermentation
PLOS ONE | https://doi.org/10.1371/journal.pone.0184838 September 18, 2017 16 / 22
death. We therefore examined individually the expression patterns of a large set of stress
genes. All these genes are involved in the overall stress response under the control ofMSN2/MSN4 indicating that a global stress response took place in all conditions whatever was the
yeast growth-limiting nutrient limiting.
Therefore the activity of the nitrogen-signaling pathway did not block the expression of
stress genes. This apparent stress response in micronutrients limited conditions is not consis-
tent with the lack of resistance of yeast cells. This discrepancy suggests that the stress response
is restricted at a post-transcriptional level in the micronutrients limited fermentations. The
involvement of posttranscriptional control in the entry into quiescence and the acquisition of
stress resistance following nutrient limitation have been described [36]. Such regulations could
explain the lack of stress resistance despite the expression of stress genes. This is consistent
with the observation that SCH9 deletion triggered an increased yeast viability of ergosterol-
limited cells but only triggered an overexpression of some selected stress genes [6].
Alternatively, some stress genes regulations critical for the adaptation to starvation might
be independent of the general stress response pathway and be altered in micronutrients-lim-
ited fermentations. Such an independent control of stress gene expression was proposed for
the regulator geneWHI2 that has been shown to link nutrient sensing to cell death [37,38].
InterestinglyWHI2 displayed a clear differential expression between conditions leading to sur-
vival or cell death with respectively high and low expression level. A further characterization
(in conditions similar to ours) of its putative role in cell death control could be therefore rele-
vant. During the stationary phase of alcoholic fermentation, yeast cells experience a chronolog-
ical ageing under conditions that combine multiple stress, the major one being ethanol. Other
metabolites formed by yeast, i.e. acetaldehyde and acetic acid, have also been shown to impact
cell ageing [39]. Indeed, these compounds produced during alcoholic fermentation are known
to induce apoptosis-like cell death as it has been shown for acetic acid [40]. More importantly,
ethanol is known to induce its own specific programmed cell death, closely related to apoptosis
but mediated by the mitochondrial pathway [29,30]. The overexpression of some mitochon-
drial genes in our condition could be consistent with an ethanol-induced programmed cell
death. In order to avoid such a premature ageing of cells in starvation, yeast cells require the
triggering of an appropriate stress response.
We have shown here that several micronutrient limitations do not allow for such adaptation
and are associated with cell death. It is likely that these nutrient limitations are not frequently
encountered by yeast in natural environments although they can occur in industrial winemak-
ing. Limitations for both ergosterol and oleic acid are rather common in grape musts following
clarification processes prior to fermentation (in white or rose wine fermentation). Variations
in pantothenic acid content in grape musts have been reported by Hagen [41] suggesting that
limitation in pantothenic acid could also occur. It is worth noting that Wang [42] reported
that yeast cells were more sensitive to pantothenic acid deficiency and displayed cell death
when the nitrogen level was high, thus leading to stuck fermentations, while low levels of nitro-
gen did not lead to such issue. This behaviour is consistent with our data and the role we
ascribe here to nitrogen in triggering cell death under micronutrient limitation.
Our results provide a novel frame and should help optimizing nutrient management strate-
gies in alcoholic fermentations. The addition of nitrogen, usually as NH4+, is a current practice
in alcoholic fermentation that should benefit from the integration of possible interactions with
other nutrients limitations. The results obtained were discussed here in relation to wine alco-
holic fermentation only but it is likely that they can be applied to any other alcoholic fermenta-
tions situations (beer brewing, sake, etc.) and could help in the management of yeast cells
death under many situations.
Yeast cell death in wine alcoholic fermentation
PLOS ONE | https://doi.org/10.1371/journal.pone.0184838 September 18, 2017 17 / 22
Supporting information
S1 Table. Time of fermentation in hour where the T1, T2, T3 and T4 samples were har-
vested for the different nutrient starvation conditions. Values of time are presented as mean
of five sampling time ± standard deviation.
(PDF)
S1 Fig. Viable cells (%) from S. cerevisiaeLalvin EC11181 strain during alcoholic fermen-
tation in a complete SM425 medium (high nitrogen) and in a SM425 medium limited in:
(A) thiamin at 15 μg/L (high nitrogen / low thiamin); (B) biotin at 0.06 μg/L (high nitrogen
/ low biotin) and (C) inositol at 0.2 mg /L (high nitrogen / low inositol).
(PDF)
S2 Fig. Medium residual sugar during alcoholic fermentation by S. cerevisiaeLalvin
EC11181 under various micronutrient starvations. (A) (green curves) Ole-: Oleic acid star-
vation (18 mg/L), (B) (dark blue curves) Erg-: ergosterol starvation (1.5 mg/L), (C) (light blue
curves) Pan-: pantothenic acid starvation (0.02 mg/L) and (D) (yellow curves) Nic-: nicotinic
acid starvation (0.08 mg/L). Open circles indicate N-: low nitrogen (71 mg/L YAN); full dia-
monds indicate N+: high nitrogen (425 mg/L YAN). Residual sugar amount was calculated
from released CO2 using linear regression (1 g of sugar consumed = 0.47 g of CO2; [43]. Fer-
mentations were performed in duplicate, error bars correspond to the standard deviation.
(PDF)
S3 Fig. Evolution of the cell population as a function of alcoholic fermentation duration.
For high or low nitrogen level under: (A) (green curves) Ole-: Oleic acid starvation (18 mg/L),
(B) (dark blue curves) Erg-: ergosterol starvation (1.5 mg/L), (C) (light blue curves) Pan-: pan-
tothenic acid starvation (0.02 mg/L) and (D) (yellow curves) Nic-: nicotinic acid starvation
(0.08 mg/L). Open circles indicate N-: low nitrogen (71 mg/L YAN); full diamonds indicate
N+: high nitrogen (425 mg/L YAN). Fermentations were performed in duplicate.
(PDF)
S4 Fig. Comparison of the amount of residual assimilable nitrogen (YAN) at different
time points in the fermentation medium. For the 6 nutrient conditions set up for the tran-
scriptomic analysis. Measurements were performed at different times during alcoholic fermen-
tation (T1, 20 106 cells/mL; T2, 12 g CO2 produced; T3, 40 g CO2 produced; T4, 75 g CO2
produced) for: N-: low nitrogen, 71 mg/L YAN; N-/Erg-: low nitrogen/low ergosterol, 71 mg/L
YAN, 1.5 mg/L ergosterol; N+/Ole-: high nitrogen/ low oleic acid, 425 mg/L YAN, 18 mg/L
oleic acid; N+/Erg-: high nitrogen/ low ergosterol, 425 mg/L YAN, 1.5 mg/L ergosterol; N+/
Pan-: high nitrogen / low pantothenic acid, 425 mg/L YAN, 0.02 mg/L pantothenic acid and
N+/Nic-: high nitrogen/ low nicotinic acid, 425 mg/L YAN, 0.08 mg/L nicotinic acid. Yeast
assimilable concentration was calculated from ammonium and free amino acid concentra-
tions. Ammonium concentration was determined enzymatically (RBiopharm AG™, Darm-
stadt, Germany). The free amino acid content in the must was determined by cation exchange
chromatography, with post-column ninhydrin derivatization (Biochrom 30, Biochrom™, Cam-
bridge, UK) as previously described [44]. Fermentations were performed in duplicate, error
bars are corresponding to the standard deviation.
(PDF)
S5 Fig. Pattern of (A) cell viability (%), (B) cell population and (C) fermentation rates dur-
ing alcoholic fermentation using the Lalvin EC11181 strain. For the six nutrient conditions
set up for transcriptome analysis: (red curves) N-: low nitrogen (71 mg/L YAN); (pink curves)
N-/Erg-: low nitrogen/ low ergosterol (71 mg/L YAN, 1.5 mg/L ergosterol); (green curves) N+/
Yeast cell death in wine alcoholic fermentation
PLOS ONE | https://doi.org/10.1371/journal.pone.0184838 September 18, 2017 18 / 22
Ole-: high nitrogen/ low oleic acid (425 mg/L YAN, 18 mg/L oleic acid); (dark blue curves)
N+/Erg-: high nitrogen/ low ergosterol (425 mg/L YAN, 1.5 mg/L ergosterol); (light blue
curves) N+/Pan-: high nitrogen / low pantothenic acid (425 mg/L YAN, 0.02 mg/L panto-
thenic acid); and (yellow curves) N+/Nic-: high nitrogen/ low nicotinic acid (425 mg/L YAN,
0.08 mg/L nicotinic acid). Curves show the mean of fermentations performed in duplicate for
cell viability and triplicate for cell population and fermentation rate. Error bars correspond to
the standard deviation.
(PDF)
S6 Fig. Genes with low expression in micronutrient starvation compared with nitrogen
starvation (cluster 10) during alcoholic fermentation. For: N-: low nitrogen, 71 mg/L YAN;
N-/Erg-: low nitrogen/low ergosterol, 71 mg/L YAN, 1.5 mg/L ergosterol; N+/Ole-: high nitro-
gen/ low oleic acid, 425 mg/L YAN, 18 mg/L oleic acid; N+/Erg-: high nitrogen/ low ergos-
terol, 425 mg/L YAN, 1.5 mg/L ergosterol; N+/Pan-: high nitrogen/ low pantothenic acid, 425
mg/L YAN, 0.02 mg/L pantothenic acid and N+/Nic-: high nitrogen/ low nicotinic acid, 425
mg/L YAN, 0.08 mg/L nicotinic acid; transcriptomic assays were performed at four time points
during alcoholic fermentation (T1, 20 106 cells/mL; T2, 12 g CO2 produced; T3, 40 g CO2 pro-
duced; T4, 75 g CO2 produced) indicated by the grey triangle. Results show the mean of bio-
logical triplicates.
(PDF)
S7 Fig. Genes with low expression in micronutrient starvations compare with nitrogen
starvation (cluster 24) during alcoholic fermentation. For: N-: low nitrogen, 71 mg/L YAN;
N-/Erg-: low nitrogen/low ergosterol, 71 mg/L YAN, 1.5 mg/L ergosterol; N+/Ole-: high nitro-
gen/ low oleic acid, 425 mg/L YAN, 18 mg/L oleic acid; N+/Erg-: high nitrogen/ low ergos-
terol, 425 mg/L YAN, 1.5 mg/L ergosterol; N+/Pan-: high nitrogen/ low pantothenic acid, 425
mg/L YAN, 0.02 mg/L pantothenic acid and N+/Nic-: high nitrogen/ low nicotinic acid, 425
mg/L YAN, 0.08 mg/L nicotinic acid; transcriptomic assays were performed at four time points
during alcoholic fermentation (T1, 20 106 cells/mL; T2, 12 g CO2 produced; T3, 40 g CO2 pro-
duced; T4, 75 g CO2 produced) indicated by the grey triangle. Results show the mean of bio-
logical triplicates.
(PDF)
S8 Fig. Kinetics of the expression (arbitrary units) of the WHI2 stress gene during alco-
holic fermentation under 6 nutrient starvation conditions. (red curves) N-: low nitrogen (71
mg/L YAN); (pink curves) N-/Erg-: low nitrogen/ low ergosterol (71 mg/L YAN, 1.5 mg/L
ergosterol); (green curves) N+/Ole-: high nitrogen/ low oleic acid (425 mg/L YAN, 18 mg/L
oleic acid); (dark blue curves) N+/Erg-: high nitrogen/ low ergosterol (425 mg/L YAN, 1.5 mg/
L ergosterol); (light blue curves) N+/Pan-: high nitrogen / low pantothenic acid (425 mg/L
YAN, 0.02 mg/L pantothenic acid); and (yellow curves) N+/Nic-: high nitrogen/ low nicotinic
acid (425 mg/L YAN, 0.08 mg/L nicotinic acid). Curves show the mean of biological triplicates,
error bars correspond to the standard deviation.
(PDF)
S9 Fig. Highly expressed genes during micronutrient starvations compared with nitrogen
starvations and genes specific to pantothenic acid and nicotinic acid starvation (cluster 14)
during alcoholic fermentation. For: N-: low nitrogen, 71 mg/L YAN; N-/Erg-: low nitrogen/
low ergosterol, 71 mg/L YAN, 1.5 mg/L ergosterol; N+/Ole-: high nitrogen/ low oleic acid, 425
mg/L YAN, 18 mg/L oleic acid; N+/Erg-: high nitrogen/ low ergosterol, 425 mg/L YAN, 1.5
mg/L ergosterol; N+/Pan-: high nitrogen/ low pantothenic acid, 425 mg/L YAN, 0.02 mg/L
pantothenic acid and N+/Nic-: high nitrogen/ low nicotinic acid, 425 mg/L YAN, 0.08 mg/L
Yeast cell death in wine alcoholic fermentation
PLOS ONE | https://doi.org/10.1371/journal.pone.0184838 September 18, 2017 19 / 22
nicotinic acid; transcriptomic assays were performed at four time points during alcoholic fer-
mentation (T1, 20 106 cells/mL; T2, 12 g CO2 produced; T3, 40 g CO2 produced; T4, 75 g CO2
produced) indicated by the grey triangle. Results show the mean of biological triplicates.
(PDF)
Acknowledgments
We thank Anne Ortiz-Julien from Lallemand SAS for her support of this work.
Author Contributions
Conceptualization: Camille Duc, Isabelle Sanchez, Jessica Noble, Catherine Tesnière, Bruno
Blondin.
Data curation: Camille Duc, Martine Pradal, Isabelle Sanchez.
Formal analysis: Martine Pradal, Isabelle Sanchez.
Funding acquisition: Jessica Noble, Catherine Tesnière, Bruno Blondin.
Investigation: Camille Duc, Catherine Tesnière, Bruno Blondin.
Methodology: Martine Pradal, Isabelle Sanchez, Catherine Tesnière, Bruno Blondin.
Software: Isabelle Sanchez.
Supervision: Jessica Noble, Catherine Tesnière, Bruno Blondin.
Validation: Catherine Tesnière, Bruno Blondin.
Visualization: Martine Pradal, Isabelle Sanchez.
Writing – original draft: Camille Duc, Isabelle Sanchez.
Writing – review & editing: Camille Duc, Catherine Tesnière, Bruno Blondin.
References
1. Bisson LF. Stuck and Sluggish Fermentations. Am J Enol Vitic. 1999; 50(1).
2. Alexandre H, Nguyen Van Long T, Feuillat M, Charpentier C. Contribution à l’etude des bourbes: influ-
ence sur la fermentescibilite des mouts. Rev francaise d’oenologie. Union des oenologues de France;
1994; 34(146):11–20.
3. Longo VD, Shadel GS, Kaeberlein M, Kennedy B. Replicative and chronological aging in Saccharomy-
ces cerevisiae. Cell Metab. 2012; 16(1):18–31. https://doi.org/10.1016/j.cmet.2012.06.002 PMID:
22768836
4. Boer VM, Amini S, Botstein D. Influence of genotype and nutrition on survival and metabolism of starv-
ing yeast. Proc Natl Acad Sci U S A. 2008; 105(19):6930–5. https://doi.org/10.1073/pnas.0802601105
PMID: 18456835
5. Powers RW, Kaeberlein M, Caldwell SD, Kennedy BK, Fields S. Extension of chronological life span in
yeast by decreased TOR pathway signaling. Genes Dev. 2006; 20(2):174–84. https://doi.org/10.1101/
gad.1381406 PMID: 16418483
6. Tesnière C, Delobel P, Pradal M, Blondin B. Impact of nutrient imbalance on wine alcoholic fermenta-
tions: nitrogen excess enhances yeast cell death in lipid-limited must. PLoS One. 2013; 8(4):e61645.
https://doi.org/10.1371/journal.pone.0061645 PMID: 23658613
7. Sablayrolles JM, Barre P. Effect of anisothermal conditions on the kinetics of alcoholic fermentation by
Saccharomyces cerevisiae. Bioprocess Eng. 1989; 4(3):139–43.
8. Ambroset C, Petit M, Brion C, Sanchez I, Delobel P, Guerin C, et al. Deciphering the molecular basis of
wine yeast fermentation traits using a combined genetic and genomic approach. G3 Genes, Genomes,
Genet. 2011; 1(4).
9. Bely M, Sablayrolles JM, Barre P. Description of alcoholic fermentation kinetics: its variability and signif-
icance. Am J Enol Vitic. 1990; 41(4):319–24.
Yeast cell death in wine alcoholic fermentation
PLOS ONE | https://doi.org/10.1371/journal.pone.0184838 September 18, 2017 20 / 22
10. Zhang R, Wang Y, Tan L, Zhang HY, Yang M. Analysis of polysorbate 80 and its related compounds by
RP-HPLC with ELSD and MS detection. J Chromatogr Sci. 2012; 50(7):598–607. https://doi.org/10.
1093/chromsci/bms035 PMID: 22542890
11. Sablayrolles JM, Barre P, Grenier P. Design of a laboratory automatic system for studying alcoholic fer-
mentations in anisothermal enological conditions. Biotechnol Tech. 1987; 1(3).
12. Delobel P, Pradal M, Blondin B, Tesniere C. A “fragile cell” sub-population revealed during cytometric
assessment of Saccharomyces cerevisiae viability in lipid-limited alcoholic fermentation. Lett Appl
Microbiol. 2012; 55(5):338–44. https://doi.org/10.1111/j.1472-765X.2012.03301.x PMID: 22909384
13. Enjalbert B, Parrou JL, Vincent O, Francois J. Mitochondrial respiratory mutants of Saccharomyces cer-
evisiae accumulate glycogen and readily mobilize it in a glucose-depleted medium. Microbiology. 2000;
146:2685–94. https://doi.org/10.1099/00221287-146-10-2685 PMID: 11021944
14. Klosinska MM, Crutchfield C a., Bradley PH, Rabinowitz JD, Broach JR. Yeast cells can access distinct
quiescent states. Genes Dev. 2011; 25(4):336–49. https://doi.org/10.1101/gad.2011311 PMID:
21289062
15. Delobel P, Tesnière C. A simple FCM method to avoid misinterpretation in Saccharomyces cerevisiae
Cell cycle assessment between G0 and Sub-G1. PLoS One. 2014; 9(1):e84645. https://doi.org/10.
1371/journal.pone.0084645 PMID: 24392149
16. Chomczynski P, Sacchi N. Single-step method of RNA isolation by acid guanidinium thiocyanate-phe-
nol-chloroform extraction. Anal Biochem. 1987; 162(1):156–9. PMID: 2440339
17. R Core Team. No Title. R: A language and environment for statistical computing. R Foundation for Sta-
tistical Computing. 2014. p. http://www.R-project.org/.
18. Smyth GK, Speed T. Normalization of cDNA microarray data. Methods. 2003; 31(4):265–73. PMID:
14597310
19. Conesa A, Nueda MJ, Ferrer A, Talon M. maSigPro: a method to identify significantly differential
expression profiles in time-course microarray experiments. Bioinformatics. 2006; 22(9):1096–102.
https://doi.org/10.1093/bioinformatics/btl056 PMID: 16481333
20. de Hoon MJL, Imoto S, Nolan J, Miyano S. Open source clustering software. Bioinformatics. 2004; 20
(9):1453–4. https://doi.org/10.1093/bioinformatics/bth078 PMID: 14871861
21. Saldanha AJ. Java Treeview—extensible visualization of microarray data. Bioinformatics. 2004; 20
(17):3246–8. https://doi.org/10.1093/bioinformatics/bth349 PMID: 15180930
22. Robinson MD, Grigull J, Mohammad N, Hughes TR. FunSpec: a web-based cluster interpreter for
yeast. BMC Bioinformatics. 2002; 3:35. https://doi.org/10.1186/1471-2105-3-35 PMID: 12431279
23. Ni H-T, LaPorte DC. Response of a yeast glycogen synthase gene to stress. Mol Microbiol. Blackwell
Publishing Ltd; 1995; 16(6):1197–205.
24. Quan Z, Cao L, Tang Y, Yan Y, Oliver SG, Zhang N. The yeast GSK-3 homologue Mck1 is a key con-
troller of quiescence entry and chronological lifespan. PLoS Genet. 2015; 11(6):e1005282. https://doi.
org/10.1371/journal.pgen.1005282 PMID: 26103122
25. Panchaud N, Peli-Gulli M-P, De Virgilio C. Amino acid deprivation inhibits TORC1 through a GTPase-
activating protein complex for the Rag family GTPase Gtr1. Sci Signal. 2013; 6(277):ra42. https://doi.
org/10.1126/scisignal.2004112 PMID: 23716719
26. Bonawitz ND, Chatenay-Lapointe M, Pan Y, Shadel GS. Reduced TOR signaling extends chronological
life span via increased respiration and upregulation of mitochondrial gene expression. Cell Metab. NIH
Public Access; 2007; 5(4):265–77.
27. Fabrizio P, Liou L-L, Moy VN, Diaspro A, Valentine JS, Gralla EB, et al. SOD2 functions downstream of
Sch9 to extend longevity in yeast. Genetics. Genetics Society of America; 2003; 163(1):35–46.
28. Landolfo S, Politi H, Angelozzi D, Mannazzu I. ROS accumulation and oxidative damage to cell struc-
tures in Saccharomyces cerevisiae wine strains during fermentation of high-sugar-containing medium.
Biochim Biophys Acta—Gen Subj. 2008; 1780(6):892–8.
29. Carmona-Gutierrez D, Sommer C, Andryushkova A, Kroemer G, Madeo F. A higher spirit: avoiding
yeast suicide during alcoholic fermentation. Cell Death Differ. 2012; 19(6):913–4. https://doi.org/10.
1038/cdd.2012.31 PMID: 22562133
30. Kitagaki H, Araki Y, Funato K, Shimoi H. Ethanol-induced death in yeast exhibits features of apoptosis
mediated by mitochondrial fission pathway. FEBS Letters. 2007.
31. Weinberger M, Feng L, Paul A, Smith DL, Hontz RD, Smith JS, et al. DNA replication stress is a determi-
nant of chronological lifespan in budding yeast. PLoS One. 2007; 2(8):e748. https://doi.org/10.1371/
journal.pone.0000748 PMID: 17710147
Yeast cell death in wine alcoholic fermentation
PLOS ONE | https://doi.org/10.1371/journal.pone.0184838 September 18, 2017 21 / 22
32. Belenky P, Racette FG, Bogan KL, McClure JM, Smith JS, Brenner C. Nicotinamide riboside promotes
Sir2 silencing and extends lifespan via Nrk and Urh1/Pnp1/Meu1 pathways to NAD+. Cell. 2007; 129
(3):473–84. https://doi.org/10.1016/j.cell.2007.03.024 PMID: 17482543
33. Tsang F, James C, Kato M, Myers V, Ilyas I, Tsang M, et al. Reduced Ssy1-Ptr3-Ssy5 (SPS) signaling
extends replicative life span by enhancing NAD+ homeostasis in Saccharomyces cerevisiae. J Biol
Chem. American Society for Biochemistry and Molecular Biology Inc.; 2015; 290(20):12753–64.
34. Kaeberlein M, Burtner CR, Kennedy BK, Bitterman K, Medvedik O, Sinclair D, et al. Recent develop-
ments in yeast aging. PLoS Genet. Public Library of Science; 2007; 3(5):e84.
35. Orozco H, Matallana E, Aranda A. Wine yeast sirtuins and Gcn5p control aging and metabolism in a nat-
ural growth medium. Mech Ageing Dev. 2012; 133(5):348–58. https://doi.org/10.1016/j.mad.2012.03.
013 PMID: 22738658
36. Li L, Miles S, Melville Z, Prasad A, Bradley G, Breeden LL. Key events during the transition from rapid
growth to quiescence in budding yeast require posttranscriptional regulators. Mol Biol Cell. American
Society for Cell Biology; 2013; 24(23):3697–709.
37. Lis P, Jurkiewicz P, Cal-Bąkowska M, Ko YH, Pedersen PL, Goffeau A, et al. Screening the yeast
genome for energetic metabolism pathways involved in a phenotypic response to the anti-cancer agent
3-bromopyruvate. Oncotarget. Impact Journals, LLC; 2016; 7(9):10153–73.
38. Leadsham JE, Miller K, Ayscough KR, Colombo S, Martegani E, Sudbery P, et al. Whi2p links nutritional
sensing to actin-dependent Ras-cAMP-PKA regulation and apoptosis in yeast. J Cell Sci. 2009; 122
(5):706–15.
39. Orozco H, Matallana E, Aranda A. Two-carbon metabolites, polyphenols and vitamins influence yeast
chronological life span in winemaking conditions. Microb Cell Fact. 2012; 11(1):104.
40. Guaragnella N, Antonacci L, Passarella S, Marra E, Giannattasio S. Achievements and perspectives in
yeast acetic acid-induced programmed cell death pathways. Biochem Soc Trans. 2011; 39(5).
41. Hagen KM, Keller M, Edwards CG. Survey of biotin, pantothenic acid, and assimilable nitrogen in wine-
grapes from the pacific northwest. Am J Enol Vitic. 2008; 59(4):432 LP– 436.
42. Wang XD, Bohlscheid JC, Edwards CG. Fermentative activity and production of volatile compounds by
Saccharomyces grown in synthetic grape juice media deficient in assimilable nitrogen and/or panto-
thenic acid. J Appl Microbiol. 2003; 94(3):349–59. PMID: 12588542
43. Bely M, Sablayrolles J-M, Barre P. Automatic detection of assimilable nitrogen deficiencies during alco-
holic fermentation in oenological conditions. J Ferment Bioeng. 1990 Jan; 70(4):246–52.
44. Crepin L, Nidelet T, Sanchez I, Dequin S, Camarasa C. Sequential use of nitrogen compounds by Sac-
charomyces cerevisiae during wine fermentation: a model based on kinetic and regulation characteris-
tics of nitrogen permeases. Appl Environ Microbiol. 2012; 78(22):8102–11. https://doi.org/10.1128/
AEM.02294-12 PMID: 22983966
Yeast cell death in wine alcoholic fermentation
PLOS ONE | https://doi.org/10.1371/journal.pone.0184838 September 18, 2017 22 / 22