a self-organized neuro-fuzzy system for stock market ... self-organized neuro-fuzzy system for stock...
TRANSCRIPT
A Self-Organized Neuro-Fuzzy System for Stock Market Dynamics
Modeling and Forecasting
C. L. Su
Department of Information Management
Chang Jung Christian University
Taiwan, R.O.C.
C. J. Chen
Department of Aviation Service Management
Aletheia University
Taiwan, R.O.C.
S. M. Yang
Department of Aeronautics and Astronautics
National Cheng Kung University
Taiwan, R.O.C.
Abstract: -A self-organized, five-layer neuro-fuzzy model is developed to model the dynamics of stock market
by using technical indicators.The model effectiveness in prediction and forecasting is validated by a set of data
containing four indicators: the stochastic oscillator (%K and %D), volume adjusted moving average (VAMA)
and ease of movement (EMV) from TAIEX (Taiwan Stock Exchange Capitalization Weighted Stock Index). A
modified moving average method is proposed to predict the input set for the neuro-fuzzy model in forecasting
stock price.Simulation results show that the model is effective in prediction and accurate in forecasting.The
input error from the prediction of the modified moving average method is attenuated significantly by the
neuro-fuzzy model to yield better forecasting results.
Key-Words:-Neuro-fuzzy system, Sugeno fuzzy system, Forecasting.
1 Introduction
State forecasting of a dynamical system requires the
current and previous condition to forecast the
system’s future states. Forecasting entails gathering
historical data, analyzing patterns, and acquiring
results that facilitate the prediction of future events.
It is believed that past information can be modeled
into a system that explains the current behavior and
predict the future state. Classical approaches are
mainly based on stochastic models by using the time
series techniques such as autoregressive moving
average and multiple regression models; however,
the accuracy of state forecasting may be vulnerable
to qualitative factors from macro-economical and
political effects.
Many have focused on applying recurrent or
feedforward neural network (NN) to state
forecasting. NN is effective in realizing the
input-output mapping, thus useful as a state
estimator/forecaster, but its performance is
LATEST TRENDS on COMPUTERS (Volume II)
ISSN: 1792-4251 733 ISBN: 978-960-474-213-4
constrained by large amount of training required and
by the “black box” nature opaque to the dataset.
Freitas et al. (2009) presented a neural network to
predict stock market returns. Liu et al. (2007) also
applied a network-based reinforcement learning in
predicting stock price. Some also proposed to use
genetic algorithms to obtain optimal solution (Kim
and Shin, 2006; Kim and Shin, 2007; Chavarnakul
and Enke, 2009), but the required computational
complexity in iterative neural network structures is
very demanding. In addition, forecast of future
stock price by using NN requires future state input,
which is not know a prioi and has to be generated.
Recent developments proposed to integrate NN for
the learning capabilities and fuzzy logic for the
abstract thinking /reasoning. Yang et al. (2007) and
Chen et al. (2009) have successfully applied
neuro-fuzzy model in system identification and state
forecasting of engineering systems. Lin et al. (2008)
proposed to use neuro-fuzzy model as an early
warning indicator for currency crisis, and Keles et
al. (2008) also applied a neuro-fuzzy model to
forecast domestic debt. Compared with NN, fuzzy
logic offers better insight, but its performance
depends on the fuzzification of the time series data.
It is promising for simulating experts’ knowledge,
but the application is strongly influenced by the
fuzzy rules. Forecasting price movements in stock
market is a major challenge confronting investors.
Based on the rough set-based pseudo outer-product,
Ang and Quek (2006) applied a neuro-fuzzy model
in stock trading. Similar rough set model dealing
with vagueness and uncertainty of a data set was
proposed in forecasting by defining decision rules
(Yao and Herbert, 2009). Other studies employed
the support vector machine based on a risk function
of empirical error to predict stock price index
(Huang et al., 2005) and presented a combination of
hidden Markov model and fuzzy model for
forecasting stock market (Hassan, 2009). A recent
survey concluded that neuro-fuzzy models are
suitable for stock market forecasting, but difficulties
arise in defining the structure model (Astalakis and
Valavanis, 2009 a and b). A self-organized
neuro-fuzzy model is developed in this work for
effective and efficient modeling, prediction, and
forecasting. Section II describes the self-organized,
5-layer neuro-fuzzy model in simulating the stock
market dynamics. Section III discusses the 4
technical indicators in establishing the neuro-fuzzy
model and the modified moving average method in
generating the network input for forecasting. The
model’s performance and the forecasting
effectiveness are demonstrated in Section IV, and
the conclusions are summarized in the last section.
2 Neuro-Fuzzy Model
Artificial neural networks originally inspired by
biological neural networks can learn complex
functional relations by generalizing from a limited
training data. Neural networks can thus serve as a
black-box for nonlinear dynamic systems by using
input/output training data. Two of most commonly
used fuzzy inference systems are Mamdani fuzzy
model and Sugeno fuzzy model (Chen et al., 2009).
The former describes a system by using the natural
language that makes it more intuitive and easy to
realize, while the latter specifies a system by
mathematical relation that makes it suitable to
optimization. Technical analysis in financial market
aims at identifing price patterns and attempts to
exploit those trends by using the indicators of some
mathematical transformations in terms of price or
volume. These indicators can be applied as the input
to a neural network for simulating the stock market
LATEST TRENDS on COMPUTERS (Volume II)
ISSN: 1792-4251 734 ISBN: 978-960-474-213-4
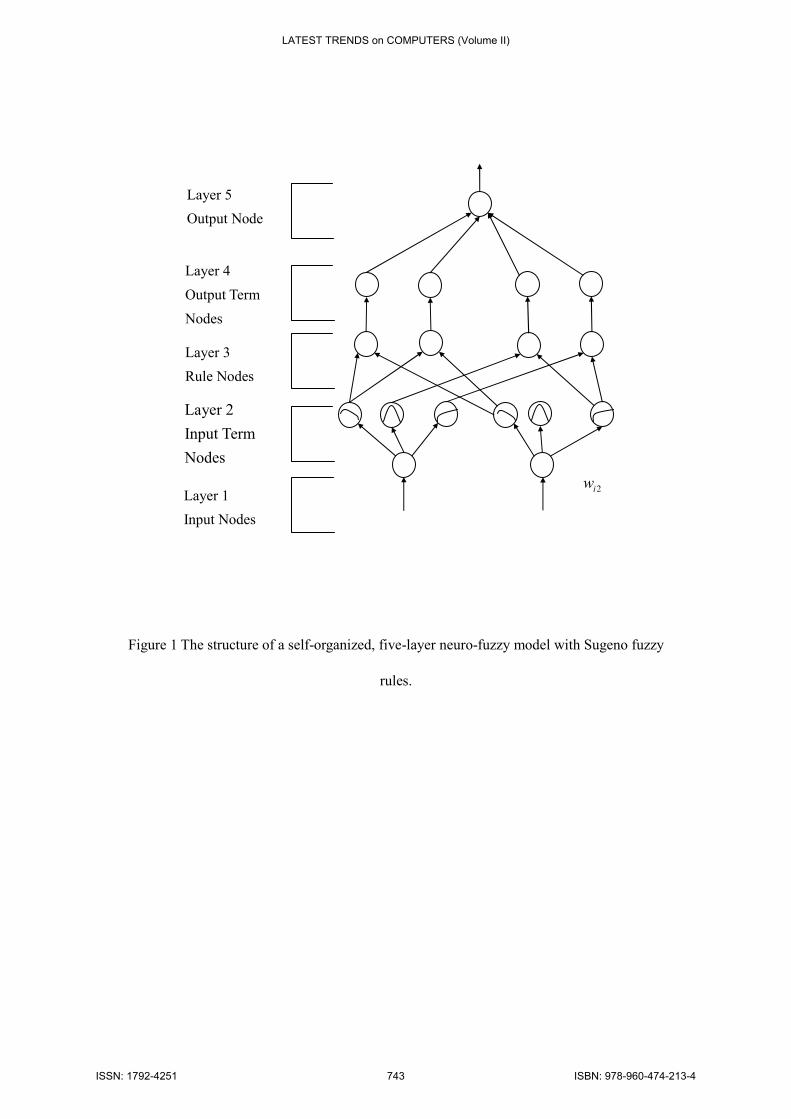
dynamics. The five-layer, feed-forward neuro-fuzzy
model with Sugeno fuzzy rules is shown in Fig. 1.
Layer 1 defines the input nodes such as the technical
indicators, and layer 5 the output node such as the
closing price of a stock. Layer 2 is the term nodes of
membership function to express the linguistic terms
such as more important, neutral, and less important.
Layer 3 defines the nodes representing the fuzzy
rules. A series-parallel identification model for
nonlinear stock market systems can be written as
ˆ( 1) ( ( ), ( 1),..., ( 1); ( ), ( 1),..., ( 1))k k k k n k k k m+ = − − + − − +y f y y y x x x
(1)
where )1(ˆ +ky is the estimated output vector of
the neuro-fuzzy model at time step k+1,
)]( ),([ TT kk yx represents the input-output vector
pair of the market at time step k, and n and m are the
maximum lags (historical data points) in the input
and output, respectively. Equation (1) indicates that
)1(ˆ +ky is a function of the past n values of the
model output (stock’s closing price))( ik −y, i =
0,1,…, n-1, and the past m values of the input
(technical indicators))( jk −x, j = 0,1,…, m-1. By
determining the fuzzy logic rules and optimizing the
membership functions through the connective
weights ( 2iw and 4iw
), a neuro-fuzzy model is
established.
Each node in the first layer is an input node in
proportion to one input variable, and there is no
computation in this layer, 1i iO x=, where 1iO
is
the output value of the thi node in layer 1, and xi is
the thi input variable. Fuzzification is done in the
second layer with each node corresponding to one
linguistic term of the input variables via Gaussian
function
−−=
2
2
212 exp
i
iii
mOO
σ to calculate
the membership value of the fuzzy sets, where 2im
and 2iσ are the center (mean) and width (variance)
of the Gaussian membership function of the thi
node in layer 2, respectively. Each node in layer 3
represents its fuzzy rule and has the form,
1 1 2 2: If is and is ...and ,i i i p ipR x A x A x is A
0 1 1 then = ...
i i i ip py c c x c x+ + +
(2)
where iR signifies the thi fuzzy rule,
T =x
[ 1 2, , ..., ]px x x is the input to the system, iy
is the
output consequent of the fuzzy rule Ri. Ai1, Ai2,…,
and Aip are the variance parameters of the
membership functions, and the weight of each firing
rule ci0, ci1…, and cip are real parameters. The
weights 2iw in layer 2 express the association of
the rule with the thi linguistic output variable so
that the output of layer 3 is calculated by taking the
average of the individual rule’s contribution
3 2 2 /i i i
i
O w w= ∑ (3)
LATEST TRENDS on COMPUTERS (Volume II)
ISSN: 1792-4251 735 ISBN: 978-960-474-213-4
Each node in layer 4 is a square mode with
4 3 i i iO O y= ⋅, and the output is by using the
weighted average,
∑∑ ⋅=i
ii
i
ii wywO 445 /
(4)
and there is no membership function tuning in this
layer.
The neuro-fuzzy model is a self-organized,
two-phase learning process with phase one to locate
the initial membership function and phase two to
find the fuzzy rules. In phase 1, the center and the
width of the initial membership function are
determined by the feature-map algorithm
|| ( ) ( ) || min{|| ( ) ( )||}c i
x k m k x k m k− = − (5)
where ( 1) = ( ) ( ( ) ( )) c c cm k m k x k m kα+ + −
and ( 1) = ( )i im k m k+
for i cm m≠
. where
( )x k and ( )im k
are the input and the center of
membership function, respectively. The subscript c
indicates the associative closest value. This adaptive
formula runs independently for each input and
linguistic output variables. Once( )im k
is
calculated, the width( )i kσ
can be determined by the
first-nearest-neighbor heuristic, ( - ) /i i cm m rσ =
,
where r is the overlap parameter. After the
membership functions have been calculated, the
backpropagation learning algorithm is to find the
fuzzy rules in phase 2. The output of layer 2 is
transmitted to layer 3 to find the firing strength of
each rule node. Based on the firing strength and the
node output in layer 4, the correct consequence-link
for each node can be determined by using error
backpropagation to minimize the error
function2( ( ) ( )) / 2E d k y k= −
, where d(k) is the
desired output and y(k) is the current output. The
weight is tuned via the update rule,
( 1) ( ) ( )ij ij ijw k w k w k+ = + ∆ (6)
4 4 4 4 4 43 4 2
4 4
( )-( )( ) ( ( )- ( ))
( )
i i i i i iij j ij i
i i
m O m Ow k d k y k O w if j r
O
σ ση σ
σ∑ ∑
∆ = =∑
ɵ
(7)
where
2
3Arg max( ( ) )j ijj
r O w=ɵ and η is the
learning rate. By adjusting the weight, the correct
consequent link of each rule node is determined.
For every antecedent clause, the centroid of all the
possible consequent is calculated. Only the
dominant rule whose consequent has the highest
membership value is selected.
By using Eq.(4) and the gradient of center
4im, the center is updated via
4 44 4 4 4( 1) ( ) ( ( ) ( )) / i ii i i im k m k d k y k O Oη σ σ+ = + − ⋅ ∑
(8)
Similarly, the width parameter is
4 4 4 4 4 44 4 4 2
4 4
( ) ( )( 1) ( ) ( ( ) ( ))
( )i i i i i i
i i i
i i
m O m Ok k d k y k O
O
σ σσ σ η
σ−∑ ∑+ = + − ⋅
∑
(9)
The error signal in layer 4 is derived as
4 4 4 4 4 44 4 2
4 4
( ) ( )( ) ( ( ) ( ))
( )i i i i i i
i i
i i
m O m Ok d k y k
O
σ σδ σ
σ−∑ ∑= − ⋅
∑
(10)
By the same token, only the error signal 3iδ is
needed and it is identical to 4iδ . In layer 2, the
center and width parameter are updated by
LATEST TRENDS on COMPUTERS (Volume II)
ISSN: 1792-4251 736 ISBN: 978-960-474-213-4
1 22 2 2 2
2
( )( 1) ( ) 2
( )i i
i i i kk
i
O mm k m k O qη
σ−
+ = − ∑
(11)
2
1 22 2 2 3
2
( )( 1) ( ) 2
( )
i iki i i
ki
O mk k O qσ σ η
σ−
+ = − ∑
(12)
where qk = 1 when Oi2 = min(input of the kth rule
node) and qk = 0 for the others.
The weight vector of the firing rule is updated by
iii gkk α+=+ )()1( cci ))()(( kyky di − TT )]( ,1[ kx
(13)
where ig is the decreasing rate,
0 1ig≤ <, and iα
is the firing strength of the thi
rule, 1 1 2 2min{ ( ), ( ), ... ( )}i i i ip pA x A x A xα =. After
adjusting the weight vector ic , the correct
consequent link of each rule node can be
determined. For every antecedent clause, the
centroid of all the possible consequent is computed.
If jwin is the relative width of the winner fuzzy
rule
min{ , } max{ , }
| |
mj nj mj nj
j
mj nj
sr sr sl slwin
c c
−=
− (14)
where mjc and njc
are the center of the winner
rule and the first runner-up respectively. Similarly,
mjsr and mjsl
are the right and left spreads of the
winner fuzzy rule, njsr and njsl
are those of the
runner-up rules. The spread rvs is updated by
( 1) ( ) ( )( ( ) ( )), rv rv rv rvs k s k k c k s kη+ = + −
when sgn( ) sgn( )i r ly y y y− = − (15a)
( 1) ( ) ( )( ( ) ( )),rv rv rv rvs k s k k c k s kη+ = − −
otherwise (15b)
where rvc is the center of winner rule,
)(kη is the
learning rate, ry and ly
are the output computed
independently for each rule. The antecedent
parameter with smallest relative width is tuned by
min{ }i jj
win win=, and the centers of the fuzzy sets
are updated when only a normal fuzzy rule fires.
The center rvc is moved towards the input ( )x k
according to
( 1) ( ) ( )( ( ) ( ))rv rv i rvc k c k k x k c kαη+ = + − (16)
The above learning algorithm highlights the
computation procedures in the design of neuro-fuzzy
model. After training and validation by another set
of input and output, the neuro-fuzzy model can be
applied to forecasting.
3 Technical Indicators
Stock market movements can be modeled by
fundamental analysis and technical analysis. The
former studies the economy, industry, and financial
environments and uses revenues, earnings, growth
potential, return of equity, and profit margin to
measure the intrinsic value of a stock; while the
latter studies the historical price and volume to
measure a stock. For many years technical analysis
has played an important role in stock market for it
offers combined social, economical, and political
effects. Models and trading rules based on price and
LATEST TRENDS on COMPUTERS (Volume II)
ISSN: 1792-4251 737 ISBN: 978-960-474-213-4
volume data, such as the relative strength index,
moving averages, regression, inter-market and
intra-market price correlation, have been applied to
simulate the dynamical patterns. A recent work
confirmed that 56 of the 95 studies of technical
analysis had positive results, although
data-snooping bias and other problems made the
analysis difficult (Park and Irwin, 2007.)
The key to successful forecasting is to achieve best
prediction with minimum input. The stochastic
oscillator is one of the most recognized
momentum indicators in technical analysis.
The oscillator compares a stock's closing price to its
price range over a given time period. The idea is
that in an uptrend, the price should be closing
near the highs of the trading range, signaling
upward momentum. In downtrends, conversely,
the price should be closing near the lows of the
trading range, signaling downward momentum.
The stochastic oscillator is within 0-100 and it
generally signals overbought conditions above
80 and oversold conditions below 20. The
stochastic oscillator contains two lines: the %K
is the raw measure to formulate the idea of
momentum behind the oscillator and the %D is
a moving average of %K.
The main approach in financial forecasting is to
identify trends at an early stage for an investment.
Trading volume is a standard market measurement
and is critical to interpret price movement. It has
been known that past trading volume may provide
valuable information in predicting future stock price.
Based on this concept, equivolume charting by
replacing the time frame of reference with the
volume frame of reference has been proposed
studying stock market dynamics. The volume
adjusted moving average (VAMA) is a technical
indicator based on equivolume charting by using
trading volume measure over time-duration measure
(Chavarnakul and Enke, 2008). A duration with
heavier trading volume has more weight on the
moving averages, and the contribution of each
closing price is based on their volume relative to
others. Similarly, the ease of movement (EMV)
is a technical indicator that converts the
information of the equivolume chart into a
numerical equivalent. The indicator
demonstrates the relationship between the price
change of a stock and its volume so as to predict
the trend. A high and positive (negative) value
of EMV shows that the stock price moves
upward (down) on light volume, while a low
value around zero identifies the price is
stagnant, or that it takes heavy volume to move.
The calculation of EMV is based on the price range
and volume within a period and the price change
from the prior entry by Fibonacci numbers.
The data from the four technical indicators, %K,
%D, VAMA, and EMV, are adopted as the input set
to the self-organized, 5-layer neuro-fuzzy model,
( ) [%K( ), %D( ), VAMA( ), EMV( )]T k k k k k=x
. In forecast, however, one will have to generate
x(k+1) as the input to calculate y(k+1) by the
neuro-fuzzy model. A modified moving average
method is applied to predict the input data set for
forecasting,
)1(...)1()()1( 21 +−++−+=+ nkakakak nxxxx
(17)
where naaa and ..., , , 21 are the moving average
coefficients. The five-layer neuro-fuzzy model with
Sugeno fuzzy rule is applied to validate and forecast
the stock market in the next section.
4 Application to Forecasting
LATEST TRENDS on COMPUTERS (Volume II)
ISSN: 1792-4251 738 ISBN: 978-960-474-213-4
A data set from TAIEX (Taiwan Stock Exchange
Capitalization Weighted Stock Index) is selected is
to predict future stock trend by analyzing the history
of stock prices. The self-organized, 5-layer
neuro-fuzzy model as shown in Fig. 1 has 4 inputs
and one output. Four technical indicators: %K, %D,
volume adjusted moving average (VAMA), and ease
of movement (EMV) from 1997/4 to 2009/6 are
selected as the input to establish a neuro-fuzzy
model. The 140 data points from 1997/4-2008/11
(monthly data) are taken as the training data set,
while those from 2008/12-2009/ (7 data points) are
applied to validate the neuro-fuzzy model. Each
input’s with Gaussian membership function is
partitioned into three spaces: negative large, zero,
positive large, {NL, ZE, PL}, so that the
neuro-fuzzy model in Fig. 1 is of [4-12-81-81-1]
structure: 4 input neurons, 12 input term neurons, 81
rule neurons, 81 output term neurons and 1 neuron
in the output layer.
The data from seven stocks: A, B, C, D, E, F, and G
(TAIEX stock number: 1101, 1216, 1303, 1504,
1907, 2501, and 2801) are employed in training the
neuro-fuzzy model and the training time is set at 300
epochs. The decreasing rate in Eq. (13) is set at
ig = 0.9 and the initial learning rate in Eq. (16) is
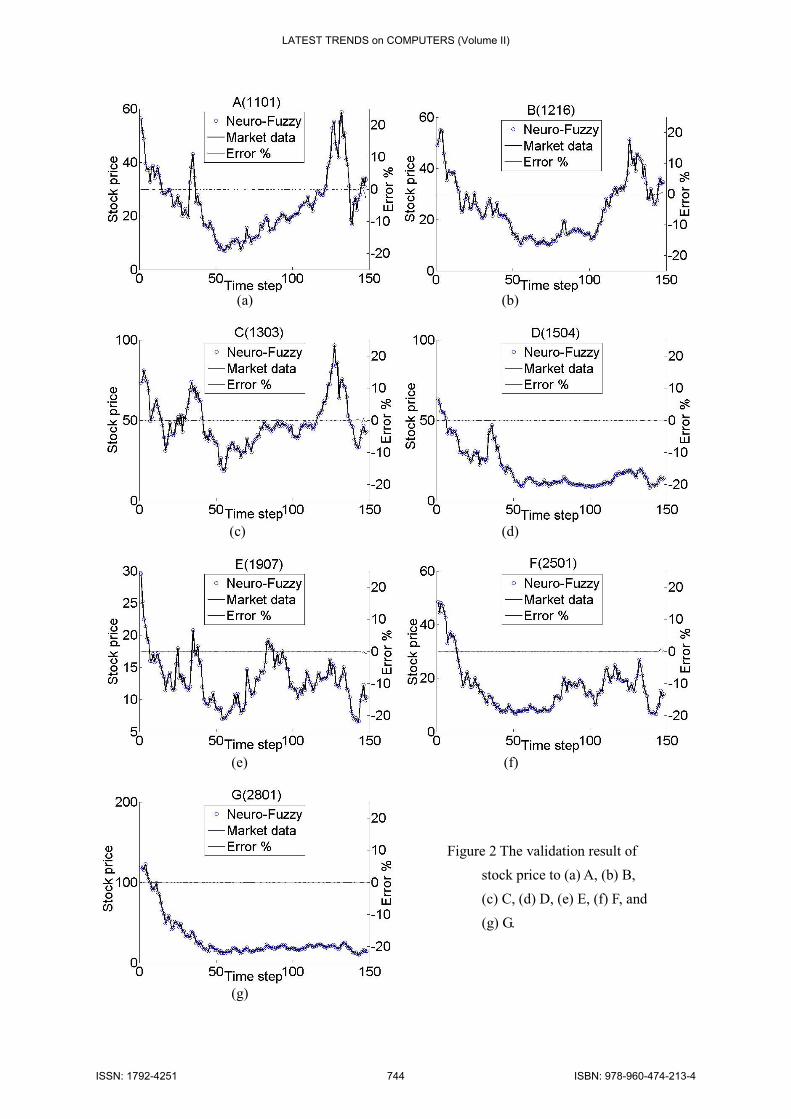
η= 0.01. Figure 2 shows the effectiveness of the
neuro-fuzzy model in simulating the stock
dynamics. The model output of the seven stocks
match very well with the market dynamics.
Validation of the neuro-fuzzy model shows that the
model is so accurate that the discrepancy also
plotted in the same figure is within 1.5% and the
RMS errors are 1.35% for A, 0.32% for B, 0.43%
for C, 0.06% for D, 0.40% for E, 0.51% for F, and
0.02% for G.. The [4-12-81-81-1] neuro-fuzzy
model is shown effective in modeling and
prediction.
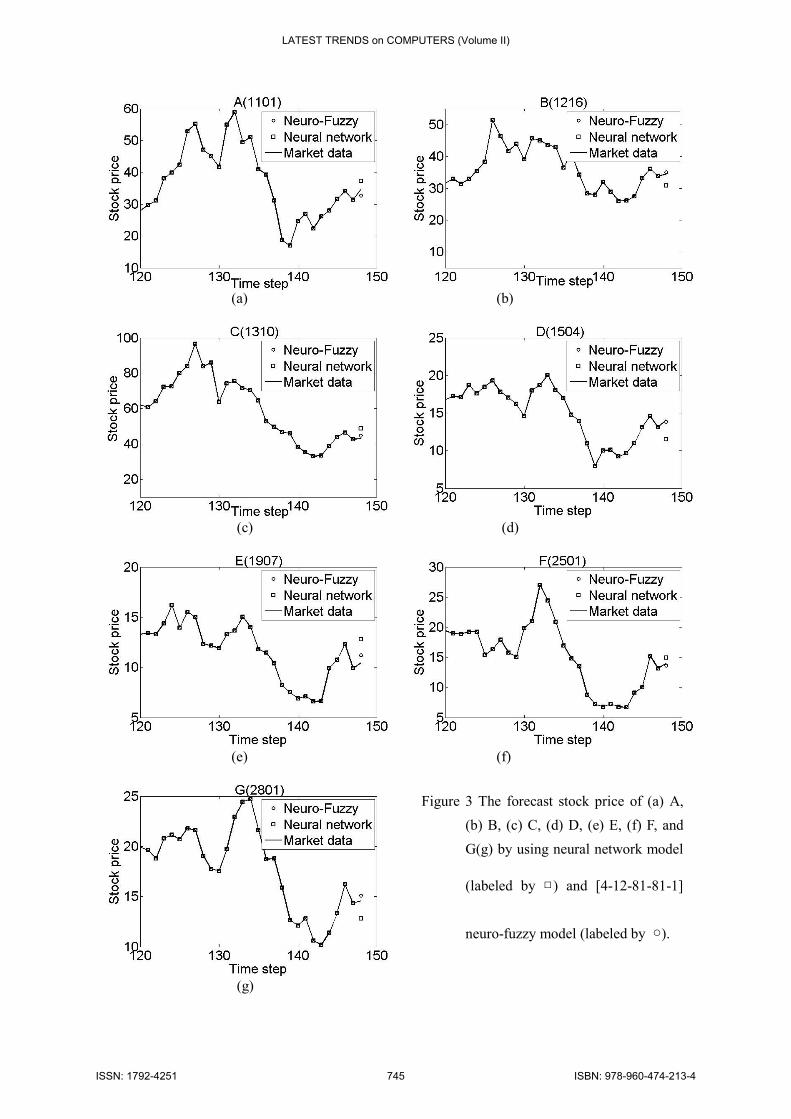
To validate the effectiveness of the neuro-fuzzy
model in forecasting, the 147 data points
(1997/4-2009/6) are employed as the training data,
and the recent data point (2009/7) is assumed to be
unknown. The input for forecasting 2009/7’s stock
price is generated by the modified moving average
method with 6/1 and ,2/1 ,3/1 321 === aaa as
shown in Eq. (17). By the same initial conditions,
Fig. 3 shows the forecast of the neuro-fuzzy model,
and the discrepancy is within 7.5%. Of the 7, 4 are
within 4%. The forecast by using the neural network
model (Chavarnakul and Enke, 2008) is also
conducted and the results are plotted in the same
figure. The performance of the 5-layer neuro-fuzzy
model is shown superior to that of a neural fuzzy
model.
Table 1 lists the forecast accuracy of the neuro-fuzzy
model is much higher than the neural network
model. In addition, the neuro-fuzzy model is
capable of attenuating effectively the input error.
The maximum errors of the input prediction by the
modified moving average method are in
25.81%-38.04% range for the seven stocks, but they
are attenuated significantly by the neuro-fuzzy
model to within 1.78%-7.37%. Similarly for the
average errors. The forecast has 92.5%-98.5%
accuracy, and the simulation results show that the
neuro-fuzzy system with Sugeno fuzzy rules has
good performance in modeling, prediction and
forecasting.
5 Conclusions
A neuro-fuzzy model’s performance is strongly
influenced by the selection of membership functions
LATEST TRENDS on COMPUTERS (Volume II)
ISSN: 1792-4251 739 ISBN: 978-960-474-213-4
in input/output and the fuzzy logic rules, which are
determined by expert’s knowledge or experiences.
Such decision may be difficult on complex stock
market system. The five-layer neuro-fuzzy model of
this work can be constructed and self-organized
solely from the input/output data to simulate stock
market dynamics and forecast stock price. Neural
network recognizes the patterns and adapt to cope
with stock market movements, while fuzzy inference
logic incorporates human knowledge and expertise
for decision making. The model is a two-phase
learning process with phase one for locating the
initial membership function by the feature-map
algorithm and phase two for finding the fuzzy rules
by the gradient descent algorithm. By highlighting
the advantages and overcoming the limitations of
neural network and rule-based fuzzy logic, the
integrated neuro-fuzzy model can facilitate reliable
intelligent state forecasting to support
decision-making process.
The neuro-fuzzy system is applied to model the
dynamics of stock market, and the modified moving
average method is applied to generate a set of input
data to the model for forecasting. By using the
[4-12-81-81-1] structures with four inputs: %K, %D,
volume adjusted moving average (VAMA), and ease
of movement (EMV) from 1997/4 to 2009/6, the
neuro-fuzzy model is shown to effectively and
efficiently simulate the stock market dynamics.
The neuro-fuzzy model has good performance and it
outperforms the neural network model both in
modeling and forecasting. The errors of the input
prediction by the modified moving average method
in 25.81%-38.04% are attenuated by the neuro-fuzzy
model to within 1.38%-7.37%. The forecast
accuracy is 92.5%-98.5% for the seven stocks.
Technical analysis looks for participant
configurations in forecasting states, and the above
forecast accuracy is based on the neuro-fuzzy model
with the input of 4 technical indicators. It should be
noted that the self-organized, five-layer neuro-fuzzy
model is applicable by using any other set of input.
There are many technical analysis indicators and the
most difficult part of technical analysis is to decide
which indicator to use. Market indicators typically
fall into three categories: monetary, sentiment, and
momentum, and input data pre-processing and
sampling may impact forecast accuracy. Selection of
different input combination can eliminate redundant
input and improve accuracy. Further study of
representative input of other technical indicators is
required. In addition, factors such as fiscal policy,
economic environment, and political events may
also be included in the linguistic input to model the
effect of fundamental analysis.
References:
[1] Ang, K. K., & Quek, C. (2006). Stock trading
using RSPOP: A novel rough set-based
neuro-fuzzy approach. IEEE Transactions on
Neural Networks, 17, 5, 1301-1315.
[2] Atsalakis, G. S., & Valavanis, K. P. (2009a).
Forecasting stock market short-term trends using
a neuro-fuzzy based methodology. Expert
Systems with Applications, 36, 10696-10707.
[3] Atsalakis, G. S., & Valavanis, K. P. (2009b).
Surveying stock market forecasting techniques -
Part II: Soft computing methods. Expert Systems
with Applications, 36, 3, 5932-5941.
[4] Chavarnakul, T., & Enke, D. (2008).
Intelligent technical analysis based equivolume
charting for stock trading using neural network.
Expert Systems with Applications, 34,
1004-1017.
LATEST TRENDS on COMPUTERS (Volume II)
ISSN: 1792-4251 740 ISBN: 978-960-474-213-4
[5] Chavarnakul, T., & Enke, D. (2009). A hybrid
stock trading system for intelligent technical
analysis-based equivolume charting.
Neurocomputing, 72, 3517-3528.
[6] Chen, C. J., Yang, S. M., & Wung, Z. C. (2009).
System identification by neuro-fuzzy model with
Sugeno and Mamdani fuzzy rules. Journal of
Aeronautics Astronautics and Aviation, Series
A, 41, 4, 263-270.
[7] Freitas, F. D., De Souza, A. F., & De Almedia,
A. R. (2009). Prediction-based portfolio
optimization model using neural networks.
Neurocomputing, 72, 2155-2170.
[8] Hassan, Md. (2009). A combination of hidden
Markov model and fuzzy model for stock market
forecasting. Neurocomputing, 72, 3439-3446.
[9] Huang, W., Nakamori, Y., & Wang, S.-Y.
(2005). Forecasting stock market movement
direction with support vector machine.
Computers & Operations Research, 32,
2513-2522.
[10] Keles, A., Kolcak, M., & Keles, A. (2008).
The adaptive neuro-fuzzy model for forecasting
the domestic debt. Knowledge-Based Systems,
21, 951-957.
[11] Kim, H.-J., & Shine, K.-S. (2007). A hybrid
approach based on neural networks and genetic
algorithms for detecting temporal patterns in
stock markets. ScienceDirect, Applied Soft
Computing, 7, 569-576.
[12] Lin, C. S., Khan H. A., Chang, R. Y., & Wang,
Y. C. (2008). A new approach to modeling early
warning systems for currency crises: Can a
machine-learning fuzzy expert system predict the
currency crises effectively? Journal of
International Money and Finance, 27, 7,
1098-1121.
[13] Liu, F., Ng, G. S., & Quek, C. (2007). RLDDE:
A novel reinforcement learning-based dimension
and delay estimator for neural networks in time
series prediction. ScienceDirect,
Neurocomputing, 70, 1331-1341.
[14] Park, C. H. Irwin, S. H. (2007). What do we
know about the profitability of technical
analysis? Journal of Economic Surveys, 21, 4,
786-826.
[15] Yang, S. M., Chen, C. J., Chang, Y. Y. &
Tung, Y. Z., (2007). Development of a
self-organized neuro-fuzzy model for system
identification. Journal of Vibration and
Acoustics, ASME, 129, 507-513.
[16] Yao, J. T., & Herbert, J. P. (2009). Financial
time-series analysis with rough sets. Applied Soft
Computing, 9, 1000-1007.
LATEST TRENDS on COMPUTERS (Volume II)
ISSN: 1792-4251 741 ISBN: 978-960-474-213-4
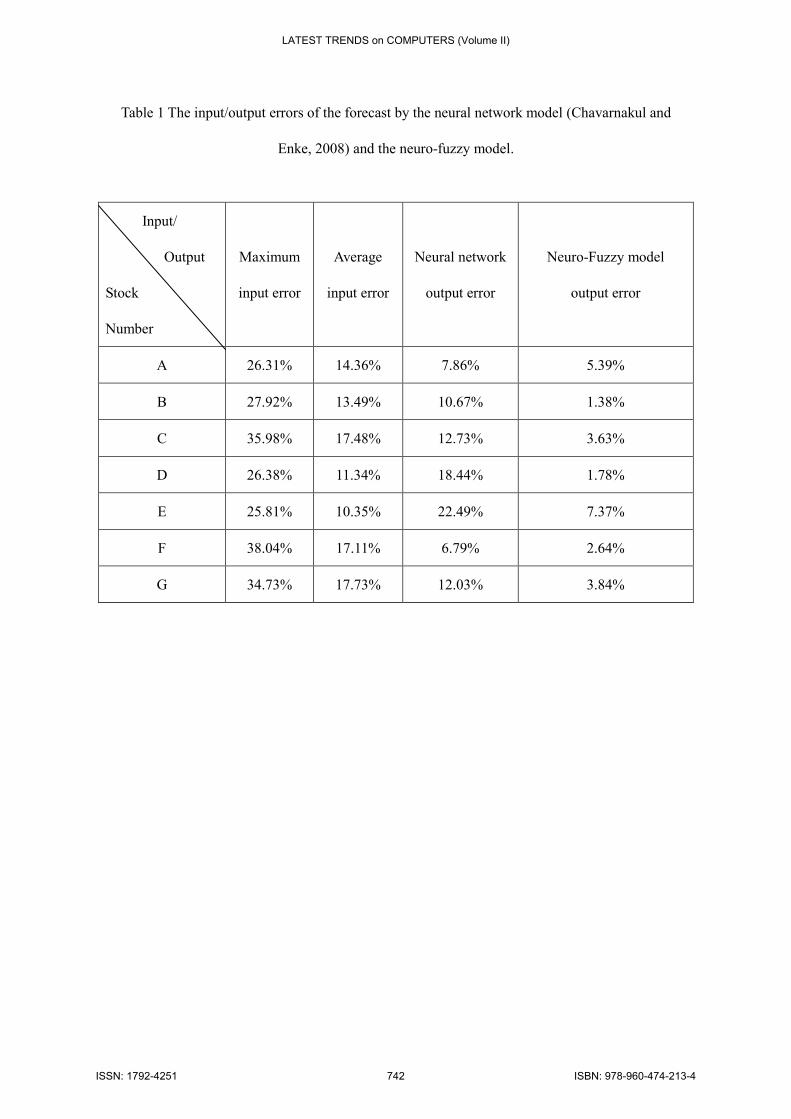
Table 1 The input/output errors of the forecast by the neural network model (Chavarnakul and
Enke, 2008) and the neuro-fuzzy model.
Input/
Output
Stock
Number
Maximum
input error
Average
input error
Neural network
output error
Neuro-Fuzzy model
output error
A 26.31% 14.36% 7.86% 5.39%
B 27.92% 13.49% 10.67% 1.38%
C 35.98% 17.48% 12.73% 3.63%
D 26.38% 11.34% 18.44% 1.78%
E 25.81% 10.35% 22.49% 7.37%
F 38.04% 17.11% 6.79% 2.64%
G 34.73% 17.73% 12.03% 3.84%
LATEST TRENDS on COMPUTERS (Volume II)
ISSN: 1792-4251 742 ISBN: 978-960-474-213-4
Layer 5
Output Node
Layer 3
Rule Nodes
Layer 2
Input Term
Nodes
Layer 1
Input Nodes
Layer 4
Output Term
Nodes
… …
……
… …
…
…
2iw
Figure 1 The structure of a self-organized, five-layer neuro-fuzzy model with Sugeno fuzzy
rules.
LATEST TRENDS on COMPUTERS (Volume II)
ISSN: 1792-4251 743 ISBN: 978-960-474-213-4
(a) (b)
(c) (d)
(e) (f)
(g)
Figure 2 The validation result of
stock price to (a) A, (b) B,
(c) C, (d) D, (e) E, (f) F, and
(g) G.
LATEST TRENDS on COMPUTERS (Volume II)
ISSN: 1792-4251 744 ISBN: 978-960-474-213-4
(a) (b)
(c) (d)
(e) (f)
(g)
Figure 3 The forecast stock price of (a) A,
(b) B, (c) C, (d) D, (e) E, (f) F, and
G(g) by using neural network model
(labeled by □) and [4-12-81-81-1]
neuro-fuzzy model (labeled by ○).
LATEST TRENDS on COMPUTERS (Volume II)
ISSN: 1792-4251 745 ISBN: 978-960-474-213-4