a sample quantitative thesis...
TRANSCRIPT

A Sample Quantitative Thesis Proposal
Prepared by
Mary Hayes NOTE: This proposal is included in the ancillary materials of Research Design with permission of the author. If you would like to learn more about this research project, you can examine the following thesis that resulted from this work: Hayes, M. M. (2007). Design and analysis of the student strengths index (SSI) for nontraditional graduate students. Unpublished master's thesis. University of Nebraska, Lincoln, NE.

Design and Analysis
1
1
Running Head: DESIGN AND ANALYSIS OF THE STUDENT STRENGTHS INDEX
(SSI) FOR NONTRADITIONAL GRADUATE STUDENTS
DESIGN AND ANALYSIS OF THE STUDENT STRENGTHS INDEX (SSI) FOR NONTRADITIONAL GRADUATE STUDENTS
Mary Hayes
University of Nebraska Lincoln
April 28th, 2007
Design and Analysis
2
2
I. Introduction Background of the study
Introduction Admission committees at graduate schools across the United States are charged
with the task of deciding who to admit into graduate programs. These decisions are often
based on readily available measures used to predict the likelihood of student success
including standardized examinations such as the Graduate Records Examination (GRE)
and measures of past performance such as the Undergraduate Grade-Point Average
(UGPA). Sternberg and Williams (1997) examined the uses of the GRE to admit students
to graduate school. Some schools use the GRE score as a cut score to even be considered
for admission or provide an average GRE in their admission materials (p. 631). While the
use of these measures is common practice, it is not clear whether these measures can
accurately predict student success in all graduate student applicants. When considering
populations of graduate students described as nontraditional, often over 30 years of age or
several years removed from their baccalaureate degree, these measures take on increased
importance (Hartle, Braratz, & Clark, 1983). This study examined the use of a non-
cognitive assessment tool to measure student’s strengths which can be used as an
additional factor for admission committees when considering admitting nontraditional
graduate students.
Statement of Problem
The current admission criteria vary from university to university. Schools often
require a student to take a standardized exam such as the Graduate Records Examination
(GRE) which can be weighted heavily in the overall admission decision (Kuncel, Hezlett
Design and Analysis
3
3
& Ones, 2001). Standardized examinations are typically designed for traditional-aged
students, who tend to perform better than nontraditional aged test-takers. Lindle and
Rinehart (1998) state “the GRE was designed for ‘traditional’ graduate students, those
who pursue advanced studies full time immediately or shortly after attaining their
baccalaureates” (p.1). Other studies have found that older students score significantly
lower particularly on quantitative measures associated with the GRE (Clark, 1984;
Hartle, Braratz, & Clark, 1983). If admission or selection decisions are based primarily
on measures such as the GRE alone, the potential impact of adverse decisions is
enormous because an estimated 48.6% of the 2,637,000 students entering graduate school
in 2003 were over the age of 30 (Digest of Educational Statistics, 2004). Most schools
use multiple factors to consider applicants for admission. However, schools have a
limited amount of resources to admit students each year. There are more applicants than
positions to be filed. The number of applicants to admitted students varies by department
or school; at Yale University in the Comparative Literature department reports a 10:1
ratio for applicants to acceptance (http://www.yale.edu/complit/gradprogramfaq.html
(November 15, 2007)). There is no explicit minimum stated; however, they make note
that “the scores of those admitted tend to be high to very high.” The ratio for applicants to
admission for the Department of Planning Policy and design at University of California-
Irvine for the PhD program is 5:1 (http://socialecology.uci.edu/?q=ppd/faq, (November
15, 2007)). The minimum GRE combined for UC-Irvine is 1000; the website states that
“applicants falling below the minimum on either standard should exhibit compensatory
strengths in other areas.” At the University of Nebraska-Lincoln in the Educational
Psychology department the admit ratio varies by specialization, 2:1 for Cognition,
Learning and Development (CLD); 1.5:1 for Quantitative Qualitative and Psychometric
Design and Analysis
4
4
Methods (QQPM); 5:1 for Counseling Psychology, and 4:1 for School Psychology. (E.E.
Burgess, Admission Administrator, personal communication, November 20, 2007). There
is no minimum for the department of Educational Psychology stated publicly. As the
number of applications increases the more selective the universities and colleges tend to
be in terms of cut scores for the GRE.
Schools also require the applicants to provide other information such as letters of
recommendation and a personal statement of goals. The letters of recommendations
receive high importance ratings to many graduate programs in psychology (Fauber,
2006). Applicants tend to choose individuals that they know will provide stellar
recommendations. Therefore, these measures are subjective in nature and may not
provide an accurate picture of the student’s success characteristics in graduate school.
Significance of study
Education is an important investment in one’s future. For the past two decades the
influx on nontraditional students into post secondary education has a dramatically
increased. These students are older and have many responsibilities outside of their
education. They take classes online, on weekends and evenings. They are aware of the
benefit that an education can give to them. They sacrifice a great deal in order to get the
education they know they need. They understand that in order to succeed in their chosen
profession they need further education (Beitler, 1997). This is one of the reasons that
older students return to school after a long absence. One of the major obstacles for
nontraditional students is the GRE which can be biased against these students (Murray,
1998). These students are often denied admission into graduate school based on scores
that may not be a true reflection of their ability to succeed in graduate school.
Design and Analysis
5
5
Need for Study
Research exploring the use of measures such as standardized examinations and
the UGPA to predict performance in graduate school is plentiful (Holt, Bleckmann &
Zitzmann 2006, Nelson & Nelson, 1995, Sacks, 1997, Sacks, 2003). Sacks (2003) stated
that the use of standardized tests “blinds us to what’s real about individual students and
their real-world skills, academic or otherwise” (p. 20). Unfortunately, despite the often-
reported shortcomings of these measures, there is relatively less research exploring
alternative selection practices for the nontraditional graduate program applicant. The
nontraditional student tends to be “achievement oriented, highly motivated, and relatively
independent” (Cross, 1980). Others describe them as “meta-motivated” and “goal
oriented” (Davis & Henry, 1997). Davis and Henry (1997) state nontraditional students
“have special needs and capacities that distinguish them from traditional students” (p. 3).
Failure to consider factors such as motivation and goal orientation could lead to the
exclusion of many potential nontraditional graduate students who could have been
successful. This is an area where the current research falls short. There is currently no
assessment available that students can take to demonstrate objectively to graduate
admissions committees the extent of motivation, interaction, cognition and execution they
possess. If these could be measured, admission into graduate school could be based on
multiple factors above and beyond the traditional cognitive methods alone.
The purpose of the study was to design and validate a tool called the Student
Strengths Index (SSI) to assess motivation, interaction, execution and cognition and
create a success profile of the nontraditional graduate student. Specifically, this study
addressed the following research questions:
Design and Analysis
6
6
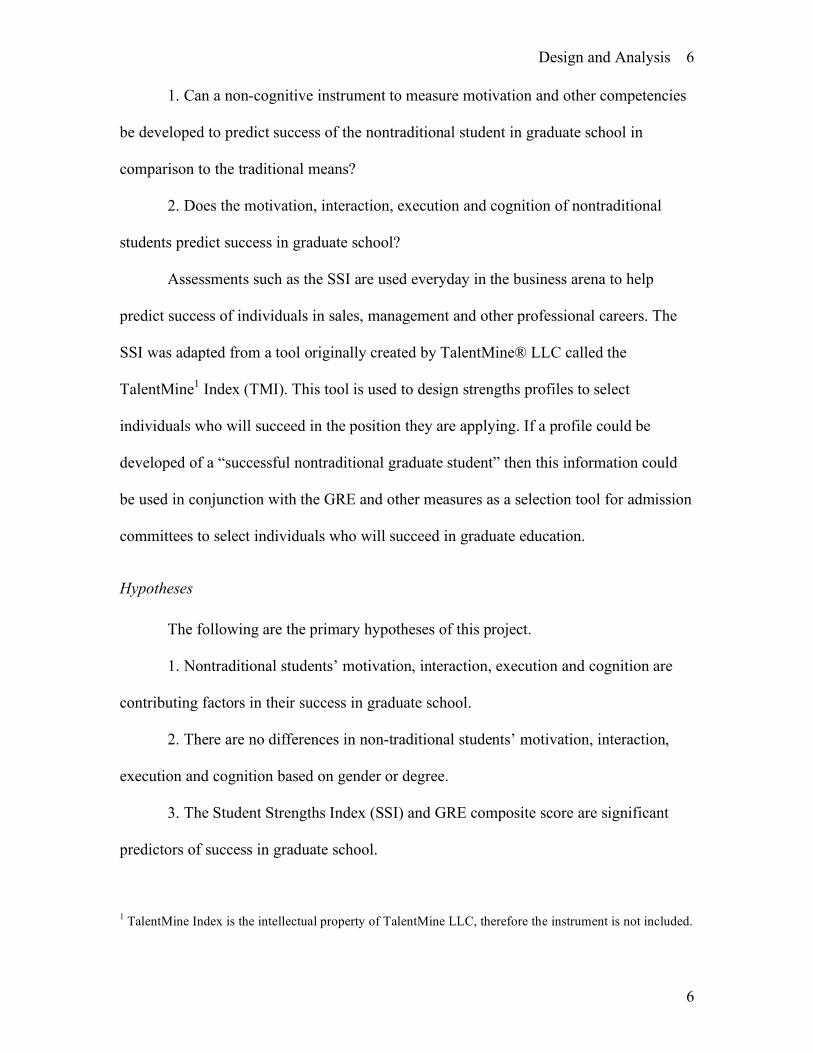
1. Can a non-cognitive instrument to measure motivation and other competencies
be developed to predict success of the nontraditional student in graduate school in
comparison to the traditional means?
2. Does the motivation, interaction, execution and cognition of nontraditional
students predict success in graduate school?
Assessments such as the SSI are used everyday in the business arena to help
predict success of individuals in sales, management and other professional careers. The
SSI was adapted from a tool originally created by TalentMine® LLC called the
TalentMine1 Index (TMI). This tool is used to design strengths profiles to select
individuals who will succeed in the position they are applying. If a profile could be
developed of a “successful nontraditional graduate student” then this information could
be used in conjunction with the GRE and other measures as a selection tool for admission
committees to select individuals who will succeed in graduate education.
Hypotheses
The following are the primary hypotheses of this project.
1. Nontraditional students’ motivation, interaction, execution and cognition are
contributing factors in their success in graduate school.
2. There are no differences in non-traditional students’ motivation, interaction,
execution and cognition based on gender or degree.
3. The Student Strengths Index (SSI) and GRE composite score are significant
predictors of success in graduate school.
1 TalentMine Index is the intellectual property of TalentMine LLC, therefore the instrument is not included.
Design and Analysis
7
7
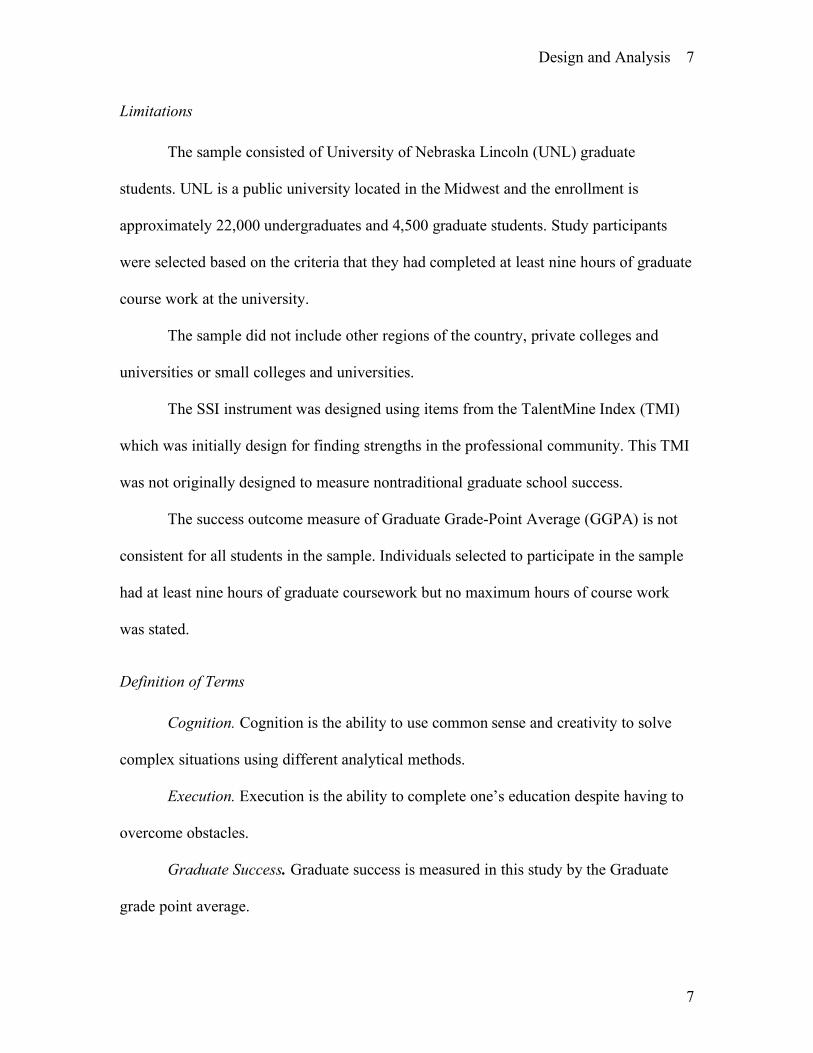
Limitations
The sample consisted of University of Nebraska Lincoln (UNL) graduate
students. UNL is a public university located in the Midwest and the enrollment is
approximately 22,000 undergraduates and 4,500 graduate students. Study participants
were selected based on the criteria that they had completed at least nine hours of graduate
course work at the university.
The sample did not include other regions of the country, private colleges and
universities or small colleges and universities.
The SSI instrument was designed using items from the TalentMine Index (TMI)
which was initially design for finding strengths in the professional community. This TMI
was not originally designed to measure nontraditional graduate school success.
The success outcome measure of Graduate Grade-Point Average (GGPA) is not
consistent for all students in the sample. Individuals selected to participate in the sample
had at least nine hours of graduate coursework but no maximum hours of course work
was stated.
Definition of Terms
Cognition. Cognition is the ability to use common sense and creativity to solve
complex situations using different analytical methods.
Execution. Execution is the ability to complete one’s education despite having to
overcome obstacles.
Graduate Success. Graduate success is measured in this study by the Graduate
grade point average.

Design and Analysis
8
8
Interaction. Interaction is the ability to work collaboratively with others as a
member of a team, the ability to communicate effectively and relate to others in a
professional manner.
Motivation. Motivation is the ability to pursue a goal for personal achievement.
The persistence to complete what one has started.
Nontraditional Student. The nontraditional graduate student is an individual who
has been removed from formal education for at least five years. Nontraditional students
also are individuals who are older than their traditional counterparts.
Nontraditional graduate students bring a set of strengths that is in addition to what
can be measured by a standardized cognitive test. These students are motivated to pursue
the education that is necessary to get the promotion or the new position because they
know that it is required. The aim of this study was to design an instrument to measure
these strengths to be used in conjunction with the traditional measures.
Literature Review
Graduate school admissions committees across the United States are faced with
the task of deciding who to admit into graduate school based on specific factors that
predict success. These factors include the traditional cognitive measures of the Graduate
Records Examination (GRE) and the Undergraduate Grade-Point Average (UGPA).
Sternberg and Williams (1997) examined the uses of the GRE to admit students to
graduate school. Some schools use the GRE score as a cut score before applicants are
even considered for admission (p. 631). Sternberg and Williams (1997) discussed an
unnamed school that separates the applications upon arrival by GRE score; “GRE Below
1200, 1200 to 1300, 1310 to 1400 and Above 1400” (p. 631). The first two categories are
rarely admitted or even reviewed, the last two are where the majority of students for the
Design and Analysis
9
9
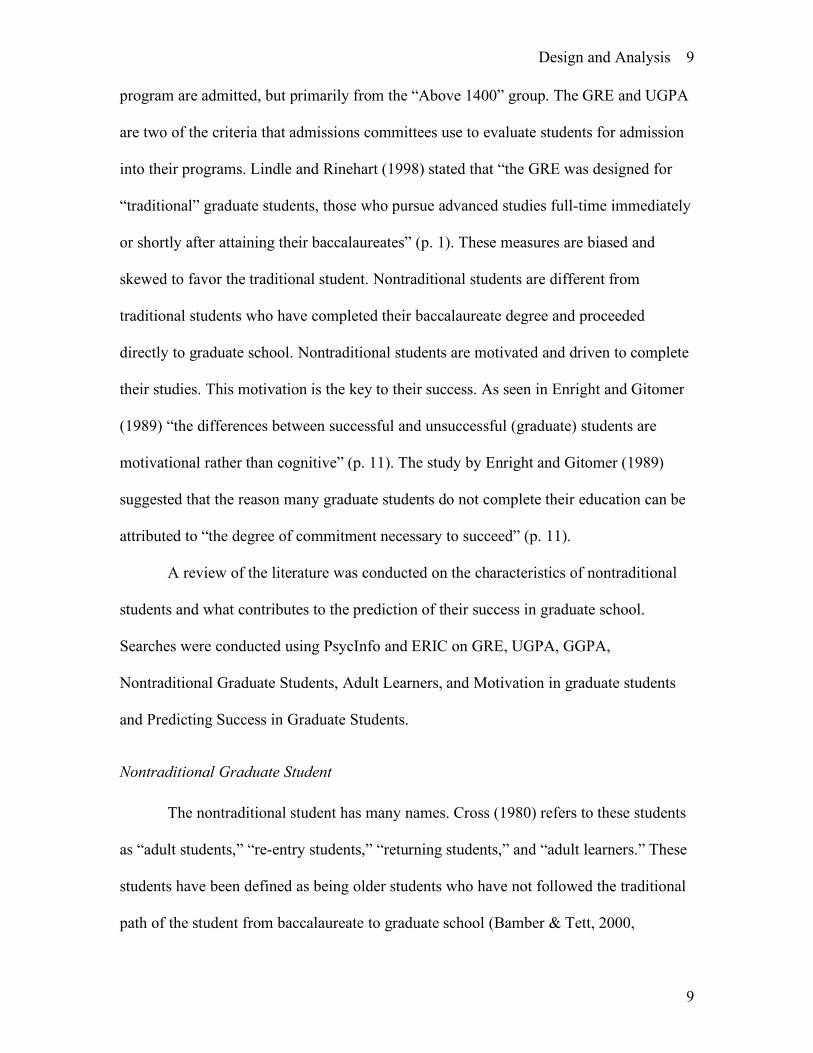
program are admitted, but primarily from the “Above 1400” group. The GRE and UGPA
are two of the criteria that admissions committees use to evaluate students for admission
into their programs. Lindle and Rinehart (1998) stated that “the GRE was designed for
“traditional” graduate students, those who pursue advanced studies full-time immediately
or shortly after attaining their baccalaureates” (p. 1). These measures are biased and
skewed to favor the traditional student. Nontraditional students are different from
traditional students who have completed their baccalaureate degree and proceeded
directly to graduate school. Nontraditional students are motivated and driven to complete
their studies. This motivation is the key to their success. As seen in Enright and Gitomer
(1989) “the differences between successful and unsuccessful (graduate) students are
motivational rather than cognitive” (p. 11). The study by Enright and Gitomer (1989)
suggested that the reason many graduate students do not complete their education can be
attributed to “the degree of commitment necessary to succeed” (p. 11).
A review of the literature was conducted on the characteristics of nontraditional
students and what contributes to the prediction of their success in graduate school.
Searches were conducted using PsycInfo and ERIC on GRE, UGPA, GGPA,
Nontraditional Graduate Students, Adult Learners, and Motivation in graduate students
and Predicting Success in Graduate Students.
Nontraditional Graduate Student
The nontraditional student has many names. Cross (1980) refers to these students
as “adult students,” “re-entry students,” “returning students,” and “adult learners.” These
students have been defined as being older students who have not followed the traditional
path of the student from baccalaureate to graduate school (Bamber & Tett, 2000,
Design and Analysis
10
10
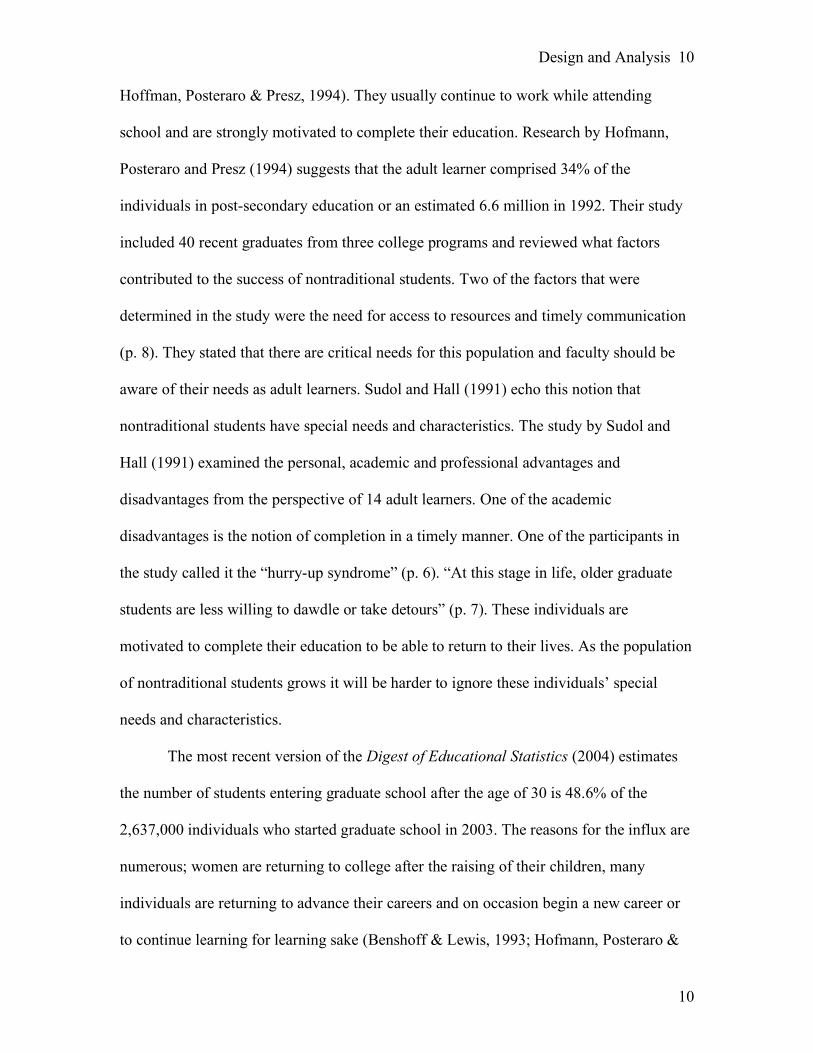
Hoffman, Posteraro & Presz, 1994). They usually continue to work while attending
school and are strongly motivated to complete their education. Research by Hofmann,
Posteraro and Presz (1994) suggests that the adult learner comprised 34% of the
individuals in post-secondary education or an estimated 6.6 million in 1992. Their study
included 40 recent graduates from three college programs and reviewed what factors
contributed to the success of nontraditional students. Two of the factors that were
determined in the study were the need for access to resources and timely communication
(p. 8). They stated that there are critical needs for this population and faculty should be
aware of their needs as adult learners. Sudol and Hall (1991) echo this notion that
nontraditional students have special needs and characteristics. The study by Sudol and
Hall (1991) examined the personal, academic and professional advantages and
disadvantages from the perspective of 14 adult learners. One of the academic
disadvantages is the notion of completion in a timely manner. One of the participants in
the study called it the “hurry-up syndrome” (p. 6). “At this stage in life, older graduate
students are less willing to dawdle or take detours” (p. 7). These individuals are
motivated to complete their education to be able to return to their lives. As the population
of nontraditional students grows it will be harder to ignore these individuals’ special
needs and characteristics.
The most recent version of the Digest of Educational Statistics (2004) estimates
the number of students entering graduate school after the age of 30 is 48.6% of the
2,637,000 individuals who started graduate school in 2003. The reasons for the influx are
numerous; women are returning to college after the raising of their children, many
individuals are returning to advance their careers and on occasion begin a new career or
to continue learning for learning sake (Benshoff & Lewis, 1993; Hofmann, Posteraro &

Design and Analysis
11
11
Presz, 1994, Sudol, 1991). The nontraditional student tends to be “achievement oriented,
highly motivated, and relatively independent” as described by Cross (1980) and other
authors describe them as “meta-motivated” and “goal oriented” (Davis & Henry, 1997).
Davis and Henry (1997) state that nontraditional students “have special needs and
capacities that distinguish them from traditional students.” They are faced with many
obstacles that they must overcome to return to school. “Whether they are successful or
not in that quest depends in large part upon their desire and commitment” (p. 2). The
study by Davis and Henry (1997), focused on the forces that influence the nontraditional
learner in an educational setting. The sample consisted of two groups of nontraditional
learners, the first group attended classes on campus and the second attended classes via
satellite locations. They used the Goal Orientation Index (GOI), and the Myers-Briggs
Type Indicator (MTBI) in order to examine the nontraditional students “goal orientation
style” and psychological type. They compared the differences of those nontraditional
learners who were participating in satellite education versus nontraditional students on
campus. There were significant differences in the GOI with respect to different
psychological types. Differences existed between extrovert and introvert on all the
categories on the GOI. The nontraditional distance learners were highly goal oriented as
well as extroverted.
In a study by Evans and Miller (1997), the characteristics of adult learners, based
on adult learner theory, were examined to see if there were differences in the
characteristics across the ages of graduate students. Ninety students were surveyed using
a tool that was developed from the basic concepts surrounding adult learning. The study
found that individuals motivation to learn changes as they age. Older individuals differed
significantly on the need to consolidate what they have learned before learning new

Design and Analysis
12
12
concepts. The results depicted differences in Education Administration students who
have the “want it now” mentality as well as the desire to only receive or learn information
that is pertinent to their needs (p. 13). This mentality could be attributed to future
professional position of the Education Administration students who upon graduation
become principals or superintendents. This study illustrated the persistence to goal for
nontraditional students.
In a qualitative study by Sudol and Hall (1991), 14 nontraditional students,
between the ages of 37 and 50, were interviewed about the process of succeeding in
graduate school. The findings suggested that these students have a sense of urgency. One
participant stated that he knew exactly what he wanted and was going to do just that
(Sudol & Hall, 1991, p. 6). With this type of motivation and drive the success of
nontraditional students could be tied to these attributes. To date no studies have been
conducted to understand the differences in motivation between nontraditional students
and traditional ones. Motivation could be the key to the success of nontraditional students
in graduate school.
Success Factors Beitler (1997) studied adults in self-directed graduate programs. He interviewed
learners from two self-directed graduate programs as well as program graduates. From
the analysis of the interviews he concluded “that there are basically three motivations for
adults to enroll in formal education programs: (1) learning for career advancement or
training needs, (2) learning for interpersonal effectiveness, and (3) learning for the sake
of learning” (pp. 8-9). Beitler (1997) further suggested that these motivations would be
different for young adults because of their lack of knowledge in the subject matter. This
Design and Analysis
13
13
study suggested that older students are motivated differently to pursue their education
then their younger counterparts. Enright and Gitomer (1989) interviewed faculty
regarding building a description of a successful graduate student. This description
included the development of seven competencies. The competencies in alphabetical order
are: communication, creativity, explanation, motivation, planning, professionalism and
synthesis. These seven competencies are contained within the SSI.
Ingram, Cope, Harju and Wuensch (2000) examined the theory of planned
behavior in respect to applying to graduate school. They sought to explain why some
individuals choose to start a career versus enter graduate school. The theory of planned
behavior can be used to increase the understanding of why students applied to graduate
school. This study suggested that there are internal motivations that affect an individual’s
decision to enter graduate school. This behavior was determined by the “individual’s
salient belief about whether or not that behavior leads to some value outcome” (p. 216).
In other words, an individual’s motivation to enter graduate school is based on the
perceived benefit of an education. For many nontraditional students the reasons for
attending graduate school are for career advancement in their present jobs. The
motivation to succeed is attached to a tangible goal of promotion or the possibility of a
higher paying job.
Success in Graduate School
Defining Success Graduate grade-point average (GGPA) and graduation have both been used to
define success in graduate school. Several studies included in this literature review
examined both of these success indicators; they are not always viewed as separate.
Design and Analysis
14
14
Hoffman, Posteraro and Presz (1994) studied individuals who had graduated from the
Weekend College, the Women’s College and the Graduate school. Their measurement of
success was graduation. Nelson and Nelson (1995) used graduation as the measurement
of success as well. Holt, Bleckmann and Zitzmann (2006) examined the predictive
validity of the GRE as compared to the GGPA. They found that the GRE did not account
for the variation in GGPA (R2 = .01, p > .05). They suggested that the GGPA measure
may not be one of mastery but the student’s impression on the instructor. Nelson, Nelson
and Malone (2000), created a variable that included just the first nine hours of the GGPA
and combined it with the graduated and not graduated criterion to measure the success of
at-risk students. The study suggested that there are no factors when viewed alone that can
be used to predict success in graduate school. It is necessary to view multiple factors to
make the best decisions in the acceptance of applicants to graduate school.
Predicting Success
GRE
Nontraditional students are being judged for admission to graduate school using
the same criteria as traditional students. Little information exists as to the predictive
validity of the GRE for this population of nontraditional students. The question of
predictive validity of this instrument in discussed in the following section. The GRE is
used by most universities and colleges as a cognitive measure to predict success in
graduate school. A five-year study by Wilmore and McNeil (2002) looked at the
predictive validity of GRE, race, gender and UGPA for state certification examination
results. Using logistic regression they generated a model that included gender, race, and
GRE to predict success. The model classified 90.0% of the observations correctly.
Females score 2.3 units higher than males, whites score 2.5 units higher compared to

Design and Analysis
15
15
non-whites on the state certification examination. The score on the state certification
examination increases by .02 units for each additional GRE point. Their findings
indicated that the GRE is only one factor that influences success in state examination (p.
7). House (1998) found that the “GRE-total scores significantly under-predicted the
graduate GPA of the older students (mean error = 0.014) and over-predicted the graduate
GPA of the younger students (mean error = 0.044)” (p. 381). Since the description of the
nontraditional student is one that is older and comprised of a majority of women (Digest
of Educational Statistics, 2004) this would lend evidence that the GRE is not a good
predictor for an older student population.
Mupinga and Mupinga (2005) examined the perception of the use of the GRE in
the prediction of success in International students in a qualitative study. The international
students stated that the GRE verbal section was culturally biased and did not measure
their ability to perform in graduate school (p. 5). The GRE is perceived as biased by
International students (Mupinga & Mupinga, 2005) and studies like the ones conducted
by House (1989) illuminated the non-predictive ability of the GRE in older students.
GRE Validity
The predictive validity of GRE is questionable (Bean, 1975; Goldberg & Alliger,
1992; Morrison & Morrison, 1995). Morrison and Morrison (1995) conducted a meta-
analysis of 22 studies with an N of 5,186 and publication dates ranged from 1955 to
1992. Morrison and Morrison (1995) found that GRE was not a useful predictor of
GGPA. The amount of variance accounted for was “virtually useless from a prediction
standpoint” (p. 314). They questioned the continued use of this tool as a valid measure of
ability to succeed in graduate studies. Goldberg and Alliger (1992) conducted a meta-
Design and Analysis
16
16
analysis of the predictive validity of the GRE. They included 10 studies that produced the
data for the meta-analysis and found that the mean correlation was .15 for the relationship
between GGPA and the GRE. Their findings were similar to Morrison and Morrison
(1995), where the GRE accounted for less than 9% of the variance in GGPA. Goldberg
and Alliger (1992) along with Morrison and Morrison (1995) contend that after reviewing
the literature GRE is not a valid predictor of graduate school success. In a more recent
meta-analysis conducted by Kuncel, Henzlett and Ones (2001) 1,521 studies were
examined. The correlations between GGPA and the GRE-V and GRE-Q were .23 and .21
respectively. They concluded that the GRE was a valid predictor of success.
Nelson and Nelson (1995) studied the predictors of students who enter graduate
school on a probationary basis. They looked at the first nine hours of GGPA, GRE scores
and final GGPA. They concluded that for these students, a combination of GRE
Analytical score, GRE quantitative score and nine-hour GGPA was a good predictor of
success (graduation). The regularly admitted students’ prediction equation only included
GRE verbal scores and the nine-hour GGPA. The prediction equation correctly predicted
graduation over 90% of the time. The differences in the two equations indicate that other
factors must be examined to consider acceptance to graduate school.
UGPA
Along with the GRE, the student’s UGPA is traditionally used as a criterion to
predict a graduate school applicants’ ability to be successful in graduate school. Malone,
Nelson and Nelson (2000) examined the success rate of at-risk graduate students. They
examined GRE scores, GGPA, UGPA, age, gender, academic area of study, and type of
institution from which the baccalaureate degree was earned. The regression analysis
Design and Analysis
17
17
yielded two models for predicting success in this population. The first predictor variable
was GRE verbal scores and this was multiplied by either UGPA or GGPA. The product
of these variables predicted success as measured by completion of the degree 71% of the
time. Holt, Bleckmann and Zitzmann (2006) examined UGPA, first year GGPA and the
GRE to predict success in an Engineering Management Program. They found that UGPA
and first-year GGPA were significantly correlated but the UGPA did not account for
significant variability in the overall model (R2 = .01, p >.05). The GRE Verbal scores and
the GRE Quantitative scores accounted for the most variability in the students’ grades
over UGPA. The UGPA as with the GRE scores have many problems that have been
examined by many different studies. The goal of the GRE is to be a predictive measure of
individuals in graduate school, however this is not the case as is evident from the research
reviewed.
Strength Dimensions
The TalentMine Index (TMI) was developed in 2003 using qualitative and
quantitative methods to measure the talents required for success in various professions.
TalentMine conducted interviews and focus groups with stakeholders to determine what
activities and behaviors lead to excellence. TalentMine identified 16 dimensions as being
vital to the success of individuals in different roles as a professional (TalentMine Tech
Report, 2003, p. 3). The 16 dimensions are achievement, expectation, persistence,
developer, initiator, relator, service, team, analytical, common sense, problem solver,
courage, direction, responsibility, safety and structure. The talent dimensions are
combined into four broader categories: Motivation, Interaction, Cognition and Execution.
On the final instrument 125 statements consisting of 75 strengths and 50 interests/culture

Design and Analysis
18
18
statements were retained (TalentMine Tech Report, 2003, p. 6). The majority of the
questions on the TMI are general in nature; however, they were not designed specifically
to measure the ability of the nontraditional student in graduate education. Twelve
questions were initially removed from the 125 as the content of the questions was not
pertinent to the graduate student population.
The same qualities that an individual uses to succeed in a business profession are
seen in education as well. In a study by Enright and Gitomer (1989) they defined seven
competencies: communication, creativity, explanation, motivation, planning,
professionalism and synthesis. All of these competencies identified by Enright and
Gitomer are addressed in the TMI. In their discussion of what defines graduate education,
they discuss the notion that “graduate training can be viewed as a process of academic
socialization” (p. 4). Graduate studies are described as an apprenticeship (Enright &
Gitomer, 1989, p. 11). “Success in graduate school is seen to be on a continuum with
professional success, so that precocity in exhibiting behavior like that of a professional is
considered to be a highly favorable sign. Hence, graduate school can be viewed as a work
sample in which development as a student is equated with increasing approximation to
professional behavior” ( Enright & Gitomer, 1989, p. 4). Individuals who seek to be
graduate students are seeking to become professionals. Sacks (2001) suggested that a new
system of selection should be devised. This system would focus “on qualities of
applicants that might predict actual performance in the jobs of scientists, doctors and
lawyers” (p. 2). The SSI sets out to do just this in the prediction of nontraditional
students.
The first category of Motivation includes the dimensions of achievement,
expectation and persistence. Kuncel, Hezlett and Ones (2001) explained that “personality

Design and Analysis
19
19
and interest characteristics may predict the persistence and drive needed to complete a
graduate program” (p. 176).
The second category of Interaction includes dimensions of developer, initiator,
relator, service and team. The competencies of communication and planning are
addressed by these dimensions. Enright and Gitomer (1989) describe communication as
“the ability to share one’s ideas, knowledge and insights with others. The goal of
communication forces individuals to organize and apply numerous skills” (p. 10).
Communication is also the ability to work with others towards a common goal. In
graduate studies the ability to collaborate as a team occurs in many classes.
The third category is Cognition; it includes analytical, common sense and
problem solver. These dimensions represent the competencies of explanation and
creativity. Explanation is defined as “the giving of a reason or cause for some
phenomenon or finding” (Enright & Gitomer, 1989, p. 10). The development of this skill
requires reasoning skills (Enright & Gitomer, 1989, p. 11). The ability to use analytical
skills to reason through a problem using common sense to solve a problem will make an
individual successful. Creativity is defined by Enright and Gitomer as the “ability to
produce an unusual number of ideas or to generate novel ideas.” They further define
creativity to include “intellectual playfulness or rebelliousness” (p. 10). The faculty in the
Enright and Gitomer study stated that critical to success is the notion of creativity and
motivation.
The fourth category on the TMI is Execution; it includes dimensions of courage,
direction, responsibility, safety and structure. In the study by Sudol and Hall (1991) they
discuss the courage to leave one’s job for education but also the fear of the responsibility
to others. One student stated “I know exactly what I want to do and I do it” (p. 6). Davis

Design and Analysis
20
20
and Henry (1997) discuss that individual’s successes are based on their desire and
commitment to complete their education (p. 2).
The prediction of performance in graduate education is not going away.
Individuals continue to apply to higher education to obtain an education they perceive as
necessary. Sacks (1997) suggested that the use of the GRE and other standardized test are
limiting the number of qualified individuals into graduate education. If the prediction
could be improved using a non-cognitive tool in conjunction with the traditional means of
the GRE then it could allow for more individuals to have access to graduate education.
Summary
The literature regarding predicting success of non-traditional graduate students
revolves around using traditional quantitative measures such as GRE and UGPA. Two of
the studies that were examined included meta-analyses of previous studies using these
tools. There is much debate over the validity of GRE as a predictor of success in
different populations as well as graduate students as a whole. The use of GRE is wide-
spread in the graduate community even though the majority of the research suggests that
it only accounts for about 7% of the variance in the performance indicators of GGPA and
graduation rates. The review of the literature has illuminated the need for a better tool to
predict success in graduate school.
One of the deficiencies in the literature is a study of the differences in motivation
of non-traditional students compared to traditional graduate students. Motivation could
be seen as the key to the success of the non-traditional graduate student population.
Another deficiency is an examination of why non-traditional students succeed where
there counterparts fail. Not every non-traditional student graduates but a study of the
attrition rates for these students could be examined.

Design and Analysis
21
21
Research Questions/Objectives
Is motivation the key to success in graduate school? Do non-traditional students
possess certain strengths that help them succeed in higher education? In research, it has
been shown that the GRE is a fair predictor of success for non-traditional students; can a
valid tool be developed to be a predictor of success using motivation, interaction,
execution and cognition as domains of the emotional quotient? Can the SSI and the GRE
be used together to predict success in graduate school?

Design and Analysis
22
22
II. Methods
Sample
The target population for this study was nontraditional students enrolled in
graduate education. Nontraditional students were defined as individuals who have taken
off at least five years between their baccalaureate degree and the beginning of their
graduate education. An a priori power analysis was performed using a power of .80. A
sample size of 128 was needed to detect an effect size of 0.25. This was done using
GPower 3.0.3 (Faul, Erdfelder, Lang, & Buchner, 2007). No previous studies reported
using a higher or lower effect size measure; therefore a medium effect size was chosen.
The sample was selected from the University of Nebraska-Lincoln (UNL)
graduate student population from a list of graduate students provided by the University of
Nebraska-Lincoln graduate studies office. A sample of 1,740 individuals were initially
sent an invitation to participate. This included both nontraditional and traditional students
combined. There was no way to identify just the nontraditional students as this is not a
variable that is collected by the university. The following criteria were used to select the
individuals to participate in the study: (1) current University of Nebraska-Lincoln
graduate students, and (2), completion of at least nine hours of graduate course work. The
students were contacted with an initial email (Appendix A) and a follow-up email
(Appendix B) six days later if they had not responded. After the initial email, 27
respondents declined to participate and 28 emails were undeliverable. The total N after
removing these was 1,685. The survey was administered electronically via
http://surveymonkey.com. The participants were asked to electronically sign the informed
consent in order to participate (Appendix C). The response rate was 40%. Because
participation was voluntary, although the entire graduate student population was invited

Design and Analysis
23
23
to participate, the respondents to the survey could be considered a convenience sample.
Thus the individuals who responded to the survey are characteristic of graduate students
at similar universities across the country.
Instrument
The TalentMine Index (TMI) was developed in 2003 using a mixed-method
approach to identify and measure talents required for success in different professional
communities. The instrument contains 125 statements – 75 strengths statements and 50
interests and culture statements. The statements are asked on a seven-point Likert scale.
The Student Strengths Index (SSI) contains 113 questions taken from the TMI
that were asked on a seven-point Likert scale. Twelve items were removed based on
content before the instrument was administered. The 113 questions relate to the same
categories as the original instrument. A reliability analysis was performed to determine
how specific questions affected the reliability of the overall instrument. The items that
were affecting the reliability were examined for content to find if they could be removed
without affecting the content coverage of the overall survey. This primary analysis was
done to build a precise instrument to only include items that help predict success in
graduate education as measured by graduate grade-point average (GGPA). The
correlations were examined to preserve the items that had the strongest positive
correlation with the GGPA. A total score was computed to include all the remaining
items. A reliability analysis using coefficient alpha was completed to examine the
consistency of the final instrument with items removed.
At the item level the preliminary analysis included running descriptive statistics
of all items contained in the survey. At the category level, the survey contained the four
main categories: motivation, cognition, interaction and execution. Past research with
Design and Analysis
24
24
these items suggests that the reliability at the category level was not always above the .70
mark. In fact, the category reliability ranged from .35 to .50 which is low (TalentMine
Tech Report, 2003). In this study the reliability of each category was evaluated to see if
there was sufficient reliability within the category level.
Variables
The scores from the Graduate Records Exam (GRE) were collected from the UNL
Graduate Studies office. The scores are divided into Verbal, Quantitative and Analytical
writing as well as a GRE composite score.
Graduate grade-point average (GGPA) was collected from the UNL graduate
records office. The GGPA was based on the number of hours completed in the program
(minimum of 9 hours).
When the data collection time of four weeks was closed 660 students had
completed the survey, 161 nontraditional graduate students and 499 traditional graduate
students. The Student Strengths Index (SSI) was computed for each nontraditional
graduate student’s responses to the 113 question instrument. The SSI is a composite score
that include all items equally with no weighting for the different dimensions.
Statistical Methods
The analysis was completed using SPSS for Windows 15.0. The significance or
alpha level for all analyses was a .05.
In the development of the SSI it was important to address the validity and
reliability of the instrument. Pearson product-moment correlations were computed to
provide evidence of convergent and discriminant validity of the SSI. A reliability analysis
using coefficient alpha of the dimensions, categories and the total instrument was
Design and Analysis
25
25
conducted. The reliability analysis is a measure of internal consistency and determines if
individuals are responding consistently across items. The original analysis on the 125
item TMI instrument produced a coefficient alpha of .94, which is acceptably high
(TalentMine Tech Report, 2003).
The instrument was designed to contain four critical factors that explain the latent
variable of success in graduate school. An exploratory factor analysis (EFA) was
conducted to determine the existence of a latent trait of success. The instrument was
analyzed at the item level to determine if the items designed for the 16 dimensions
cohesively report into those dimensions. The next step was to determine if the dimensions
funneled into the four categories. Since the four factors were correlated an oblique
rotation were used. Finally, the four categories were examined to determine if they
support the theory of one latent trait.
A MANOVA was conducted to examine the differences of nontraditional students
on the categories of the SSI based on gender and type of degree. A separate 2 x 2
ANOVA was completed to examine the differences on the SSI based on gender and type
of degree.
A composite variable, SSI, was created for each person in the sample by
computing the sum of each individual’s item scores. This score was based on the 113
items retained from the original 125 item TMI instrument.
The last step in the analysis was to determine if the SSI and the GRE composite
score account for significant variance in the graduate grade-point average. A multiple
regression was used to examine this prediction using the two variables of GRE composite
score and SSI.
Pilot Study
Design and Analysis
26
26
The pilot study was completed using non-probability sampling using specifically
convenience sampling. These individuals were enrolled in the Education 900D spring
semester class. The individuals who were selected are graduate students at the University
of Nebraska Lincoln. All individuals from the class are being asked to participate in the
study; however information will be gathered in the invitation that will provide
information to the researcher as to whether their survey will be included in the study. If
the students do not meet the criteria of non-traditional students as defined above they will
be excluded. The changes made based on the pilot survey were to include a note as to the
length of time to complete the survey. The survey was also changed to have four
questions per webpage in order to speed up the survey.

Design and Analysis
27
27
III. Appendix IRB Form References Survey Cover Letter and Questionnaire Item Abstract Table Proposed Budget
Design and Analysis
28
28
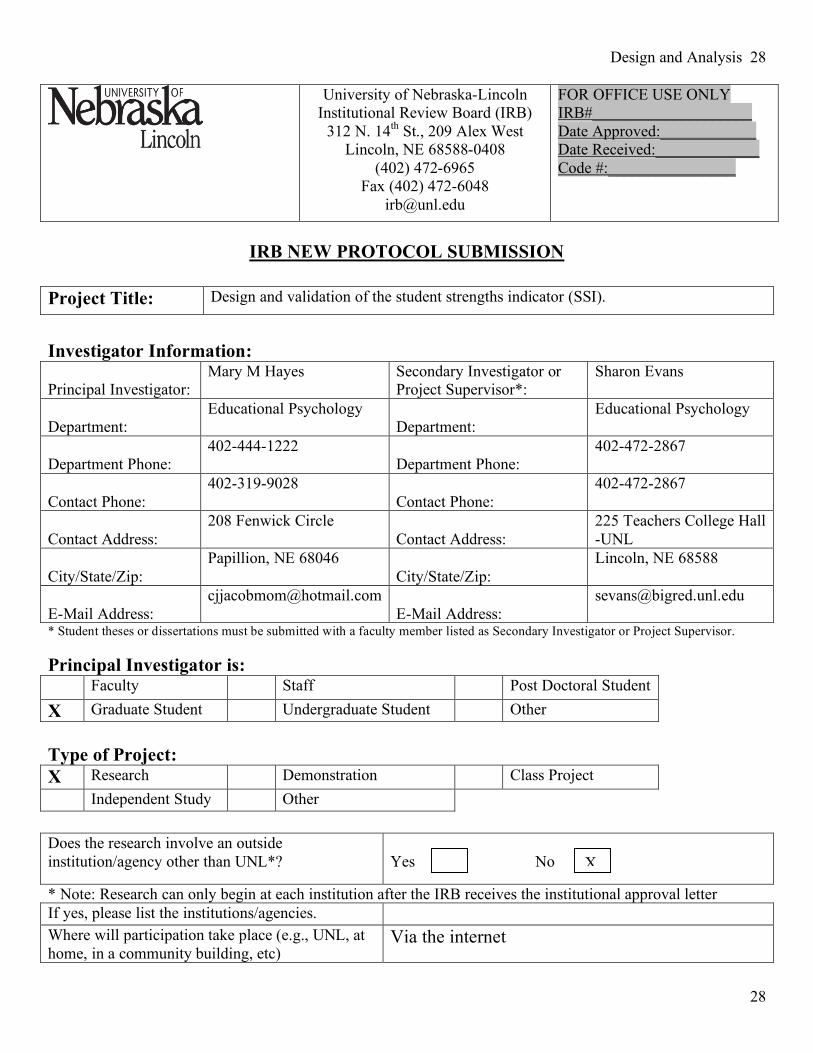
University of Nebraska-Lincoln Institutional Review Board (IRB)
312 N. 14th St., 209 Alex West Lincoln, NE 68588-0408
(402) 472-6965 Fax (402) 472-6048
FOR OFFICE USE ONLY IRB#____________________ Date Approved:____________ Date Received:_____________ Code #:________________
IRB NEW PROTOCOL SUBMISSION
Project Title: Design and validation of the student strengths indicator (SSI).
Investigator Information: Principal Investigator:
Mary M Hayes Secondary Investigator or Project Supervisor*:
Sharon Evans
Department:
Educational Psychology Department:
Educational Psychology
Department Phone:
402-444-1222 Department Phone:
402-472-2867
Contact Phone:
402-319-9028 Contact Phone:
402-472-2867
Contact Address:
208 Fenwick Circle Contact Address:
225 Teachers College Hall -UNL
City/State/Zip:
Papillion, NE 68046 City/State/Zip:
Lincoln, NE 68588
E-Mail Address:
[email protected] E-Mail Address:
* Student theses or dissertations must be submitted with a faculty member listed as Secondary Investigator or Project Supervisor. Principal Investigator is: Faculty Staff Post Doctoral Student
X Graduate Student Undergraduate Student Other Type of Project: X Research Demonstration Class Project
Independent Study Other Does the research involve an outside institution/agency other than UNL*?
Yes No
* Note: Research can only begin at each institution after the IRB receives the institutional approval letter If yes, please list the institutions/agencies. Where will participation take place (e.g., UNL, at home, in a community building, etc)
Via the internet
X
Design and Analysis
29
29
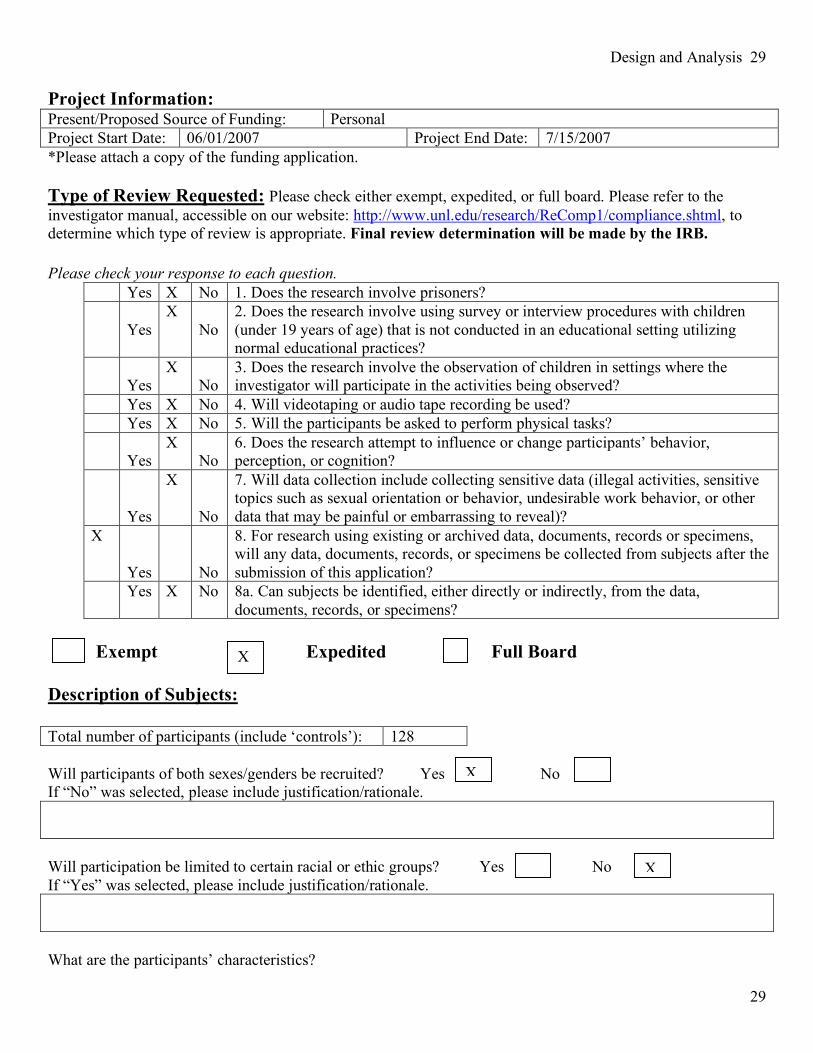
Project Information: Present/Proposed Source of Funding: Personal Project Start Date: 06/01/2007 Project End Date: 7/15/2007 *Please attach a copy of the funding application. Type of Review Requested: Please check either exempt, expedited, or full board. Please refer to the investigator manual, accessible on our website: http://www.unl.edu/research/ReComp1/compliance.shtml, to determine which type of review is appropriate. Final review determination will be made by the IRB. Please check your response to each question.
Yes X No 1. Does the research involve prisoners?
Yes X
No 2. Does the research involve using survey or interview procedures with children (under 19 years of age) that is not conducted in an educational setting utilizing normal educational practices?
Yes
X No
3. Does the research involve the observation of children in settings where the investigator will participate in the activities being observed?
Yes X No 4. Will videotaping or audio tape recording be used? Yes X No 5. Will the participants be asked to perform physical tasks?
Yes X
No 6. Does the research attempt to influence or change participants’ behavior, perception, or cognition?
Yes
X No
7. Will data collection include collecting sensitive data (illegal activities, sensitive topics such as sexual orientation or behavior, undesirable work behavior, or other data that may be painful or embarrassing to reveal)?
X Yes
No
8. For research using existing or archived data, documents, records or specimens, will any data, documents, records, or specimens be collected from subjects after the submission of this application?
Yes X No 8a. Can subjects be identified, either directly or indirectly, from the data, documents, records, or specimens?
Exempt Expedited Full Board
Description of Subjects: Total number of participants (include ‘controls’): 128 Will participants of both sexes/genders be recruited? Yes No If “No” was selected, please include justification/rationale. Will participation be limited to certain racial or ethic groups? Yes No If “Yes” was selected, please include justification/rationale. What are the participants’ characteristics?
X
X
X

Design and Analysis
30
30
The individuals selected will be non-traditional graduate students. The non-traditional graduate student is someone who took time off between undergraduate education and post graduate education. Type of Participant: (Check all appropriate blanks for participant population) Adults, Non Students Pregnant Women Persons with Psychological
Impairment X UNL Students Fetuses Persons with Neurological
Impairment Minors (under age 19) Persons with Limited Civil Freedom Persons with Mental
Retardation Victims Adults with Legal Representatives Persons with HIV/AIDS Other (Explain): Special Considerations: Yes No If yes, please check all appropriate blanks below. Audio taping Videotaping X Archival/Secondary Data Analysis Genetic Data/Samples Photography X Web-based
research Biological Samples Protected Health
Information
Project Personnel List: Please list the names of all personnel working on this project, starting with the principal investigator and the secondary investigator/project advisor. Research assistants, students, data entry staff and other research project staff should also be included. For a complete explanation of training and project staff please go to http://www.unl.edu/research/ReComp1/compliance.shtml Name of Individual: Project Role: UNL Status* Involved in Project
Design/Supervision? Yes/No
Collect Data? Yes/No
Mary Hayes Principal Investigator
Graduate Student Yes Yes
Sharon Evans Project Advisor Faculty Yes No *Faculty, Staff, Graduate Student, Undergraduate Student, Unaffiliated, Other Required Signatures:
X
Design and Analysis
31
31
Principal Investigator: Date: Secondary Investigator/Project Advisor:
Date:
Unit Review Committee:
Date:
Design and Analysis
32
32
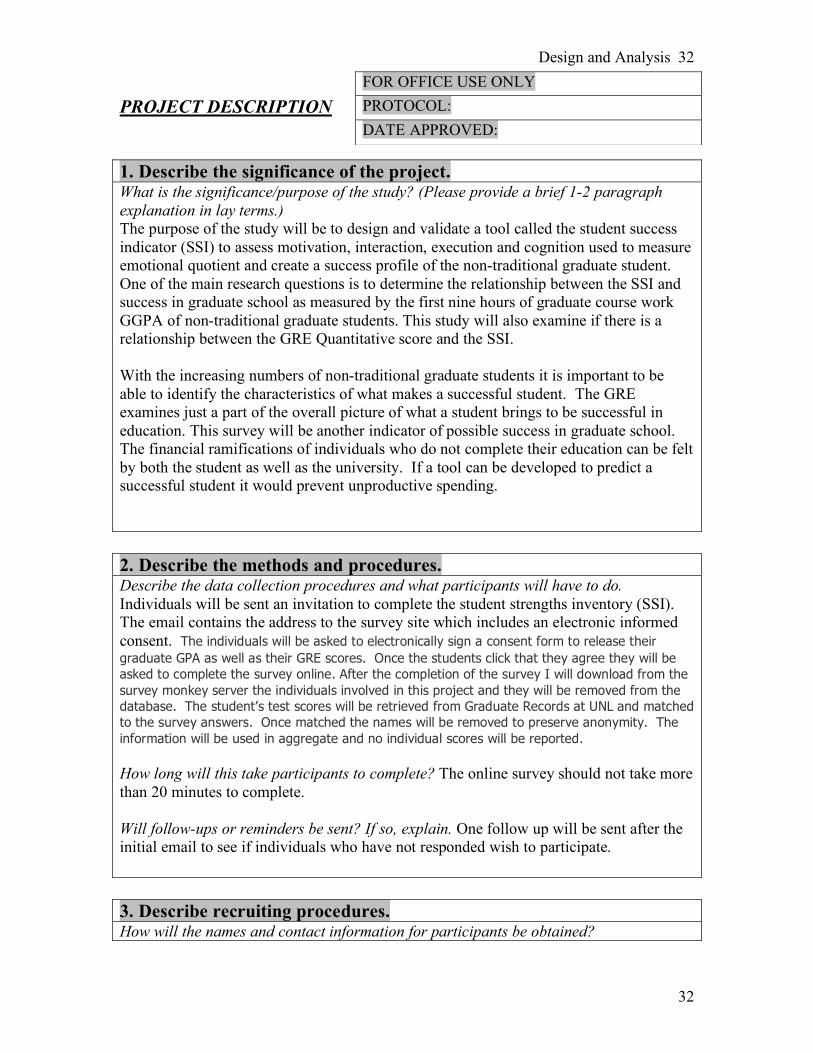
PROJECT DESCRIPTION 1. Describe the significance of the project. What is the significance/purpose of the study? (Please provide a brief 1-2 paragraph explanation in lay terms.) The purpose of the study will be to design and validate a tool called the student success indicator (SSI) to assess motivation, interaction, execution and cognition used to measure emotional quotient and create a success profile of the non-traditional graduate student. One of the main research questions is to determine the relationship between the SSI and success in graduate school as measured by the first nine hours of graduate course work GGPA of non-traditional graduate students. This study will also examine if there is a relationship between the GRE Quantitative score and the SSI. With the increasing numbers of non-traditional graduate students it is important to be able to identify the characteristics of what makes a successful student. The GRE examines just a part of the overall picture of what a student brings to be successful in education. This survey will be another indicator of possible success in graduate school. The financial ramifications of individuals who do not complete their education can be felt by both the student as well as the university. If a tool can be developed to predict a successful student it would prevent unproductive spending. 2. Describe the methods and procedures. Describe the data collection procedures and what participants will have to do. Individuals will be sent an invitation to complete the student strengths inventory (SSI). The email contains the address to the survey site which includes an electronic informed consent. The individuals will be asked to electronically sign a consent form to release their graduate GPA as well as their GRE scores. Once the students click that they agree they will be asked to complete the survey online. After the completion of the survey I will download from the survey monkey server the individuals involved in this project and they will be removed from the database. The student’s test scores will be retrieved from Graduate Records at UNL and matched to the survey answers. Once matched the names will be removed to preserve anonymity. The information will be used in aggregate and no individual scores will be reported. How long will this take participants to complete? The online survey should not take more than 20 minutes to complete. Will follow-ups or reminders be sent? If so, explain. One follow up will be sent after the initial email to see if individuals who have not responded wish to participate. 3. Describe recruiting procedures. How will the names and contact information for participants be obtained?
FOR OFFICE USE ONLY PROTOCOL: DATE APPROVED:

Design and Analysis
33
33
Individuals will be selected based on their graduate status. The information will be obtained from the Graduate Records office. Also individuals from the distance education classes will be solicited to see if they would like to participate. How will participants be approached about participating in the study? Individuals will be sent an email asking them to participate in the study. **Please submit copies of recruitment flyers, ads, phone scripts, emails, etc. 4. Describe Benefits and Risks. Explain the benefits to participants or to others. The use of an additional tool to predict success in graduate school would be beneficial to many. The cost of graduate education to the individual as well as the university is overwhelming. If a tool could be developed to help determine who is most likely to complete their education it could potentially save the university a great deal of time and money. Explain the risks to participants. What will be done to minimize the risks? If there are no known risks, this should be stated. There are no known risks to the participants. 5. Describe Compensation. Will compensation be provided to participants? Yes No If ‘Yes’, please describe amount and type of compensation, including money, gift certificates, extra credit, etc.
6. Informed Consent How will informed consent/assent be obtained? The informed consent is obtained electronically via the survey site. If the individuals click “I agree” then they will proceed to the survey. **Please attach copies of informed consent forms, emails, and/or letters. Please refer to the last page for a checklist of the information that needs to be included in the informed consent document.
X
Design and Analysis
34
34
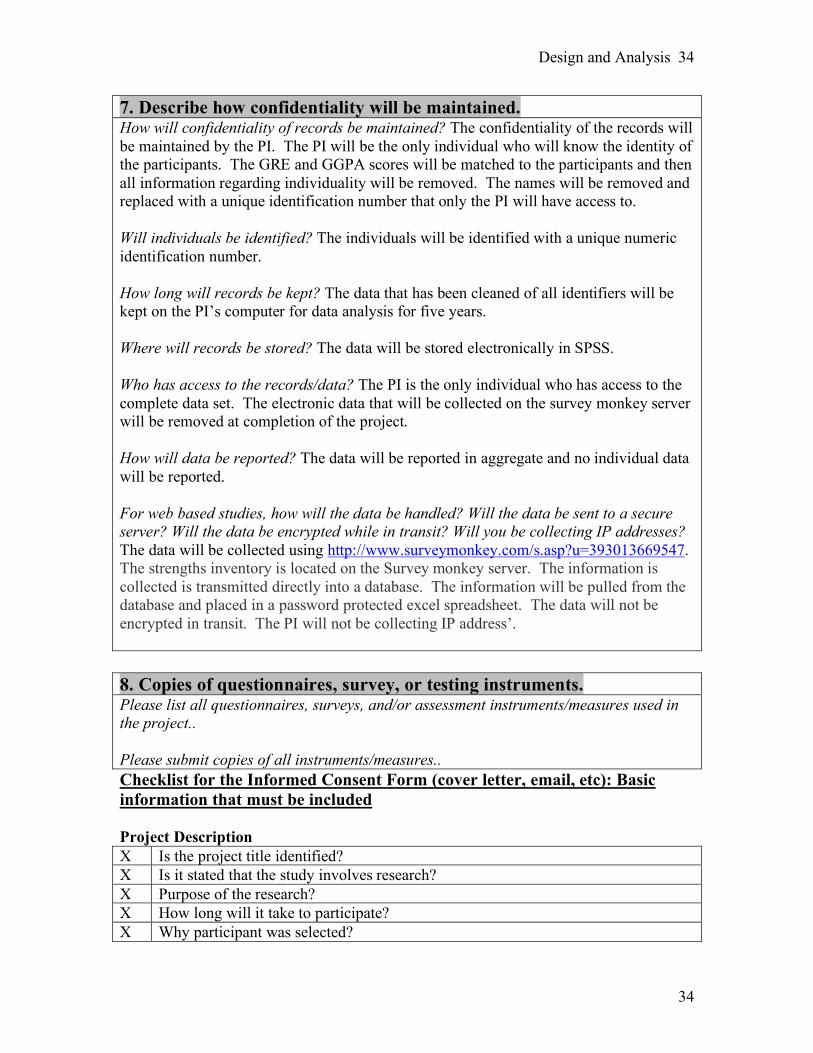
7. Describe how confidentiality will be maintained. How will confidentiality of records be maintained? The confidentiality of the records will be maintained by the PI. The PI will be the only individual who will know the identity of the participants. The GRE and GGPA scores will be matched to the participants and then all information regarding individuality will be removed. The names will be removed and replaced with a unique identification number that only the PI will have access to. Will individuals be identified? The individuals will be identified with a unique numeric identification number. How long will records be kept? The data that has been cleaned of all identifiers will be kept on the PI’s computer for data analysis for five years. Where will records be stored? The data will be stored electronically in SPSS. Who has access to the records/data? The PI is the only individual who has access to the complete data set. The electronic data that will be collected on the survey monkey server will be removed at completion of the project. How will data be reported? The data will be reported in aggregate and no individual data will be reported. For web based studies, how will the data be handled? Will the data be sent to a secure server? Will the data be encrypted while in transit? Will you be collecting IP addresses? The data will be collected using http://www.surveymonkey.com/s.asp?u=393013669547. The strengths inventory is located on the Survey monkey server. The information is collected is transmitted directly into a database. The information will be pulled from the database and placed in a password protected excel spreadsheet. The data will not be encrypted in transit. The PI will not be collecting IP address’. 8. Copies of questionnaires, survey, or testing instruments. Please list all questionnaires, surveys, and/or assessment instruments/measures used in the project.. Please submit copies of all instruments/measures.. Checklist for the Informed Consent Form (cover letter, email, etc): Basic information that must be included Project Description X Is the project title identified? X Is it stated that the study involves research? X Purpose of the research? X How long will it take to participate? X Why participant was selected?

Design and Analysis
35
35
X Is the age of participant stated (under 19 needs parental consent)? X Are procedures described? X Where will it take place? X Are experimental procedures identified? (include if applicable) Risks, Benefits, and Alternatives X Are risks and discomforts to participants explained? If no risks, does it say no
known risks? X If there are risks, what will be done to minimize the risks? Referrals? X Are benefits to participants and to others that might be expected from the research
explained? X Are alternative procedures or course of treatment that might be advantageous to the
participant identified? X If the study offers course credit, are alternative ways to earn the credit explained? Confidentiality X Will confidentiality of records identifying participant be maintained? X How will data be reported: scientific journal, professional meeting, aggregated
data? Compensation X Is compensation offered? X Are medical treatments available if injury occurs? X Who will pay for treatments (participant or department)? X What conditions would exclude participant from participating? Right to Ask Questions X Is it stated that participants have a right to ask questions and to have those
questions answered? X Are the names & phone numbers of persons to contact for answers to questions
about the research provided? X Does it state who to contact concerning questions about research participants’
rights, “Sometimes study participants have questions or concerns about their rights. In that case you should call the University of Nebraska-Lincoln Institutional Review Board at (402) 472-6965.”
Freedom to Withdraw X Does it state, “You are free to decide not to participate in this study. You can also
withdraw at any time without harming your relationship with the researchers or the University of Nebraska-Lincoln.”
X Does it state participation is voluntary?
Design and Analysis
36
36
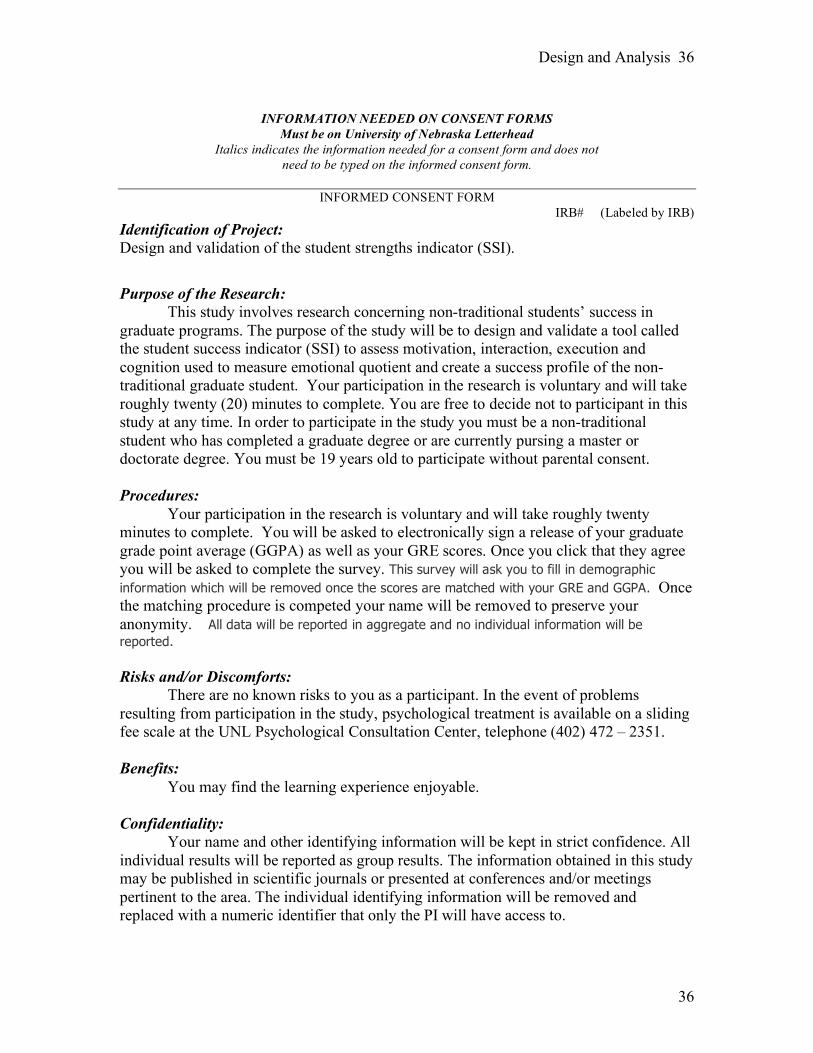
INFORMATION NEEDED ON CONSENT FORMS
Must be on University of Nebraska Letterhead Italics indicates the information needed for a consent form and does not
need to be typed on the informed consent form.
INFORMED CONSENT FORM IRB# (Labeled by IRB)
Identification of Project: Design and validation of the student strengths indicator (SSI).
Purpose of the Research: This study involves research concerning non-traditional students’ success in graduate programs. The purpose of the study will be to design and validate a tool called the student success indicator (SSI) to assess motivation, interaction, execution and cognition used to measure emotional quotient and create a success profile of the non-traditional graduate student. Your participation in the research is voluntary and will take roughly twenty (20) minutes to complete. You are free to decide not to participant in this study at any time. In order to participate in the study you must be a non-traditional student who has completed a graduate degree or are currently pursing a master or doctorate degree. You must be 19 years old to participate without parental consent. Procedures: Your participation in the research is voluntary and will take roughly twenty minutes to complete. You will be asked to electronically sign a release of your graduate grade point average (GGPA) as well as your GRE scores. Once you click that they agree you will be asked to complete the survey. This survey will ask you to fill in demographic information which will be removed once the scores are matched with your GRE and GGPA. Once the matching procedure is competed your name will be removed to preserve your anonymity. All data will be reported in aggregate and no individual information will be reported. Risks and/or Discomforts: There are no known risks to you as a participant. In the event of problems resulting from participation in the study, psychological treatment is available on a sliding fee scale at the UNL Psychological Consultation Center, telephone (402) 472 – 2351. Benefits: You may find the learning experience enjoyable.
Confidentiality: Your name and other identifying information will be kept in strict confidence. All individual results will be reported as group results. The information obtained in this study may be published in scientific journals or presented at conferences and/or meetings pertinent to the area. The individual identifying information will be removed and replaced with a numeric identifier that only the PI will have access to.

Design and Analysis
37
37
Compensation: There will be no compensation for participating in this research. Opportunity to Ask Questions: Participants have the right to ask questions at any point throughout the study and the right to have those questions answered. If there are questions/concerns about the research that cannot be answered by the researcher, the participant may contact the primary researcher, Mary Hayes at (402) 319 – 9028. If participants have questions or concerns about their rights they should contact the University of Nebraska-Lincoln Institutional Review Board at (402) 472 – 6965. Freedom to Withdraw: You are free to decide not to participate in this study or to withdraw at any time without harming your relationship with the researchers or the University of Nebraska-Lincoln. Your decision will not result in any loss or benefits to which you are otherwise entitled. Consent, Right to Receive a Copy:
You are voluntarily making a decision whether or not to participate in this research study. Your signature certifies that you have decided to participate having read and understood the information presented. You will be given a copy of this consent form to keep. Signature of Participant: ________________________________________________________________ Signature of Research Participant Date Name and Phone number of investigator(s) Mary Hayes, Principal Investigator Office: (402) 319 – 9028 Sharon Evans, Ph. D., Secondary Investigator Office (402) 472 – 2223 _______________________________________________________________________
Design and Analysis
38
38
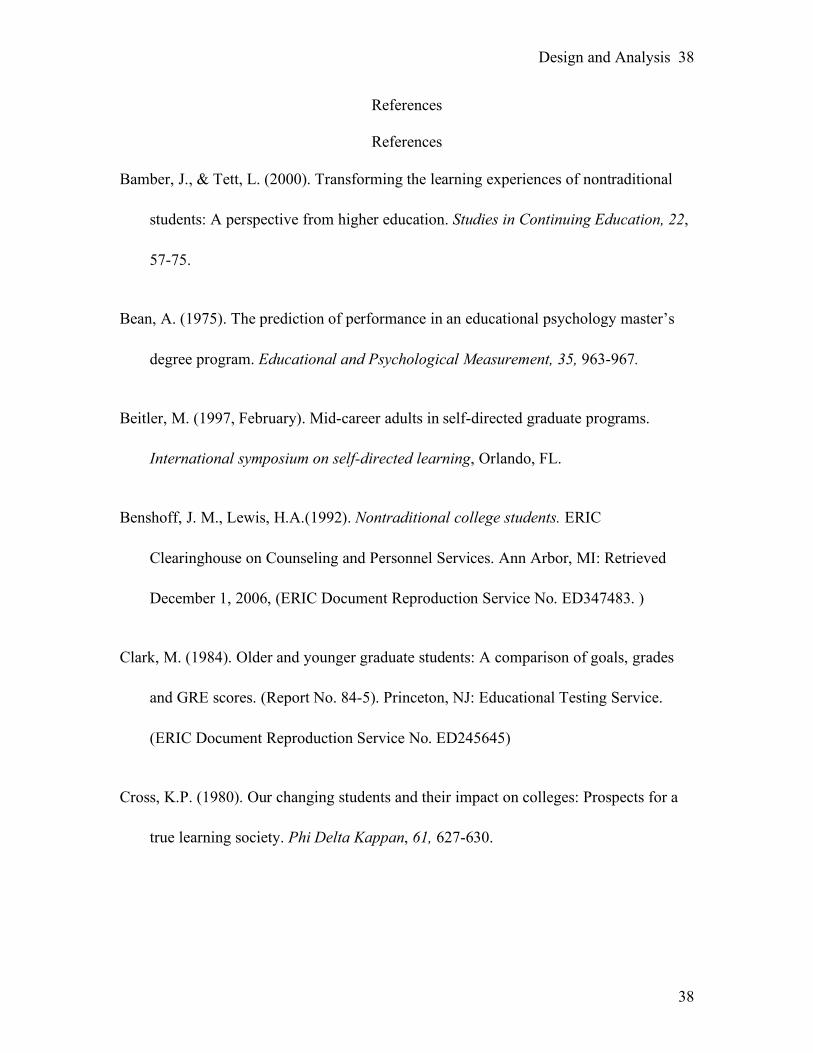
References
References
Bamber, J., & Tett, L. (2000). Transforming the learning experiences of nontraditional
students: A perspective from higher education. Studies in Continuing Education, 22,
57-75.
Bean, A. (1975). The prediction of performance in an educational psychology master’s
degree program. Educational and Psychological Measurement, 35, 963-967.
Beitler, M. (1997, February). Mid-career adults in self-directed graduate programs.
International symposium on self-directed learning, Orlando, FL.
Benshoff, J. M., Lewis, H.A.(1992). Nontraditional college students. ERIC
Clearinghouse on Counseling and Personnel Services. Ann Arbor, MI: Retrieved
December 1, 2006, (ERIC Document Reproduction Service No. ED347483. )
Clark, M. (1984). Older and younger graduate students: A comparison of goals, grades
and GRE scores. (Report No. 84-5). Princeton, NJ: Educational Testing Service.
(ERIC Document Reproduction Service No. ED245645)
Cross, K.P. (1980). Our changing students and their impact on colleges: Prospects for a
true learning society. Phi Delta Kappan, 61, 627-630.
Design and Analysis
39
39
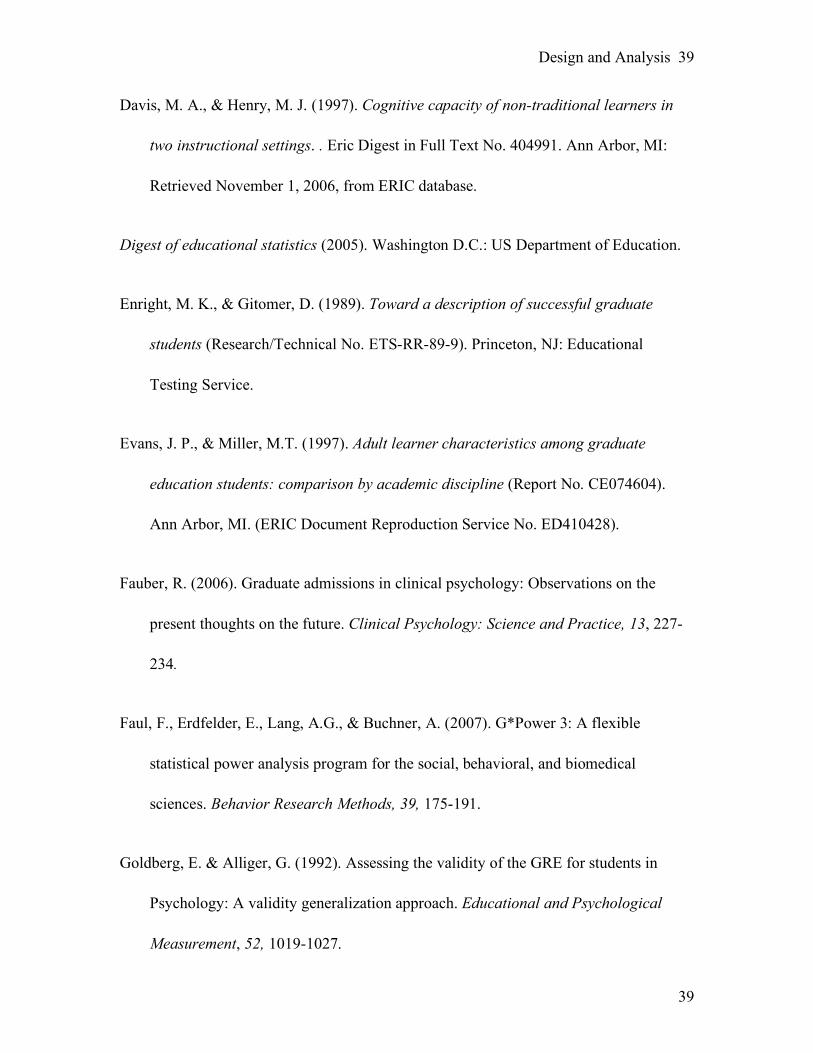
Davis, M. A., & Henry, M. J. (1997). Cognitive capacity of non-traditional learners in
two instructional settings. . Eric Digest in Full Text No. 404991. Ann Arbor, MI:
Retrieved November 1, 2006, from ERIC database.
Digest of educational statistics (2005). Washington D.C.: US Department of Education.
Enright, M. K., & Gitomer, D. (1989). Toward a description of successful graduate
students (Research/Technical No. ETS-RR-89-9). Princeton, NJ: Educational
Testing Service.
Evans, J. P., & Miller, M.T. (1997). Adult learner characteristics among graduate
education students: comparison by academic discipline (Report No. CE074604).
Ann Arbor, MI. (ERIC Document Reproduction Service No. ED410428).
Fauber, R. (2006). Graduate admissions in clinical psychology: Observations on the
present thoughts on the future. Clinical Psychology: Science and Practice, 13, 227-
234.
Faul, F., Erdfelder, E., Lang, A.G., & Buchner, A. (2007). G*Power 3: A flexible
statistical power analysis program for the social, behavioral, and biomedical
sciences. Behavior Research Methods, 39, 175-191.
Goldberg, E. & Alliger, G. (1992). Assessing the validity of the GRE for students in
Psychology: A validity generalization approach. Educational and Psychological
Measurement, 52, 1019-1027.
Design and Analysis
40
40
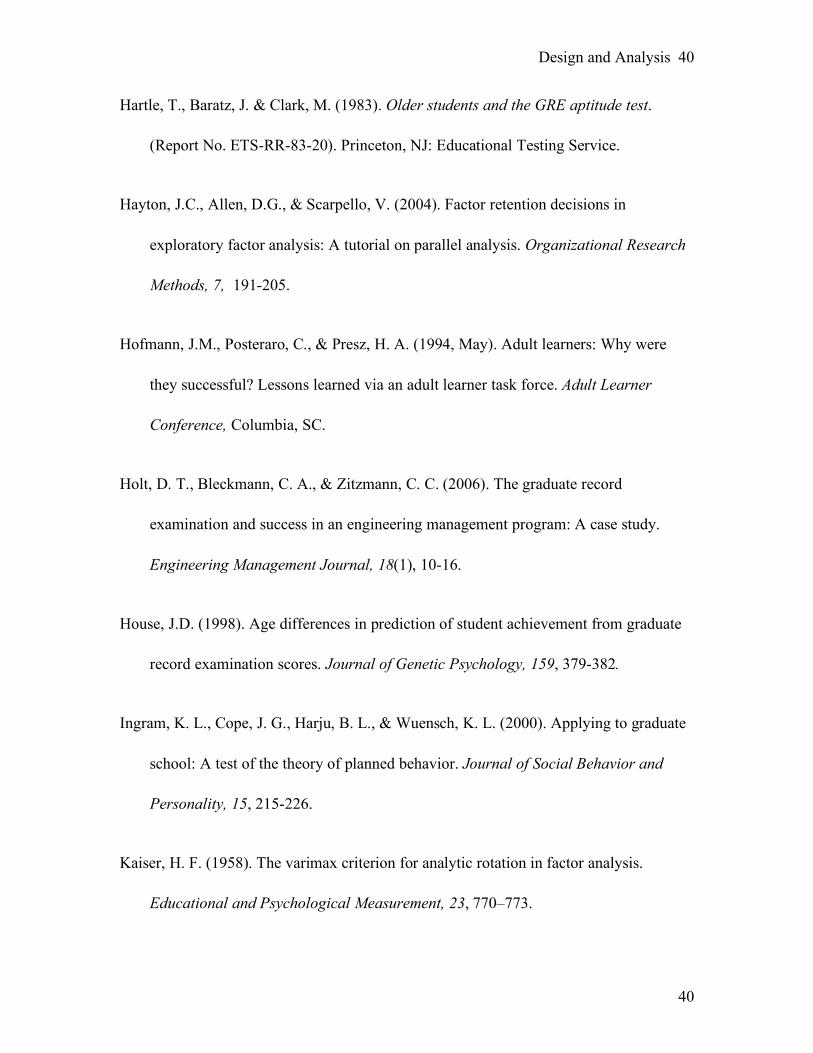
Hartle, T., Baratz, J. & Clark, M. (1983). Older students and the GRE aptitude test.
(Report No. ETS-RR-83-20). Princeton, NJ: Educational Testing Service.
Hayton, J.C., Allen, D.G., & Scarpello, V. (2004). Factor retention decisions in
exploratory factor analysis: A tutorial on parallel analysis. Organizational Research
Methods, 7, 191-205.
Hofmann, J.M., Posteraro, C., & Presz, H. A. (1994, May). Adult learners: Why were
they successful? Lessons learned via an adult learner task force. Adult Learner
Conference, Columbia, SC.
Holt, D. T., Bleckmann, C. A., & Zitzmann, C. C. (2006). The graduate record
examination and success in an engineering management program: A case study.
Engineering Management Journal, 18(1), 10-16.
House, J.D. (1998). Age differences in prediction of student achievement from graduate
record examination scores. Journal of Genetic Psychology, 159, 379-382.
Ingram, K. L., Cope, J. G., Harju, B. L., & Wuensch, K. L. (2000). Applying to graduate
school: A test of the theory of planned behavior. Journal of Social Behavior and
Personality, 15, 215-226.
Kaiser, H. F. (1958). The varimax criterion for analytic rotation in factor analysis.
Educational and Psychological Measurement, 23, 770–773.
Design and Analysis
41
41
Kuncel, N. R., Hezlett, S. A. & Ones, D. S. (2001). A comprehensive meta-analysis of
the predictive validity of the graduate record examination: Implications for graduate
student selection and performance. Psychological Bulletin, 127, 162-181.
Lindle, J. C., & Rinehart, J. S. (1998, April). Emerging issues with the predictive
applications of the GRE in educational administration programs: One doctoral
program's experience. Annual Meeting of the American Educational Research
Association, San Diego CA.
Malone, B. G., Nelson, J. S., & Nelson, C. V. (2001). An analysis of the factors
contributing to the completion and attrition rates of doctoral students in educational
administration (Report No. HE034438). Ann Arbor, MI: Retrieved November 5,
2006, from ERIC database (No. ED457779).
Morrison, T. & Morrison, M. (1995). A meta-analytic assessment of the predictive
validity of the quantitative and verbal components of the graduate record
examination with graduate grade point average representing the criterion of graduate
success. Educational and Psychological Measurement, 55, 309-316.
Mupinga, E. E., & Mupinga, D. M. (2005). Perceptions of international students toward
GRE. College Student Journal, 39, 402-408.
Design and Analysis
42
42
Murray, D.W. (1998). The war against testing. In W. M. Evers, L. T. Izumi & P.A. Riley
(Eds.). School reform: The critical issues (pp. 288-294). Stanford, CA: Hoover
Institution Press.
Nelson, J. S., & Nelson, C. V. (1995). Predictors of success for students entering
graduate school on a probationary basis, Report No HE028750. Ann Arbor, MI:
Retrieved December 1, 2006, from ERIC database (No. ED388206).
Nelson, J. S., Nelson, C. V., & Malone, B. G. (2000). A longitudinal investigation of the
success rate of at-risk graduate students: A follow-up study (Report No HE033458).
Ann Arbor, MI: Retrieved December 1, 2006, from ERIC database (No.ED446616).
Sacks, P. (2001). How Admissions Tests Hinder Access to Graduate and Professional
Schools. [Electronic Version] Chronicle of Higher Education, 47(39) Retrieved from
Academic Search Premier November 23, 2007 (No. 00095982).
Sacks, P. (1997). Standardized testing: meritocracy's crooked yardstick. Change, 29, 24-
31.
Sacks, P. (2003). The GRE and me: Prestige versus quality in American higher
education. Encounter: Education for Meaning and Social Justice, 16(1), 11-21.
Sternberg, R.J., Williams, W.W. (1997). Does the graduate record examination predict
meaningful success in the graduate training of psychologists?: A case study.
American Psychologist, 52, 630-641.
Design and Analysis
43
43
Sudol, D. (1991, March). Back to school: Warnings and advice to the older graduate
student. Paper Presented at the Annual Meeting of the Conference on College
Composition and Communication, Boston, MA.
TalentMine, LLC. (2003, September). Development of the generic manager index:
TalentMine index development study, technical report. Lincoln, NE: Bhola, D.,
McCashland, C.
Thompson, B., Daniel, L. (1996). Factor analytic evidence for the construct validity of
scores: A historical overview and some guidelines. Educational and Psychological
Measurement, 56, 197-208.
Wilmore, E. L., McNeil, J. J. (2002, April). A five-year analysis of GRE, race, gender,
and undergraduate GPA as predictors of state certification examination. Annual
Meeting of the American Educational Research Association, New Orleans, LA.
Design and Analysis
44
44
III. Appendices First Contact email June, 2007 Dear student name;
My name is Mary Hayes; I am a graduate student at University of Nebraska, Lincoln. I am doing research into the success of non-traditional graduate students. Many graduate schools require standardized tests for admissions which can be biased toward older students. Through my research I am designing an instrument to measure motivation and other strengths that can be predictive of success in graduate school. You have been identified as an individual who would meet the criteria for my research. I would be grateful if you would agree to participate in my study. The survey is located online at http://surveymonkey.com. The data will be downloaded from their server and analyzed by myself. The survey will take approximately 20 minutes to complete. Please be assured that your responses will remain strictly confidential. The information will be used for the development of the Student Success Indicator (SSI). You will be asked to consent to releasing you GRE and graduate grade point average; this information will be held in the strictest confidence. Once your scores are matched to your responses on the SSI, the identifying information will be removed. All data will be reported in aggregate and no individual information will be reported. The informed consent is online and explains the survey further. Please let me know if you have any questions. Feel free to call me at 402-319-9028. Thank you again for your time. Mary Hayes

Design and Analysis
45
45
Follow up email (This email will be sent one week after the original to provide a reminder) June, 2007 Dear student name;
My name is Mary Hayes; I am a graduate student at University of Nebraska, Lincoln. I am doing research into the success of non-traditional graduate students.
I recently sent you an invitation to complete a survey about non-traditional
student success. I would like to again ask for you participation in this study.
Many graduate schools require standardized tests for admissions which can be biased toward older students. Through my research I am designing an instrument to measure motivation and other strengths that can be predictive of success in graduate school. You have been identified as an individual who would meet the criteria for my research. I would be grateful if you would agree to participate in my study. The survey is located online at http://surveymonkey.com. The data will be downloaded from their server and analyzed by myself. The survey will take approximately 20 minutes to complete. Please be assured that your responses will remain strictly confidential. The information will be used for the development of the Student Success Indicator (SSI). You will be asked to consent to releasing you GRE and graduate grade point average; this information will be held in the strictest confidence. Once your scores are matched to your responses on the SSI, the identifying information will be removed. All data will be reported in aggregate and no individual information will be reported. The informed consent is online and explains the survey further. Please let me know if you have any questions. Feel free to call me at 402-319-9028. Thank you again for your time. Mary Hayes
Design and Analysis
46
46
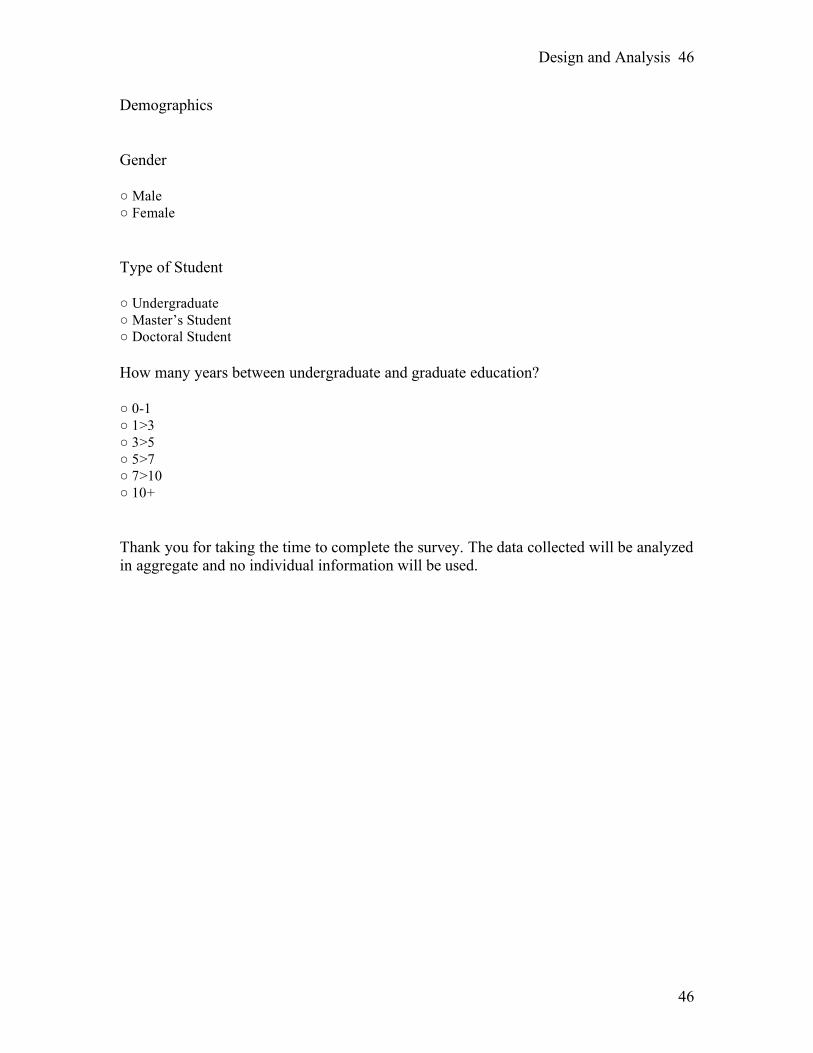
Demographics Gender ○ Male ○ Female
Type of Student ○ Undergraduate ○ Master’s Student ○ Doctoral Student
How many years between undergraduate and graduate education? ○ 0-1 ○ 1>3 ○ 3>5 ○ 5>7 ○ 7>10 ○ 10+
Thank you for taking the time to complete the survey. The data collected will be analyzed in aggregate and no individual information will be used.