a review of statistical analyses on monthly and daily ...eng.tethys.cat/files/6tethys-02-eng.pdf ·...
TRANSCRIPT

Tethys, 6, 15–29, 2009Journal of Weather & Climate of the Western Mediterraneanwww.tethys.catISSN-1697-1523eISSN-1139-3394DOI:10.3369/tethys.2009.6.02
Journal edited by ACAM(Associacio Catalana de Meteorologia)
A review of statistical analyses on monthlyand daily rainfall in CataloniaX. Lana1, A. Burgueno2, M. D. Martınez3 and C. Serra1
1Physics and Nuclear Engineering Department, Universitat Politecnica de Catalunya, Av. Diagonal 647, 08028 Barcelona2Astronomy and Meteorology Department, Physics Department, Universitat de Barcelona, C. Martı i Franques 1, 08028
Barcelona3Applied Physics Department, Universitat Politecnica de Catalunya, Av. Diagonal 649, 08028 Barcelona
Received: 14-VII-2008 – Accepted: 15-XII-2008 – Original version
Correspondence to: [email protected]
Abstract
A review on recent studies about monthly and daily rainfall in Catalonia is presented. Monthlyrainfall is analysed along the west Mediterranean Coast and in Catalonia, quantifying aspectsas the irregularity of monthly amounts and the spatial distribution of the Standard PrecipitationIndex. Several statistics are applied to daily rainfall series such as their extreme value and intra-annual spatial distributions, the variability of the average and standard deviation rain amountsfor each month, their amount and time distributions, and time trends affecting four pluviometricindices for different percentiles and class intervals. All these different analyses constitute thecontinuity of the scientific study of Catalan rainfall, which started about a century ago.
Key words: monthly and daily rainfall, spatial and time distributions, pluviometric indices, time trends, Catalonia
1 Introduction
The results of the first monthly rainfall network in Cat-alonia were compiled by Febrer (1930), with measurementsof different lengths from 314 rain gauges covering the periodfrom 1861 to 1925. The results included the first monthlyaverage rainfall maps. A complete relation of preliminarycontributions can be found in Albentosa (1980). With a sim-ilar objective, Clavero et al. (1996) published a more detailedspatial distribution of the monthly average rainfall from closeto 300 gauges, with at least 20 years of recordings since 1940up to 1980. With the statistical description in mind and tak-ing advantage of the data available, the authors of this reviewhave analysed particular spatial properties of monthly anddaily rain amounts in Catalonia, in a century in which de-tection of the human influence on precipitation trends for theearth has been recently proven (Zhang et al., 2007). Previousresearch in this domain cover different scopes as the contri-bution of the convective rainfall to the annual amount (Guilloand Puigcerver, 1970; Puigcerver and Guillo, 1971; Llasatand Puigcerver, 1997; Llasat, 2001), the dynamical and sta-tistical analysis of flood events (Llasat and Puigcerver, 1992,1994; Llasat and Rodrıguez, 1992; Ramis et al., 1994; Llasatet al., 1996), the prediction of a mesoscale convective system
by a nested numerical model (Codina et al., 1997), the clima-tological analysis of the dry-wet time series (Martın-Vide,1984; Burgueno, 1991) the regionalization of the precipita-tion by means of Principal Component Analysis (Fernandez-Mills et al., 1994; Serra et al., 1998), and the Gumbel distri-bution of extreme rain amounts (Casas et al., 2007).
According to Kiktev et al. (2003), for middle latitudes(30◦ - 60◦N) and the period from 1950-1995, most of Europeand East Asia are characterized by a positive trend in the an-nual maximum of consecutive days with daily precipitationbelow 1.0 mm, with a negative trend in the number of rainydays. This general behavior becomes of larger relevance forthe Mediterranean area, where an increase of extreme dailyrainfall has been observed during 1951-1995, in spite of adecrease in total amounts (Trigo et al., 2000; Alpert et al.,2002). Thus, in the Mediterranean area, the prospect is for alarger frequency of drought periods, with associated impactson agriculture, on the exploitation of water resources andalso on socio-economic activities. In the Iberian Peninsula,different trend analyses of daily rainfall point to an increaseof light rainfall events at the cost of a decrease of more in-tense events (Goodess and Jones, 2002; Gallego et al., 2006;Rodrigo and Trigo, 2007). Different regional climate mod-els, as also global models considering different scenarios of
2009 Author(s). This work is licensed under a Creative Commons License.

X. Lana et al.: Review of monthly and daily rainfall
Figure 1. Main orographic features of Catalonia and its emplace-ment in the Iberian Peninsula.
Figure 2. Spatial distribution of the 75 rain gauges belonging tothe Agencia Estatal de Meteorologıa, with inclusion of the FabraObservatory, which is represented by a solid triangle.
greenhouse gas emissions applied to the Mediterranean re-gion, point to a lengthening of the long dry spells, due to areduction in the rain amount during the 21st century (Ghanand Shippert, 2006), particularly in the summer season (Vosset al., 2002; Gibelin and Deque, 2003; Raisanen et al., 2004;Sanchez et al., 2004; Kundzewicz et al., 2006).
These observed shifts in the spatial and temporal rain-fall distribution are connected to the dynamical effects of theenhanced greenhouse gases and sulphate aerosols in the at-mosphere. Thus, on the extratropical cyclone activity, Gengand Sugi (2003) deduced that the total cyclone density willdecrease significantly around the year 2050 in the middle lat-itudes of the Northern Hemisphere during December-January
Figure 3. Probability plot of cumulative functions for empiricalannual rainfall compared with a) the log-normal distribution, and b)the gamma distribution. Numbers 1 to 7 design gauges ordered indecreasing latitude. (Source: Lana and Burgueno, 2000a).
and February (DJF) and June-July-August (JJA) seasons.Moreover, while a reduction of weak and medium-strengthcyclone is foreseen, the density of strong cyclones will in-crease by more than 20% in JJA. These changes are linked tothe decrease of baroclinicity in the lower troposphere, mainlycaused by the decrease of meridional temperature gradient.Previous studies on cyclones over the North Atlantic byKnippertz et al. (2000) also pointed towards a reduction ofthe number of total cyclones and an increase of strong cy-clones, with a poleward and eastward shift of their track.This shift of the storm tracks has also been found by other au-thors (Ulbrich and Christoph, 1999; Pinto et al., 2007). Thisbehavior is consistent with the 1948-2002 arctic cyclone ac-tivity (60◦ - 90◦N), which shows that the number and inten-sity of cyclones entering the Arctic from midlatitudes haveincreased, thus suggesting a shift of storm tracks into theArctic, particularly in summer (McCabe et al., 2001; Zhanget al., 2004). The Mediterranean Basin would also suffer adecrease of the overall cyclone activity and an increase of
Tethys 2009, 6, 15–29 16

X. Lana et al.: Review of monthly and daily rainfall
Figure 4. Spatial distribution of monthly Standardized Precipitation Indexes (SPI) for January, February, July and September of 1983.White areas correspond to zones with rain gauges reaching annual SPIs greater than -1.0. (Source: Lana et al., 2001)
deep cyclones in a doubled CO2 climate scenario (Lionelloet al., 2002). As a second order consequence, the observednorthward shift of storm tracks supports more stable circu-lation conditions over Europe, manifested in a higher per-sistence of atmospheric circulation in last decades, with theconsequent exacerbation of impacts on the occurrence andseverity of temperature extremes (Kysely and Domonkos,2006; Kysely, 2007).
In the present changing rainfall conditions, statistics ona regional scale are of value, given that these may supply anobjective analysis that will become an aid to check any fu-ture rainfall scenario. The contents of this review cover themonthly and daily rain amounts statistics in Catalonia devel-oped during the last 14 years by the authors, paying particularattention to their spatial distribution, statistical distributionsand time trends.
2 Study area, databases and regional climate
2.1 Study area
Catalonia extends over a surface of 32.000 km2 at theNE of the Iberian Peninsula, with nearly 400 km of Mediter-ranean coast (Figure 1). As main orographic characteris-tics, it is worth mentioning the Pyrenees and Pre-PyreneesRanges, which mitigate the effects of northern advections forthe rest of the region; the Littoral and Pre-Littoral Ranges,sheltering the Central Basin against eastern advections and,at the same time, enhancing their effects on the Littoral andPre-Littoral domains; and the Central Basin itself, subject tothe effects of frontal passages and western advections, mit-igated by the remoteness to the Atlantic coast. Within thePyrenees Range, distinctions have to be made between the
Tethys 2009, 6, 15–29 17

X. Lana et al.: Review of monthly and daily rainfall
Eastern Pyrenees regime, strongly influenced by the vicinityto the Mediterranean Sea, and the north face of the WesternPyrenees, with clear signs of Atlantic influence.
The Mediterranean regime is mainly governed by theinfluence of westerlies in winter and the subtropical anticy-clone in summer. The vicinity of the sea and neighboringhigh relief lands produce a great regional variety of weatherand climate. In the West Mediterranean, a large majority ofthe depressions are originated in the same region. These arethe Saharan and Genoa type depressions (Barry and Chorley,2003; Jansa et al., 2001). Unlike the central area and south-west coast of the Iberian Peninsula, with winter precipitationmainly explained by the North Atlantic Oscillation, the east-ern Iberian Peninsula keeps a negative correlation with theWestern Mediterranean Oscillation (Martın-Vide and Lopez-Bustins, 2006).
2.2 Databases
The monthly precipitation along the Spanish Mediter-ranean and nearby Atlantic coasts, as also the monthly anddaily rain amounts recorded in Catalonia have been obtainedfrom the Agencia Estatal de Meteorologıa, former Insti-tuto Nacional de Meteorologıa. The length and size of thedatabases have changed along the years on account of the dif-ferent kinds of studies. While in Lana and Burgueno (2000a)the mean data length of seven rain gauges was longer than acentury, in Lana and Burgueno (1998) data were obtainedfrom 74 rain gauges, with lengths ranging from 30 to 76years; in Lana et al. (2001), from 99 rain gauges for the years1961 to 1990; and in Burgueno et al. (2005), from 75 gaugescovering the period between 1950-2000 (Figure 2). For thislast database, the homogeneity of every rain gauge recordand a certain lack of data from some gauges have been ex-tensively analyzed, quantified and discussed by Lana et al.(2004) and Burgueno et al. (2005). Missing data in somegauges can reach 10 years, usually not distributed in veryshort gaps, but in continuous periods close to 1 year. Missingdaily data could have been estimated by considering statisti-cal methods and data corresponding to neighboring gauges.Nevertheless, the strong spatial variability of the daily plu-viometric regime of Catalonia (Lana et al., 2004) advisesagainst the substitution of missing data. In spite of the lownumber of data series in the Western Pyrenees Range, therecording continuity of the remaining gauges is good.
2.3 Regional climate
The closeness to a warm sea and the distant AtlanticOcean, together with a complex orography, produce a partic-ular scenario for the spatial distribution of rainfall amounts,in which eastern and southern advections are the most signif-icant contributors in spring and especially in autumn. Theymainly affect the littoral and pre-littoral domains, but some-times extend further inland.
The Fohn effect through the Iberian Peninsula under thewestern advections and through the Pyrenees under north-
Figure 5. Evolution of the spatial-averaged SPI in terms of thenumber of rain gauges where rainfall shortage or excess is detected.Open circles and stars depict empirical values and solid lines thebest fit by means of a straight line and a polynomial respectively.(Source: Lana et al., 2001)
Figure 6. Evolution of the number of rain gauges detected eachmonth with SPIs less than -1.0 (rainfall shortage) and greater than1.0 (rainfall excess). Straight lines depict linear trends along therecording period of 30 years. (Source: Lana et al., 2001)
Tethys 2009, 6, 15–29 18

X. Lana et al.: Review of monthly and daily rainfall
Figure 7. Spatial distribution of predicted daily precipitation maxima (mm), corresponding to Autumn, for return periods of 2, 10, 25 and50 years. (Source: Lana et al., 1995)
ern and northwestern circulations would explain the null orscarce rainfall under these synoptic situations in some ar-eas of Catalonia, except for the north face of Western Pyre-nees. On the other hand, when a nucleus of low-pressurecrosses Catalonia, the rain amounts are relevant. Moreover,these systems are sometimes reactivated when they reach theMediterranean Sea and can generate eastern advections.
Long dry spells usually occur in the hot and coldseasons because of anticyclonic persistence which of-ten affects the whole region. Along the hot seasons,the income of humid air from the Mediterranean to-gether with cold air masses at high levels of the tro-posphere can interrupt summer droughts in mountainranges such as the Pyrenees and Pre-Pyrenees by convectivephenomena.
3 Monthly rainfall
3.1 Pluviometric irregularity for the Spanish Mediter-ranean Coast
Seven long-term series of monthly rain amounts (Ta-ble 1), two of them in the Catalan coast, were used to studythe irregularity of the pluviometric regime along the Span-ish Mediterranean and nearby Atlantic coasts (Lana and Bur-gueno, 2000a). Three statistical functions (gamma, log-normal and a combination of Poisson and gamma distribu-tions) and moment-ratio diagrams were used to model themonthly and annual empirical distributions of precipitationamounts, each distribution being tested by means of theKolmogorov-Smirnov test. It is noteworthy that, whereasmost of the monthly cases required the gamma distribution,the pluviometric behavior of the summer months was well
Tethys 2009, 6, 15–29 19

X. Lana et al.: Review of monthly and daily rainfall
Table 1. List of Mediterranean and Atlantic gauges with their latitude, longitude, recording period, available years, sample mean annualrainfall, m, its standard deviation, s, number of years to achieve stationary values, ns, and coefficient of variation, CV . (Source: Lana andBurgueno, 2000a)
Station Latitude Longitude Recording Years m s ns CVperiod (mm) (mm) (years) (%)
Barcelona 41◦23’N 2◦10’E 1860-1987 128 573.0 150.5 100 26.3Tortosa 40◦49’N 0◦29’E 1906-1994 89 542.3 177.2 65 32.7Valencia 39◦29’N 0◦21’W 1864-1994 129 452.0 178.1 65 39.4Alicante 38◦22’N 0◦30’W 1909-1994 86 324.6 108.3 60 33.4Almerıa 36◦50’N 2◦29’W 1913-1994 75 212.2 85.9 50 40.5Malaga 36◦39’N 4◦29’W 1906-1994 80 532.4 186.0 65 34.9San Fernando 36◦28’N 5◦45’W 1839-1994 151 608.7 195.8 80 32.2
described by the Poisson-gamma distribution. Consequently,monthly rainfall amounts are not identically distributed alongthe year for each gauge. Moreover, both the log-normal andthe gamma distributions satisfactorily model empirical an-nual amounts (Figure 3). Second, temporal trends deducedfor annual and seasonal amounts were computed and theirstatistical significance evaluated. The most notable fact isthat, although some linear trends are close to 1 mm year−1,their significance levels exceed the assumed threshold valueand, excepting the winter season for Barcelona, they wereconsidered non-significant from a statistical point of view.Finally, by using monthly and annual amounts again, threetemporal irregularity indexes were computed for each pluvio-metric series, the temporal disparity of the rainfall patterns ofthe Mediterranean region being enhanced as a result. In ad-dition to the temporal irregularity, a change with latitude wasobserved both in the parameters of the statistical distributionsand the temporal irregularity indexes for the rain gauges anal-ysed. The two most southerly rain gauges constitute a specialcase in comparison with the remaining stations, because theyalso receive the Atlantic influences due to their proximity tothis ocean.
A spectral analysis of rainfall anomalies (Lana andBurgueno, 2000b) for the Barcelona monthly amount series(1860-1987) also received special attention, taking profit ofits data length.
3.2 Monthly rainfall shortage and excess in terms ofthe Standard Precipitation Index
Spatial and time behaviors of rainfall shortage and ex-cess were analysed using a database obtained from 99 raingauges with monthly totals collected from 1961 to 1990(Lana et al., 2001). The distribution of monthly amounts foreach rain gauge was modelled by means of the gamma orPoisson-gamma distributions. Then, using an equiprobabletransformation, monthly amounts described by these distri-butions were substituted by values given by the Standard-ized Precipitation Index, SPI, which follows a standardizednormal distribution and provides a unique pluviometric scale(Figure 4). After that, principal component analysis, PCA,
Figure 8. Percentage occurrence of the annual extremes in Au-tumn. (Source: Lana et al., 1995)
was applied to the set of monthly SPIs. A double regionaliza-tion of the 99 rain gauges, distinguishing between episodesof rainfall shortage and excess, was achieved by taking intoaccount the rotated factor loadings, RFL, correlating raingauges and principal components, PC. A time classificationof rainfall shortage and excess episodes was also established,considering in this case the factor scores, FS, obtained aftera PCA of variables based on monthly SPIs.
The spatial regionalization achieved became a roughpicture of the different topographic domains (Pyrenees, Pre-Pyrenees, Central Basin, Littoral and Pre-Littoral chainsand Mediterranean Coast), the climatic diversity of Catalo-nia being enhanced by these results. The time clusteringsuggested a quite complex behavior of the rainfall short-age and excess episodes. Moreover, the spatial distribu-
Tethys 2009, 6, 15–29 20

X. Lana et al.: Review of monthly and daily rainfall
Figure 9. Averages daily rainfall (ADR), standards deviation (SDR) and coefficients of variation (CV) evaluated by considering the wholerecording period of every rain gauge. (Source: Lana et al., 2004)
tion of these time clusters was very dispersed, in such away that monthly shortage and excess sometimes affect thewhole of Catalonia and sometimes just a small area. Be-sides results obtained from PCA and clustering algorithms, itis worth noticing that the severity of the episodes increasedremarkably only for rainfall shortage (Figure 5). In ad-dition, an analysis of the number of rain gauges affectedby monthly shortage and excess showed an interesting fact:whereas the number of rain gauges associated with a short-age had an increasing tendency, an outstanding decreasingtendency for excess was detected in the period of 1961-1990(Figure 6).
4 Daily rainfall
4.1 Daily precipitation maxima
The spatial distribution of expected daily precipitationmaxima was investigated for several return periods (Lanaet al., 1995). The process was applied to the four traditionalseasons and for the whole year by assuming the classicalGumbel theory of extremes (Gumbel I distribution), whichwas confirmed by the reasonable fit between predicted andempirical extremes. The analysis pointed towards a combina-tion of several factors controlling the extreme daily amountsdistribution in Catalonia, such as the complex orography, the
Tethys 2009, 6, 15–29 21

X. Lana et al.: Review of monthly and daily rainfall
Figure 10. Spatial distribution of the temporal irregularity for the monthly series of ADR, SDR and CV. (Source: Lana et al., 2004)
proximity of the Mediterranean Sea, the significant convec-tive activity, and the dominant surface circulation.
The records belonged to 74 rain gauges covering thewhole region, with observational data of different recordlengths. The stations were selected from 350 rain gauges ob-serving two conditions. On the one hand, their seasonal andextreme data must be without significant time trend. On theother hand, the number of available extremes must be greaterthan 30. The resulting observational data length ranged from30 to 76 years.
Figure 7 illustrates the behavior of the precipitationmaxima corresponding to Autumn (September, October andNovember), and Figure 8 the occurrence in percentage of theseasonal extremes in Autumn. The most significant featureis the predominance of extreme events recorded in this sea-
son. As can be noted, the largest daily maxima are observedin the two outermost corners of the littoral. Recently, a moredetailed analysis (Casas et al., 2007) has been obtained byusing 145 rain gauges, which has permitted the objective es-timation of the maximum daily precipitation at 1 km2 spatialresolution.
The precipitation measurements of the different gauges,together to a Jardı gauge and a siphon gauge, installed atthe Fabra Observatory and in different emplacements ofBarcelona respectively, have made it possible to obtain theextreme amounts collected for a wide range of durations,from 1 to 730 consecutive days. As expected, the resultsobtained satisfy a power law between the duration and theextreme amount collected, which remains below the valuesobtained for United Kingdom (Burgueno et al., 1998).
Tethys 2009, 6, 15–29 22
X. Lana et al.: Review of monthly and daily rainfall
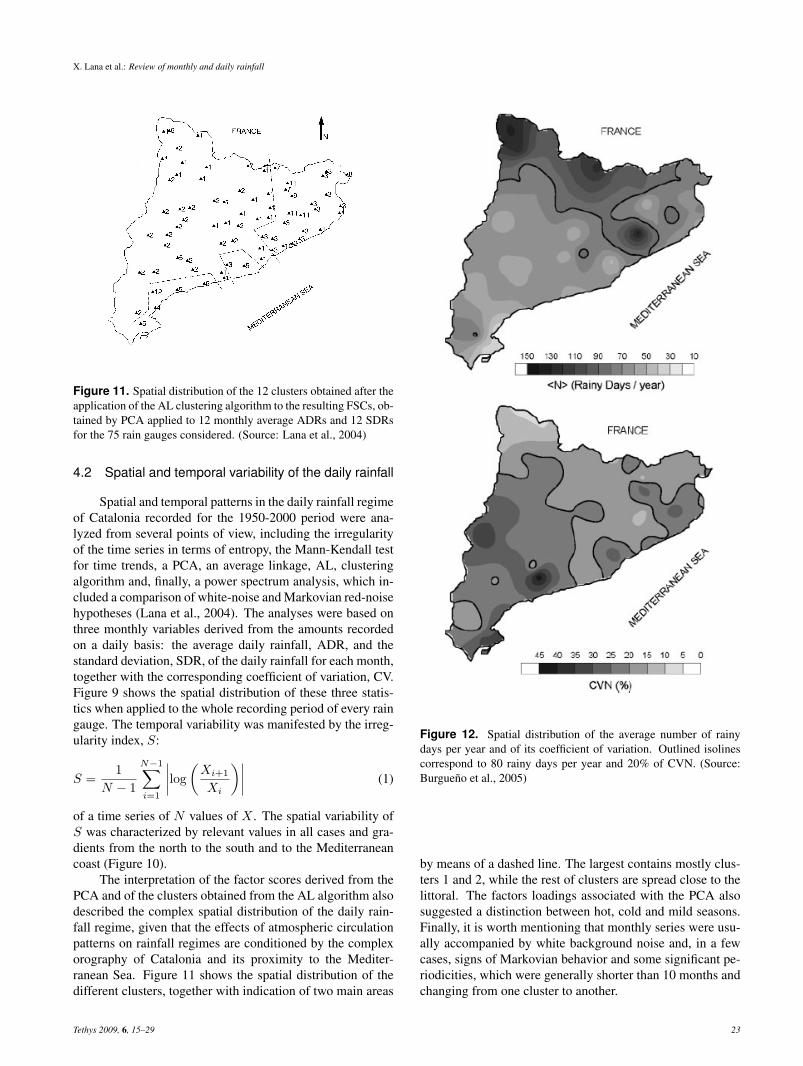
Figure 11. Spatial distribution of the 12 clusters obtained after theapplication of the AL clustering algorithm to the resulting FSCs, ob-tained by PCA applied to 12 monthly average ADRs and 12 SDRsfor the 75 rain gauges considered. (Source: Lana et al., 2004)
4.2 Spatial and temporal variability of the daily rainfall
Spatial and temporal patterns in the daily rainfall regimeof Catalonia recorded for the 1950-2000 period were ana-lyzed from several points of view, including the irregularityof the time series in terms of entropy, the Mann-Kendall testfor time trends, a PCA, an average linkage, AL, clusteringalgorithm and, finally, a power spectrum analysis, which in-cluded a comparison of white-noise and Markovian red-noisehypotheses (Lana et al., 2004). The analyses were based onthree monthly variables derived from the amounts recordedon a daily basis: the average daily rainfall, ADR, and thestandard deviation, SDR, of the daily rainfall for each month,together with the corresponding coefficient of variation, CV.Figure 9 shows the spatial distribution of these three statis-tics when applied to the whole recording period of every raingauge. The temporal variability was manifested by the irreg-ularity index, S:
S =1
N − 1
N−1∑i=1
∣∣∣∣log(
Xi+1
Xi
)∣∣∣∣ (1)
of a time series of N values of X . The spatial variability ofS was characterized by relevant values in all cases and gra-dients from the north to the south and to the Mediterraneancoast (Figure 10).
The interpretation of the factor scores derived from thePCA and of the clusters obtained from the AL algorithm alsodescribed the complex spatial distribution of the daily rain-fall regime, given that the effects of atmospheric circulationpatterns on rainfall regimes are conditioned by the complexorography of Catalonia and its proximity to the Mediter-ranean Sea. Figure 11 shows the spatial distribution of thedifferent clusters, together with indication of two main areas
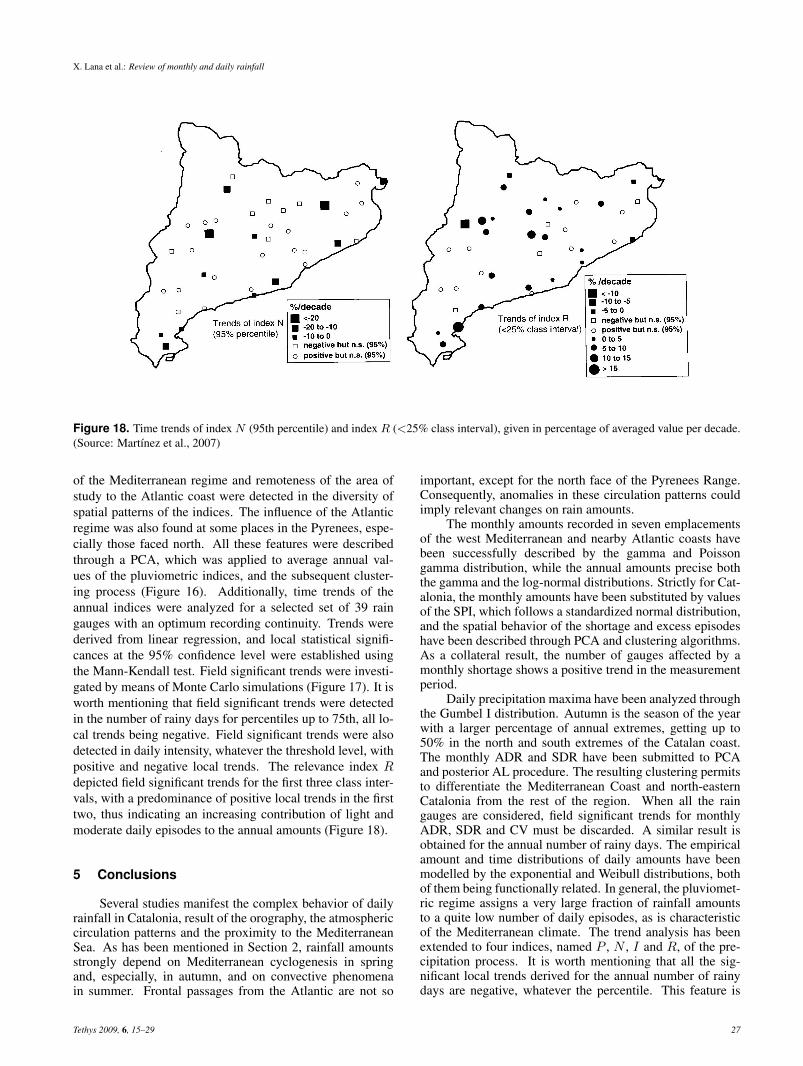
Figure 12. Spatial distribution of the average number of rainydays per year and of its coefficient of variation. Outlined isolinescorrespond to 80 rainy days per year and 20% of CVN. (Source:Burgueno et al., 2005)
by means of a dashed line. The largest contains mostly clus-ters 1 and 2, while the rest of clusters are spread close to thelittoral. The factors loadings associated with the PCA alsosuggested a distinction between hot, cold and mild seasons.Finally, it is worth mentioning that monthly series were usu-ally accompanied by white background noise and, in a fewcases, signs of Markovian behavior and some significant pe-riodicities, which were generally shorter than 10 months andchanging from one cluster to another.
Tethys 2009, 6, 15–29 23

X. Lana et al.: Review of monthly and daily rainfall
Figure 13. Dependence of parameters Xr , Yr , X∗, Y ∗, b and c on the CV of daily rain amounts. The geographical scattering of the CVs isdepicted in the attached map. (Source: Burgueno et al., 2005)
4.3 Statistical distributions of the daily rainfall regime
A relatively dense network of 75 gauges provided adatabase of daily rainfall from 1950 to 2000, which allowedthe corroboration of other analyses of the pluviometricregime in Catalonia relative to the average daily rainfall, itsstandard deviation and its coefficient of variation (Burguenoet al., 2005). A similar and more detailed research had beenapplied before to the Fabra Observatory data series, years1917-1999 (Burgueno et al., 2004).
The average annual number, <N>, of rain days isshown in Figure 12, together to its coefficient of variation,CVN. The first remarkable feature is the wide range ob-tained for <N>, from 30 to 140 rainy days per year, and therelatively narrow band of values of CVN, from 5 to 45%,considerable lower than those derived for CVs of the daily
rain amounts Lana et al. (2004). Another noticeable fact isthe clear decreasing (increasing) tendency in <N> (CVN)from north to south, with some striking gradients of <N> inareas of the Pyrenees and Transversal Ranges, and of CVNnear the Mediterranean coast. The annual number of rainydays had no field significant trend for the whole region, eventhough 23 of the 75 gauges had significant trends.
The daily amounts distributions, X , were well modelledby an exponential distribution, while the time distributions,Y , mostly accepted the Weibull model. A few gauges didnot follow either of the two models, 25 just followed just onemodel and 42 gauges fitted both models. The parameter ofthe exponential distribution adopted a relevant gradient fromeast to west, which pointed to the influence of Mediterraneanadvection on the average rain amount.
Tethys 2009, 6, 15–29 24

X. Lana et al.: Review of monthly and daily rainfall
Figure 14. Spatial distribution of a) the average and b) the standard deviation of index P (mm year−1). (Source: Martınez et al., 2007)
Figure 15. Two examples of the NRCs for rain gauges associatedwith the largest and smallest CVs of daily rain amounts, accompa-nied by the 95% confidence bands of the Kolmogorov-Smirnov test.(Source: Burgueno et al., 2005)
The normalized rainfall curves, NRC, were obtained,expressing X in function of Y , irrespective of previoussuccess in the distribution modelling. The parameters Xr,Yr, X∗, Y ∗, corresponding to the coordinates of the pointsof the NRC with slope equal to unity, and to the points withcoordinates (0.5, Y ∗) and (X∗, 0.5), were determined andrelated to the CV of the daily rain amounts (Figure 13). TheNRCs can be fitted to the law:
X = Y exp [−b(1− Y )c] (2)
Figure 16. The 11 clusters of rain gauges after the application ofthe AL algorithm to the FSCs derived after applying the PCA to 17variables (four pluviometric indices for the different percentiles andclass intervals). (Source: Martınez et al., 2007)
as also to a beta distribution. The set of NRCs deduced corre-sponds to coefficients of variation of daily amounts rangingfrom 94 to 208% (Figure 15). The parameters of the em-pirical fit and of the beta distribution kept their dependenceon the coefficient of variation of daily rain amounts, and theNRCs obtained did not differ remarkably, for instance, withrespect to Indian gauges in the monsoon season.
A close revision of coordinates (1-Xr, 1-Yr), derivedfrom the NRCs, manifested that a very large fraction of rain-
Tethys 2009, 6, 15–29 25

X. Lana et al.: Review of monthly and daily rainfall
Figure 17. Histograms of the number of significant and non-significant positive and negative time trends for all the indices and the selectedpercentiles. (Source: Martınez et al., 2007)
fall amounts is explained by quite a low number of dailyepisodes with remarkable totals that exceed the average dailyrainfall. In this way, the uneven character of the daily pluvio-metric regime in Catalonia was clearly shown.
4.4 Daily rainfall regime derived from four precipita-tion indices
Annual rainfall amount, P , number of rainy days peryear, N , average daily intensity in a year, I , and relevance,R, of the contribution of a rainfall class interval to the an-nual amount were used as pluviometric indices to deeply an-alyze the description of the complex behavior of daily rainfallregime of Catalonia (Martınez et al., 2007). These same pre-cipitation indices had been previously applied to the Fabra
Observatory (1917-1999) data series at seasonal and annualscales (Lana et al., 2003), while the research on their peri-odicities and irregularities had also been studied (Lana et al.,2005).
For this analysis, daily amounts of rainfall from 75 raingauges for the period 1950-2000 were considered. Indices Nand I were analyzed by distinguishing five percentiles (25th,50th, 75th, 90th and 95th) of the daily rainfall amounts. In-dex R was evaluated taking into account <25%, 25 - 50%,50 - 75%, 75 - 90%, ≥90% and ≥95% class intervals. Allthese indices were described by their mean annual values,standard deviations (see Figure 14 as an example) and con-secutive temporal irregularities (Equation 1). Besides thecomplex orography of the region, effects of the influence
Tethys 2009, 6, 15–29 26
X. Lana et al.: Review of monthly and daily rainfall
Figure 18. Time trends of index N (95th percentile) and index R (<25% class interval), given in percentage of averaged value per decade.(Source: Martınez et al., 2007)
of the Mediterranean regime and remoteness of the area ofstudy to the Atlantic coast were detected in the diversity ofspatial patterns of the indices. The influence of the Atlanticregime was also found at some places in the Pyrenees, espe-cially those faced north. All these features were describedthrough a PCA, which was applied to average annual val-ues of the pluviometric indices, and the subsequent cluster-ing process (Figure 16). Additionally, time trends of theannual indices were analyzed for a selected set of 39 raingauges with an optimum recording continuity. Trends werederived from linear regression, and local statistical signifi-cances at the 95% confidence level were established usingthe Mann-Kendall test. Field significant trends were investi-gated by means of Monte Carlo simulations (Figure 17). It isworth mentioning that field significant trends were detectedin the number of rainy days for percentiles up to 75th, all lo-cal trends being negative. Field significant trends were alsodetected in daily intensity, whatever the threshold level, withpositive and negative local trends. The relevance index Rdepicted field significant trends for the first three class inter-vals, with a predominance of positive local trends in the firsttwo, thus indicating an increasing contribution of light andmoderate daily episodes to the annual amounts (Figure 18).
5 Conclusions
Several studies manifest the complex behavior of dailyrainfall in Catalonia, result of the orography, the atmosphericcirculation patterns and the proximity to the MediterraneanSea. As has been mentioned in Section 2, rainfall amountsstrongly depend on Mediterranean cyclogenesis in springand, especially, in autumn, and on convective phenomenain summer. Frontal passages from the Atlantic are not so
important, except for the north face of the Pyrenees Range.Consequently, anomalies in these circulation patterns couldimply relevant changes on rain amounts.
The monthly amounts recorded in seven emplacementsof the west Mediterranean and nearby Atlantic coasts havebeen successfully described by the gamma and Poissongamma distribution, while the annual amounts precise boththe gamma and the log-normal distributions. Strictly for Cat-alonia, the monthly amounts have been substituted by valuesof the SPI, which follows a standardized normal distribution,and the spatial behavior of the shortage and excess episodeshave been described through PCA and clustering algorithms.As a collateral result, the number of gauges affected by amonthly shortage shows a positive trend in the measurementperiod.
Daily precipitation maxima have been analyzed throughthe Gumbel I distribution. Autumn is the season of the yearwith a larger percentage of annual extremes, getting up to50% in the north and south extremes of the Catalan coast.The monthly ADR and SDR have been submitted to PCAand posterior AL procedure. The resulting clustering permitsto differentiate the Mediterranean Coast and north-easternCatalonia from the rest of the region. When all the raingauges are considered, field significant trends for monthlyADR, SDR and CV must be discarded. A similar result isobtained for the annual number of rainy days. The empiricalamount and time distributions of daily amounts have beenmodelled by the exponential and Weibull distributions, bothof them being functionally related. In general, the pluviomet-ric regime assigns a very large fraction of rainfall amountsto a quite low number of daily episodes, as is characteristicof the Mediterranean climate. The trend analysis has beenextended to four indices, named P , N , I and R, of the pre-cipitation process. It is worth mentioning that all the sig-nificant local trends derived for the annual number of rainydays are negative, whatever the percentile. This feature is
Tethys 2009, 6, 15–29 27

X. Lana et al.: Review of monthly and daily rainfall
especially remarkable when considering the number of verywet days (95th percentile), as their contribution to the annualamounts is very relevant. These negative local trends, mostlydistributed throughout the area, are of a clear Mediterraneaninfluence. Consequently, a noticeable change in the pluvio-metric regime should be the decreasing number of copiousdaily episodes in areas of Mediterranean influence.
Acknowledgements. The authors are indebted to the Agencia Es-tatal de Meteorologıa, former Instituto Nacional de Meteorologıa,and to the Fabra Observatory (Reial Academia de Ciencies iArts, Barcelona) for providing gently the pluviometric data series.ACAM is acknowledged for the 2007 Fontsere Award related to thisline of work.
References
Albentosa, L. M., 1980: Bibliografıa de Climatologıa y Meteo-rologıa de Cataluna, Rev Geogr, XIV, 127–158.
Alpert, P., Ben-Gai, T., Baharad, A., Benjamini, Y., Yekutieli, D.,Colacino, M., Diodato, L., Ramis, C., Homar, V., Romero, R.,Michaelides, S., and Manes, A., 2002: The paradoxical increaseof Mediterranean extreme daily rainfall in spite of decrease in to-tal values, Geophys Res Lett, 29, DOI: 10.1029/2001GL013 554.
Barry, R. G. and Chorley, R. J., 2003: Atmosphere, Weather andClimate, Eighth Ed., Routledge, London, pp. 421.
Burgueno, A., Fernandez Mills, G., and Lana, X., 1998: Precipita-cions extremes absolutes a Catalunya, Tethys, 1, 11–16.
Burgueno, A., Serra, C., and Lana, X., 2004: Monthly and annualstatistical distribution of daily rainfall at the Fabra Observatory(Barcelona, NE Spain) for the years 1917-1999, Theor Appl Cli-matol, 77, 57–75.
Burgueno, A., Martınez, M. D., Lana, X., and Serra, C., 2005:Statistical distributions of the daily rainfall regime in Catalonia(Northeastern Spain) for the years 1950-2000, Int J Climatol, 25,1381–1403.
Burgueno, J., 1991: Caracteritzacio basica de la irregularitat deles precipitacions a Catalunya, Notes Geogr Fis, 20-21, 25–32.
Casas, M. C., Herrero, M., Ninyerola, M., Pons, X., Rodrıguez, R.,Rius, A., and no, A. R., 2007: Analysis and objective mapping ofextreme daily rainfall in Catalonia, Int J Climatol, 27, 399–409.
Clavero, P., Martın-Vide, J., and Raso, J. M., 1996: Atlas Climaticde Catalunya, Institut Cartografic de Catalunya, Barcelona, 42pp.
Codina, B., Aran, M., Young, S., and Redano, A., 1997: Predictionof a mesoscale convective system over Catalonia (NortheasternSpain) with a nested numerical model, Meteorol Atmos Phys, 62,9–22.
Febrer, J., 1930: Atlas pluviometric de Catalunya, MemoriesPatxot, Barcelona, vol. I, 523 pp.
Fernandez-Mills, G., Lana, X., and Serra, C., 1994: Catalonian pre-cipitation patterns: principal component analysis and automatedregionalization, Theor Appl Climatol, 49, 201–212.
Gallego, M. C., Garcıa, J. A., Vaquero, J. M., and Mateos, V. L.,2006: Changes in frequency and intensity of daily precipita-tion over the Iberian Peninsula, J Geophys Res, 111, DOI:10.1029/2006JD007 280.
Geng, Q. and Sugi, M., 2003: Possible change of extratropical cy-clone activity due to enhanced greenhouse gases and sulphateaerosols. Study with a a high-resolution AGCM, J Climate, 16,2262–2274.
Ghan, S. J. and Shippert, T., 2006: Physically based global down-scaling: climate change projections for a full century, J Climate,19, 1589–1604.
Gibelin, A. and Deque, M., 2003: Anthropogenic climate changeover the Mediterranean region simulated by a global resolutionmodel, Clim Dyn, 20, 327–339.
Goodess, C. M. and Jones, P. D., 2002: Links between circulationand changes in the characteristics of Iberian rainfall, Int J Cli-matol, 22, 1593–1615.
Guillo, A. M. and Puigcerver, M., 1970: Sobre las contribucionesrelativas de las precipitaciones local y generalizada a la preci-pitacion total en Cataluna, Revista Geofısica, XXIX, 205–216.
Jansa, A., Genoves, A., Picornell, M. A., Campins, J., Riosalido,R., and Carretero, O., 2001: Western Mediterranean cyclonesand heavy rain. Part 2: Statistical approach, Meteorol Appl, 8,43–56.
Kiktev, D., Sexton, D. M. H., Alexander, L., and Folland, C. K.,2003: Comparison of modelled and observed trends in indices ofdaily climate extremes, J Climate, 16, 3560–3571.
Knippertz, P., Ulbrich, U., and Speth, P., 2000: Changing cyclonesand surface winds speeds over the North Atlantic and Europe ina transient GHG experiment, Clim Res, 15, 109–122.
Kundzewicz, Z. W., Radziejewski, M., and Pinskwar, I., 2006: Pre-cipitation extremes in the changing climate of Europe, Clim Res,31, 51–58.
Kysely, J., 2007: Implications of enhanced persistence of atmo-spheric circulation for the occurrence and severity of tempera-ture extremes, Int J Climatol, 27, 689–695.
Kysely, J. and Domonkos, P., 2006: Recent increase in persistenceof atmospheric circulation over Europe: comparison with long-term variations since 1881, Int J Climatol, 26, 461–483.
Lana, X. and Burgueno, A., 1998: Daily dry-wet behaviour in Cat-alonia (NE Spain) from the viewpoint of Markov chains, Int JClimatol, 18, 793–815.
Lana, X. and Burgueno, A., 2000a: Some statistical characteristicsof monthly and annual pluviometric irregularity for the SpanishMediterranean Coast, Theor Appl Climatol, 65, 79–97.
Lana, X. and Burgueno, A., 2000b: Statistical distributions andspectral analysis of rainfall anomalies for Barcelona (NE Spain),Theor Appl Climatol, 66, 211–227.
Lana, X., Fernandez Mills, G., and Burgueno, A., 1995: Daily pre-cipitation maxima in Catalonia (North-East Spain): Expectedvalues and their spatial distribution, Int J Climatol, 15, 341–354.
Lana, X., Serra, C., and Burgueno, A., 2001: Patterns of monthlyrainfall shortage and excess in terms of the standardized precip-itation index for Catalonia (NE Spain), Int J Climatol, 21, 1669–1691.
Lana, X., Serra, C., and Burgueno, A., 2003: Trends affectingpluviometric indices at the Fabra Observatory (Barcelona, NESpain) from 1917 to 1999, Int J Climatol, 23, 315–332.
Lana, X., Martınez, M. D., Serra, C., and Burgueno, A., 2004: Spa-tial and temporal variability of the daily rainfall regime in Cat-alonia (Norteastern Spain), 1950-2000, Int J Climatol, 24, 613–641.
Lana, X., Martınez, M. D., Serra, C., and Burgueno, A., 2005: Peri-odicities and irregularities of indices describing the daily pluvio-metric regime of the Fabra Observatory (NE Spain) for the years1917-1999, Theor Appl Climatol, 82, 183–198.
Lionello, G. N., Dalan, F., and Elvini, E., 2002: Cyclones in theMediterranean region: the present and the doubled CO2 climatescenarios, Clim Res, 22, 147–159.
Tethys 2009, 6, 15–29 28

X. Lana et al.: Review of monthly and daily rainfall
Llasat, M. C., 2001: An objective classification of rainfall events onthe basis of their convective features: application to rainfall in-tensity in the Northeast of Spain, Int J Climatol, 21, 1385–1400.
Llasat, M. C. and Puigcerver, M., 1992: Pluies extremes en Cata-logne, Hydrologie Continentale, 7, 99–115.
Llasat, M. C. and Puigcerver, M., 1994: Meteorological factors as-sociated with floods in North-Eastern part of the Iberian Penin-sula, Nat Hazards, 9, 81–93.
Llasat, M. C. and Puigcerver, M., 1997: Total rainfall and convec-tive rainfall in Catalonia, Spain, Int J Climatol, 17, 1683–1695.
Llasat, M. C. and Rodrıguez, R., 1992: Extreme rainfall events inCatalonia. The case of 12 November 1988, Nat Hazards, 5, 133–151.
Llasat, M. C., Ramis, C., and Barrantes, J., 1996: The meteorologyof high-intensity rainfall events over the West Mediterranean re-gion, Remote Sensing Reviews, 14, 51–90.
Martın-Vide, J., 1984: Analisis de la irregularidad de la precipi-tacion diaria en el litoral mediterraneo de la Penınsula Iberica,Revista Geofısica, 40, 101–106.
Martın-Vide, J. and Lopez-Bustins, J. A., 2006: The westernMediterranean oscillation and rainfall in the Iberian Peninsula,Int J Climatol, 26, 1455–1475.
Martınez, M. D., Lana, X., Burgueno, A., and Serra, C., 2007: Spa-tial and temporal daily rainfall regime in Catalonia (NE Spain)derived from four precipitation indices, years 1950-2000, Int JClimatol, 27, 123–138.
McCabe, G. J., Clark, M. P., and Serreze, M. C., 2001: Trends inNorthern Hemisphere surface cyclone frequency and intensity, JClimate, 14, 2763–2768.
Pinto, J. G., Ulbrich, U., Leckebusch, G. C., Spangehl, T., Rey-ers, M., and Zacharias, S., 2007: Changes in storm track andcyclone activity in three SRES ensemble experiments with theECHAM5/MPI-OM1 GCM, Clim Dyn, 29, 195–210.
Puigcerver, M. and Guillo, A. M., 1971: Contribucion al estudiode la precipitacion organizada en Cataluna, Revista Geofısica,XXXI, 117–142.
Raisanen, J., Hansson, U., Ullerstig, A., Doscher, R., Graham, L. P.,Jones, C., Meier, H. E. M., P., P. S., and Willen, U., 2004: Euro-pean climate in the late twenty-first century: regional simulationswith two driving global models and two forcing scenarios, ClimDyn, 22, 13–31.
Ramis, C., Llasat, M. C., Genoves, A., and Jansa, A., 1994: TheOctober-1987 flood in Catalonia: synoptic and mesoscale mech-anisns, Met Apps, 1, 337–350.
Rodrigo, F. S. and Trigo, R. M., 2007: Trends in daily rainfall in theIberian Peninsula from 1951 to 2002, Int J Climatol, 27, 513–529.
Sanchez, E., Gallardo, C., Gaertner, M. A., Arribas, A., and Castro,M., 2004: Future climate extreme events in the Mediterraneansimulated by a regional climate model: a first approach, Globaland Planetary Change, 44, 163–180.
Serra, C., Fernandez-Mills, G., Periago, M. C., and Lana, X., 1998:Surface synoptic circulation and daily precipitation in Catalonia,Theor Appl Climatol, 59, 29–49.
Trigo, I. F., Davies, T. D., and Bigg, G. R., 2000: Decline inMediterranean rainfall caused by weakening of Mediterraneancyclones, Geophys Res Lett, 27, 2913–2916.
Ulbrich, U. and Christoph, M., 1999: A shift of the NAO and in-creasing storm track activity over Europe due to anthropogenicgreenhouse gas forcing, Clim Dyn, 15, 551–559.
Voss, R., May, W., and Roeckner, E., 2002: Enhanced resolution
modelling study on anthropogenic climate change: changes inextremes of the hydrological cycle, Int J Climatol, 22, 755–777.
Zhang, X., Walsh, J. E., Zhang, J., U.S., U. S. B., and Ikeda, M.,2004: Climatology and Interannual variability of Arctic CycloneActivity: 1948-2002, J Climate, 17, 2300–2317.
Zhang, X., Zwiers, F. W., Hegerl, G. C., Lambert, F. H., Gillet, N. P.,Solomon, S., Stott, P. A., and Nozawa, T., 2007: Detection of hu-man influence on twentieth-century precipitation trends, Nature,448, 461–468.
Tethys 2009, 6, 15–29 29