a review of price forecasting problem and techniques in ... · ... fuzzy inference, fuzzy neural...
TRANSCRIPT
Journal of Power and Energy Engineering, 2015, 3, 1-19 Published Online September 2015 in SciRes. http://www.scirp.org/journal/jpee http://dx.doi.org/10.4236/jpee.2015.39001
How to cite this paper: Singh, N. and Mohanty, S.R. (2015) A Review of Price Forecasting Problem and Techniques in Dere-gulated Electricity Markets. Journal of Power and Energy Engineering, 3, 1-19. http://dx.doi.org/10.4236/jpee.2015.39001
A Review of Price Forecasting Problem and Techniques in Deregulated Electricity Markets Nitin Singh, S. R. Mohanty Department of Electrical Engineering, Motilal Nehru National Institute of Technology Allahabad, Allahabad, India Email: [email protected], [email protected] Received 6 July 2015; accepted 7 September 2015; published 10 September 2015
Copyright © 2015 by authors and Scientific Research Publishing Inc. This work is licensed under the Creative Commons Attribution International License (CC BY). http://creativecommons.org/licenses/by/4.0/
Abstract In deregulated electricity markets, price forecasting is gaining importance between various mar-ket players in the power in order to adjust their bids in the day-ahead electricity markets and maximize their profits. Electricity price is volatile but non random in nature making it possible to identify the patterns based on the historical data and forecast. An accurate price forecasting me-thod is an important factor for the market players as it enables them to decide their bidding strategy to maximize profits. Various models have been developed over a period of time which can be broadly classified into two types of models that are mainly used for Electricity Price forecasting are: 1) Time series models; and 2) Simulation based models; time series models are widely used among the two, for day ahead forecasting. The presented work summarizes the influencing factors that affect the price behavior and various established forecasting models based on time series analysis, such as Linear regression based models, nonlinear heuristics based models and other simulation based models.
Keywords Electricity Price Forecasting, Time Series Models, ARIMA, GARCH, ANN, Fuzzy ARTMAP
1. Introduction With the Introduction of deregulation of power industry, new challenges have been encountered by the partici-pants of the electricity market due to which forecasting of wind power, electric loads and energy price have be-come a major issue globally [1]. Deregulation however, has been associated with the expectation of greater
N. Singh, S. R. Mohanty
2
consumer participation and efficiency gains for both consumers and share-holders. Globally energy price fore-casting has come up as important area of research due to deregulation of whole sale market. Major market par-ticipants such as generators, power suppliers, investors and trades wish to maximize the profitability [2]-[4]. Un-like load forecasting, electricity price forecasting is much more complex because of the unique characteristics and uncertainties in operation as well as bidding strategies [5]. In other commodity markets like stock market, agricultural market price forecasting is always being at the center of studies because of its importance [6]-[9].
Electricity is also a commodity, and its price should also be forecasted along with time but if the same me-thods were used for forecasting electricity prices as other commodity prices, the forecasted price will exhibit lower accuracy without any surprise due to volatile nature of electricity price among all commodities. Many techniques and models have been developed for forecasting whole sale electricity prices, especially for short term price forecasting [3]. The state of art techniques for electricity price forecasting are categorized into equili-brium analysis [5], simulation methods [10], econometric methods [11], time series [12]-[14], intelligent sys-tems [15]-[17] and volatility analysis [18]. Time series and intelligent systems are commonly used for day-ahead price forecasting. This paper reviews established approaches and mainly focusing on soft computing models.
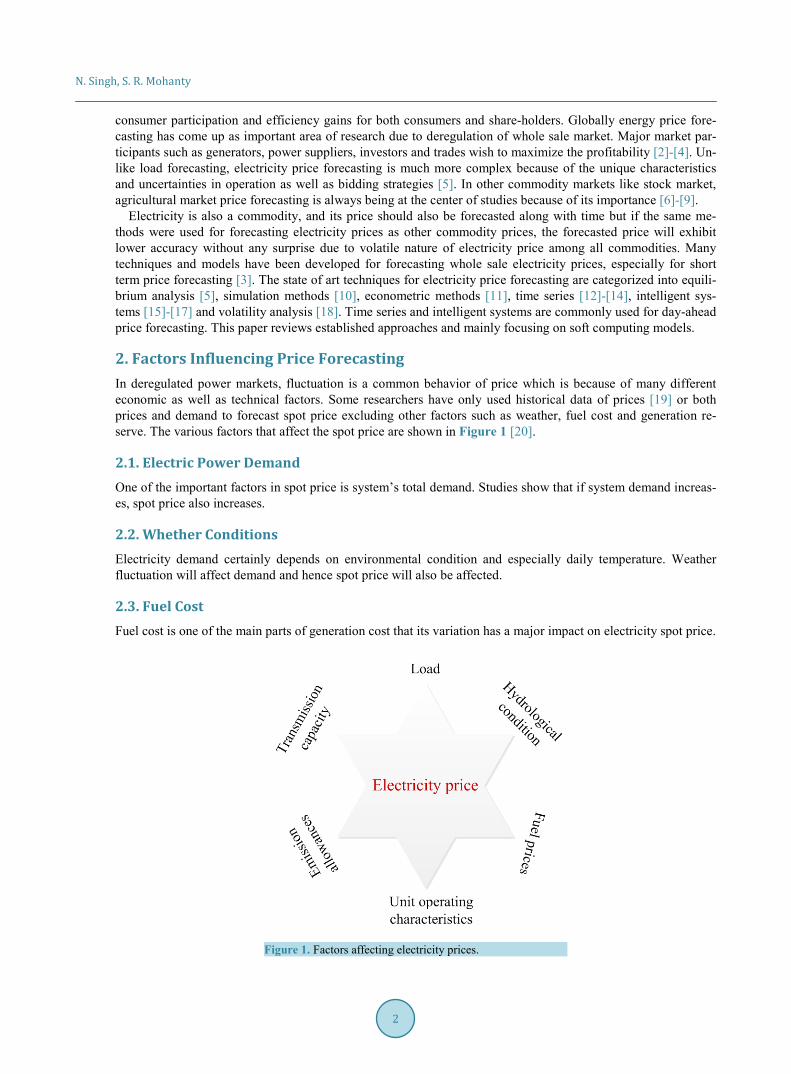
2. Factors Influencing Price Forecasting In deregulated power markets, fluctuation is a common behavior of price which is because of many different economic as well as technical factors. Some researchers have only used historical data of prices [19] or both prices and demand to forecast spot price excluding other factors such as weather, fuel cost and generation re-serve. The various factors that affect the spot price are shown in Figure 1 [20].
2.1. Electric Power Demand One of the important factors in spot price is system’s total demand. Studies show that if system demand increas-es, spot price also increases.
2.2. Whether Conditions Electricity demand certainly depends on environmental condition and especially daily temperature. Weather fluctuation will affect demand and hence spot price will also be affected.
2.3. Fuel Cost Fuel cost is one of the main parts of generation cost that its variation has a major impact on electricity spot price.
Figure 1. Factors affecting electricity prices.
N. Singh, S. R. Mohanty
3
2.4. Available Transmission Capacity Electric power is provided by generator that may be located far from location of consumers. It should be trans-mitted to consumers via transmission network facilities. There is some physical constraint in transmission net-works that is an obstruction for market participants to buy or sell energy. This issue can affect important changes on spot price and may increase it.
2.5. Generation Reserves Having enough generation reserve is an important factor for electricity spot price, i.e. when demand increase suddenly if there is enough generation reserve capacity available as well as deliverable, consumers will be served. But if there is not sufficient generation reserve available, consumer would face with lack of received energy and therefore to make the balance between supply and demand electricity spot price increases.
3. Electricity Load and Price Forecasting Problems and Methods 3.1. Load Forecasting Forecasts, in particular have become important after restructuring of the power systems as many countries have deregulated their power system and turned electricity into commodity from necessity. Many countries are still in the process and soon electricity will be a commodity with players in all across global market. Load series is not only complex nut also exhibits several levels of seasonality: the prediction is not only depends on the previous hour load but also on the load of the same hour on previous day, and same denominations in the previous week [21]-[23].
Various techniques and models have been developed for the forecasting the electrical load with varying de-grees of success, but the still the models based on the linear regression scores over the other reported models. These models allow the system operators and engineer, physically interpretation of the components so that their behavior can be understood. Models based on Artificial Intelligence (AI) were also developed for forecasting of electrical load, such as expert systems, fuzzy inference, fuzzy neural models and neural network (NN) based models. Neural networks due to their intrinsic capability to learn complex and non linear relationships that are otherwise difficult by other conventional methods, have gained popularity among all artificial intelligence based models [24] [25].
3.2. Price Forecasting With introduction of the deregulated electricity markets major emphasis is on maximizing the profits of the var-ious market players. As far as forecasting is concerned electricity prices and load are mutually interlinked, due their dependability on each other and error in one will propagate to other. Non-storability, Seasonal behavior and Transportability are the major issues which makes electricity price so specific. These issues make it im-possible to treat the electricity at par with any other commodity and forbid the application of forecasting me-thods common in other commodity markets [26].
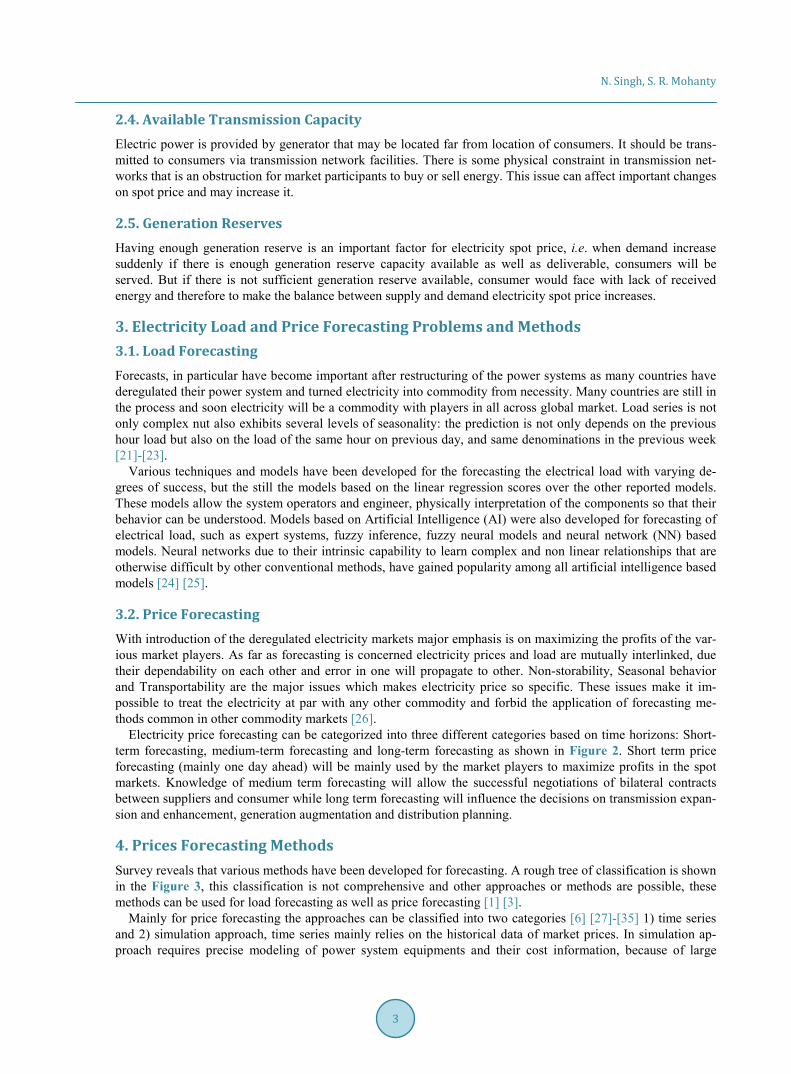
Electricity price forecasting can be categorized into three different categories based on time horizons: Short- term forecasting, medium-term forecasting and long-term forecasting as shown in Figure 2. Short term price forecasting (mainly one day ahead) will be mainly used by the market players to maximize profits in the spot markets. Knowledge of medium term forecasting will allow the successful negotiations of bilateral contracts between suppliers and consumer while long term forecasting will influence the decisions on transmission expan-sion and enhancement, generation augmentation and distribution planning.
4. Prices Forecasting Methods Survey reveals that various methods have been developed for forecasting. A rough tree of classification is shown in the Figure 3, this classification is not comprehensive and other approaches or methods are possible, these methods can be used for load forecasting as well as price forecasting [1] [3].
Mainly for price forecasting the approaches can be classified into two categories [6] [27]-[35] 1) time series and 2) simulation approach, time series mainly relies on the historical data of market prices. In simulation ap-proach requires precise modeling of power system equipments and their cost information, because of large
N. Singh, S. R. Mohanty
4
Figure 2. Types of forecasting.
Figure 3. Classification of forecasting techniques.
amount of data involved simulation method can be computationally intensive.
Time series approach can be further classified into the following, linear regression based models and non li-near heuristic models. Regression-based models include auto-regressive moving average (ARMA) models, and its extension, auto regressive integrated moving average (ARIMA) models, and their variants. While these mod-els are aimed at modeling and forecasting the changing price itself, generalized autoregressive conditional hete-rokedasticity (GARCH) is aimed at modeling the volatility of electricity prices [20].
Nonlinear heuristic based models uses artificial neural network and other artificial intelligent techniques for modeling the input-output data relation without complete information of the connections. Other soft computing methods are also used to extend the data representation capability of the regression based or ANN models.
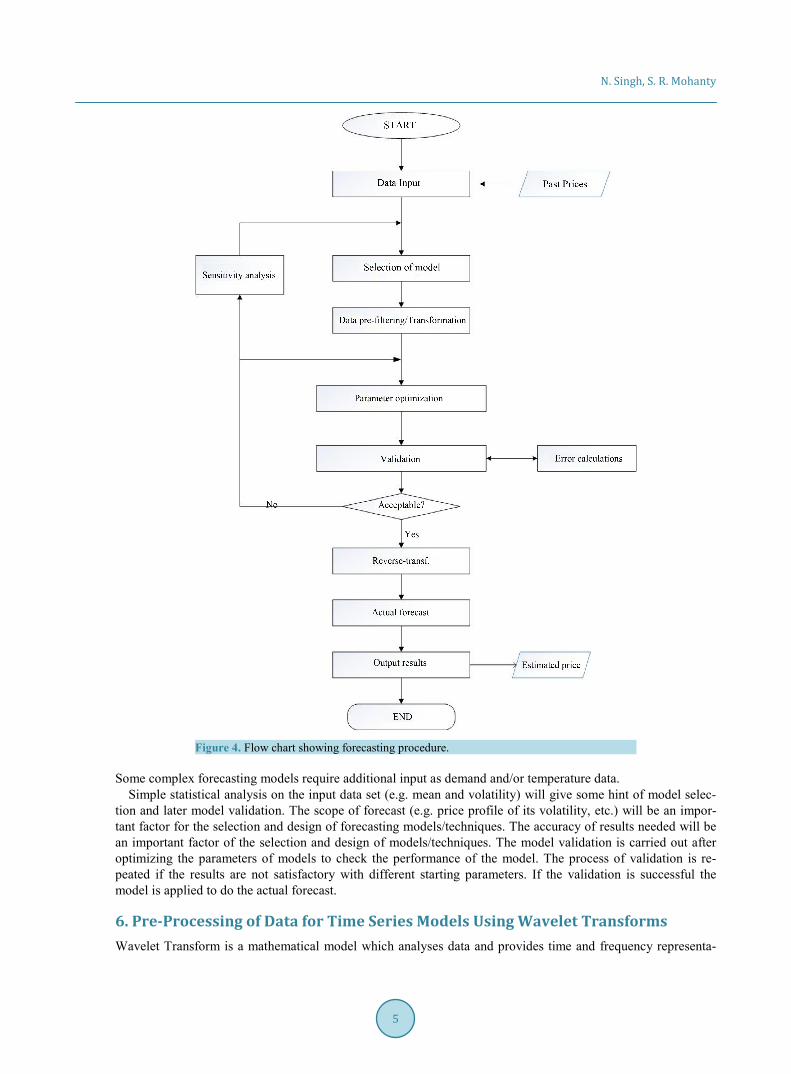
5. Price Forecasting Methodology A typical procedure of price forecasting is shown in the Figure 4 [20]. The flow chart is depicting the process of time series based forecasting. The process of forecasting usually starts with the input data, the major input data for the price forecasting are the past market prices, record of a few weeks to several months is taken as input.
N. Singh, S. R. Mohanty
5
Figure 4. Flow chart showing forecasting procedure.
Some complex forecasting models require additional input as demand and/or temperature data.
Simple statistical analysis on the input data set (e.g. mean and volatility) will give some hint of model selec-tion and later model validation. The scope of forecast (e.g. price profile of its volatility, etc.) will be an impor-tant factor for the selection and design of forecasting models/techniques. The accuracy of results needed will be an important factor of the selection and design of models/techniques. The model validation is carried out after optimizing the parameters of models to check the performance of the model. The process of validation is re-peated if the results are not satisfactory with different starting parameters. If the validation is successful the model is applied to do the actual forecast.
6. Pre-Processing of Data for Time Series Models Using Wavelet Transforms Wavelet Transform is a mathematical model which analyses data and provides time and frequency representa-
N. Singh, S. R. Mohanty
6
tion simultaneously (time-scale analysis) [36]. It is used for analyzing non-stationary signals in power systems such as price time series [37]-[40], voltage and current waveforms [41]. The wavelet transforms decomposes the original time domain signal into several other scales with different levels of resolution in what is called multi- resolution decomposition [42].
Wavelet Transform is most suited for the non-stationary data (mean and autocorrelation of series are not con-stant), the price series data is non-stationary and volatile in nature, that is why use of wavelet transform gives accurate forecasting results [43]. FT (Fourier Transform) decompose the original price series into a linear com-binations as sine and cosine functions whereas by using Wavelet Transform (WT) the series is decomposed into a sum of more flexible functions i.e. localized in both time and frequency. Wavelet Transform can be classified into two: Continuous Wavelet Transform (CWT) and Discrete Wavelet Transform (DWT) [40] [44]-[46].
The CWT of a continuous time signal x(t) is defined as (1):
( ) ( ) ( )*, , da b a bt x t t tψ ψ
∞
−∞
= ∫ (1)
where ψ(t) is a mother wavelet, a is a scaling parameter, b is a translating parameter and
( )* *,
1a b
t btaa
ψ ψ − =
(2)
Each wavelet is created by scaling and translating operations in a mother wavelet. The mother wavelet is an oscillate function with finite energy and zero average.
The DWT of a sampled signal x(n) is defined as (3):
( ) ( )*, ,c d c d
nx n nψ ψ= ∑ (3)
where
( )* *,
1 co o
c d ccoo
n db an
aaψ ψ
−=
(4)
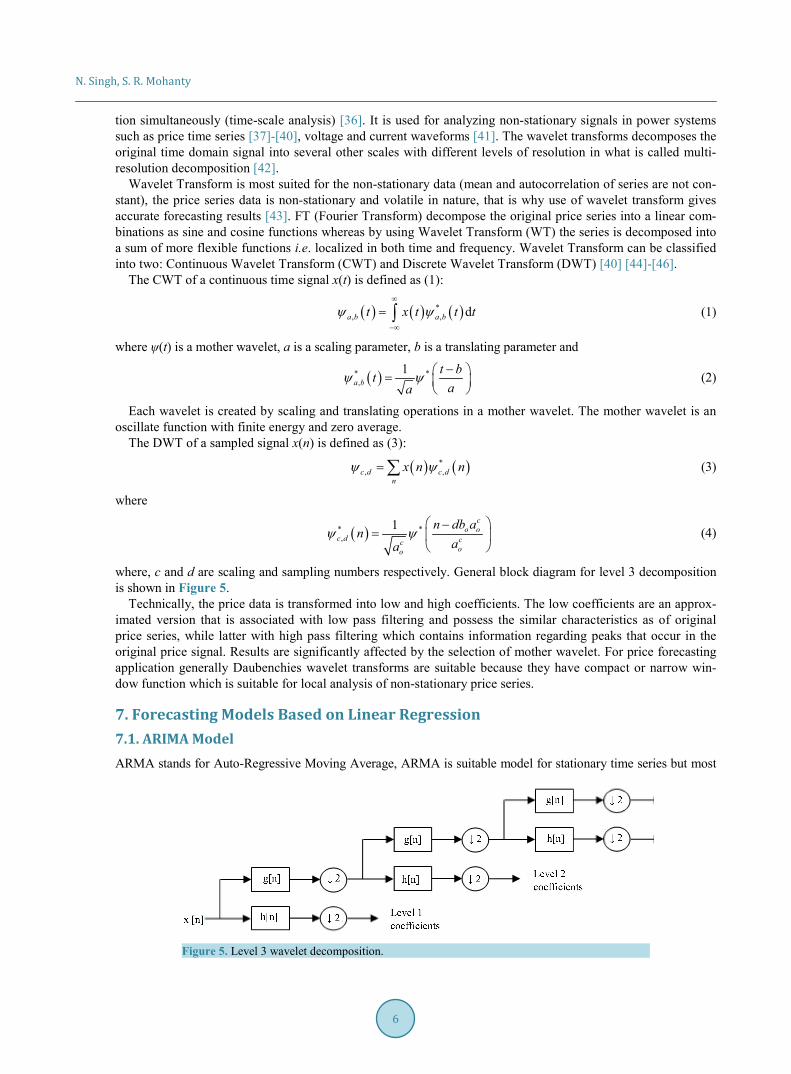
where, c and d are scaling and sampling numbers respectively. General block diagram for level 3 decomposition is shown in Figure 5.
Technically, the price data is transformed into low and high coefficients. The low coefficients are an approx-imated version that is associated with low pass filtering and possess the similar characteristics as of original price series, while latter with high pass filtering which contains information regarding peaks that occur in the original price signal. Results are significantly affected by the selection of mother wavelet. For price forecasting application generally Daubenchies wavelet transforms are suitable because they have compact or narrow win-dow function which is suitable for local analysis of non-stationary price series.
7. Forecasting Models Based on Linear Regression 7.1. ARIMA Model ARMA stands for Auto-Regressive Moving Average, ARMA is suitable model for stationary time series but most
Figure 5. Level 3 wavelet decomposition.
N. Singh, S. R. Mohanty
7
of the price series are non-stationary. To overcome this problem and to allow ARMA model to handle non-sta- tionary data, the new model is introduced for non-stationary data, the model is called Auto-Regressive Integrated Moving Average (ARIMA), it has been successfully applied to forecast the commodity prices [47]-[49]. The ap-plication of ARIMA methodology for the study of time series analysis is due to box and Jenkins [50].
There are many ARIMA models; generally ARIMA model is defined as ARIMA (p, q, d) where: p is the number of autoregressive terms, q is the number of lagged forecast error in the prediction equation, d is the number of non-seasonal differences. If there is no differencing (i.e. d = 0), then ARIMA model can be called an ARMA model [47].
Consider a time series xt, then the first order differencing is defined as:
1t t tx x x −′ = − (5)
where, L can be used to express differencing
( )1 1t t t t t tx x x x Lx L x−′ = − = − = − (6)
Thus, ARIMA (p, d, q) is defined as:
( )( )
( )( )
( )( )
2 21 2 1 21 1 1dp q
p t q t
I dAR p MA q
L L L L x c L L Lϕ ϕ ϕ ψ ψ ψ ε− − − − − = + − − − −
(7)
( )( ) ( )1 dt tL L x c Lϕ ψ ε− = + (8)
ARIMA models are derived from autoregressive (AR), moving average (MA) and auto-regressive moving average (ARMA). In AR, MA and ARMA models conditions of stationary are satisfied; therefore they are ap-plicable only to stationary series. ARIMA model captures the incremental evolution in the price instead of price value.
7.2. GARCH Model GARCH stands for Generalized Autoregressive Conditional Heteroskedasticity while the (ARIMA) models are aimed at modeling and forecasting the changing price itself, (GARCH) model is aimed at modeling the volatility of prices [51] [52]. GARCH models consider the moments of a time series as variant (i.e. the error term: real val-ue minus forecasted value does not have zero mean and constant variance as with an ARIMA process). The error term is now assumed to be serially correlated and can be modeled by an Auto Regressive (AR) process. Thus, a GARCH process can measure the implied volatility of a time series due to price spikes [53]-[55]. The model GARCH (p, q) is defined as follows:
Consider a time series xt with a constant mean offset, then
t tx µ ε= + (9)
where µ is offset and t t tzε σ= .
2 2 2
1 1
q p
t i t i i t ii i
cσ ϕ ε ψ σ− −= =
= + +∑ ∑ (10)
where p is the order of GARCH terms σ2 and q is the order of ARCH terms ε2. As we can easily see in Equation (10), in GARCH (p, q) model is p = 0, i.e. a GARCH (0, q) model becomes
an ARCH (q) model. GARCH model can only specified for stationary time series so below equation must be sa-tisfied for stationary time series.
1 11
q p
i ii iϕ ψ
= =
+ <∑ ∑ (11)
GARCH process can measure the implied volatility due to price spikes.
8. Forecasting Models Based on Nonlinear Heuristics 8.1. Artificial Neural Network Based Model Most of the time series models are linear predictors, while electricity price is a non-linear function of its input
N. Singh, S. R. Mohanty
8
features, making it difficult for the time series techniques to completely capture the behavior of price signal. Therefore the researchers have come up with the idea of using Neural Network (NNs) for electricity price fore-casting [56]-[59].
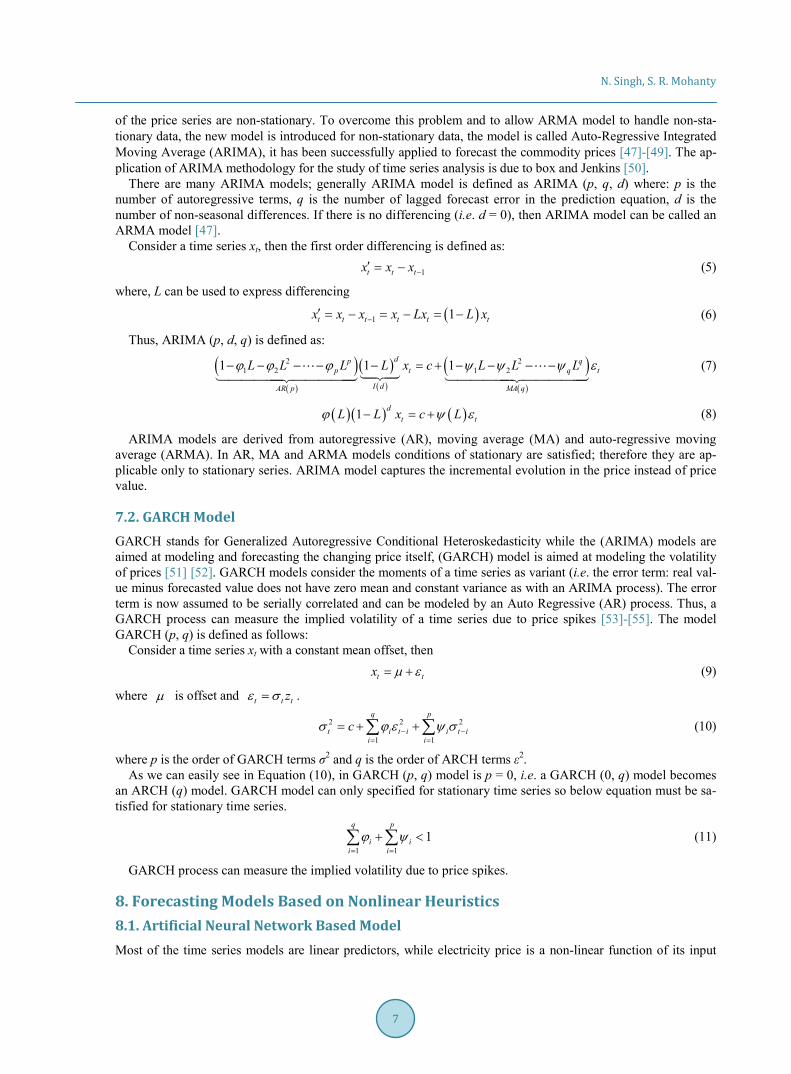
Neural networks are highly interconnected simple processing units designed to model how the human brain performs a particular task [60]. Basic structure of the neural network is shown in the Figure 6. The network generally consists of three to four layers and during training process, the neurons in the input layer pass the raw information onto the rest of the neurons in the other layers. The connection weights between different layers keep on updating with the ongoing learning process [60].
A neural network uses a learning function to modify the variable connection weights at the input of each processing element i.e. neuron. The ANN models could be differentiated based on type of learning function, learning algorithm and no. of hidden layers etc. Generally a three layered neural networks are chosen for fore-casting the electricity price.
ANN based models have gained popularity due to their property to solve undefined relationship between input and output variables, approximate complex nonlinear function and implement multiple training algorithms. However, neural network also suffers from the disadvantage that the network will not be flexible enough to model the data well with too few units, and on the contrary, it will be over-fitting with too many units [20].
In order to overcome such weakness, different evolutionary techniques have been combined with ANNs re-cently [58] [61]-[65]. ANN model with feature selection technique and relief algorithm [59] and particle swarm optimization is used for ANN training [66].
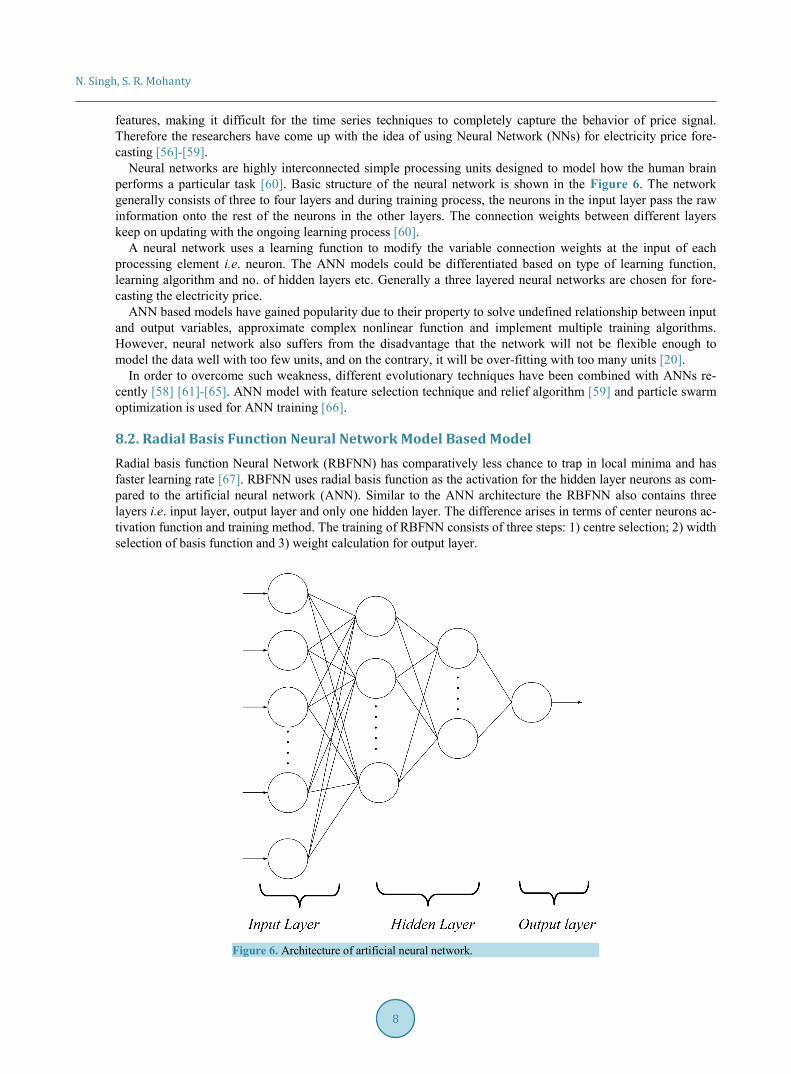
8.2. Radial Basis Function Neural Network Model Based Model Radial basis function Neural Network (RBFNN) has comparatively less chance to trap in local minima and has faster learning rate [67]. RBFNN uses radial basis function as the activation for the hidden layer neurons as com-pared to the artificial neural network (ANN). Similar to the ANN architecture the RBFNN also contains three layers i.e. input layer, output layer and only one hidden layer. The difference arises in terms of center neurons ac-tivation function and training method. The training of RBFNN consists of three steps: 1) centre selection; 2) width selection of basis function and 3) weight calculation for output layer.
Figure 6. Architecture of artificial neural network.
N. Singh, S. R. Mohanty
9
The model of RBFNN can be described as follows:
( )2
2i
i
I cf I
rψ −
=
(12)
( )f I is the output of ith neuron of hidden layer and I is an input training vector as described in III. A; Ψ(.) is radial basis function used in non-linear mapping, Ci is center for ith hidden layer neuron and ri is radius for ith hid-den layer neuron.
( ) ( ) ( )22 21 1 2 2 ii i i q iNI c I c I c I c− = − + − + + − (13)
In (13), iI c− is Euclidean distance and it can be calculated using (12), where, q is number of inputs in one training pattern. The width (σ) of the basis function is decided by the singular values of Gtr, which are generated using (14). Here, dmax is maximum euclidean distance between final centre points Ci and all training input points. Weights of the output layer can be measured using Equation (15). trG+ and Ytr are pseudo inverse of Gtr and out-put training patterns matrix respectively.
( )2 2
max
exp htr q i q i
NG I c I c
d
− = − −
(14)
tr trW G Y+= × (15)
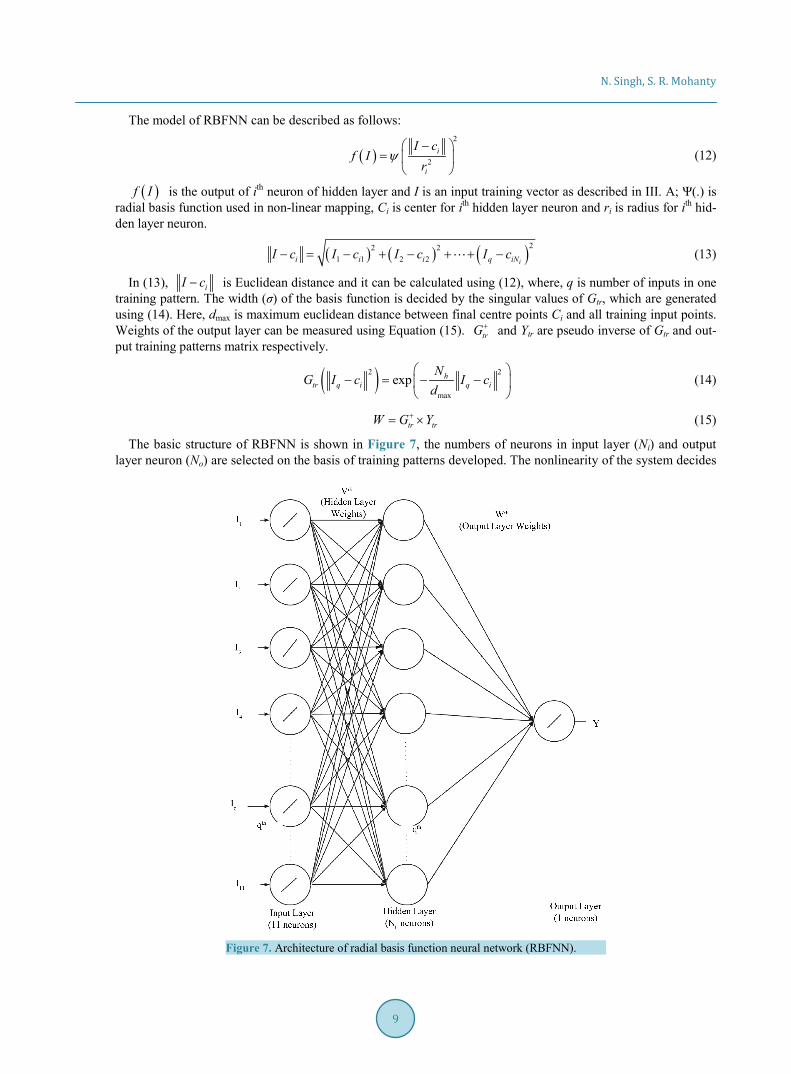
The basic structure of RBFNN is shown in Figure 7, the numbers of neurons in input layer (Ni) and output layer neuron (No) are selected on the basis of training patterns developed. The nonlinearity of the system decides
Figure 7. Architecture of radial basis function neural network (RBFNN).
N. Singh, S. R. Mohanty
10
the number of neurons in the hidden layer (Nh). The data flow start from the input layer and traverse through the hidden layer and arrives at the output layer. Input as well as output layers of RBFNN have linear activation functions, however the hidden layer neurons has a radial basis function (Gaussian) activation function.
T TtstY W G= × (16)
where, Gtst defined as (17) and suffix tst denote any testing or real time input pattern for which output is desired from a trained RBFNN. Output Y can be calculated using (16).
( )2
22exp
2tst i
tst tst i
I cG I c
σ
− − = −
(17)
Input layer weight matrix has value 1 for all its elements, because input is direct and linearly mapped to hid-den layer. For training of RBFNN K-mean clustering is applied. In RBFNN weight matrices, Vrb and Wrb contain weights of hidden layer and output layer, respectively.
8.3. Fuzzy Inference System Based Model An FIS performs input-output mapping based on fuzzy logic. Fuzzy evaluates the intermediate states between discrete crisp states and is able to handle the concept of partial truth instead of absolute truth. Traditional adaptive fuzzy system include ANFIS and neuro-fuzzy methods are intended to combine the advantages of ANN and fuzzy logic with the difference that ANFIS architecture has linear output function [68], whereas neuro-fuzzy systems are essentially a subset of ANN applied to controls and classification problem [69].
Wang-mendel suggested an algorithm for implementing FIS for time series prediction [70] and the same ap-proach was extended to forecast the electricity price. The approach is model free and heuristic in nature. A common framework called the fuzzy rule base is constructed to combine both numerical and linguistic informa-tion. The numerical information is sampled from measurements, and the linguistic information interprets the numerical information [71]. The FIS is able to bridge the gap between interpretability and accuracy by providing a verbally interpretable rule base and numerical accuracy through training. The FIS using wang-mendel learning algorithm does not require iterative training making it more efficient than ARMA or GARCH time series tech-niques and ANN or neuro-fuzzy intelligent systems [70].
Compared to the black box nature of Artificial Neural Network (ANN) the Fuzzy Inference System (FIS) provides a transparent linguistic rule base instead of a black box. The rules may be modified manually to include expert knowledge. The rule base provides FIS the advantage of interpretability and transparency. FIS also pro-vides flexibility in choosing predefined membership function. The FIS algorithm can be modified for higher ac-curacy and efficiency.
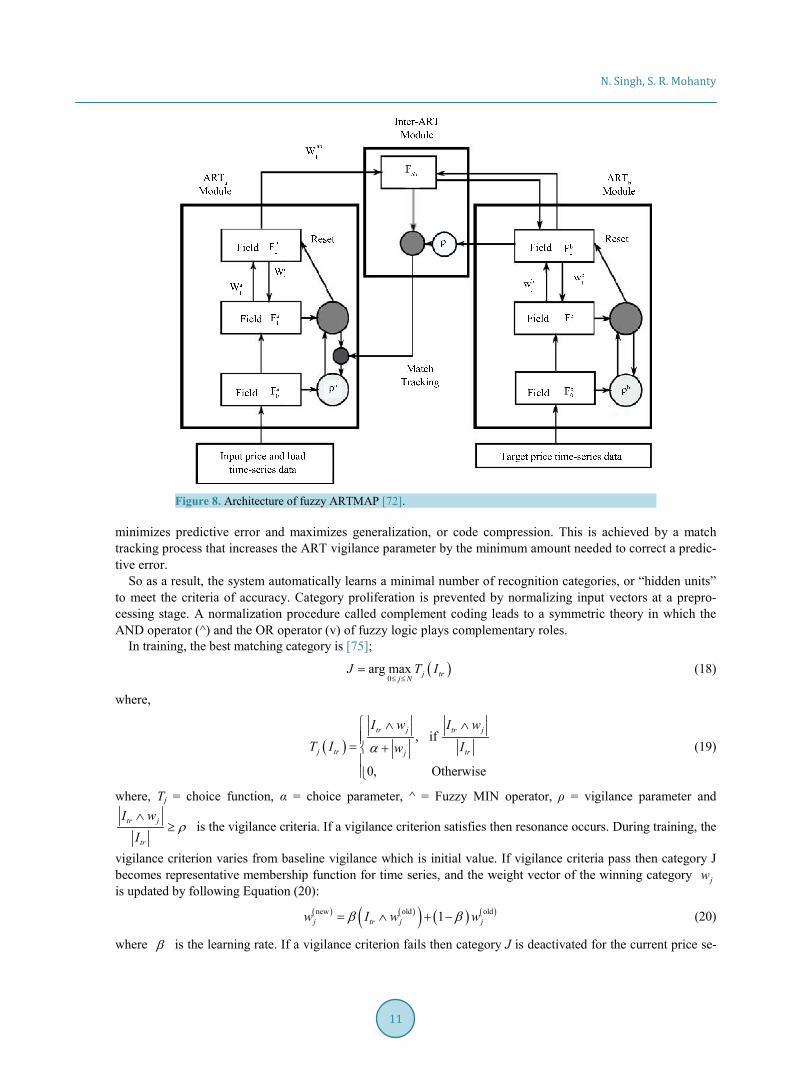
8.4. Fuzzy ARTMAP Based Model The Fuzzy ARTMAP is a new concept for electricity price forecasting [72], it has already been applied for wind speed forecasting [73] and load forecasting [74]. Mostly conventional neural networks suffers from plastici-ty-stability dilemma, i.e. the information related to the plasticity or adaptivity to the new inputs or change in in-puts at the same time stable in response [75] [76]. The fuzzy ARTMAP structure shown in Figure 8 addresses this dilemma by incorporating a feedback mechanism between the competitive and input layers to allow new in-formation to be learned without eliminating previously obtained knowledge, in this it becomes more stable and shows a faster convergence capability [77]. ARTMAP is a class of neural architectures that perform incremental supervised learning of recognition categories and multidimensional maps in response to input vectors presented in arbitrary order. An ARTMAP system embodies twin art modules (ARTa and ARTb) to fabricate stable recogni-tion categories corresponding to the arbitrary input patterns. ARTa uses ART-1 while ARTb uses FUZZY ART. This set up enables to switch the binary modules set theory notations to transform into a corresponding feature in the fuzzy ART module.
Example; the intersection operator (∩ ) of ART1 is replaced by the operator (^) in the FUZZY ART. The ar-chitecture, called fuzzy ARTMAP, achieves by synthesis of fuzzy logic and adaptive resonance theory (ART) neural network by employing a close formal similarity between two computations of fuzzy subsets and ART category, resonance, and learning. Fuzzy ARTMAP also actualize a new min-max learning rule that collectively
N. Singh, S. R. Mohanty
11
Figure 8. Architecture of fuzzy ARTMAP [72].
minimizes predictive error and maximizes generalization, or code compression. This is achieved by a match tracking process that increases the ART vigilance parameter by the minimum amount needed to correct a predic-tive error.
So as a result, the system automatically learns a minimal number of recognition categories, or “hidden units” to meet the criteria of accuracy. Category proliferation is prevented by normalizing input vectors at a prepro-cessing stage. A normalization procedure called complement coding leads to a symmetric theory in which the AND operator (^) and the OR operator (v) of fuzzy logic plays complementary roles.
In training, the best matching category is [75];
( )0
arg max j trj NJ T I
≤ ≤= (18)
where,
( ), if
0, Otherwise
tr j tr j
j tr trj
I w I wT I Iwα
∧ ∧= +
(19)
where, Tj = choice function, α = choice parameter, ^ = Fuzzy MIN operator, ρ = vigilance parameter and
tr j
tr
I w
Iρ
∧≥ is the vigilance criteria. If a vigilance criterion satisfies then resonance occurs. During training, the
vigilance criterion varies from baseline vigilance which is initial value. If vigilance criteria pass then category J becomes representative membership function for time series, and the weight vector of the winning category jw is updated by following Equation (20):
( ) ( )( ) ( ) ( )new old old1j tr j jw I w wβ β= ∧ + − (20)
where β is the learning rate. If a vigilance criterion fails then category J is deactivated for the current price se-
N. Singh, S. R. Mohanty
12
ries by setting choice function equals to zero. If ARTb does not predict the correct output for ARTa, then vigilance parameter is increased. This is called match tracking, in match tracking vigilance parameter is slightly increased to a new value:
tr j
tr
I w
Iρ ε
∧= + (21)
where ε is a learning precision. The scheme resizes a category on predictive success by amplifying the vigilance parameter ρ by a minimal
amount essential to verify the predictive error in the ARTb. The parameter ρ holds an inverse relationship with the category size. A lower value leads to a broadly generalized category with higher compressed code. This pa-rameter rates the minimum faith that ARTa should have while accepting a category during hypothesis testing which focuses ARTa on a new cluster. The failures at ARTa increase ρ to that threshold value which in turn triggers ARTa under a process called match tracking.
This technique reduces generalization essential to correct a predictive error. The combination of these tech-niques i.e. ARTMAP and Match tracking leads to a faster learning and erudition from a rare event. The fuzzy ART reduces to ART1 for a binary input and works as self for a binary input and works as self for an analog vector. Thus the crisp logics of ART-1 with their fuzzy counterparts form a potent module.
Once the training stage is completed, the Fuzzy ARTMAP network is used as a classifier of the input price series which is given to the ARTa. ARTb is not used during classifying process and the learning capability of the network is deactivated during classifying process (i.e. 0β = ). In this stage we get predicted classified labels in the output. These output labels are defuzzified for getting the forecasted price series. To find the best training parameters for the neural network some models use optimization algorithms for good results and comparatively low processing time.
9. Forecasting Models Based on Simulation Methods Simulation methods usually simulate generator dispatch patterns over an extended period of time. These methods mimic the actual dispatch with system operating requirements and constraints. Despite of the high data require-ment by these models, they can provide detailed insights into the price curve.
The simulation methods which are currently being used by the electric power industry range from the bub-ble-diagram type contract path models to production simulation models with full electrical representation, such as GE-MAPS software [10]. The production simulation models by nature of their chronological simulation pat-terns, will consider time varying systems limits and characteristics. Some important issues that must be ad-dressed in any market simulation program that forecast the LMPs for the electricity market are [10]: • Detailed transmission model • Unit commitment • Economic dispatch with transmission constraints • Secure dispatch • Chronological simulation • Large-scale study capability • Data resources • Benchmark and application
Simulation model known as MAPS, has been develop which stands for market assessment and portfolio strate-gies, this model incorporates a full representation of the electrical transmission model. The detailed power flow data and secure dispatch of generators, tracking transmission line flows, loss determination, and transaction eval-uation are well integrated, providing an accurate through time simulation of system operation.
The MAPS model is able to simulate large power system for one or multiple year within optimum period. The MAPS model can be applied to solve the following issues: • Analyze market power issues • Evaluate alternative market structures • Estimate stranded generation investments • Assess economics of building new generation • Assessing transmission costs
N. Singh, S. R. Mohanty
13
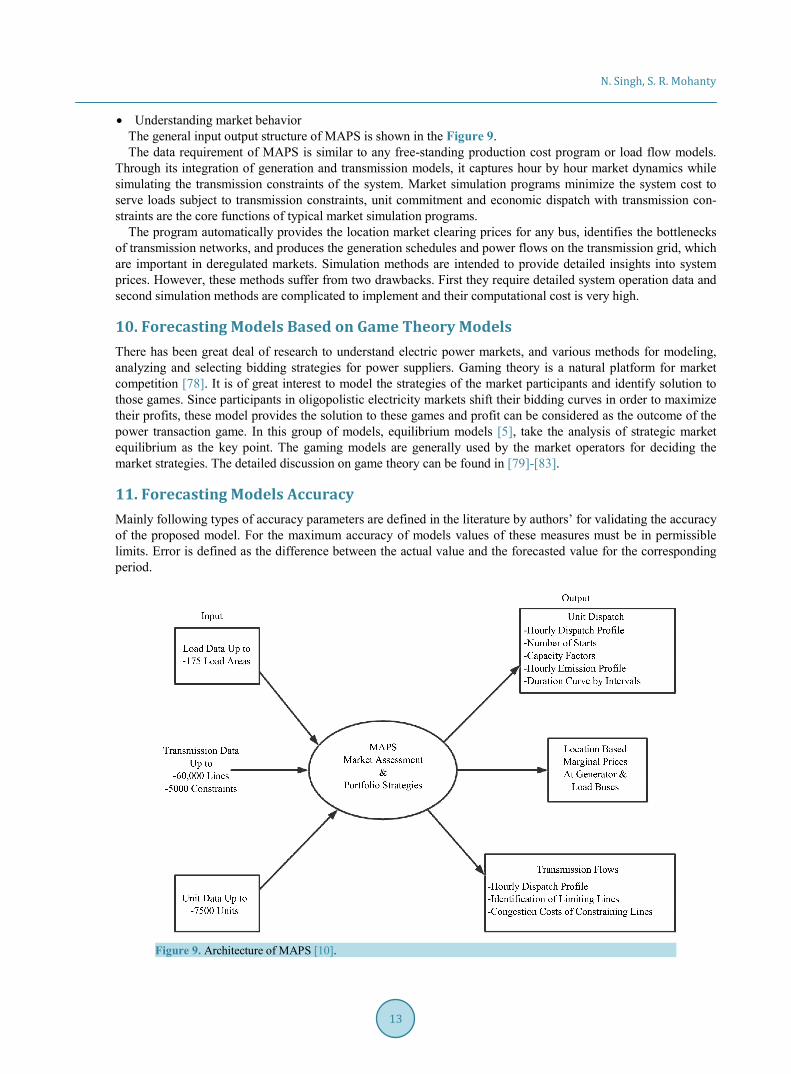
• Understanding market behavior The general input output structure of MAPS is shown in the Figure 9. The data requirement of MAPS is similar to any free-standing production cost program or load flow models.
Through its integration of generation and transmission models, it captures hour by hour market dynamics while simulating the transmission constraints of the system. Market simulation programs minimize the system cost to serve loads subject to transmission constraints, unit commitment and economic dispatch with transmission con-straints are the core functions of typical market simulation programs.
The program automatically provides the location market clearing prices for any bus, identifies the bottlenecks of transmission networks, and produces the generation schedules and power flows on the transmission grid, which are important in deregulated markets. Simulation methods are intended to provide detailed insights into system prices. However, these methods suffer from two drawbacks. First they require detailed system operation data and second simulation methods are complicated to implement and their computational cost is very high.
10. Forecasting Models Based on Game Theory Models There has been great deal of research to understand electric power markets, and various methods for modeling, analyzing and selecting bidding strategies for power suppliers. Gaming theory is a natural platform for market competition [78]. It is of great interest to model the strategies of the market participants and identify solution to those games. Since participants in oligopolistic electricity markets shift their bidding curves in order to maximize their profits, these model provides the solution to these games and profit can be considered as the outcome of the power transaction game. In this group of models, equilibrium models [5], take the analysis of strategic market equilibrium as the key point. The gaming models are generally used by the market operators for deciding the market strategies. The detailed discussion on game theory can be found in [79]-[83].
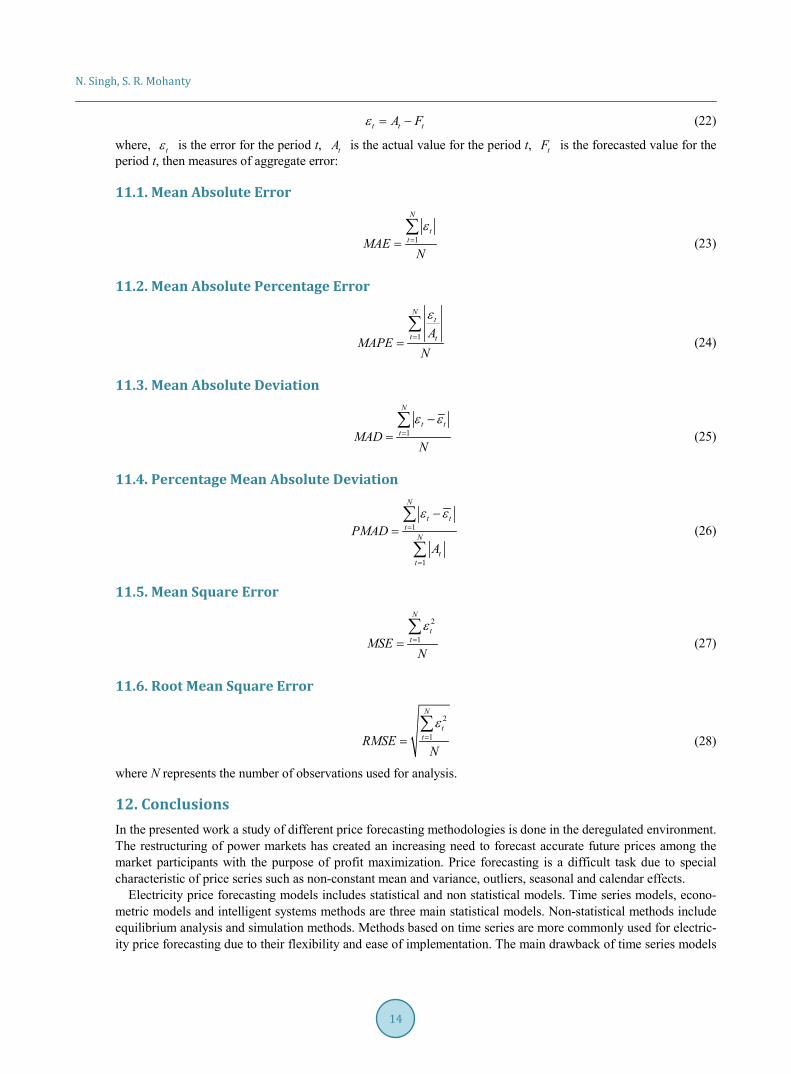
11. Forecasting Models Accuracy Mainly following types of accuracy parameters are defined in the literature by authors’ for validating the accuracy of the proposed model. For the maximum accuracy of models values of these measures must be in permissible limits. Error is defined as the difference between the actual value and the forecasted value for the corresponding period.
Figure 9. Architecture of MAPS [10].
N. Singh, S. R. Mohanty
14
t t tA Fε = − (22)
where, tε is the error for the period t, tA is the actual value for the period t, tF is the forecasted value for the period t, then measures of aggregate error:
11.1. Mean Absolute Error
1
N
ttMAE
N
ε==∑
(23)
11.2. Mean Absolute Percentage Error
1
Nt
t tAMAPE
N
ε==∑
(24)
11.3. Mean Absolute Deviation
1
N
t ttMAD
N
ε ε=
−=∑
(25)
11.4. Percentage Mean Absolute Deviation
1
1
N
t tt
N
tt
PMADA
ε ε=
=
−=∑
∑ (26)
11.5. Mean Square Error
2
1
N
ttMSE
N
ε==∑
(27)
11.6. Root Mean Square Error
2
1
N
ttRMSE
N
ε==∑
(28)
where N represents the number of observations used for analysis.
12. Conclusions In the presented work a study of different price forecasting methodologies is done in the deregulated environment. The restructuring of power markets has created an increasing need to forecast accurate future prices among the market participants with the purpose of profit maximization. Price forecasting is a difficult task due to special characteristic of price series such as non-constant mean and variance, outliers, seasonal and calendar effects.
Electricity price forecasting models includes statistical and non statistical models. Time series models, econo-metric models and intelligent systems methods are three main statistical models. Non-statistical methods include equilibrium analysis and simulation methods. Methods based on time series are more commonly used for electric-ity price forecasting due to their flexibility and ease of implementation. The main drawback of time series models
N. Singh, S. R. Mohanty
15
is that they are usually based on the hypothesis of stationarity, whereas the price series violates this assumption. The scope of forecast (e.g. price profile, or its volatility etc.) is an important factor for the selection and design
of forecasting models/techniques. The complexity of model(s) also largely determines the number of required in-put data. Depending on the target of forecast, the procedure may apply data filtering and transformation before the model is optimized for the given price data. Wavelet transform is generally used for smoothening the price data, and removing seasonal effect, outliers and other irregularity effects, the result of the approximated series under wavelet transform is better than the original price data and more stable mean and variance with no outliers.
It can be concluded that there is no universal tool for price forecasting which can be used for every market and operator. For specific applications it becomes essential to select the specific tool/techniques, and following points should be kept in mind: 1) Type of forecast (i.e. long term, medium term, short term). 2) Available resources for processing, storing the historical data of the price. 3) Importance of accuracy in forecasting.
By combining wavelet transform with ARIMA, GARCH, Neural Network and other models, the performance characteristics of these models can be increased by reducing forecasting errors.
References [1] Hu, L., Taylor, G., Wan, H.-B. and Irving, M. (2009) A Review of Short-Term Electricity Price Forecasting Tech-
niques in Deregulated Electricity Markets. Universities Power Engineering Conference (UPEC), 2009 Proceedings of the 44th International, Glasgow, 1-4 September 2009, 1-5.
[2] Aggarwal, S.K., Saini, L.M. and Kumar, A. (2009) Electricity Price Forecasting in Deregulated Markets: A Review and Evaluation. International Journal of Electrical Power & Energy Systems, 31, 13-22. http://dx.doi.org/10.1016/j.ijepes.2008.09.003
[3] Taylor, G., Irving, M. and Hu, L.L. (2008) A Fuzzy-Logic Based Bidding Strategy for Participants in the UK Electric-ity Market. Padova, 1-5.
[4] Hu, L. (2006) Optimal Bidding Strategy for Power Producers in the UK Electricity Market. MPhil Thesis, School of Engineering and Design, Brunel University, London.
[5] Bunn, D.W. (2000) Forecasting Loads and Prices in Competitive Power Markets. Proceedings of the IEEE, 88, 163- 169. http://dx.doi.org/10.1109/5.823996
[6] González, A.M., Roque, A.M.S. and García-González, J. (2005) Modeling and Forecasting Electricity Prices with In-put/Output Hidden Markov Models. IEEE Transactions on Power Systems, 20, 13-24. http://dx.doi.org/10.1109/TPWRS.2004.840412
[7] Georgilakis, P.S. (2006) Market Clearing Price Forecasting in Deregulated Electricity Markets Using Adaptively Trained Neural Networks. Advances in Artificial Intelligence, Lecture Notes in Computer Science, 3955, 56-66.
[8] Mandal, P., Senjyu, T. and Funabashi, T. (2006) Neural Networks Approach to Forecast Several Hour Ahead Electric-ity Prices and Loads in Deregulated Market. Energy Conversion and Management, 47, 2128-2142. http://dx.doi.org/10.1016/j.enconman.2005.12.008
[9] Vucetic, S., Tomsovic, K. and Obradovic, Z. (2001) Discovering Price-Load Relationships in California’s Electricity Market. IEEE Transactions on Power Systems, 16, 280-286. http://dx.doi.org/10.1109/59.918299
[10] Bastian, J., Zhu, J., Banunarayanan, V. and Mukerji, R. (1999) Forecasting Energy Prices in a Competitive Market. IEEE Computer Applications in Power, 12, 40-45. http://dx.doi.org/10.1109/67.773811
[11] Kian, A. and Keyhani, A. (2001) Stochastic Price Modeling of Electricity in Deregulated Energy Markets. Proceedings of the 34th Annual Hawaii International Conference on System Sciences, Maui, 6 January 2001, 7.
[12] Nogales, F.J., Contreras, J., Conejo, A.J. and Espinola, R. (2002) Forecasting Next-Day Electricity Prices by Time Se-ries Models. IEEE Transactions on Power Systems, 17, 342-348. http://dx.doi.org/10.1109/TPWRS.2002.1007902
[13] Szkuta, B.R., Sanabria, L.A. and Dillon, T.S. (1999) Electricity Price Short-Term Forecasting Using Artificial Neural Networks. IEEE Transactions on Power Systems, 14, 851-857. http://dx.doi.org/10.1109/59.780895
[14] Zhang, L. and Luh, P.B. (2005) Neural Network-Based Market Clearing Price Prediction and Confidence Interval Es-timation with an Improved Extended Kalman Filter Method. IEEE Transactions on Power Systems, 20, 59-66. http://dx.doi.org/10.1109/TPWRS.2004.840416
[15] Lucarella, D., Venturini, A., Canazza, V., Li, G. and Liu, C.C. (2005) An Intelligent System for Price Forecasting Ac-curacy Assessment. Proceedings of the 13th International Conference on Intelligent Systems Application to Power Systems, Arlington, 6-10 November 2005, 92-99.
N. Singh, S. R. Mohanty
16
[16] Amjady, N. and Hemmati, M. (2006) Energy Price Forecasting—Problems and Proposals for Such Predictions. IEEE Power and Energy Magazine, 4, 20-29. http://dx.doi.org/10.1109/MPAE.2006.1597990
[17] Zhou, M., Yan, Z., Ni, Y.X., Li, G. and Nie, Y. (2006) Electricity Price Forecasting with Confidence-Interval Estima-tion through an Extended ARIMA Approach. IEE Proceedings—Generation, Transmission and Distribution, 153, 187. http://dx.doi.org/10.1049/ip-gtd:20045131
[18] Nicolaisen, J.D., Richter, C.W. and Sheble, G.B. (2000) Price Signal Analysis for Competitive Electric Generation Companies. International Conference on Electric Utility Deregulation and Restructuring and Power Technologies, London, 4-7 April 2000, 66-71.
[19] Antunes, J.F., de Souza Araujo, N.V. and Minussi, C.R. (2013) Multinodal Load Forecasting Using an ART- ARTMAP-Fuzzy Neural Network and PSO Strategy. 2013 IEEE Grenoble PowerTech, Grenoble, 16-20 June 2013, 1-6. http://dx.doi.org/10.1109/ptc.2013.6652373
[20] Niimura, T. (2006) Forecasting Techniques for Deregulated Electricity Market Prices—Extended Survey. 2006 IEEE PES Power Systems Conference and Exposition, Atlanta, 29 October-1 November 2006, 51-56. http://dx.doi.org/10.1109/psce.2006.296248
[21] Ramos, J.L.M., Exposito, A.G., Santos, J.M.R., Lora, A.T. and Guerra, A.R.M. (2002) Influence of ANN-Based Mar-ket Price Forecasting Uncertainty on Optimal Bidding. PSCC Power Systems Computation Conference, Seville, 24-28 June 2002, 24-28.
[22] Rashidi-Nejad, M., Gharaveisi, A., Khajehzadeh, A. and Salehizadeh, M. (2006) Eelctricity Price Forecasting Using WaveNet. 2006 Large Engineering Systems Conference on Power Engineering, Halifax, 26-28 July 2006, 131-137. http://dx.doi.org/10.1109/lescpe.2006.280375
[23] Osorio, G.J., Pousinho, H.M.I., Matias, J.C.O. and Catalao, J.P.S. (2012) Intelligent Approach for Forecasting in Pow-er Engineering Systems. 2012 IEEE 16th International Conference on Intelligent Engineering Systems, Lisbon, 13-15 June 2012, 297-302. http://dx.doi.org/10.1109/ines.2012.6249848
[24] Negnevitsky, M., Mandal, P. and Srivastava, A.K. (2009) An Overview of Forecasting Problems and Techniques in Power Systems. IEEE Power & Energy Society General Meeting, Calgary, 26-30 July 2009, 1-4. http://dx.doi.org/10.1109/pes.2009.5275480
[25] Mori, H. and Kosemura, N. (2002) A Data Mining Method for Short-Term Load Forecasting in Power Systems. Elec-trical Engineering in Japan, 139, 12-22. http://dx.doi.org/10.1002/eej.1150
[26] Mandal, P., Senjyu, T., Urasaki, N., Funabashi, T. and Srivastava, A.K. (2007) A Novel Approach to Forecast Electric-ity Price for PJM Using Neural Network and Similar Days Method. IEEE Transactions on Power Systems, 22, 2058- 2065. http://dx.doi.org/10.1109/TPWRS.2007.907386
[27] Varadan, V., Leung, H. and Bosse, E. (2006) Dynamical Model Reconstruction and Accurate Prediction of Power-Pool Time Series. IEEE Transactions on Instrumentation and Measurement, 55, 327-336. http://dx.doi.org/10.1109/TIM.2005.861492
[28] Mount, T.D., Ning, Y. and Cai, X. (2006) Predicting Price Spikes in Electricity Markets Using a Regime-Switching Model with Time-Varying Parameters. Energy Economics, 28, 62-80. http://dx.doi.org/10.1016/j.eneco.2005.09.008
[29] Sueyoshi, T. and Tadiparthi, G.R. (2005) A Wholesale Power Trading Simulator with Learning Capabilities. IEEE Transactions on Power Systems, 20, 1330-1340. http://dx.doi.org/10.1109/TPWRS.2005.851948
[30] Batlle, C. and Barquin, J. (2005) A Strategic Production Costing Model for Electricity Market Price Analysis. IEEE Transactions on Power Systems, 20, 67-74. http://dx.doi.org/10.1109/TPWRS.2004.831266
[31] Lu, X., Dong, Z.Y. and Li, X. (2005) Electricity Market Price Spike Forecast with Data Mining Techniques. Electric Power Systems Research, 73, 19-29. http://dx.doi.org/10.1016/S0378-7796(04)00125-7
[32] Figueiredo, M., Ballini, R., Soares, S., Andrade, M. and Gomide, F. (2004) Learning Algorithms for a Class of Neuro-fuzzy Network and Application. IEEE Transactions on Systems, Man, and Cybernetics—Part C: Applications and Re-views, 34, 293-301.
[33] Luh, P.B. and Guo, J.-J. (2003) Selecting Input Factors for Clusters of Gaussian Radial Basis Function Networks to Improve Market Clearing Price Prediction. IEEE Transactions on Power Systems, 18, 665-672. http://dx.doi.org/10.1109/TPWRS.2003.811012
[34] Hong, Y.-Y. and Hsiao, C.-Y. (2002) Locational Marginal Price Forecasting in Deregulated Electricity Markets Using Artificial Intelligence. IEE Proceedings—Generation, Transmission and Distribution, 149, 621. http://dx.doi.org/10.1049/ip-gtd:20020371
[35] Davison, M., Anderson, C.L., Marcus, B. and Anderson, K. (2002) Development of a Hybrid Model for Electrical Power Spot Prices. IEEE Transactions on Power Systems, 17, 257-264. http://dx.doi.org/10.1109/TPWRS.2002.1007890
N. Singh, S. R. Mohanty
17
[36] Martinez, R., Srivastava, A.K., Mandal, P., Haque, A.U. and Meng, J. (2012) A Hybrid Intelligent Algorithm for Short-Term Energy Price Forecasting in the Ontario Market. 2012 IEEE Power and Energy Society General Meeting, San Diego, 22-26 July 2012, 1-7.
[37] Zhang, B.-L. and Dong, Z.-Y. (2001) An Adaptive Neural-Wavelet Model for Short Term Load Forecasting. Electric Power Systems Research, 59, 121-129. http://dx.doi.org/10.1016/S0378-7796(01)00138-9
[38] Huang, C.-M. and Yang, H.-T. (2001) Evolving Wavelet-Based Networks for Short-Term Load Forecasting. IEE Pro-ceedings—Generation, Transmission and Distribution, 148, 222. http://dx.doi.org/10.1049/ip-gtd:20010286
[39] Conejo, A.J., Contreras, J., Espínola, R. and Plazas, M.A. (2005) Forecasting Electricity Prices for a Day-Ahead Pool-Based Electric Energy Market. International Journal of Forecasting, 21, 435-462. http://dx.doi.org/10.1016/j.ijforecast.2004.12.005
[40] Conejo, A.J., Plazas, M.A., Espinola, R. and Molina, A.B. (2005) Day-Ahead Electricity Price Forecasting Using the Wavelet Transform and ARIMA Models. IEEE Transactions on Power Systems, 20, 1035-1042. http://dx.doi.org/10.1109/TPWRS.2005.846054
[41] Zheng, G., Yan, X.-M., Li, H.-W. and Liu, D. (2004) Classification of Voltage Sag Based on Wavelet Transform and Wavelet Network. Proceedings of 2004 International Conference on Machine Learning and Cybernetics, 1, 466-470. http://dx.doi.org/10.1109/icmlc.2004.1380734
[42] Mallat, S.G. (1989) A Theory for Multiresolution Signal Decomposition: The Wavelet Representation. IEEE Transac-tions on Pattern Analysis and Machine Intelligence, 11, 674-693. http://dx.doi.org/10.1109/34.192463
[43] Xu, H.T. and Niimura, T. (2004) Short-Term Electricity Price Modeling and Forecasting Using Wavelets and Multiva-riate Time Series. 858-862.
[44] Atiya, A., Talaat, N. and Shaheen, S. (1997) An Efficient Stock Market Forecasting Model Using Neural Networks. Proceedings of International Conference on Neural Networks, Vol. 4, Houston, 9-12 June 1997, 2112-2115. http://dx.doi.org/10.1109/icnn.1997.614231
[45] Mishra, S., Sharma, A. and Panda, G. (2011) Wind Power Forecasting Model Using Complex Wavelet Theory. 2011 International Conference on Energy, Automation and Signal, Bhubaneswar, 28-30 December 2011, 1-4. http://dx.doi.org/10.1109/iceas.2011.6147151
[46] Al Wadia, M.T.I.S. and Tahir Ismail, M. (2011) Selecting Wavelet Transforms Model in Forecasting Financial Time Series Data Based on ARIMA Model. Applied Mathematical Sciences, 5, 315-326.
[47] Contreras, J., Espinola, R., Nogales, F.J. and Conejo, A.J. (2003) ARIMA Models to Predict Next-Day Electricity Prices. IEEE Transactions on Power Systems, 18, 1014-1020. http://dx.doi.org/10.1109/TPWRS.2002.804943
[48] Weiss, E. (2000) Forecasting Commodity Prices Using ARIMA. Technical Analysis of Stocks & Commodities, 18, 18-19.
[49] Chinn, M.D., LeBlanc, M. and Coibion, O. (2001) The Predictive Characteristics of Energy Futures: Recent Evidence for Crude Oil, Natural Gas, Gasoline and Heating Oil. UCSC Dept. of Economics Working Paper No. 490.
[50] Hagan, M.T. and Behr, S.M. (1987) The Time Series Approach to Short Term Load Forecasting. IEEE Transactions on Power Systems, 2, 785-791. http://dx.doi.org/10.1109/TPWRS.1987.4335210
[51] Hamilton, J.D. (1994) Time Series Analysis, 2. Princeton University Press, Princeton. [52] Enders, W. (2008) Applied Econometric Time Series. John Wiley & Sons, Hoboken. [53] Garcia, R.C., Contreras, J., van Akkeren, M. and Garcia, J.B.C. (2005) A GARCH Forecasting Model to Predict
Day-Ahead Electricity Prices. IEEE Transactions on Power Systems, 20, 867-874. http://dx.doi.org/10.1109/TPWRS.2005.846044
[54] Bollerslev, T. and Ole Mikkelsen, H. (1996) Modeling and Pricing Long Memory in Stock Market Volatility. Journal of Econometrics, 73, 151-184. http://dx.doi.org/10.1016/0304-4076(95)01736-4
[55] Tan, Z., Zhang, J., Wang, J. and Xu, J. (2010) Day-Ahead Electricity Price Forecasting Using Wavelet Transform Combined with ARIMA and GARCH Models. Applied Energy, 87, 3606-3610. http://dx.doi.org/10.1016/j.apenergy.2010.05.012
[56] Baba, N. and Kozaki, M. (1992) An Intelligent Forecasting System of Stock Price Using Neural Networks. Interna-tional Joint Conference on Neural Networks, Vol. 1, Baltimore, 7-11 June 1992, 371-377. http://dx.doi.org/10.1109/ijcnn.1992.287183
[57] Snyder, J., Sweat, J., Richardson, M. and Pattie, D. (1992) Developing Neural Networks to Forecast Agricultural Commodity Prices. Proceedings of the 25th Hawaii International Conference on System Sciences, Vol. 4, Kauai, 7-10 Jan 1992, 516-522. http://dx.doi.org/10.1109/hicss.1992.183442
[58] Mandal, P., Senjyu, T., Uezato, K. and Funabashi, T. (2005) Several-Hours-Ahead Electricity Price and Load Fore-casting Using Neural Networks. IEEE Power Engineering Society General Meeting, San Francisco, 12-16 June 2005,
N. Singh, S. R. Mohanty
18
2205-2212. http://dx.doi.org/10.1109/pes.2005.1489530 [59] Amjady, N. and Daraeepour, A. (2008) Day-Ahead Electricity Price Forecasting Using the Relief Algorithm and Neur-
al Networks. 5th International Conference on European Electricity Market, Lisboa, 28-30 May 2008, 1-7. http://dx.doi.org/10.1109/eem.2008.4579109
[60] Haykin, S. (2004) Neural Networks: A Comprehensive Foundation. 2nd Edition. [61] Srinivasan, D., Yong, F.C. and Liew, A.C. (2007) Electricity Price Forecasting Using Evolved Neural Networks. In-
ternational Conference on Intelligent Systems Applications to Power Systems, Toki Messe, 5-8 November 2007, 1-7. http://dx.doi.org/10.1109/isap.2007.4441660
[62] Mori, H. and Awata, A. (2006) A Hybrid Method of Clipping and Artificial Neural Network for Electricity Price Zone Forecasting. International Conference on Probabilistic Methods Applied to Power Systems, Stockholm, 11-15 June 2006, 1-6. http://dx.doi.org/10.1109/pmaps.2006.360234
[63] Azevedo, F. and Vale, Z. (2006) Forecasting Electricity Prices with Historical Statistical Information Using Neural Networks and Clustering Techniques. 2006 IEEE PES Power Systems Conference and Exposition, Atlanta, 29 Octo-ber-1 November 2006, 44-50. http://dx.doi.org/10.1109/psce.2006.296247
[64] Zhang, X., Wang, X.-F., Chen, F.-H., Ye, B. and Chen, H.-Y. (2005) Short-Term Electricity Price Forecasting Based on Period-Decoupled Price Sequence. Proceedings of CSEE, 25, 1-6.
[65] Luh, P.B., Kasiviswanathan, K. and Zhang, L. (2003) Energy Clearing Price Prediction and Confidence Interval Esti-mation with Cascaded Neural Networks. IEEE Transactions on Power Systems, 18, 99-105. http://dx.doi.org/10.1109/TPWRS.2002.807062
[66] Bashir, Z.A. and El-Hawary, M.E. (2009) Applying Wavelets to Short-Term Load Forecasting Using PSO-Based Neural Networks. IEEE Transactions on Power Systems, 24, 20-27. http://dx.doi.org/10.1109/TPWRS.2008.2008606
[67] Singh, N.K., Tripathy, M. and Singh, A.K. (2011) A Radial Basis Function Neural Network Approach for Multi-Hour Short Term Load-Price Forecasting with Type of Day Parameter. 2011 6th IEEE International Conference on Industri-al and Information Systems, Kandy, 16-19 August 2011, 316-321. http://dx.doi.org/10.1109/iciinfs.2011.6038087
[68] Jang, J.-S.R. (1993) ANFIS: Adaptive-Network-Based Fuzzy Inference System. IEEE Transactions on Systems, Man, and Cybernetics, 23, 665-685. http://dx.doi.org/10.1109/21.256541
[69] Hong, Y.-Y. and Lee, C.-F. (2005) A Neuro-Fuzzy Price Forecasting Approach in Deregulated Electricity Markets. Electric Power Systems Research, 73, 151-157. http://dx.doi.org/10.1016/j.epsr.2004.07.002
[70] Wang, L.-X. and Mendel, J.M. (1992) Generating Fuzzy Rules by Learning from Examples. IEEE Transactions on Systems, Man, and Cybernetics, 22, 1414-1427. http://dx.doi.org/10.1109/21.199466
[71] Nauck, D.D. (2000) Data Analysis with Neuro-Fuzzy Methods. [72] Mandal, P., Haque, A.U., Meng, J., Srivastava, A.K. and Martinez, R. (2013) A Novel Hybrid Approach Using Wave-
let, Firefly Algorithm, and Fuzzy ARTMAP for Day-Ahead Electricity Price Forecasting. IEEE Transactions on Power Systems, 28, 1041-1051. http://dx.doi.org/10.1109/TPWRS.2012.2222452
[73] Ul Haque, A. and Meng, J. (2011) Short-Term Wind Speed Forecasting Based on Fuzzy Artmap. International Journal of Green Energy, 8, 65-80. http://dx.doi.org/10.1080/15435075.2010.529784
[74] Lopes, M.L.M., Minussi, C.R. and Lotufo, A.D.P. (2005) Electric Load Forecasting Using a Fuzzy ART&ARTMAP Neural Network. Applied Soft Computing, 5, 235-244. http://dx.doi.org/10.1016/j.asoc.2004.07.003
[75] Christodoulou, C. and Georgiopoulos, M. (2000) Applications of Neural Networks in Electromagnetics. Artech House, Inc., Norwood.
[76] Dagher, I., Georgiopoulos, M., Heileman, G.L. and Bebis, G. (1999) An Ordering Algorithm for Pattern Presentation in Fuzzy ARTMAP That Tends to Improve Generalization Performance. IEEE Transactions on Neural Networks, 10, 768-778. http://dx.doi.org/10.1109/72.774217
[77] Zornetzer, S.F., Davis, J.L. and Lau, C. (1990) An Introduction to Neural and Electronic Networks. Academic Press Professional, Inc., Waltham.
[78] Osborne, M.J. and Rubinstein, A. (1994) A Course in Game Theory. MIT Press, Cambridge, MA. [79] Bajpai, P. and Singh, S.N. (2004) Bidding and Gaming in Electricity Market: An Overview and Key Issues. Proceed-
ings of National Power System Conference (NPSC), Chennai, 27-30 December 2004, 338-346. [80] Kleindorfer, P.R., Wu, D.-J. and Fernando, C.S. (2001) Strategic Gaming in Electric Power Markets. European Jour-
nal of Operational Research, 130, 156-168. http://dx.doi.org/10.1016/S0377-2217(00)00048-5 [81] David, A.K. and Wen, F.S. (2000) Strategic Bidding in Competitive Electricity Markets: A Literature Survey. 2000
Power Engineering Society Summer Meeting, Vol. 4, Seattle, 16-20 July 2000, 2168-2173. http://dx.doi.org/10.1109/pess.2000.866982

N. Singh, S. R. Mohanty
19
[82] Hobbs, B.F., Metzler, C.B. and Pang, J.-S. (2000) Strategic Gaming Analysis for Electric Power Systems: An MPEC Approach. IEEE Transactions on Power Systems, 15, 638-645. http://dx.doi.org/10.1109/59.867153
[83] Pepyne, D.L., Guan, X.H. and Ho, Y.-C. (2001) Gaming and Price Spikes in Electric Power Markets. IEEE Transac-tions on Power Systems, 16, 402-408. http://dx.doi.org/10.1109/59.932275