a reassessment of hydrocarbon prospectivity of …
TRANSCRIPT
Ife Journal of Science vol. 18, no. 2 (2016)
A REASSESSMENT OF HYDROCARBON PROSPECTIVITY OF THE CHAD BASIN, NIGERIA, USING MAGNETIC HYDROCARBON INDICATORS FROM HIGH-
RESOLUTION AEROMAGNETIC IMAGING
Aderoju, A. B., Ojo S. B., Adepelumi, A. A. and Edino, F.Department of Geology, Obafemi Awolowo University, Ile-Ife, Nigeria
*Corresponding Author: E-mail address: [email protected] th(Received: 26 May, 2016; Accepted: 8 June, 2016)
High resolution digital aeromagnetic data acquired by the Nigerian Geologic Survey Agency (NGSA) over a part
of the Chad Basin, Nigeria, were analyzed to investigate the hydrocarbon prospectivity of the basin using various
magnetic hydrocarbon indicators. The digital aeromagnetic data were processed to produce total magnetic
intensity and residual magnetic maps, and further transformed into Reduced-to-the-Equator map to remove the
asymmetry associated with low latitude magnetic anomalies. Horizontal, vertical, and tilt derivatives, and 3D
Euler deconvolution analyses were used to map the geometry and depth of basement rocks. Intra-sedimentary
magnetic anomalies with possible association with hydrocarbon occurrence were enhanced by the application of
band pass filters. The derivative maps revealed parallel to sub-parallel trending NE-SW, NW-SE and E-W
lineaments probably caused by fracture zones in the basement underlying the study area, some of which
propagate as faults into the overlying sedimentary formations. The thickness of the sediments in the study area
ranged from 1.5 km in the north-eastern region, 6.0 km in the south-eastern region to 7.0 km in the eastern
region. The band-pass filtered map displayed some magnetic aureoles (circular magnetic low surrounded on all
sides by magnetic high), often associated with hydrocarbon seepages. These aureoles characterize the deepest
parts of the basin in the east-central and south-western parts, far removed from the existing exploratory wells
that are mostly dry. It was concluded that the east-central and south-eastern parts of the basin investigated with
a combination of favorably thick sedimentary formation, faults, fractures and magnetic aureoles probably
represented areas of better potential for hydrocarbon exploration and were thus recommended for detailed
seismic surveys.
Keywords: Chad Basin, Hydrocarbon Prospectivity, High-resolution Aeromagnetic Imaging, Magnetic
Hydrocarbon Indicators.
ABSTRACT
503
INTRODUCTIONMuch has been written on the hydrocarbon prospectivity of the Nigerian Sector of the Chad Basin (Fig. 1) (see for example Obaje et al., 2006; Mohammed, 2010; Adepelumi et al., 2010, 2011, and 2012; Mohammed and Tela, 2012; Mijinyawa et al., 2013;). On the basis of discoveries of oil in sectors of other bounding countries, it has been strongly suspected that there are commercial quantities of oil in the Nigerian sector of the basin despite several unsuccessful attempts by several oil companies to find it. The Federal Government of Nigeria, through the Nigerian National Petroleum Corporation (NNPC) has acquired about 33,642 km of 2-D seismic data, more recently 3-D seismic data, and drilled a total of 23 exploration wells in the area (DPR, 2005). However, commercial quantities of oil and/or gas are yet to be found or proven.
The current study was therefore an attempt to identify prospective areas for hydrocarbon exploration by collating, analyzing and interpreting new digital magnetic data and comparing the results with those of some exploratory wells in the area. The study was inspired by the fact that the geology of the Nigerian sector of the Chad Basin can be correlated with that of the contiguous Termit Basin in Niger and Chad Republics (Fig. 2) where oil discoveries have been made (Braide, 1990). Total speculative oil reserves of the Bolobo, Kome and Miandoum Oil Fields in the Doba Basin are about 900 million barrels based on geological, geophysical mapping and reservoir parameters derived from technical studies of nearby oil pools.

504
oo
o
Fig. 1: Geologic Map of Nigeria Indicating the Chad (Bornu) Basin (Adapted from Obaje et al., 2006).
Fig. 2: Chad Basin within the West and Central African Rift System Showing the Location of the Chad (Bornu), Termit, Doba, Doseo, and Salamat Basins Relative to Each Other (after Genik, 1992).
Aderoju et al.: A Reassessment of Hydrocarbon Prospectivity of the Chad Basin
OIL DISCOVERIES
STUDY AREA
NIGER
BONGOR

505
Afrol News (2007) reported that 265 oil wells were drilled in the Doba Basin oil fields, and it was planned to export 900 million barrels of oil over the next 25 years. Furthermore, the results of earlier studies carried out on the contiguous Niger Delta and Anambra Basin (Oladele et al., 2008; Ojo et al., 2009, 2012) confirmed results of other studies (Foote, 1997; Urquhart, 2003; Stone et al., 2004) that a correlation exists between the presence of intrasedimentary magnetic anomalies and hydrocarbon producing areas.
The current study area is limited to within latitudes o o o
11.75 N and 13.00 N and longitudes 12.00 E and o
14.00 E (Fig. 1). It encompasses the southeastern Nigerian portion of Lake Chad Basin (also known
2as the Bornu Basin), with an area of 27,225 km . The area is bounded to the north by Termit Basin (Niger Republic), to the south by Yola Basin and the Benue Trough (Nigeria), to the east by Bongor and Doba Basins (Chad Republic) and to the west by Gongola Basin (Nigeria) (Fig. 2). The Chad Basin is an intracratonic basin (Burke, 1976) that formed in response to the Gondwana break-up and subsequent separation of the South American and African plates. It belongs to the West and Central African Rift System (WCARS) described by Genik (1992) (Fig. 2).
The West and Central African Rift System (WCARS) is a zone of crustal weakening and thinning that failed to separate, which resulted in a series of depressions that were filled with mainly sedimentary rocks. It extends from Nigeria to Kenya. The WCARS is divided into a series of related smaller basins which include: (a) Termit Basin in Niger/Chad (b) Muglad Basin in Sudan and (c) Doba, Doseo, Salamat in Chad and Central African Republic (Fig. 2)
Given this background, the main objectives of the current study were therefore to, (i) prepare a Total Magnetic Intensity (TMI) map of the study area from the available high resolution digital aeromagnetic data; (ii) carry out data transform on the TMI data to obtain Reduced-to-the-Equator (RTE) version; (iii) identify, isolate and
characterize the aeromagnetic anomalies within the sedimentary section and the basement; (iv) examine if there is an association of intra-sedimentary magnetic anomalies with the locations of any of the exploratory wells with oil shows; and (v) delineate areas with good potential for future hydrocarbon exploration.
MATERIALS AND METHODS
The Aeromagnetic Data
The total field aeromagnetic data used in this study were supplied by the Nigerian Geological Survey Agency (NGSA). The data covered an area of
227,225 km and consisted of a system of equally spaced NW-SE oriented flight lines at 0.5 km interval and a nominal flight altitude of 80 m ground clearance. Tie-lines were flown in a NE-SW direction at 2 km interval.
Well InformationInformation from fifteen wells acquired by the Nigerian National Petroleum Corporation (NNPC) was used for this study. The locations of these wells are shown in Figure 3. These wells were for the most part dry while a few had some gas or oil shows (Table 1). The deepest of the wells (Kinassar-01) attained a depth of 4,665 m while the shallowest (Bulte-01) reached a depth of 1,465 m. Five of the wells reached the basement at varying depths and consequently provided controls for depth to basement analyses in this study. The wells are SA-01 (2394 m), Kinassar-01 (4665 m), Ngor North (3204 m), Ngammaeast (3270 m) and Ziye (3375 m).
MethodologyThe digital aeromagnetic data were processed
TMusing the Oasis montaj software from which the total magnetic intensity (TMI) and the residual magnetic maps were produced. The total magnetic intensity (TMI) map was transformed into Reduced-to-the-Equator (RTE) map in order to remove the asymmetry associated with low magnetic latitude anomalies, and to directly position observed magnetic anomalies over their respective causative source bodies.
Aderoju et al.: A Reassessment of Hydrocarbon Prospectivity of the Chad Basin

506
Other transformation techniques such as horizontal and vertical derivatives (Phillips, 2000), and vertical continuations were carried out on the data to map various contacts and fracture zones in the deep basement. The enhancement of intra-sedimentary magnetic anomalies having possible association with hydrocarbon occurrence (MHIs) was also explored by the application of band pass filters to TMI-RTE data as outlined by Stone et al. (2004).
840000 860000 880000 900000 920000 940000 960000 980000
1280000
1300000
1320000
1340000
1360000
1380000
1400000
1420000
1440000
Ngor Ngamma
Gubio
Murshe Sa
Kanadi
Tuma
Wadi Masu
Kinassar
Bulte
Kasade
Gaibu Ziye
Krumta
Fig. 3. Base Map Showing Well Locations Based on Coordinates Supplied by NNPC (The Vertical and Horizontal Axes Represent Northings and Eastings (in metres) Respectively).
Table 1. Status of Fifteen Wells Drilled in Different Sections of the Study Area by the NNPC
________________________________S/N Well Name Well Prognosis____________________________________1 Ngornorth-1 Dry2 Ngammaeast-1 Dry3 Gubio Dry4 Kinassar-1 Gas show5 SA-01 Gas show6 Ziye-1 Gas show 7 Murshe-01 Gas show8 Kanadi-01 Oil show9 Masu-01 Oil show10 Krumta-10 Gas show11 Tuma-01 Oil show12 Wadi-01 Gas show13 Bulte-01 Gas show14 Kasade-01 Dry15 Gaibu-01 Dry_____________________________________
Aderoju et al.: A Reassessment of Hydrocarbon Prospectivity of the Chad Basin

507
Other advanced data processing techniques such as Spectral Analysis (Spector and Grant, 2000), tilt depth methods (Salem et al., 2007), and 3D Euler Deconvolution (Reid et al., 1990) were employed to determine the depth, geometry, and location of the sources. 2D-forward modeling of some selected profiles across the study area was carried
TMout using the GM-SYS module of Oasis montaj software to determine the variation in the thickness of the sedimentary section and the probable effect of the basement on the disposition of the intra-sedimentary structures in the area. The results of the aeromagnetic studies were compared with the information derived from the available wells within the study area in order to establish a basis for the calibration of the other parts of the basin.
Principles of Hydrocarbon Related Magnetic AnomalyHydrocarbons move continuously from reservoirs
to the surface through faults and micro fractures. Temperature gradients, compaction, and changes in atmospheric pressure help to drive this upward migration (Rowe et al., 1998). The hydrocarbon sometimes reacts with the surrounding strata to create alteration features that can be mapped by geophysical methods.
The use of magnetic methods for direct or semi-direct location of oil and gas is based on the detection of diagenetic magnetite caused by hydrocarbon seepage (Eventov, 1997). The concept is illustrated in Figure 4 (Urquhart, 2003). Such hydrocarbon induced anomalies include changes in density, magnetic susceptibility, radioactivity and conductivity. To be detected, the respective anomalous response must be greater than the background. It is only the diagenetic mineralization resulting from the hydrocarbon seepage from reservoir to overlying section that is
'of importance to the modern magnetic methods ability to initiate prospect development.
Fig. 4: Generalized Hydrocarbon Induced Effects in Sedimentary Rock - Magnetic Anomaly is Highlighted in Red Circle (After Urquhart, 2003).
Aderoju et al.: A Reassessment of Hydrocarbon Prospectivity of the Chad Basin

508
Most reservoirs are found to leak and a variety of magnetic and geochemical changes result in the soil and in the subsurface as a result of the interaction of the hydrocarbons, microbes, and iron and other minerals. The rate of hydrocarbon migration and microseepage varies from less than one metre per day to tens of metres per day (Klusman and Saeed, 1996).
The process leading to the shallow precipitation of magnetic minerals appears to occur within a sub-surface redox zone that forms at the interface between the reducing environment created by the hydrocarbon seep, generated largely by microbial action, and a sub-soil oxidizing environment generated by a non-static present day or paleo water table. It is within this environment that magnetite is concentrated through a dynamic cycle of conversion and re-conversion (precipitation and dissolution) often forming annular/aureole micromagnetic anomalies when imaged in plan (Stone et al., 2004).
RESULTSQualitative InterpretationQualitative interpretation of aeromagnetic data is primarily an image-based recognition of patterns, trends, structural grain, discontinuities/offsetting faults and disruptive cross-cutting features. Qualitative interpretation is concerned essentially
with the visual inspection of maps or profiles to identify zones with different magnetic characteristics.
Magnetically “quiet” and magnetically perturbed segments are qualitatively interpreted as subsurface rocks with low and high magnetic susceptibility contrasts in the subsurface respectively. Lineation in the magnetic contours may reflect the strike line of elongated intrusive features or the surface of a large fault reflected in the basement topography or lithology (Dobrin and Savit, 1988). The aeromagnetic contour map of the study area (Fig. 5) is relatively subdued in the northern and western sections in a manner characteristic of sedimentary terrains. The map shows circular/tabular-shaped magnetic anomalies (highs and lows) with a dominant NE – SW and E-W trends, and occasional steep gradients which are distributed throughout the area.
The dominant long wavelength anomalies with spatial scales of several kilometers are certainly due to deep-seated basement under the basin. The magnetic highs and lows are occasionally paired together, with the highs usually on the northern side of lows. Anomalies in the magnetic field of the earth are considered to arise from three principal sources (Bird, 1997).
Aderoju et al.: A Reassessment of Hydrocarbon Prospectivity of the Chad Basin

509
These are lithologic variation, basement structures and authigenic minerals in sedimentary rocks. The magnetic intensity ranges from 33,842 nT to 34,215 nT (Fig. 5). The maximum intensity value of 34,215 nT is observed in the central part of the study area while the minimum value of 33,842 nT is recorded in most parts of the study area, though it occurs dominantly in the southern and northeastern parts. Thus the magnetic relief of 372 nT in the area is attributed to differences in magnetic mineral content between various lithologies, and to variation in the depth to magnetic rocks. Bird (1997) viewed anomalies with amplitudes of the order of 100 nT to be related to variations in basement lithologies. Figure 5 also shows that the area is composed of four main magnetic regions: north-western, north-eastern, central and southern regions. These regions are distinguished on the basis of the variation of intensity of magnetic response. The north-western region is characterized by high
magnetic response (which attained 34,215 nT). The southern and north-eastern regions are characterized by relatively lower anomalies compared to the north-western region. The width of the anomalies ranges from 0.5 km to 20 km across the map area. The largest anomaly of 20 km width labeled A, is observed in the east-central region. Visual inspection of the aeromagnetic map reveals that the most dominant trend in this part of the Chad Basin is NE-SW direction, related to the Pan African trend. The second dominant trend observed is the E-W to ENE-WSW directions in the central area of the map. According to Jiakang and Igor (2005), these trends often coincide with litho-tectonic domains and depend on the scale of investigation. Zone of broad magnetic anomaly labeled A is bounded from two sides (north and south) by relatively steep magnetic gradients. This suggests the existence of major deep-seated faults/fracture zones bounding this zone in the stated directions. The high gradient zones are
10000 0 10000 20000metres
Scale 1:580857
-145
-97
-74
-59
-49
-39
-31
-25
-19
-13
-9
-4
-0
4
8
12
15
19
22
26
29
33
36
40
44
48
52
57
63
71
80
91
103
118
134
152
170
187
002-
0 0 1 -
00
1-
0 0 1
0 0 1
100
1 0 0
001
001
1 0 0
00
1
0 0 1
0 0 1
1 0 0
2 0 0
2 0 0
2 0 0
0
0
0
0
0
0
0
0 0
0
0
00
0 0
0
0
000
0
0
0
0
0
0
0
0
0
0
0
0
0
0 0 00
0
0
00
0
0
0
0
0
0
0
0
0
0
0
0
12
80
00
01
30
00
00
13
20
00
01
34
00
00
13
60
00
01
38
00
00
14
00
00
01
42
00
00
14
40
00
0
12
80
00
01
30
00
00
13
20
00
01
34
00
00
13
60
00
01
38
00
00
14
00
00
01
42
00
00
14
40
00
0
840000 860000 880000 900000 920000 940000 960000 980000
840000 860000 880000 900000 920000 940000 960000 980000
A
nT
Fig.5: Colour Contoured Map of Total Magnetic Field Anomalies in the Study Area. (To obtain the Actual Total Magnetic Field Value, add 34,000 nT to the Values Shown in the Key)
Aderoju et al.: A Reassessment of Hydrocarbon Prospectivity of the Chad Basin

510
defined by bands of parallel contour trends of uniform amplitudes. These steep gradient zones are indicative of deep-seated shear zones (Bain, 2000).
Estimates from Power Spectrum and Tilt Angle MethodsFigure 6 presents the radially averaged energy spectrum of the aeromagnetic map of the study area. This plot illustrates the typical reduction in energy with increasing wave number. Energy spectrum takes advantage of the fact that potential field data, by its nature is very broad-band in that a
single measurement includes the effect due to all the physical sources (geology). The energy spectrum clearly shows the ensemble of sources that contribute to the energy from low to high wave numbers. The highest wave number anomalies represent magnetic sources close to the surface as well as noise. The lower wave numbers generally reflect deeper sources. Magnetic sources at similar depths fall on straight line segments in a graph of log of energy versus wave number. The slope of a line segment is a function of the average depth of the sources that it characterizes (Spector and Grant, 1970).
RADIALLY AVERAGED POWER SPECTRUM
Wavenumber(1/K_unit)
DEPTH ESTIMATE
-20
-10
0
10
ln(P
ow
er)
-20
-10
0
10
ln(Po
wer)
0 5 10 15 20
0
5
10
15
Dep
th(K
_un
it)
0
5
10
15 Depth(K
_unit)
0 5 10 15 20
5.6km
1km
0.6km
Fig. 6: Radially Averaged Power Spectrum of the Study Area
In order to obtain a better indication of the variation in depth to source, the study area was divided into smaller square blocks of dimensions 40 km x 40 km and the average depth was computed for each block. The depths were further constrained by depths from five wells within the study area which reached the basement, i.e. Ngornorth-01, Ngammaeast-01, Kinassar-01, SA-01 and Ziye-01 at approximately 3.2 km, 3.3 km, 4.7km, 2.4 km and 3.4 km respectively. Depth computations for these blocks revealed that the average depth to shallowest sources is 1.5 km and the deepest is 7.4 km below flight level. The depth
map is presented in Figure 7 as a 3-D depth map because of its vivid representation of the basement morphology. Basin maximum depth is observed in the east-central area where the magnetic basement attains a depth of 7.4 km below the surface. Depth value attains 1.5 km in the north-western area, indicating the shallowest basement area. A basement ridge trending E - W straddles the northern part of the area of investigation. From this ridge, the basement subsides gradually to the central part of the investigated area. The central region of the basement surface is generally deep and is
Aderoju et al.: A Reassessment of Hydrocarbon Prospectivity of the Chad Basin

511
characterized by an E-W trending mega-graben. The basement morphology rises abruptly to 2.5 km in the southern part of the basement low before descending steeply further southwards, where the maximum depth around this area is not determinable due to lack of continuity in the data. Thus, the configuration of the basement as shown in Figure 7 is essentially alternation of low and high in all directions. This configuration is typical of horst and graben structure. The deepest area in the east-central region is interpreted to have had
the thickest sediments, that is, the area with the greatest potential for accommodation space or accumulation sites.
Therefore, knowledge of depth to basement provides the thickness of the sedimentary fill which in turn is a key indicator in determining whether the deeper parts of the basin would have been buried to sufficient depth to reach the maturation window.
Fig. 7: 3-D Map showing Depth to Magnetic Basement Computed Using Spectral Depth Method and Locations of Some of the Wells.
Lineament Analysis and Mapping of Deep Seated Fracture ZonesBoth the total first horizontal and second vertical derivative filters were applied to data continued upward to 3 km (Figs. 8 and 9). The data were first
continued upward in order to attenuate shallow sources and accentuate effects due to the basement. Figure 8 shows the horizontal derivative (HD) map of the upward continued data.
Aderoju et al.: A Reassessment of Hydrocarbon Prospectivity of the Chad Basin
NDepth (km)

512
F i g . 8 : H o r i z o n t a l Derivative Map of Data Upward Continued to 3 km with Lineaments as White Lines Superimposed.
Fig. 9: Second Vertical Derivative Map of Data Upward Continued to 3 km with Lineaments as W h i t e L i n e s Superimposed.
Aderoju et al.: A Reassessment of Hydrocarbon Prospectivity of the Chad Basin

The map reveals parallel to sub-parallel NE-SW, E-W and NW-SE trending fracture zones (marked by white lines) deep seated in the basement underlying the study area. The second vertical derivative (2VD) map (Fig. 9) also reveals a great amount of detail such as definition of body edges not obvious on the original TMI data. This result demonstrates the usefulness of the 2VD calculation in greatly speeding up tectonic interpretation. This result is comparable with that obtained from the horizontal derivative. All the NE-SW trending fracture zones are easily recognized. The identified fault trends are attributed to extensional basin tectonics that created the Chad Basin. Many of the features shown by these derivatives maps are vaguely apparent in the total intensity data. The structure labeled X appears to be a deep intrusive rock (Oyeniyi, 2015). The anomaly on the HD map reveals two maxima representing the edges of the intrusive rock, while these maxima coincided with the zero contour on the 2VD map.
Magnetic Aureoles
In order to isolate the intrasedimentary anomalies (aureoles) believed to be magnetic hydrocarbon indicators (MHIs) (Stone et al., 2004), a 4th order Butterworth band pass filter with cut-off wavelengths of 3 - 5 km was applied to the RTE data. Some distinct magnetic aureole (circular magnetic low surrounded on all sides by magnetic high) presumably due to diagenetic activities and some geomagnetically-induced non-aureoles (Stone et al., 2004; Reynolds et al.,1991) are conspicuous in the resulting map (Fig. 10). The distribution of inferred aureoles is shown in black boxes, and it can be observed that they do not appear to coincide with the well locations. As described earlier, most of these wells were essentially dry (Table 1) with a few exhibiting some gas or oil shows. It is strongly believed that the wells could have been more successful if drilled over the region of the magnetic aureoles based on their characteristic association with hydrocarbon seepages.
10000 0 10000metres
-24.8
-17.0
-13.2
-10.6
-8.7
-7.3
-6.3
-5.4
-4.6
-3.9
-3.3
-2.8
-2.3
-1.9
-1.5
-1.2
-0.8
-0.5
-0.1
0.2
0.5
0.9
1.2
1.6
2.0
2.4
2.8
3.3
3.9
4.6
5.3
6.3
7.4
8.8
10.7
13.1
17.0
24.6
13
000
00
13
400
00
13
800
00
14
200
00
12
80
00
01
32
00
00
13
60
00
01
40
000
01
44
000
0
820000 860000 900000 940000 980000
840000 880000 920000 960000
Ngor-01
Gubio
Ngamma
Wurshe
Sa
Tuma
Wadi
Kanadi
Gaibu
Krumta
ZiyeKinassar
Masu
Bulte
Kasade
nT
Fig. 10: Residual Map Showing the Seep Related Aureoles (Black Boxes); Geomagnetically Induced Anomalies (White Boxes) and Well Locations.
Aderoju et al.: A Reassessment of Hydrocarbon Prospectivity of the Chad Basin 513

Geomagnetically induced anomalies are characterized by east-west trending magnetic low flanked to the north and south by magnetic highs. The E-W anomaly is typical of the anomaly induced around the equator where the field is horizontal (Stone et al, 2004).
Euler Deconvolution
Figure 11 shows some inferred lineaments der ived from solut ions of the Euler deconvolution analysis using a structural index of 0 (zero) for depths between 2.5 km and 3.0 km. Some of the mapped magnetic aureoles are also displayed as yellow boxes in the figure. It can be observed that there is a remarkably close coincidence in the east-central and south-eastern parts of the study area between locations of the mapped magnetic aureole and the magnetically mapped intra-sedimentary faults/lineaments, suggesting a probable regional structural control for hydrocarbon occurrence in the area.
Three wells, Ngornorth-1, Ngammaeast-1 and Gubio-1 (Fig. 9) located in an area delineated by X in Figure 11 are basically dry. Studies conducted on this anomaly (Oyeniyi, 2015) suggested that the structure is an intrusive block and not an anticlinal structural trap, hence no magnetic aureole is associated with any of these wells, which probably explains why they are dry wells.
Magnetic Modeling
Some depth to basement methods, such as local spectra, suffer from various setbacks in that they cannot accurately map the undulation in the basement as they give only the average depths (Ramadas et al., 2004). Therefore, the need to construct forward magnetic models that accurately represent basement topography cannot be over-emphasized. Thus, to confirm the dip and depth to basement block surfaces, to delineate the basement tectonic framework in the area under investigation, and to determine the relationship between mapped aureoles and the basement, eight profiles were modeled.
Depth(m)
> 30002750 - 30002500 - 2750 < 2500
Inferred MagneticAureolesLineaments
Fig. 11: Solutions of the Euler Deconvolution Using Structural Index of 0 for Depth Slice Between 2500 m and 3000 m, Yellow Boxes Indicate Magnetic Aureoles and Thick Lines Represent Lineaments.
Aderoju et al.: A Reassessment of Hydrocarbon Prospectivity of the Chad Basin514
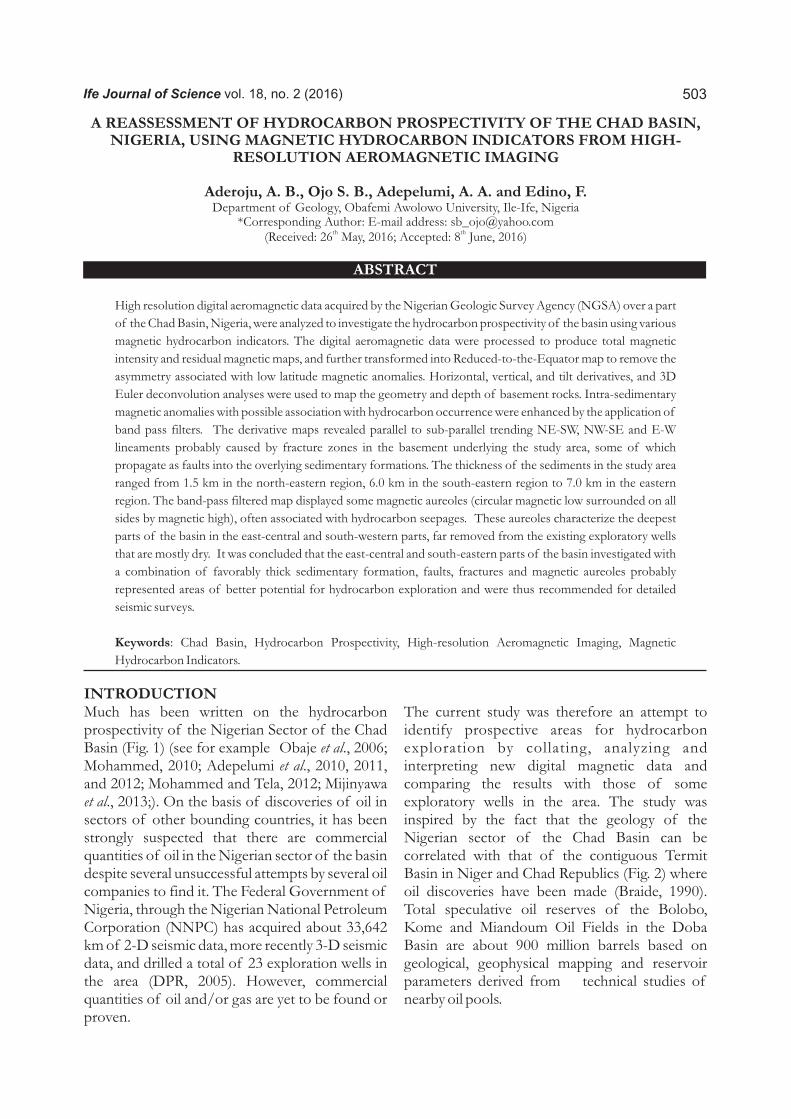
These profiles were taken in directions orthogonal to the prominent trends / structures indicated on
the residual map (Fig. 12). These profiles used as the observed profiles for 2-D modeling retained
10000 0 10000metres
-105.17
-80.96
-66.96
-57.77
-50.67
-43.96
-38.22
-33.29
-29.10
-25.28
-21.60
-18.22
-14.82
-11.37
-8.10
-5.20
-2.37
0.30
2.70
4.99
7.20
9.30
11.47
13.75
16.40
19.23
22.27
25.61
29.25
33.13
37.87
43.69
51.67
60.28
70.49
82.13
94.41
103.66
1280
000
1300
000
1320
000
1340
000
1360
000
1380
000
1400
000
1420
000
1440
000
1280000
13000001320000
13400001360000
13800001400000
14200001440000
820000 840000 860000 880000 900000 920000 940000 960000 980000
820000 840000 860000 880000 900000 920000 940000 960000 980000
A'
A
B'
B
C'
C
D'
D
E'
E
F'
F
G'
G
H'
H
Magnetic Aureoles
2D Profile Lines
Ngornorth-1
Ngamma
Gubio
Wurshe
Sa-1
Tuma-1
Wadi-01
Kanadi-01
Gaibu-01
Kinassar-01
Masu-01
Krumta-01
Bulte-01
Kasade-01
Wells
nT
Fig. 12: Residual Map Showing the Modeled Profiles A–Aꞌ – H–Hꞌ, Wells and Magnetic Aureoles.
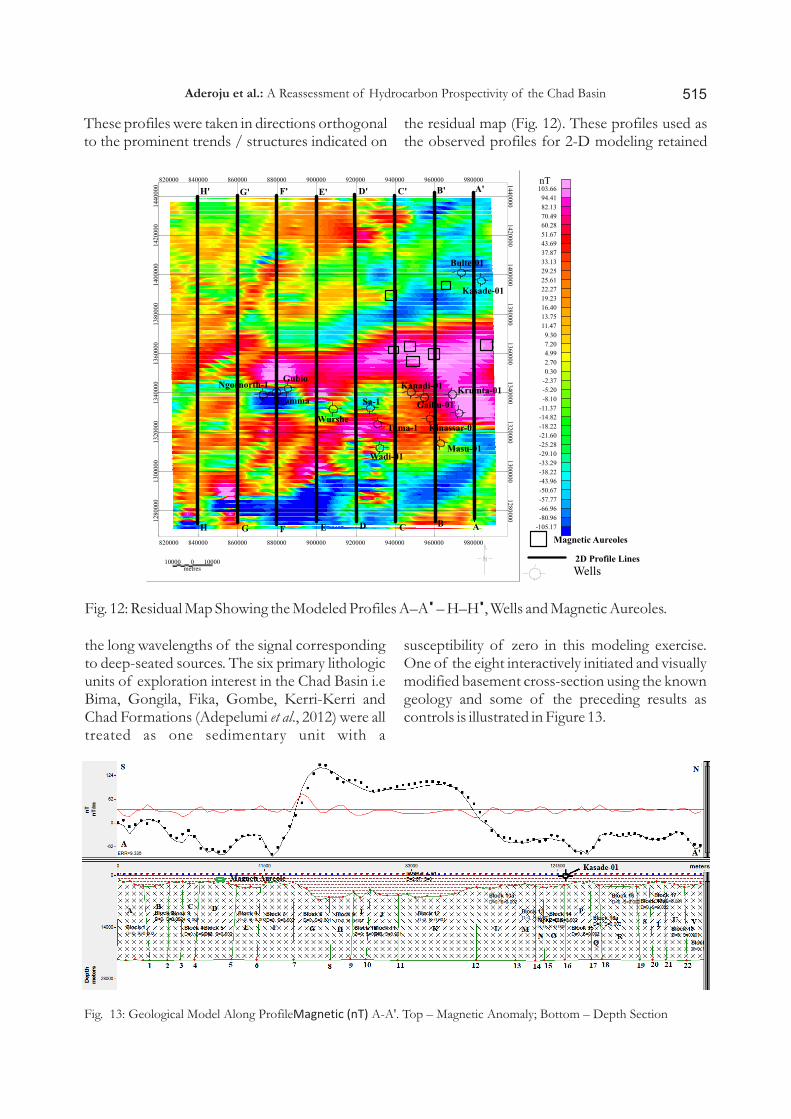
the long wavelengths of the signal corresponding to deep-seated sources. The six primary lithologic units of exploration interest in the Chad Basin i.e Bima, Gongila, Fika, Gombe, Kerri-Kerri and Chad Formations (Adepelumi et al., 2012) were all treated as one sedimentary unit with a
susceptibility of zero in this modeling exercise. One of the eight interactively initiated and visually modified basement cross-section using the known geology and some of the preceding results as controls is illustrated in Figure 13.
Fig. 13: Geological Model Along ProfileMagnetic (nT) A-A'. Top – Magnetic Anomaly; Bottom – Depth Section
Aderoju et al.: A Reassessment of Hydrocarbon Prospectivity of the Chad Basin 515

The modeled profiles represent the surface topography of the basement beneath the sediments where, invariably depth points along each profile could be determined. Depth points were picked at regular intervals across the eight profiles, from which a 3-D depth map was produced. The 3-D depth map is presented in Figure 14. Maximum basin depth is observed in the east-central area where the magnetic basement
The basement morphology rises abruptly to 3.0 km in the southern part of the basement low and then subsides to a depth of 3.8 km further southwards before ascending steeply further southwards, where the maximum depth around this area is not determinable due to lack of continuity in the data. Thus, the configuration of the basement as shown in Figure 14 is essentially alternation of low and high in all directions. This configuration is typical of horst and graben structures similar to those obtained from the spectral and tilt methods.
attains a depth of 7.0 km below the surface. Depth value attains 1.7 km in the north-western area, indicating the shallowest basement area. A basement ridge trending E - W straddles the northern part of the study area. From this ridge, the basement subsides gradually to the central part of the investigated area. The central region of the basement surface is generally deep and is characterized by an E-W trending architecture.
DISCUSSION AND CONCLUSIONThe Total Magnetic Intensity (TMI) and residual magnetic maps generated from the high resolution magnetic data clearly identified three main structural trends, NE-SW, NW-SE and E-W trends. These structural trends were further supported by results from first horizontal (HD) and second vertical derivative (2VD) of the RTE map which revealed parallel to sub-parallel NE-SW, E-W and NW-SE trending fracture zones deep-seated in the basement underlying the study area. The NE-SW trend which appeared to be the oldest and the most abundant trend affecting the area is consistent with the major structural trend
Fig. 14: 3-D Depth to Basement Map Computed From 2D Model Profiles on which Well and Magnetic Aureole Locations are Superposed as White Sticks and Yellow Boxes Respectively.
Aderoju et al.: A Reassessment of Hydrocarbon Prospectivity of the Chad Basin516
N
Depth (km)

of the basement complex of Nigeria as observed from aeromagnetic maps by different workers (e.g. Ajakaiye et al., 1986; Ojo, 1990; Ako, et al., 2004).
Depth to basement analyses using two dimensional (2D) power spectrum and tilt-depth techniques constrained by depths from five wells which reached the basement, as well as 2D modeling of several equally spaced profiles across the study area showed that there was adequate accommodation space to host hydrocarbon reservoirs. Generally, basement depths range from 1.5 km to 7.2 km below the flight level. There was good agreement in trend and location between basement structures and trends of the overlying sedimentary fault systems, strongly suggesting that the sedimentary section has been influenced by the underlying basement architecture. The maximum depth obtained is slightly higher than the value obtained by Kwaya et al. (2013) from seismic data but much less than the value obtained by Avbovbo et al. (1986) also from seismic data.
Studies by several workers (for example, Olugbemiro et al., 2007; Adepelumi et al., 2010, 20 13; Mijinyawa et al., 2013) on the hydrocarbon potential of some potential source rocks in the Chad Basin, such as Fika and Gongila Formations, through the evaluation of their total organic matter (TOM), total organic carbon (TOC), hydrogen index (HI), vitrinite reflectance, and thermal and burial history, indicated that the formations had good oil generating potential. The Gombe and Bima Sandstones within the Chad Basin are also suitable reservoirs. Petrophysical parameters such as porosity, permeability, water saturation, hydrocarbon saturation, bulk water volume, computed and interpreted by Adepelumi et al. (2011) suggested that the Gombe sandstone is a potential reservoir for hydrocarbon accumulation. In spite of all these, however, available records from the exploratory wells by NNPC showed that most of the wells were dry or at best had some gas shows. Nonetheless, the presence of magnetic aureoles in the analyzed maps in the east-central and south-eastern region of the study area, presumably due to diagenetic activities which might be associated with some hydrocarbon seepages; suggest that there might be favourable hydrocarbon reservoirs in these areas. These magnetic aureoles could not be associated
with the wells drilled in the area, thereby suggesting that the wells were probably not optimally located.
It is concluded that the east-central and south-eastern parts of the study area with a combination of thick sedimentary formation, accompanied by faults, fractures and magnetic aureoles have a better potential for hydrocarbon exploration than the present well locations. These areas are thus recommended for more detailed seismic surveys.This study has reinforced the emerging view that potential field data, especially data from modern, high resolution magnetic surveys, can provide results that are more directly related to the presence of hydrocarbon play, in addition to traditional results of depth to basement and basin geometry.
ACKNOWLEDGEMENTSThe authors acknowledge the Shell Petroleum Development Company of Nigeria Limited, through the Office of the Shell Professor of Geophysics, Department of Geology, Obafemi Awolowo University, for funding this research; the Director-General of the Nigerian Geological Survey Agency (NGSA) for provision of aeromagnetic data; and Nigerian National Petroleum Corporation (NNPC) for the well data. This paper is dedicated to the memory of Mr. Terver Abenga, a member of the project team who passed away at the beginning of the project.
REFERENCESAdepelumi, A. A., Falebita, D. E., Olorunfemi, A.
O. and Olayoriju, S. I., 2010. Source-rock inves t ig a t ion of the Turon ian-Maastrichtian Fika Shale from wireline-logs, Chad basin, Nigeria. International Journal of Petroleum Science and Technology, 4(1): 19-42.
Adepelumi, A. A., Alao, O. A. and Kutemi, T. F., 2011. Reservoir characterization and evaluation of depositional trend of the Gombe Sandstone, southern Chad basin, Nigeria. Journal of Petroleum and Gas Engineering, 2(6): 118-131.
Adepelumi, A. A., Alao, O. A. and Ako, B. D. 2012. Modeling hydrocarbon potential and maturity of Gongila shale, Chad basin, Northeastern Nigeria. Oil Shale, 29(2):
Aderoju et al.: A Reassessment of Hydrocarbon Prospectivity of the Chad Basin 517

151-172.Ajakaiye, D. E., Hall, D. H., Millar, T. W., Verheijen,
P. J. V., Awad, M. B. and Ojo, S. B., 1986. Aeromagnetic anomalies and tectonic trends in and around the Benue Trough, Nigeria. Nature, 319(6054): 582-584.
Ako, B. D., Ojo S. B., Okereke C. S., Fieberge F. C., Ajayi T. R., Adepelumi , A. A., Afolayan J.F., Afolabi O., Ogunnusi H. O. 2004. Some Observations from Gravity/ Magnetic Data Interpretation of the Niger Delta. NAPE Bulletin. 17(1):1 - 21.
thAfrol News, 16 September 2007. First Chadian
oil revenues deposited. Independent News Agency dedicated exclusively to Africa. http://www.afrol.com.articles/10655
Avbovbo, A. A.,Ayoola, E. O. and Osahon, G. A. 1986.Depositional and Structural Styles in Chad Basin of Northeastern Nigeria. The American Association of Petroleum Geologists Bulletin, 70(12): 1787-1798.
Bain J. E. 2000. Eastern Gulf data reveal play concepts. The American Oil & Gas Reporter - April 2000: 38-41.
Binks, R.M. and Fairhead, J.D. 1992. A plate tectonic setting for Mesozoic rifts of West and Central Africa. In: P.A. Zeigler (Editor), Geodynamics of Rifting, Volume II. Case History Studies on Rifts: North and South America and Africa. Tectonophysics, 3: 141-151.
Bird D. 1997. Primer: Interpreting Magnetic data. AAPG Explorer, 18: 18-21.
Braide, S.P. 1990. Petroleum geology of the southern Bida Basin Nigeria. American Association of Petroleum Geologists, Bull., 74 (5): 717.
Burke, K.C. 1976. The Chad Basin: an active intra-continental basin. Tectonophysics, 36: 197-206.
Directorate of Petroleum Resources (DPR). 2005. Oil Concession map used at the National Data Repository Meeting. Reston,
st rdVirginia, USA. 21 – 23 September 2004.
Dobrin, M. B. and Savit, C. H. 1988. Introduction thto Geophysical Prospecting, 4 Edition
McGraw Hill, Singapore. 867pp.Eventov, L. I. 1997. Applications of magnetic
methods in oil and gas exploration. The Leading Edge, 16(5): 489-492.
Foote, R. S., (1997): Relationship of near-surface magnetic anomalies to oil- and gas-producing areas, In: Schumacher, D. and Abrams, M.A., (ed.), Hydrocarbon Mig rat ion and Its Near-Surface Expression, America Association of Petroleum Geologist Memoir, 66:762–772.
Genik, G.J. 1992. Regional framework and structural aspects of rift basins in Niger, Chad and the Central African Republic : P.A. Zeigler (Editor), Geodynamics of Rifting, Volume II. Case History Studies on Rifts: North and South America and Africa. Tectonophysics, 213: 169-185.
Guiraud, R. and Maurin, J.C. 1992. Early Cretaceous rifts of Western and Central Africa: an overview. In P.A. Ziegler (Editor), Geodynamics of Rifting, Volume II. Case History Studies on Rifts: North and South America and Africa. Tectonophysics, 213: 153-168.
Jiakang Li and Igor Morozov, 2005. Potential Field investigation of Will iston Basin Basement . Canadian Society of Exploration Geophysicists National Convention, pp. 75 - 76.
Klitgord, K.D. and Schouten, H. 1986. Plate Kinematics of the Central Atlantic. In: B.E. Tucholke and P.P. Vogt (Editors), The Western North Atlantic Region. (The Geology of North America, M.) Geol. Sot. Am, Boulder, Colo., pp. 351-378.
Klusman, R.W., and Saeed, M.A. 1996. Comparison of light hydrocarbon m i c r o s e e p a g e m e c h a n i s m s , i n Hydrocarbon migration and its near- surface expression: AAPG Memoir, 76: 157 – 168.
Kwaya, M. Y., Kurowska, E.,Alagbe, S.A., Ikpokonte, A.E. and A. S. Arabi. 2013. Evaluation of Depth to Basement Complex and Cenozoic Unconformity from Seismic Profiles and Boreholes in the Nigerian Sector of the Chad Basin. Journal of Earth Sciences and Geotechnical Engineering, 3 (2): 43-49.
Mijinyawa, A., Bhattacharya, S. K., Moumouni, A., Mijinyawa, S. and Mohammad, I., 2013. Hydrocarbon potential, thermal and burial history in Herwa-1 well from the Nigerian sector of the Chad Basin: an
Aderoju et al.: A Reassessment of Hydrocarbon Prospectivity of the Chad Basin518

implication of 1-D basin modeling study. Research Journal of Applied Sciences, Engineering and Technology, 7(6): 961-968.
Mohammed, Y. B. 2010. Geochemical assessment of Cretaceous sediments in the Nigerian sector of the Chad Basin from Kadaru-1 and Herwa-1 exploratory wells for possible petroleum generation. Journal of Environmental Sciences and Resource Management, 2: 23-36.
Mohammed, Y. B., and Tela, B. 2012. Assessment of Tertiary sediments of Bornu basin for possible hydrocarbon reservoir. Research Journal in Engineering and Applied Sciences, 1(4): 251-257.
Nabighian M. N., Grauch V. J. S., Hansen R. O., LaFehr T. R., Li Y., Peirce J. W., Phillips J. D., Ruder, M.E. 2005. The historical development of the magnetic method in exploration, Geophysics, 70(6): 33ND – 71ND.
Obaje N.G., Attah D.O., Opeloye S.A., and Moumouni A. 2006. Geochemical Evaluation of the Hydrocarbon Prospects of Sedimentary basins in Northern Nigeria. Geochemical Journal, 40: 227- 243.
Ojo, S.B., 1990. Origin of a major aeromagnetic anomaly in the middle Niger Basin, Nigeria. Tectonophysics, 185:153 - 162.
Ojo, S. B. Oladele, S. and Ako, B. D. 2009. Magnetic imaging of intrasedimentary anomalies and their association with hydrocarbon producing fields in the Niger Delta, Nigeria. Seventy-nineth Annual International Meeting, Society of Exploration Geophysicist, Expanded Abstract. pp. 957 – 961.
Ojo S. B., Edino F., Ako, B. D., Onuoha, K. M., and Osayande, N. (2012): Aeromagnetic Imaging and Characterization of the Anambra Basin, Nigeria, for Magnetic Hydrocarbon Indicators. Ife Journal of Science, 14 (2): 207-220 .
Oladele, S., Ojo, S.B. and Ako, B.D., 2008. Magnetic evidence for links between basement tectonics and hydrocarbon
threservoirs in the Niger Delta, Nigeria. 26 Annual International Conference, Nigerian Association of Petroleum Explorationists, Extended Abstracts: pp. 11-13.
Olugbemiro, R. O., Ligouis, B. and Abaa, S. I. 1997. The Cretaceous series in the Chad Basin, NE Nigeria: Source rock potential and thermal maturity. Journal of Petroleum Geology, 20(1): 51-68.
Oyeniyi, O. I. 2015. Interpretation of a prominent magnetic anomaly near Gubio Well, Chad b a s i n , N o r t h - e a s t e r n N i g e r i a . Unpublished B.Sc. Thesis, Obafemi Awolowo University, Ile-Ife, Nigeria, 68pp.
Phillips J.D. 2000. Locating magnetic contacts: A comparison of the horizontal gradient, analytical signal and local wavenumber methods: 70th Annual International Meeting, SEG, Expanded Abstracts, pp. 402 - 405.
Ramadas G., Himabindu, D. and Ramaprasada I. B. 2004. Magnetic basement along the Jadcharla – Vasco transect, Dharwar Craton, India. Current Science, 86(11): 1548 – 1553.
Reid, A. B, Allosp, J.M., Granser, A., Millet, A.J., Somer ton, I .W. 1990. Magnet ic Interpretation in three dimensions using Euler disconsolation. Geophysics 55: 80 - 91.
Reynolds, R. L., Fishman, N.S. and Hudson, M .R. 1991. Sources of aeromagnetic anomalies over cement oil field (Oklahoma), Simpson oil field (Alaska), and the Wyoming-Idaho-Utah thrust belt. Geophysics, 56: 606 - 617.
Rosendhal, B.R., Kilembe, E. and Kaczmarick, K. 1992. Comparison of the Tanganyika, Malawi, Rukwa and Turkana rift zones from analyses of seismic reflection data. In: P.A. Ziegler (Editor), Geodynamics of Rifting, Volume II. Case History Studies on Rifts: North and South America and Africa. Tectonophysics, 213: 235-256.
Rowe, J. D., Smith, R. S., and Beattie, D. D. 1998. TM
Airborne ALTREX Electromagnet Electromagnetic/magnetic definition of hydrocarbon alteration plumes, in, R.I. Gibson and P. S. Millegan, eds., Geologic applications of gravity and magnetic: Case histories: Society for Exploration Geophysicists and AAPG, p.124 – 129.
Salem Ahmed, Simon Williams, Derek Fairhead, Dhananjay Ravat, Richard Smith. 2007.
Aderoju et al.: A Reassessment of Hydrocarbon Prospectivity of the Chad Basin 519

Tilt depth method: A simple depth estimation method using first order - magnetic derivatives: The Leading Edge, 26(12):16 – 18.
Spector, A. and Grant F. S. 1970. Statistical models for interpreting aeromagnetic data Geophysics, 35: 293 – 302.
Stone, V., Fairhead, J.D., Oterdoom, W.H., Carigali, P. 2004. The meter reader: Micro-
magnetic seep detection in the Sudan. The Leading Edge, 23(8): 734 - 737.
Urquhart W. E. S. 2003. Efficacy of the SRM/MBS Approach for Analyzing Intra-Sedimentary Magnetic Anomalies -- Presented to the SBGf Symposium-- Brazil, September 17th, 2003. pp. 49 – 60.
Aderoju et al.: A Reassessment of Hydrocarbon Prospectivity of the Chad Basin520