a profile of public transportation passenger demographics...
TRANSCRIPT
A Profile of Public Transportation Passenger Demographics and Travel Characteristics
Reported in On-Board Surveys May 2007
American Public Transportation Association 1666 K Street, N.W.
Suite 1100 Washington, DC 20006
(202) 496-4800
Vision Statement Be the leading force in advancing public transportation. Mission Statement
To strengthen and improve public transportation, APTA serves and leads its diverse membership through
advocacy, innovation, and information sharing.
Policy on Diversity
APTA recognizes the importance of diversity for conference topics and speakers and is committed to increasing the awareness of its membership
on diversity issues. APTA welcomes ideas and suggestions on how to strengthen its efforts to meet these important diversity objectives.
A Profile of Public Transportation Passenger Demographics and Travel Characteristics Reported in On-Board Surveys
May 2007 published by American Public Transportation Association Howard Silver, Chair
Michael S. Townes, First Vice Chair Michael J. Scanlon, Secretary-Treasurer Ronald L. Barnes, Immediate Past Chair Vice Chairs Richard J. Bacigalupo
Allen D. Biehler Christopher P. Boylan
Mattie P. Carter Thomas J. Costello
Michael P. DePallo Fred M. Gilliam Kim R. Green
Delon Hampton John M. Inglish
Jeanne Krieg Gary W. McNeil Hugh A. Mose David Solow
President
William W. Millar Chief of Staff
Karol J. Popkin
Chief Counsel
James P. LaRusch Vice Presidents
Pamela L. Boswell Arthur L. Guzzetti
Robert L. Healy, Jr. C. Samuel Kerns
Anthony M. Kouneski Rosemary Sheridan
American Public Transportation Association 1666 K Street, N.W.
Suite 1100 Washington, DC 20006
TELEPHONE: (202) 496-4800 FAX: (202) 496-4322
WEB SITE: www.apta.com
written by
John Neff, Senior Policy Researcher (202) 496-4812
and
Larry Pham, Chief Economist and Director - Information Services (Retired)
Material from A Profile of Public Transportation Passenger Demographics and Travel Characteristics Reported in On-Board Surveys may be quoted or reproduced, with proper reference, without obtaining the permission of the American Public Transportation Association. Suggested Identification: American Public Transportation Association: A Profile of Public Transportation Passenger Demographics and Travel Characteristics Reported in On-Board Surveys, Washington, DC, May, 2007.
A Profile of Public Transportation Passenger Demographics and Travel Characteristics, Page 5
A Profile of Public Transportation Passenger Demographics and Travel Characteristics
Reported in On-Board Surveys
TABLE OF CONTENTS
1. SUMMARY OF FINDINGS ......................................................................................... 7 2. INTRODUCTION ......................................................................................................... 9 2.1. Previous Studies of Passenger Characteristics ...................................................... 9 2.2. Data Are Compiled from On-Board Surveys ...................................................... 9 2.3. On-Board Surveys Considered to Be Very Accurate ............................................. 10 2.4. Data Describe Characteristics of Typical Riders, Not Characteristics of Average Person Who Rides .............................................................................. 10 3. METHODOLOGY ......................................................................................................... 11 3.1. Description of Sample ........................................................................................... 12 3.1.1. Sample Size by Mode of Transit Service 3.1.2. Sample Size by Demographic and Travel Characteristic 3.1.3. Sample Size by Year of Survey 3.1.4. Sample Size by Population of Urbanized Area 3.1.5. Description of Extent of Sample Coverage 4. FINDINGS ..................................................................................................................... 18 4.1. Demographic Characteristics of Public Transportation Riders .............................. 18 4.1.1. Age 4.1.2. Ethnicity 4.1.3. Gender 4.1.4. Household Income 4.1.5. Household Size 4.1.6. Occupation 4.1.7. Vehicle Availability for Trip 4.1.8. Vehicles Owned
A Profile of Public Transportation Passenger Demographics and Travel Characteristics, Page 6
4.2. Travel Characteristics of Public Transportation Riders ....................................... 28 4.2.1. Access and Egress Mode 4.2.2. Alternative Mode of Travel 4.2.3. Duration of Transit Riding 4.2.4. Frequency of Transit Travel 4.2.5. Transfers 4.2.6. Trip Purpose 5. COMPARISON TO PREVIOUS STUDIES ............................................................... 36 5.1. Previous Studies Describing Transit Rider Characteristics ................................ 36 5.2. Demographic Characteristics of Public Transportation Riders .......................... 36 5.2.1. Age 5.2.2. Ethnicity 5.2.3. Gender 5.2.4. Household Income 5.2.5. Household Size 5.2.6. Vehicle Availability for Trip 5.2.7. Vehicles Owned 5.3. Travel Characteristics of Public Transportation Riders ........................................... 45 5.3.1. Access and Egress Mode 5.3.2. Alternative Mode of Travel 5.3.3. Duration of Transit Riding 5.3.4. Frequency of Transit Travel 5.3.5. Transfers 5.3.6. Trip Purpose 6. CONCLUSION ............................................................................................................ 50 7. REFERENCES ............................................................................................................ 51
A Profile of Public Transportation Passenger Demographics and Travel Characteristics, Page 7
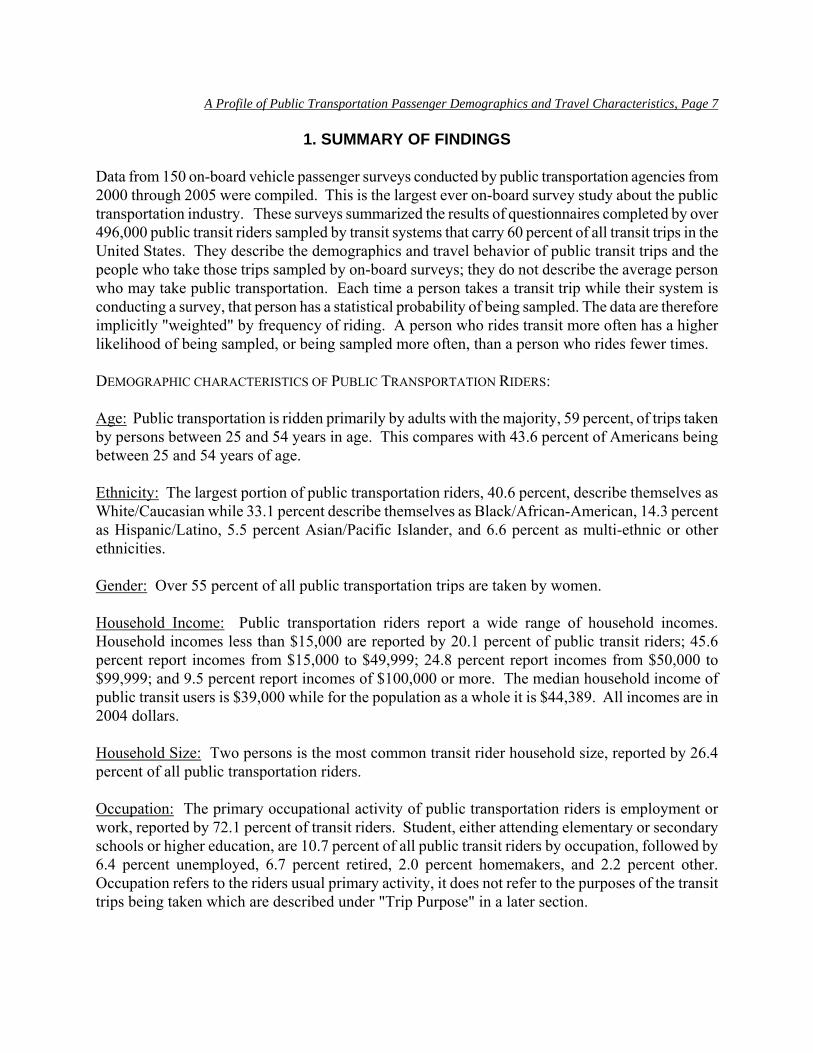
1. SUMMARY OF FINDINGS Data from 150 on-board vehicle passenger surveys conducted by public transportation agencies from 2000 through 2005 were compiled. This is the largest ever on-board survey study about the public transportation industry. These surveys summarized the results of questionnaires completed by over 496,000 public transit riders sampled by transit systems that carry 60 percent of all transit trips in the United States. They describe the demographics and travel behavior of public transit trips and the people who take those trips sampled by on-board surveys; they do not describe the average person who may take public transportation. Each time a person takes a transit trip while their system is conducting a survey, that person has a statistical probability of being sampled. The data are therefore implicitly "weighted" by frequency of riding. A person who rides transit more often has a higher likelihood of being sampled, or being sampled more often, than a person who rides fewer times. DEMOGRAPHIC CHARACTERISTICS OF PUBLIC TRANSPORTATION RIDERS: Age: Public transportation is ridden primarily by adults with the majority, 59 percent, of trips taken by persons between 25 and 54 years in age. This compares with 43.6 percent of Americans being between 25 and 54 years of age. Ethnicity: The largest portion of public transportation riders, 40.6 percent, describe themselves as White/Caucasian while 33.1 percent describe themselves as Black/African-American, 14.3 percent as Hispanic/Latino, 5.5 percent Asian/Pacific Islander, and 6.6 percent as multi-ethnic or other ethnicities. Gender: Over 55 percent of all public transportation trips are taken by women. Household Income: Public transportation riders report a wide range of household incomes. Household incomes less than $15,000 are reported by 20.1 percent of public transit riders; 45.6 percent report incomes from $15,000 to $49,999; 24.8 percent report incomes from $50,000 to $99,999; and 9.5 percent report incomes of $100,000 or more. The median household income of public transit users is $39,000 while for the population as a whole it is $44,389. All incomes are in 2004 dollars. Household Size: Two persons is the most common transit rider household size, reported by 26.4 percent of all public transportation riders. Occupation: The primary occupational activity of public transportation riders is employment or work, reported by 72.1 percent of transit riders. Student, either attending elementary or secondary schools or higher education, are 10.7 percent of all public transit riders by occupation, followed by 6.4 percent unemployed, 6.7 percent retired, 2.0 percent homemakers, and 2.2 percent other. Occupation refers to the riders usual primary activity, it does not refer to the purposes of the transit trips being taken which are described under "Trip Purpose" in a later section.
A Profile of Public Transportation Passenger Demographics and Travel Characteristics, Page 8
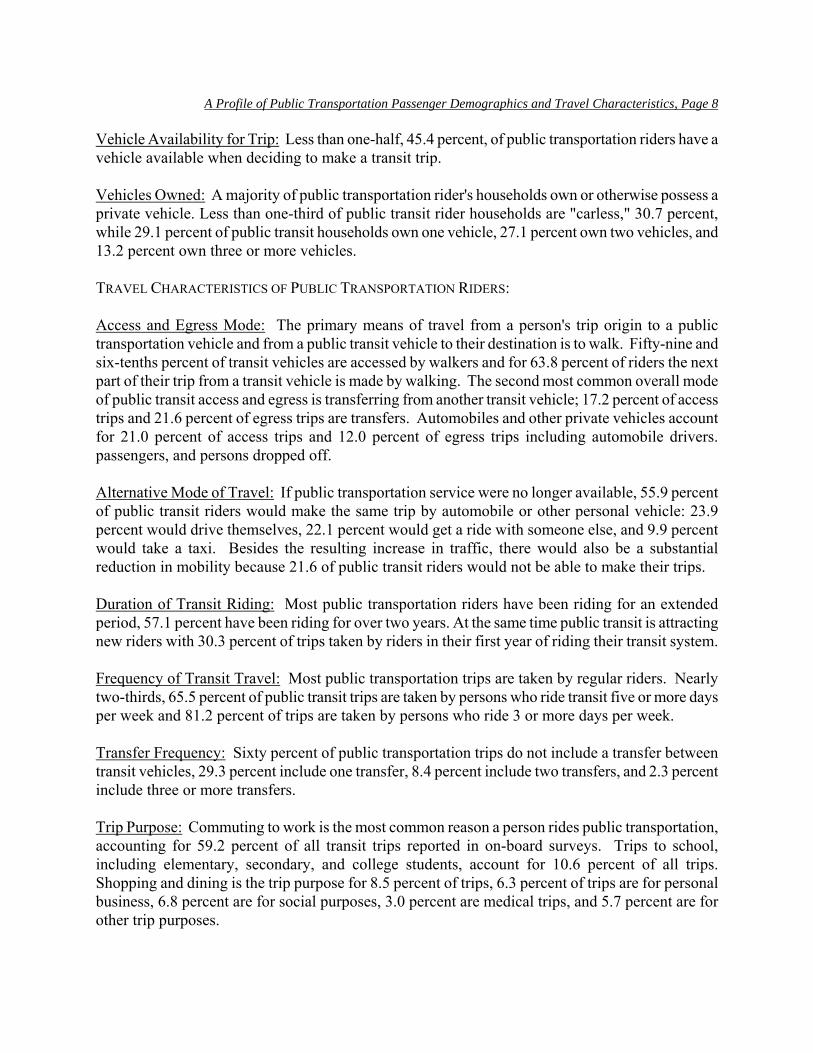
Vehicle Availability for Trip: Less than one-half, 45.4 percent, of public transportation riders have a vehicle available when deciding to make a transit trip. Vehicles Owned: A majority of public transportation rider's households own or otherwise possess a private vehicle. Less than one-third of public transit rider households are "carless," 30.7 percent, while 29.1 percent of public transit households own one vehicle, 27.1 percent own two vehicles, and 13.2 percent own three or more vehicles. TRAVEL CHARACTERISTICS OF PUBLIC TRANSPORTATION RIDERS: Access and Egress Mode: The primary means of travel from a person's trip origin to a public transportation vehicle and from a public transit vehicle to their destination is to walk. Fifty-nine and six-tenths percent of transit vehicles are accessed by walkers and for 63.8 percent of riders the next part of their trip from a transit vehicle is made by walking. The second most common overall mode of public transit access and egress is transferring from another transit vehicle; 17.2 percent of access trips and 21.6 percent of egress trips are transfers. Automobiles and other private vehicles account for 21.0 percent of access trips and 12.0 percent of egress trips including automobile drivers. passengers, and persons dropped off. Alternative Mode of Travel: If public transportation service were no longer available, 55.9 percent of public transit riders would make the same trip by automobile or other personal vehicle: 23.9 percent would drive themselves, 22.1 percent would get a ride with someone else, and 9.9 percent would take a taxi. Besides the resulting increase in traffic, there would also be a substantial reduction in mobility because 21.6 of public transit riders would not be able to make their trips. Duration of Transit Riding: Most public transportation riders have been riding for an extended period, 57.1 percent have been riding for over two years. At the same time public transit is attracting new riders with 30.3 percent of trips taken by riders in their first year of riding their transit system. Frequency of Transit Travel: Most public transportation trips are taken by regular riders. Nearly two-thirds, 65.5 percent of public transit trips are taken by persons who ride transit five or more days per week and 81.2 percent of trips are taken by persons who ride 3 or more days per week. Transfer Frequency: Sixty percent of public transportation trips do not include a transfer between transit vehicles, 29.3 percent include one transfer, 8.4 percent include two transfers, and 2.3 percent include three or more transfers. Trip Purpose: Commuting to work is the most common reason a person rides public transportation, accounting for 59.2 percent of all transit trips reported in on-board surveys. Trips to school, including elementary, secondary, and college students, account for 10.6 percent of all trips. Shopping and dining is the trip purpose for 8.5 percent of trips, 6.3 percent of trips are for personal business, 6.8 percent are for social purposes, 3.0 percent are medical trips, and 5.7 percent are for other trip purposes.
A Profile of Public Transportation Passenger Demographics and Travel Characteristics, Page 9
2. INTRODUCTION Public transportation agencies conduct on-board surveys of their riders on a recurring, but often infrequent, basis. The surveys are important for local transportation planning and marketing purposes. Knowledge of who transit customers are and how they travel is essential for tailoring transit service to meet each community's needs. But descriptions of America's transit riders on a national basis are both infrequent and usually of a limited nature. The American Public Transportation Association (APTA) first reported on transit users characteristics in 1992 in Americans In Transit: A Profile of Public Transit Passengers (APTA Profile 1992). This study seeks to update information on characteristics in that report, add data about demographic and travel characteristics not previously reported, and compare those data to information found in other descriptions of transit riders. 2.1. Previous Studies of Passenger Characteristics Since 1992 other national summaries of transit passenger characteristics have been published. The Center for Urban Transportation Research compiled data from the 1995 Nationwide Personal Transportation Survey (NPTS 1995) and the 2001 National Household Travel Survey (NHTS 2001). Two summaries of coordinated on-board transit vehicle passenger surveys were compiled by McCollom Management Consulting for APTA and the Federal Transit Administration (FTA) using data from 58 surveys conducted from 1996 through 2003 (TPMS I and II and TPMS III). The U.S. Census Bureau also published characteristics of commuters for work trips by mode, including separate data for transit commuters, from the 2004 American Community Survey (ACS 2004). This report, A Profile of Public Transportation Passenger Demographics and Travel Characteristics Reported in On-Board Surveys, will differ from earlier reports and be the first to combine passenger data from large sample of uncoordinated on-board surveys conducted by transit agencies. 2.2. Data Are Compiled from On-Board Surveys On-board surveys are questionnaires given to and completed by transit passengers while they are riding a transit vehicle. In some cases the surveys may be mailed to the transit agency if they are not completed by the passengers before they leave the transit vehicles. A few of the surveys used to compile this report were done by or supplemented with telephone surveys. Typically this was for demand responsive service where a list of actual riders of the service and their travel records were available and it would be inconvenient to survey the riders while they were on the vehicle. A limited number of surveys also used intercept interviews or questionnaires where passengers are surveyed in transit stations or waiting areas. A total of 150 survey reports were used to compile the data in this report. If a transit agency surveyed more than one vehicle mode of travel, e.g., motor bus, demand response, commuter rail, etc., each modal survey was counted as a separate survey. The set of sample surveys is described in a later section of this report.
A Profile of Public Transportation Passenger Demographics and Travel Characteristics, Page 10
2.3. On-Board Surveys Considered to Be Very Accurate On-board questionnaires can be considered among the most accurate of transit passenger survey techniques. A Transit Cooperative Research Program Synthesis (TCRP Synthesis 63) reported that 63 percent of transit agencies studied had as a major reason for using an on-board survey methodology that the on-board survey obtained "better information (accuracy, reliability, detail) from respondents" compared to other methodologies. (TRCP Synthesis 63, p. 7) There are two items of information that are known using an on-board survey methodology with near certitude: the fact that the surveyed passenger actually rode transit, and the mode the passenger rode on. This certitude does not exist for other forms of survey such as telephone surveys where the information is recalled by respondents or travel logs where the respondents complete the questionnaire on their own. The potential error avoided by near certitude in these items can be illustrated by comparison to the 2000 U.S. Census journey-to-work data for the St. Louis MO-IL urbanized area. The Census reported that 497 persons rode "streetcar or trolley car," 2,255 rode "subway or elevated," and 388 rode "railroad" as their primary means of transportation to work (Census J-t-W 2000). St. Louis' only mode of rail transit service is light rail which among the census options would most closely correspond to "streetcar or trolley car." The survey, however, because it does not use current terminology and is completed by randomly selected persons without guidance results in erroneous reports. The correction for the data for St. Louis is obvious, but when these data are summed with other metropolitan areas to report national totals the error in the result will no longer be obvious or easily correctable. On-board questionnaires suffer from the same potential error as other survey techniques when questions are answered by the traveler independently of any assistance. As with other techniques, accurate responses require careful phrasing of questions so that respondents understand both the questions and the nuances of the answers from which they are asked to select. 2.4. Data Describe Characteristics of Typical Riders, Not Characteristics of Average Person Who Rides An important point to understanding these results that will be repeatedly stressed is that these data describe trips taken by transit riders; they do not describe the riders. For example, on Table 12, the 55.5 percent female gender national total statistic means that 55.5 of transit trips are taken by women, not that 55.5 percent of people who ride transit are women. These surveys do not tag data to individual persons and, therefore, do not describe the people. They describe how frequently a person with specific demographic or travel characteristics rides transit. A regular transit user who rides transit 10 times a week has 10 times as great of chance of having their characteristics surveyed as an occasional user who rides once a week. Over a large sample these characteristics will become weighted by the number of times each individual rides transit and describe the average transit rider, not the average person who rides transit.
A Profile of Public Transportation Passenger Demographics and Travel Characteristics, Page 11
Transit on-board survey results for 15 demographic and travel characteristics are summarized in the following sections. All characteristics are summarized that were included in least 33 of the available surveys. Many additional questions were asked in a smaller number of the surveys available for this report. Fourteen of those 15 characteristics are compared in a later section of this report to data from other travel surveys or to census data. For one characteristic there are no comparable data.
3. METHODOLOGY The data presented in this report were summarized from 150 on-board transit vehicle surveys conducted by or coordinated with transit agencies. All data presented herein are the result of expansion of data from those surveys to estimate national totals. Surveys used in this report were gathered by APTA from survey results published on the Internet and from responses by APTA members to a letter requesting their newest available survey results. On-board surveys can be a costly and time-consuming endeavors. Although the data they produce have great value for transit planning and decision making, their expense in dollars and time means that not all transit agencies conduct on-board surveys and those that do, do so irregularly. The surveys used herein include any available survey results produced from 2000 through 2005. When a transit agency had conducted more than one survey during the period, the newest survey was used except when a question included in an older survey was not included in the more recent survey, then the older survey was used for that question. To calculate the results for each characteristic, the data for all surveys that asked a question about that characteristic were tallied. The tallied amounts were then recorded in standard ranges of numbers because individual surveys summarized data in many different data ranges. For some questions such as age and household income, the data were further disaggregated into data for individual years of age or thousands of dollars of income. The accumulated data were then weighted, that is, multiplied by the number of passenger trips carried in the survey year on that mode of service by that transit agency as reported in the Federal Transit Administration's (FTA) National Transit Database (NTD). (NTD Report) This multiplication adjusts for the differences in size among transit agencies. The data were then summed by transit mode with bus systems further disaggregated into three groups of bus systems in urbanized areas over 1,000,000 population, bus systems in urbanized areas from 200,000 to 999,999 population, and bus systems in urbanized areas with population less than 200,000 and in rural areas. Each of these groups were expanded to account for non-participating transit agencies based on the total ridership in those modes and bus population categories for 2004 as reported in the APTA Transit Ridership Report for 2004. (APTA Ridership Report) Results for each question were reported for Rail Modes, Roadway Modes, and a total. Rail Modes include commuter rail, heavy rail, light rail, automated guideway transit, and ferry boat. Roadway Modes include motor bus and demand responsive paratransit. For questions summarized from 94 or more surveys, results are also reported for three categories of population: urbanized areas of
A Profile of Public Transportation Passenger Demographics and Travel Characteristics, Page 12
1,000,000 or more, urbanized areas from 200,000 to 999,999, and urbanized areas less than 200,000 and rural areas outside of urbanized areas. Rail Modes are formally known as "Fixed-Guideway Modes" and include ferry boats, trolley bus, and bus rapid transit. Bus rapid transit operating data, however, are normally included in total bus data and operations on the bus rapid transit portion of an agency's total bus system cannot be disaggregated. This is also the case for the on-board surveys data included herein where any surveys taken on buses that operate on bus rapid transit facilities or trolley bus facilities are included in total bus data. Therefore, for simplicity and ease of expression the fixed-guideway modes in this report, including all rail modes plus ferry boats but excluding bus rapid transit and trolley bus, are referred to as "Rail Modes." It is also important to recognize that the results presented herein are a description of transit riders who participate in on-board surveys. These data do not necessarily represent all transit passengers because on-board surveys frequently do not survey children below a certain age. The potential impact of that bias is discussed below in the Description of Sample section. 3.1. Description of Sample The data presented herein are estimated from a sample of 150 on-board surveys conducted by or in coordination with transit agencies. 3.1.1. Sample Size by Mode of Transit Service The sample of surveys includes 150 system-modes as reported in Table 1. A system-mode is a report of an on-board vehicle survey on one vehicle mode for one transit system. If a transit system operated, for example, motor bus and light rail service and reported surveys taken on both modes, they would be counted as 2 system-modes. The usual practice for on-board surveys is for a transit agency to summarize data for each individual mode surveyed no matter how many modes the agency operates. A small number of surveys were available that included data for two or more modes added together. These surveys were not used because those data could not be disaggregated into individual modes for expansion and the expansion methodology requires individual mode of service data. The expansion methodology is based on modes of service because it was expected that variations in characteristics would be greater between mode of service than between population of service area or size of transit system, the only other ways available to stratify the transit systems in the report. This expectation is confirmed by the results presented in this report. Surveys were available for seven different vehicle modes: 116 motor bus surveys, 9 for light rail, 7 for heavy rail, 8 for commuter railroad, 8 for demand response, and 2 other which is composed of 1 for ferry boat and 1 for automated guideway transit. The 150 system-modes in the sample carried 60.3 percent of all U.S. transit trips. The passengers carried were measured for the year the survey was completed but were expanded to 2004 unlinked trip totals for each mode. Data for 2004 were the most recently available national totals with modal
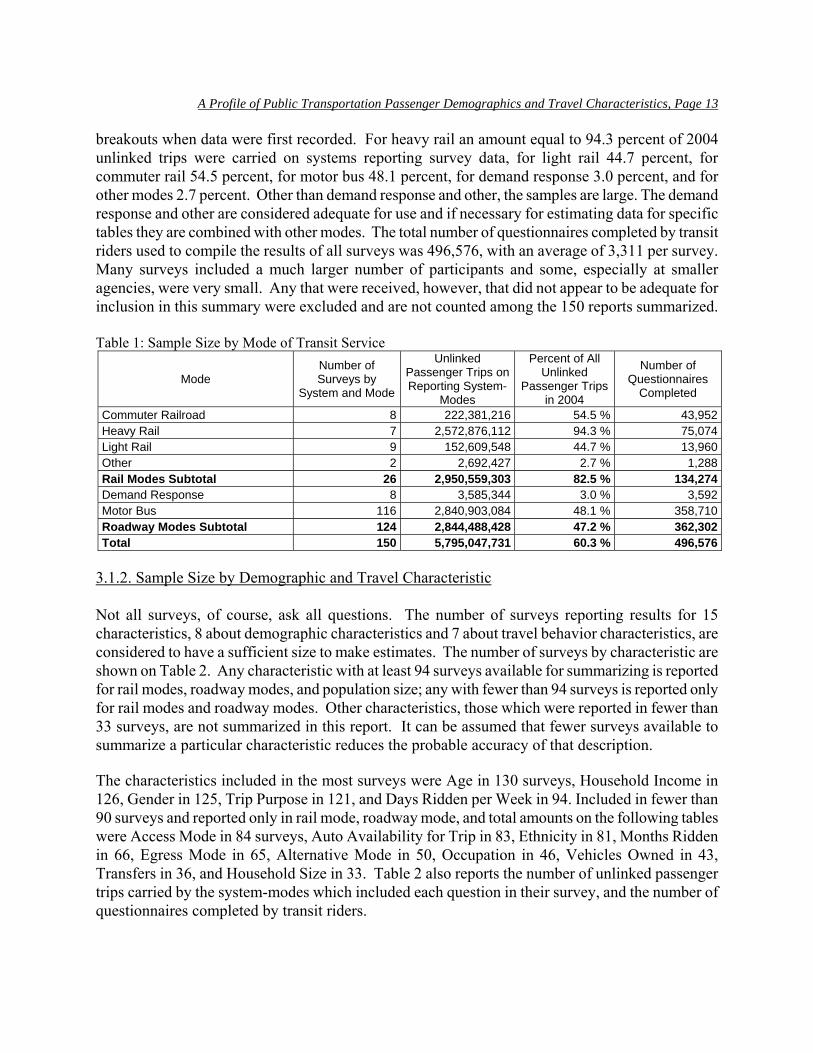
A Profile of Public Transportation Passenger Demographics and Travel Characteristics, Page 13
breakouts when data were first recorded. For heavy rail an amount equal to 94.3 percent of 2004 unlinked trips were carried on systems reporting survey data, for light rail 44.7 percent, for commuter rail 54.5 percent, for motor bus 48.1 percent, for demand response 3.0 percent, and for other modes 2.7 percent. Other than demand response and other, the samples are large. The demand response and other are considered adequate for use and if necessary for estimating data for specific tables they are combined with other modes. The total number of questionnaires completed by transit riders used to compile the results of all surveys was 496,576, with an average of 3,311 per survey. Many surveys included a much larger number of participants and some, especially at smaller agencies, were very small. Any that were received, however, that did not appear to be adequate for inclusion in this summary were excluded and are not counted among the 150 reports summarized. Table 1: Sample Size by Mode of Transit Service
Mode Number of Surveys by
System and Mode
Unlinked Passenger Trips on Reporting System-
Modes
Percent of All Unlinked
Passenger Trips in 2004
Number of Questionnaires
Completed
Commuter Railroad 8 222,381,216 54.5 % 43,952Heavy Rail 7 2,572,876,112 94.3 % 75,074Light Rail 9 152,609,548 44.7 % 13,960Other 2 2,692,427 2.7 % 1,288Rail Modes Subtotal 26 2,950,559,303 82.5 % 134,274Demand Response 8 3,585,344 3.0 % 3,592Motor Bus 116 2,840,903,084 48.1 % 358,710Roadway Modes Subtotal 124 2,844,488,428 47.2 % 362,302Total 150 5,795,047,731 60.3 % 496,576
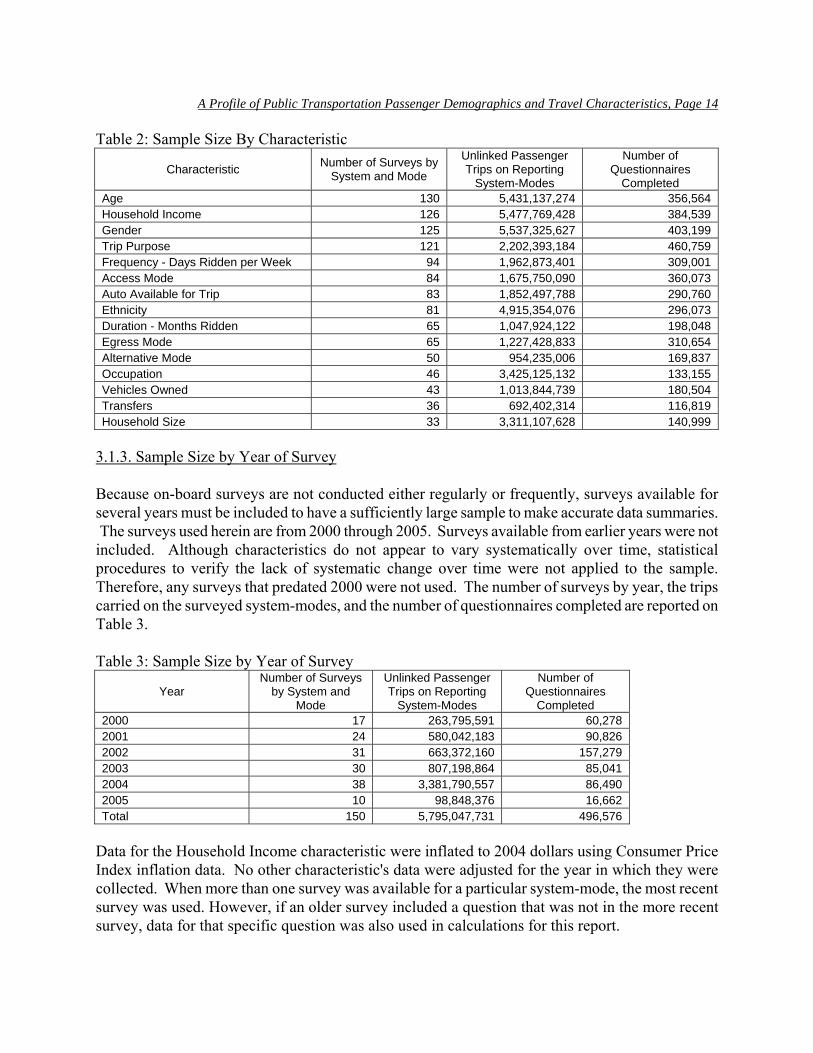
3.1.2. Sample Size by Demographic and Travel Characteristic Not all surveys, of course, ask all questions. The number of surveys reporting results for 15 characteristics, 8 about demographic characteristics and 7 about travel behavior characteristics, are considered to have a sufficient size to make estimates. The number of surveys by characteristic are shown on Table 2. Any characteristic with at least 94 surveys available for summarizing is reported for rail modes, roadway modes, and population size; any with fewer than 94 surveys is reported only for rail modes and roadway modes. Other characteristics, those which were reported in fewer than 33 surveys, are not summarized in this report. It can be assumed that fewer surveys available to summarize a particular characteristic reduces the probable accuracy of that description. The characteristics included in the most surveys were Age in 130 surveys, Household Income in 126, Gender in 125, Trip Purpose in 121, and Days Ridden per Week in 94. Included in fewer than 90 surveys and reported only in rail mode, roadway mode, and total amounts on the following tables were Access Mode in 84 surveys, Auto Availability for Trip in 83, Ethnicity in 81, Months Ridden in 66, Egress Mode in 65, Alternative Mode in 50, Occupation in 46, Vehicles Owned in 43, Transfers in 36, and Household Size in 33. Table 2 also reports the number of unlinked passenger trips carried by the system-modes which included each question in their survey, and the number of questionnaires completed by transit riders.
A Profile of Public Transportation Passenger Demographics and Travel Characteristics, Page 14
Table 2: Sample Size By Characteristic
Characteristic Number of Surveys by System and Mode
Unlinked Passenger Trips on Reporting
System-Modes
Number of Questionnaires
Completed Age 130 5,431,137,274 356,564 Household Income 126 5,477,769,428 384,539 Gender 125 5,537,325,627 403,199 Trip Purpose 121 2,202,393,184 460,759 Frequency - Days Ridden per Week 94 1,962,873,401 309,001 Access Mode 84 1,675,750,090 360,073 Auto Available for Trip 83 1,852,497,788 290,760 Ethnicity 81 4,915,354,076 296,073 Duration - Months Ridden 65 1,047,924,122 198,048 Egress Mode 65 1,227,428,833 310,654 Alternative Mode 50 954,235,006 169,837 Occupation 46 3,425,125,132 133,155 Vehicles Owned 43 1,013,844,739 180,504 Transfers 36 692,402,314 116,819 Household Size 33 3,311,107,628 140,999
3.1.3. Sample Size by Year of Survey Because on-board surveys are not conducted either regularly or frequently, surveys available for several years must be included to have a sufficiently large sample to make accurate data summaries. The surveys used herein are from 2000 through 2005. Surveys available from earlier years were not included. Although characteristics do not appear to vary systematically over time, statistical procedures to verify the lack of systematic change over time were not applied to the sample. Therefore, any surveys that predated 2000 were not used. The number of surveys by year, the trips carried on the surveyed system-modes, and the number of questionnaires completed are reported on Table 3. Table 3: Sample Size by Year of Survey
Year Number of Surveys
by System and Mode
Unlinked Passenger Trips on Reporting
System-Modes
Number of Questionnaires
Completed 2000 17 263,795,591 60,278 2001 24 580,042,183 90,826 2002 31 663,372,160 157,279 2003 30 807,198,864 85,041 2004 38 3,381,790,557 86,490 2005 10 98,848,376 16,662 Total 150 5,795,047,731 496,576
Data for the Household Income characteristic were inflated to 2004 dollars using Consumer Price Index inflation data. No other characteristic's data were adjusted for the year in which they were collected. When more than one survey was available for a particular system-mode, the most recent survey was used. However, if an older survey included a question that was not in the more recent survey, data for that specific question was also used in calculations for this report.
A Profile of Public Transportation Passenger Demographics and Travel Characteristics, Page 15
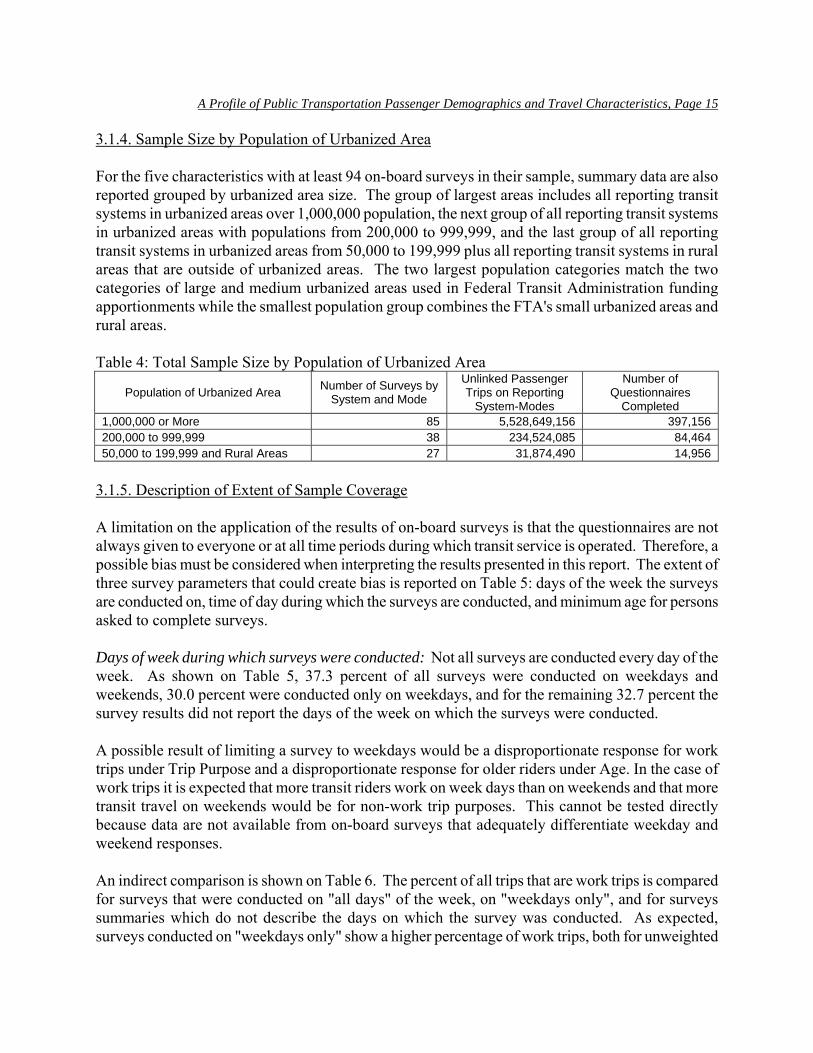
3.1.4. Sample Size by Population of Urbanized Area For the five characteristics with at least 94 on-board surveys in their sample, summary data are also reported grouped by urbanized area size. The group of largest areas includes all reporting transit systems in urbanized areas over 1,000,000 population, the next group of all reporting transit systems in urbanized areas with populations from 200,000 to 999,999, and the last group of all reporting transit systems in urbanized areas from 50,000 to 199,999 plus all reporting transit systems in rural areas that are outside of urbanized areas. The two largest population categories match the two categories of large and medium urbanized areas used in Federal Transit Administration funding apportionments while the smallest population group combines the FTA's small urbanized areas and rural areas. Table 4: Total Sample Size by Population of Urbanized Area
Population of Urbanized Area Number of Surveys by System and Mode
Unlinked Passenger Trips on Reporting
System-Modes
Number of Questionnaires
Completed 1,000,000 or More 85 5,528,649,156 397,156 200,000 to 999,999 38 234,524,085 84,464 50,000 to 199,999 and Rural Areas 27 31,874,490 14,956
3.1.5. Description of Extent of Sample Coverage A limitation on the application of the results of on-board surveys is that the questionnaires are not always given to everyone or at all time periods during which transit service is operated. Therefore, a possible bias must be considered when interpreting the results presented in this report. The extent of three survey parameters that could create bias is reported on Table 5: days of the week the surveys are conducted on, time of day during which the surveys are conducted, and minimum age for persons asked to complete surveys. Days of week during which surveys were conducted: Not all surveys are conducted every day of the week. As shown on Table 5, 37.3 percent of all surveys were conducted on weekdays and weekends, 30.0 percent were conducted only on weekdays, and for the remaining 32.7 percent the survey results did not report the days of the week on which the surveys were conducted. A possible result of limiting a survey to weekdays would be a disproportionate response for work trips under Trip Purpose and a disproportionate response for older riders under Age. In the case of work trips it is expected that more transit riders work on week days than on weekends and that more transit travel on weekends would be for non-work trip purposes. This cannot be tested directly because data are not available from on-board surveys that adequately differentiate weekday and weekend responses. An indirect comparison is shown on Table 6. The percent of all trips that are work trips is compared for surveys that were conducted on "all days" of the week, on "weekdays only", and for surveys summaries which do not describe the days on which the survey was conducted. As expected, surveys conducted on "weekdays only" show a higher percentage of work trips, both for unweighted

A Profile of Public Transportation Passenger Demographics and Travel Characteristics, Page 16
averages and weighted averages where the percentages are weighted by the number of riders carried by each transit system before an overall average is calculated. The unweighted percentage shows about 5 percent higher share of work trips when the surveys are conducted on "weekdays only" compared to "all days" and the weighted percentage shows about a 10 percent higher share of work trips when the surveys are conducted on "weekdays only". This indicates that, given a similar share of total trips taken on "weekdays only" versus "all days" surveys that report trip purpose (data are on Table 7), the trip purpose data reported later in Section 4.2.6. may overstate the share of work trips by approximately 2.5 percent to 5.0 percent. Table 5: Description of Extent of Sample Coverage
Qualifier
Number Respondents by
System and Mode
Percent of System-Modes
Unlinked Passenger Trips
on Reporting System-Modes
Number of Questionnaires
Completed
Days of Week During Which Survey Conducted: All Days 56 37.3% 3,712,902,914 130,464 Weekdays Only 45 30.0% 601,772,446 140,109 Days Surveyed Not Reported 49 32.7% 1,480,372,371 226,003 Times of Day During Which Survey Conducted: All Times 94 62.7% 4,491,319,782 347,209 Restricted Time Periods 8 5.3% 229,932,958 10,876 Times Surveyed Not Reported 48 32.0% 1,073,794,991 138,491 Age Restriction on Persons Surveyed: All Persons Surveyed 3 2.0% 1,198,081 9931 Below Age Cutoff Not Surveyed 56 37.3% 1,500,432,889 206,997 Not Reported 91 60.7% 4,293,416,761 288,648
The average age of respondents on "weekdays only," however, was lower than for "all days." If a high percentage of trips are made for work purposes on weekdays, it might be expected that the average age on weekdays would be higher. This effect might, however, be offset by a higher percentage of trips for school purposes on weekdays compared to all days. Table 6: Comparison of Selected Statistics Showing Effect of Variation in Survey Qualifiers
Percent of Work Trips Reported in "Trip Purpose" Questions Average Age of Respondents
Qualifier Unweighted Percent
Weighted Percent Unweighted Weighted
Days of Week During Which Survey Conducted: All Days 45.5% 53.0% 39.3 39.1 Weekdays Only 50.7% 63.5% 36.8 37.4 Days Surveyed Not Reported 48.0% 60.0% 39.2 39.8 Times of Day During Which Survey Conducted: All Times 61.1% 48.2% 38.2 39.1 Restricted Time Periods 65.0% 60.1% 39.0 39.5 Times Surveyed Not Reported 53.4% 45.4% 39.2 38.9 Age Restriction on Persons Surveyed: All Persons Surveyed (a) (a) (a) (a) Below Age Cutoff Not Surveyed 53.0% 49.0% 37.1 37.9 Not Reported 64.6% 48.1% 39.3 39.5
(a) Sample too small for valid calculation.
A Profile of Public Transportation Passenger Demographics and Travel Characteristics, Page 17
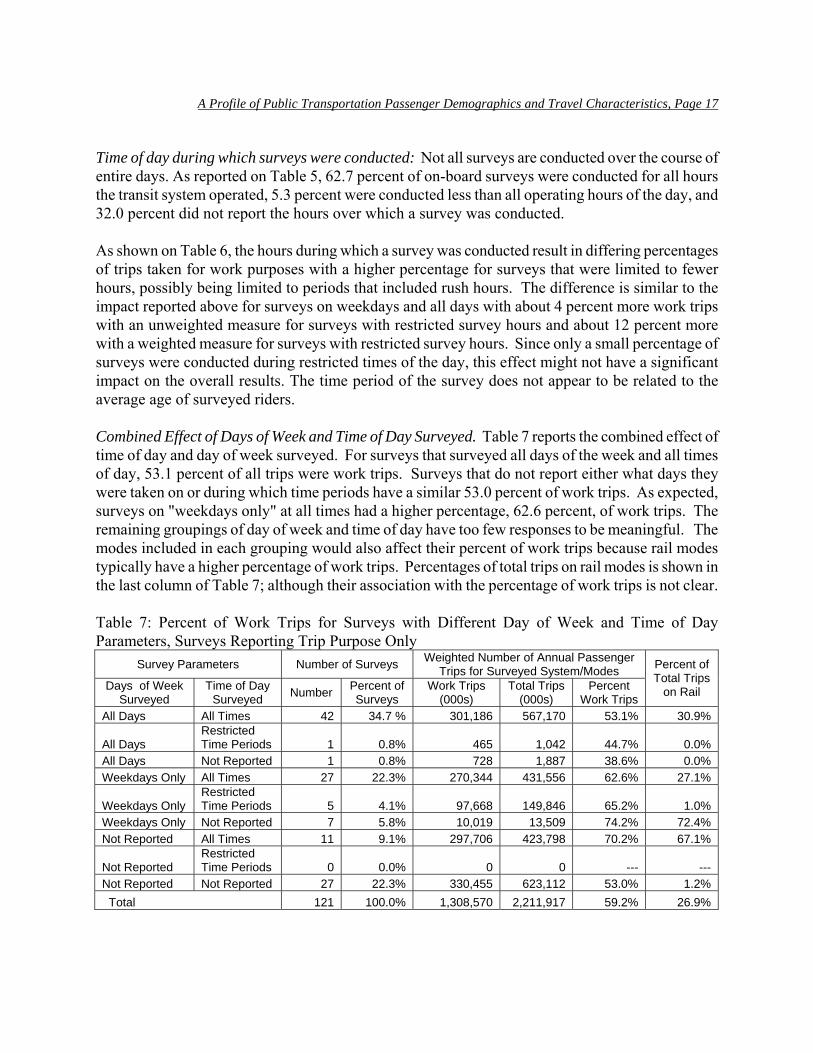
Time of day during which surveys were conducted: Not all surveys are conducted over the course of entire days. As reported on Table 5, 62.7 percent of on-board surveys were conducted for all hours the transit system operated, 5.3 percent were conducted less than all operating hours of the day, and 32.0 percent did not report the hours over which a survey was conducted. As shown on Table 6, the hours during which a survey was conducted result in differing percentages of trips taken for work purposes with a higher percentage for surveys that were limited to fewer hours, possibly being limited to periods that included rush hours. The difference is similar to the impact reported above for surveys on weekdays and all days with about 4 percent more work trips with an unweighted measure for surveys with restricted survey hours and about 12 percent more with a weighted measure for surveys with restricted survey hours. Since only a small percentage of surveys were conducted during restricted times of the day, this effect might not have a significant impact on the overall results. The time period of the survey does not appear to be related to the average age of surveyed riders. Combined Effect of Days of Week and Time of Day Surveyed. Table 7 reports the combined effect of time of day and day of week surveyed. For surveys that surveyed all days of the week and all times of day, 53.1 percent of all trips were work trips. Surveys that do not report either what days they were taken on or during which time periods have a similar 53.0 percent of work trips. As expected, surveys on "weekdays only" at all times had a higher percentage, 62.6 percent, of work trips. The remaining groupings of day of week and time of day have too few responses to be meaningful. The modes included in each grouping would also affect their percent of work trips because rail modes typically have a higher percentage of work trips. Percentages of total trips on rail modes is shown in the last column of Table 7; although their association with the percentage of work trips is not clear. Table 7: Percent of Work Trips for Surveys with Different Day of Week and Time of Day Parameters, Surveys Reporting Trip Purpose Only
Survey Parameters Number of Surveys Weighted Number of Annual Passenger Trips for Surveyed System/Modes
Days of Week Surveyed
Time of Day Surveyed Number Percent of
Surveys Work Trips
(000s) Total Trips
(000s) Percent
Work Trips
Percent of Total Trips
on Rail
All Days All Times 42 34.7 % 301,186 567,170 53.1% 30.9%
All Days Restricted Time Periods 1 0.8% 465 1,042 44.7% 0.0%
All Days Not Reported 1 0.8% 728 1,887 38.6% 0.0% Weekdays Only All Times 27 22.3% 270,344 431,556 62.6% 27.1%
Weekdays Only Restricted Time Periods 5 4.1% 97,668 149,846 65.2% 1.0%
Weekdays Only Not Reported 7 5.8% 10,019 13,509 74.2% 72.4% Not Reported All Times 11 9.1% 297,706 423,798 70.2% 67.1%
Not Reported Restricted Time Periods 0 0.0% 0 0 --- ---
Not Reported Not Reported 27 22.3% 330,455 623,112 53.0% 1.2% Total 121 100.0% 1,308,570 2,211,917 59.2% 26.9%
A Profile of Public Transportation Passenger Demographics and Travel Characteristics, Page 18
Minimum Age of Persons Surveyed: Finally, most surveys are not administered to or for persons below a minimum age. The minimum age varies between surveys, but as shown on Table 5, only 2.0 percent of surveys included persons of all ages. An age restriction was reported for 37.3 percent of all surveys and 60.7 percent of surveys did not describe this parameter of their methodology. Since the all persons group is only three surveys, the results of a comparison to age restricted surveys would not be meaningful.
4. FINDINGS The findings are presented below on tables in a standardized format. Across the top row are categories that summarize the options by which each characteristic is described. The bottom row of each table summarizes the sample size by reporting the number of system/mode surveys that include the characteristic reported, the number of unlinked passenger trips carried by the surveyed system/modes, and the number of questionnaires completed by persons on the surveyed system/modes. Where 94 or more system/mode on-board survey summaries were available, data are aggregated by area population size categories as well as bus and rail modes. When fewer than 94 system/mode on-board survey summaries were available only bus and rail mode breakouts as well as totals for all modes are reported. 4.1. Demographic Characteristics of Public Transportation Riders Demographic characteristics are those which describe the transit riders and their households. The demographic characteristics listed herein are Age, Ethnicity, Gender, Household Income, Household Size, Occupation, Vehicle Availability for Trip, and Vehicles Owned. 4.1.1. Age Age data were reported on 130 surveys. Typically age data are reported in ranges, with the percent of persons in 5 to 7 categories grouping ages being a typical presentation. To calculate the national totals, an estimate was first made for each survey of the percentage of persons for every year of age. For example, if a survey summary said that 22 percent of surveyed riders were between the age of 20 and 29, a 10 year period, then 2.2 percent would be recorded for that system for each age of 20 years old, 21 years old, etc., through 29 years old. These percents were then weighted, that is, multiplied by the number of riders carried on the surveyed mode by the transit system during the reporting year. After all 130 surveys were compiled in this manner they were summed and expanded in modal groups for non-reporting systems. Since the number of years in the oldest on-board survey reported age category is normally not closed, for example, 65 years old and older, the number of years assumed in that category was set equal to the number of years in the previous category for that survey unless the next to last category was so short that common sense indicated two time periods should added. Typically this meant the oldest rider was assumed to be 75 years old and for some surveys 80 years old. This will be apparent when Figure 2 is discussed. The results are shown on Figure 1 and reported on Tables 8 and 9.
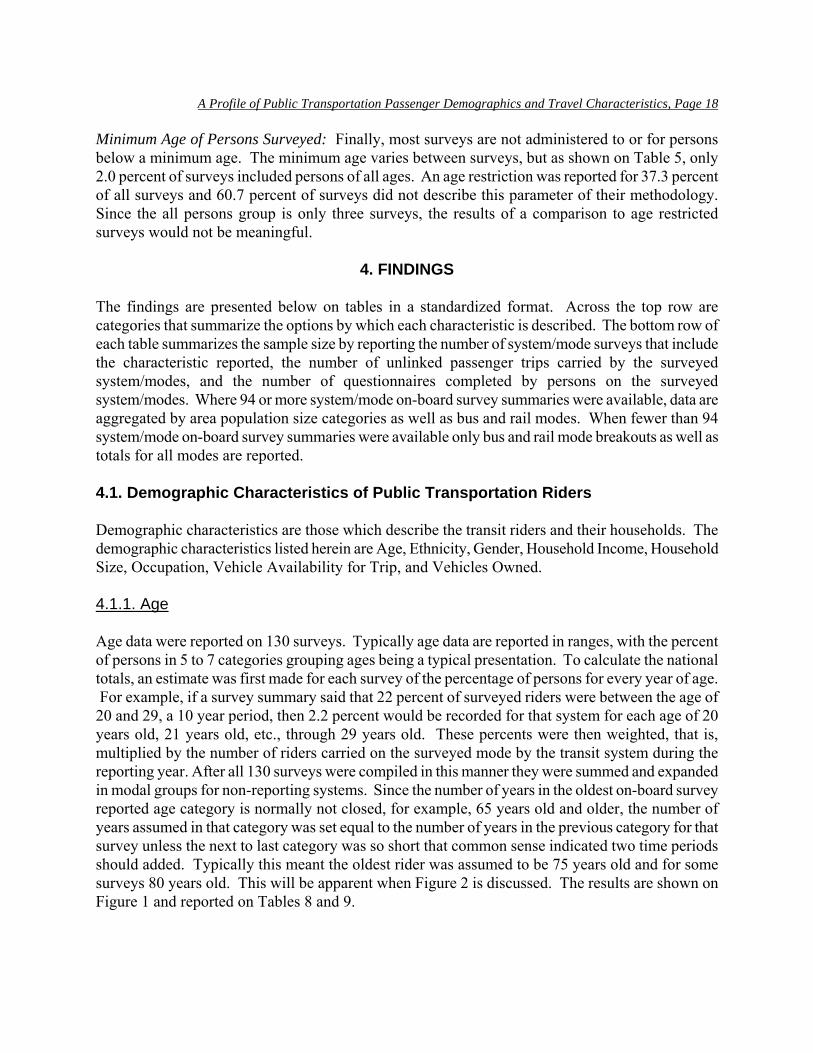
A Profile of Public Transportation Passenger Demographics and Travel Characteristics, Page 19
The age groups shown on Figure 1 and Tables 8 and 9 are selected to be the same as age groups normally reported by the U.S. Census. These data are compared to Census data in a later section that compares the data from on-board surveys with other demographic and travel data. Eighty-eight system/mode surveys reported age data that began at zero for their lowest age range whereas 42 reports had age data only for persons above a specific age in their reported range, most commonly beginning at 12 or 18 years old. Table 8 reports "Adjusted Data" by expanding the reports that start counting riders at a minimum age to include estimates of younger riders proportionate to the number of younger riders reported by the 88 systems counting all younger persons. Following this methodology, 4.0 percent of all transit trips are taken by persons 14 years of age or younger. Table 9, "Not Adjusted Data," does not make this adjustment for the 42 reports that do not include young riders, resulting in 1.7 percent of the trips being taken by riders 14 years of age or younger. Transit is ridden primarily by adults with the majority of trips taken by persons between 25 and 54 years in age. Care should be taken when comparing data on Tables 8 and 9 between columns because the number of years in the groupings varies, with the first column including 15 years, the second and third 5 years each, and the next four columns 10 years of age each.
Figure 1: Age
14 and Under, 4.0%
15 to 19, 8.5%
20 to 24, 11.5%
25 to 34, 21.7%
35 to 44, 20.2%
45 to 54, 17.5% 55 to 64, 9.8%
65 and Over, 6.7%
For "Adjusted Data" reported on Table 8, riders 14 years old and younger take only 4.0 percent of all trips. Persons 15 to 19 years of age take 8.5 percent of all trips, persons 20 to 24 years of age take 11.5 percent of all trips, persons 25 to 34 years of age take 21.7 percent of all trips, persons 35 to 44 years of age take 20.2 percent of all trips, persons 45 to 54 years of age take 17.5 percent of all trips, persons 55 to 64 years of age take 9.8 percent of all trips, and persons 65 years of age and older take 6.7 percent of all trips. Overall, rail mode riders are somewhat older than roadway mode riders. For "Not Adjusted Data" reported on Table 9, riders 14 years old and younger take only 1.7 percent of all trips. Persons 15 to 19 years of age take 7.0 percent of all trips, persons 20 to 24 years of age take 12.0 percent of all trips, persons 25 to 34 years of age take 22.6 percent of all trips, persons 35
A Profile of Public Transportation Passenger Demographics and Travel Characteristics, Page 20
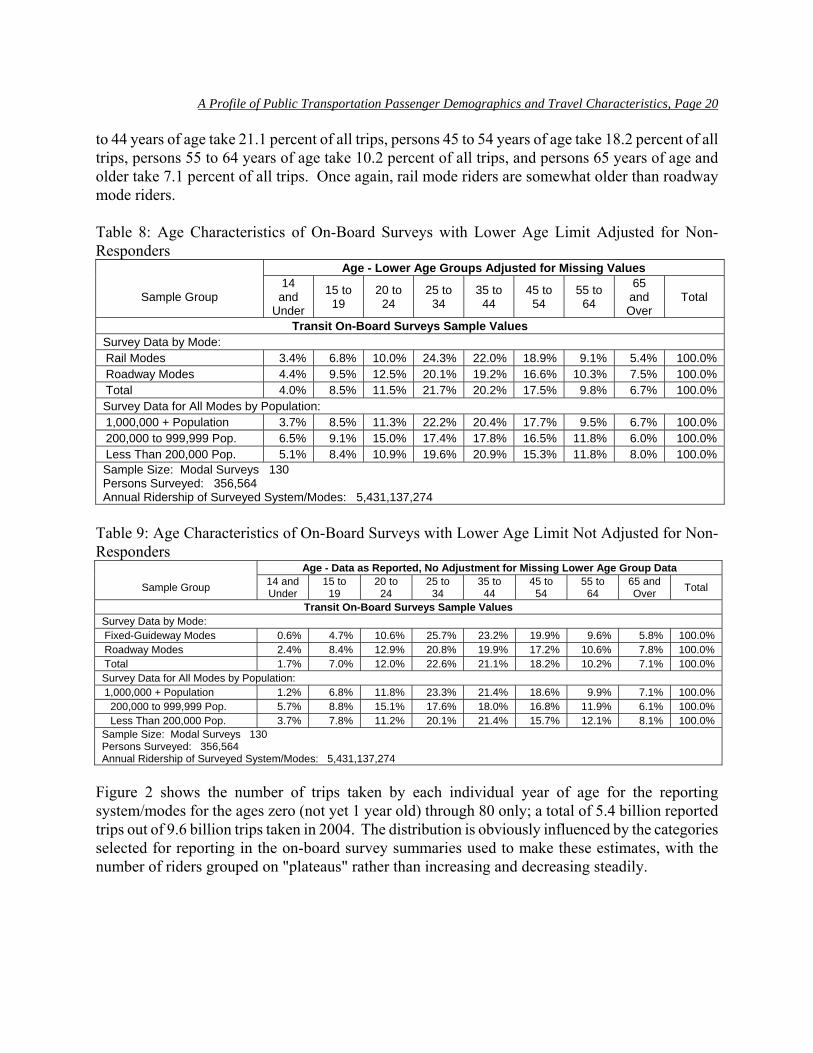
to 44 years of age take 21.1 percent of all trips, persons 45 to 54 years of age take 18.2 percent of all trips, persons 55 to 64 years of age take 10.2 percent of all trips, and persons 65 years of age and older take 7.1 percent of all trips. Once again, rail mode riders are somewhat older than roadway mode riders. Table 8: Age Characteristics of On-Board Surveys with Lower Age Limit Adjusted for Non-Responders
Age - Lower Age Groups Adjusted for Missing Values
Sample Group 14
and Under
15 to 19
20 to 24
25 to 34
35 to 44
45 to 54
55 to 64
65 and Over
Total
Transit On-Board Surveys Sample Values Survey Data by Mode: Rail Modes 3.4% 6.8% 10.0% 24.3% 22.0% 18.9% 9.1% 5.4% 100.0% Roadway Modes 4.4% 9.5% 12.5% 20.1% 19.2% 16.6% 10.3% 7.5% 100.0% Total 4.0% 8.5% 11.5% 21.7% 20.2% 17.5% 9.8% 6.7% 100.0% Survey Data for All Modes by Population: 1,000,000 + Population 3.7% 8.5% 11.3% 22.2% 20.4% 17.7% 9.5% 6.7% 100.0% 200,000 to 999,999 Pop. 6.5% 9.1% 15.0% 17.4% 17.8% 16.5% 11.8% 6.0% 100.0% Less Than 200,000 Pop. 5.1% 8.4% 10.9% 19.6% 20.9% 15.3% 11.8% 8.0% 100.0% Sample Size: Modal Surveys 130 Persons Surveyed: 356,564 Annual Ridership of Surveyed System/Modes: 5,431,137,274
Table 9: Age Characteristics of On-Board Surveys with Lower Age Limit Not Adjusted for Non-Responders
Age - Data as Reported, No Adjustment for Missing Lower Age Group Data
Sample Group 14 and Under
15 to 19
20 to 24
25 to 34
35 to 44
45 to 54
55 to 64
65 and Over Total
Transit On-Board Surveys Sample Values Survey Data by Mode: Fixed-Guideway Modes 0.6% 4.7% 10.6% 25.7% 23.2% 19.9% 9.6% 5.8% 100.0% Roadway Modes 2.4% 8.4% 12.9% 20.8% 19.9% 17.2% 10.6% 7.8% 100.0% Total 1.7% 7.0% 12.0% 22.6% 21.1% 18.2% 10.2% 7.1% 100.0% Survey Data for All Modes by Population: 1,000,000 + Population 1.2% 6.8% 11.8% 23.3% 21.4% 18.6% 9.9% 7.1% 100.0% 200,000 to 999,999 Pop. 5.7% 8.8% 15.1% 17.6% 18.0% 16.8% 11.9% 6.1% 100.0% Less Than 200,000 Pop. 3.7% 7.8% 11.2% 20.1% 21.4% 15.7% 12.1% 8.1% 100.0% Sample Size: Modal Surveys 130 Persons Surveyed: 356,564 Annual Ridership of Surveyed System/Modes: 5,431,137,274
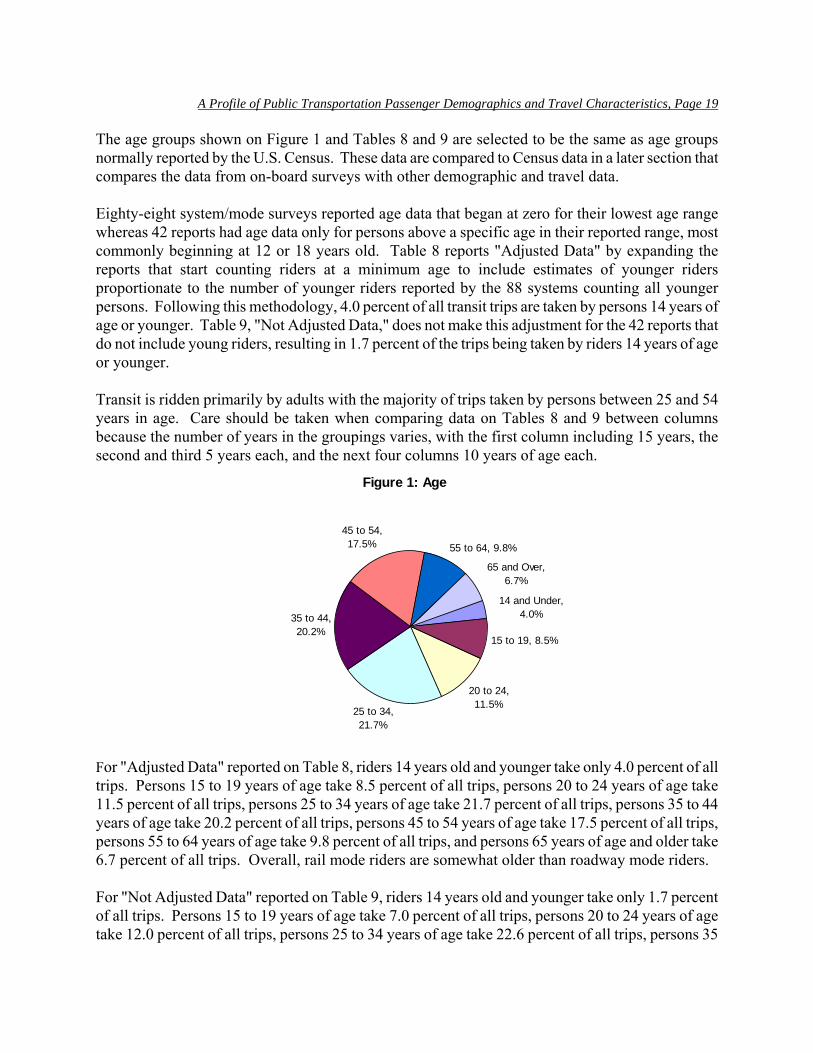
Figure 2 shows the number of trips taken by each individual year of age for the reporting system/modes for the ages zero (not yet 1 year old) through 80 only; a total of 5.4 billion reported trips out of 9.6 billion trips taken in 2004. The distribution is obviously influenced by the categories selected for reporting in the on-board survey summaries used to make these estimates, with the number of riders grouped on "plateaus" rather than increasing and decreasing steadily.
A Profile of Public Transportation Passenger Demographics and Travel Characteristics, Page 21
Figure 2: Distribution of Reported Ages by Years Old andNumber of Annual Unlinked Trips, 0 to 80 Years Old Only
0
20
40
60
80
100
120
140
0 4 8 12 16 20 24 28 32 36 40 44 48 52 56 60 64 68 72 76 80
Age in Years
Est
imat
ed U
nlin
ked
Trip
s R
epor
ting
Sys
tem
s O
nly,
Mill
ions
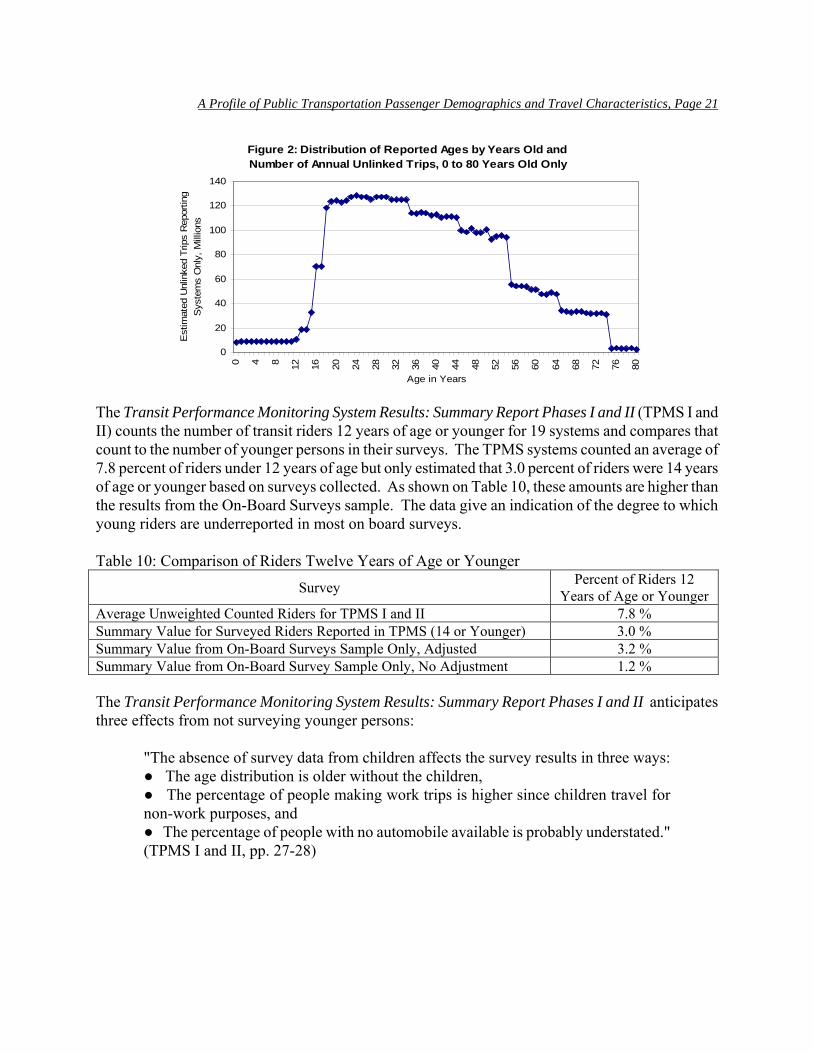
The Transit Performance Monitoring System Results: Summary Report Phases I and II (TPMS I and II) counts the number of transit riders 12 years of age or younger for 19 systems and compares that count to the number of younger persons in their surveys. The TPMS systems counted an average of 7.8 percent of riders under 12 years of age but only estimated that 3.0 percent of riders were 14 years of age or younger based on surveys collected. As shown on Table 10, these amounts are higher than the results from the On-Board Surveys sample. The data give an indication of the degree to which young riders are underreported in most on board surveys. Table 10: Comparison of Riders Twelve Years of Age or Younger
Survey Percent of Riders 12 Years of Age or Younger
Average Unweighted Counted Riders for TPMS I and II 7.8 % Summary Value for Surveyed Riders Reported in TPMS (14 or Younger) 3.0 % Summary Value from On-Board Surveys Sample Only, Adjusted 3.2 % Summary Value from On-Board Survey Sample Only, No Adjustment 1.2 % The Transit Performance Monitoring System Results: Summary Report Phases I and II anticipates three effects from not surveying younger persons:
"The absence of survey data from children affects the survey results in three ways: ● The age distribution is older without the children, ● The percentage of people making work trips is higher since children travel for non-work purposes, and ● The percentage of people with no automobile available is probably understated." (TPMS I and II, pp. 27-28)
A Profile of Public Transportation Passenger Demographics and Travel Characteristics, Page 22
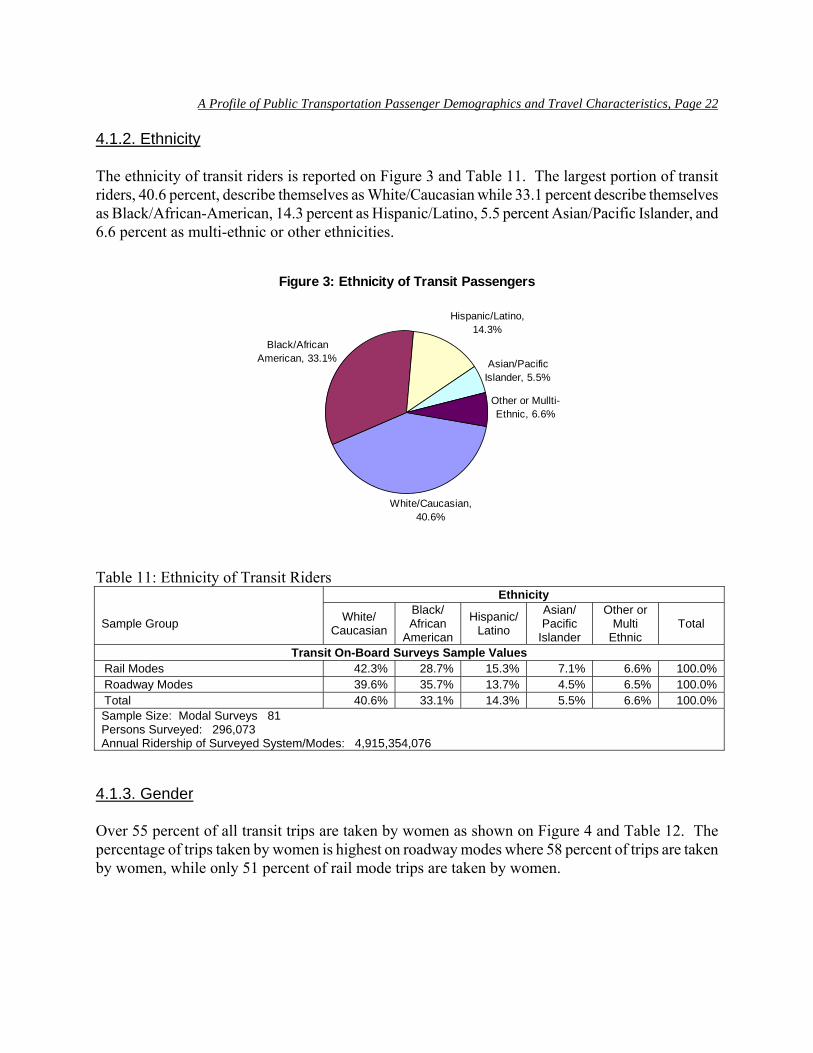
4.1.2. Ethnicity The ethnicity of transit riders is reported on Figure 3 and Table 11. The largest portion of transit riders, 40.6 percent, describe themselves as White/Caucasian while 33.1 percent describe themselves as Black/African-American, 14.3 percent as Hispanic/Latino, 5.5 percent Asian/Pacific Islander, and 6.6 percent as multi-ethnic or other ethnicities.
Figure 3: Ethnicity of Transit Passengers
White/Caucasian, 40.6%
Black/African American, 33.1%
Hispanic/Latino, 14.3%
Asian/Pacific Islander, 5.5%
Other or Mullti-Ethnic, 6.6%
Table 11: Ethnicity of Transit Riders Ethnicity
Sample Group White/ Caucasian
Black/ African
American
Hispanic/ Latino
Asian/ Pacific
Islander
Other or Multi
Ethnic Total
Transit On-Board Surveys Sample Values Rail Modes 42.3% 28.7% 15.3% 7.1% 6.6% 100.0% Roadway Modes 39.6% 35.7% 13.7% 4.5% 6.5% 100.0% Total 40.6% 33.1% 14.3% 5.5% 6.6% 100.0% Sample Size: Modal Surveys 81 Persons Surveyed: 296,073 Annual Ridership of Surveyed System/Modes: 4,915,354,076
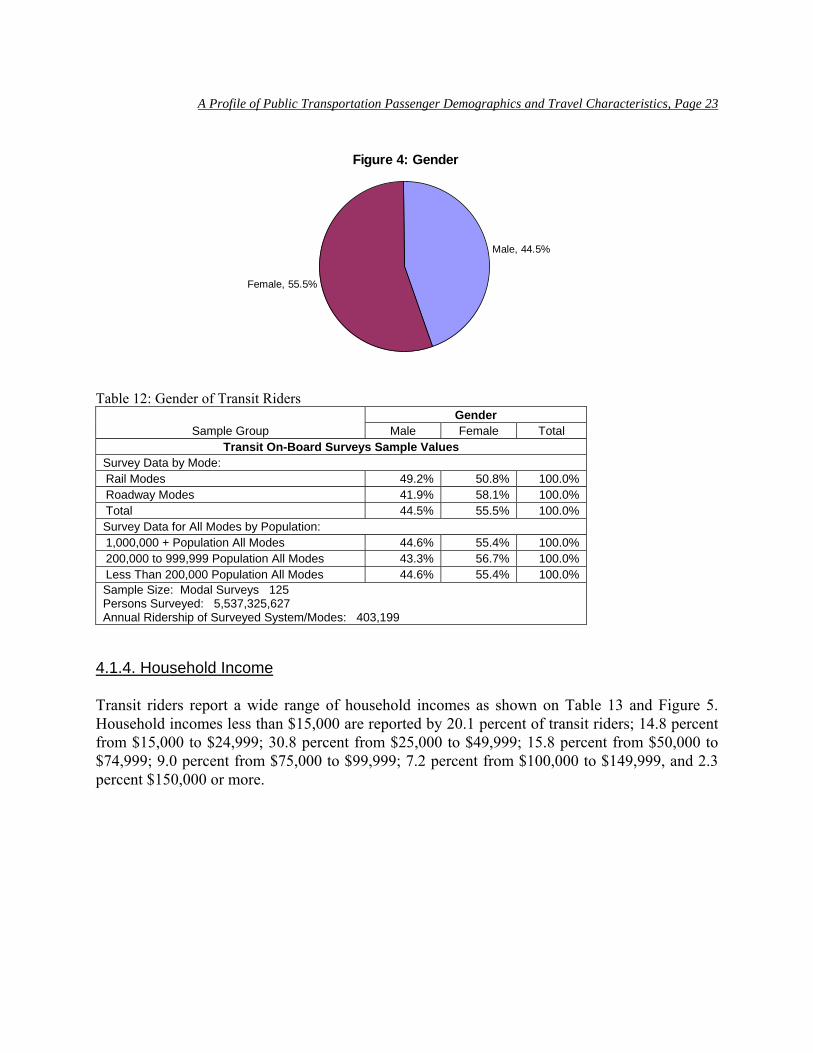
4.1.3. Gender Over 55 percent of all transit trips are taken by women as shown on Figure 4 and Table 12. The percentage of trips taken by women is highest on roadway modes where 58 percent of trips are taken by women, while only 51 percent of rail mode trips are taken by women.
A Profile of Public Transportation Passenger Demographics and Travel Characteristics, Page 23
Figure 4: Gender
Male, 44.5%
Female, 55.5%
Table 12: Gender of Transit Riders
Gender Sample Group Male Female Total
Transit On-Board Surveys Sample Values Survey Data by Mode: Rail Modes 49.2% 50.8% 100.0% Roadway Modes 41.9% 58.1% 100.0% Total 44.5% 55.5% 100.0% Survey Data for All Modes by Population: 1,000,000 + Population All Modes 44.6% 55.4% 100.0% 200,000 to 999,999 Population All Modes 43.3% 56.7% 100.0% Less Than 200,000 Population All Modes 44.6% 55.4% 100.0% Sample Size: Modal Surveys 125 Persons Surveyed: 5,537,325,627 Annual Ridership of Surveyed System/Modes: 403,199
4.1.4. Household Income Transit riders report a wide range of household incomes as shown on Table 13 and Figure 5. Household incomes less than $15,000 are reported by 20.1 percent of transit riders; 14.8 percent from $15,000 to $24,999; 30.8 percent from $25,000 to $49,999; 15.8 percent from $50,000 to $74,999; 9.0 percent from $75,000 to $99,999; 7.2 percent from $100,000 to $149,999, and 2.3 percent $150,000 or more.
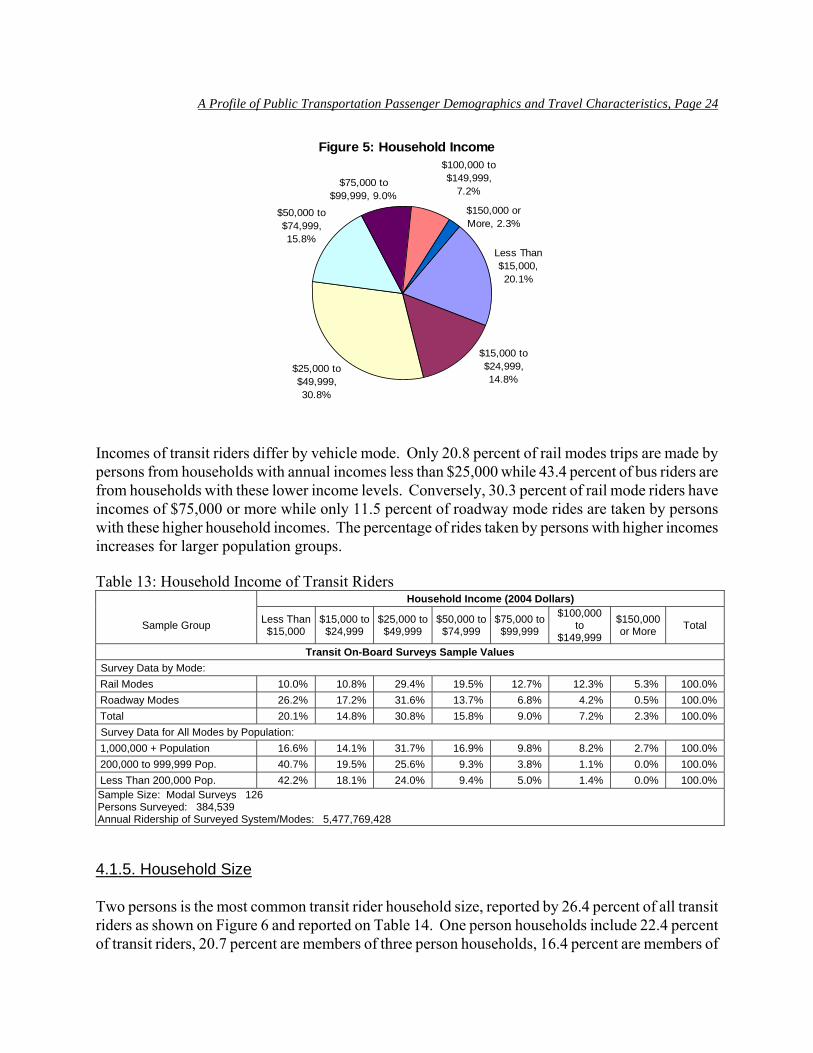
A Profile of Public Transportation Passenger Demographics and Travel Characteristics, Page 24
Figure 5: Household Income
Less Than $15,000, 20.1%
$25,000 to $49,999, 30.8%
$50,000 to $74,999, 15.8%
$75,000 to $99,999, 9.0%
$100,000 to $149,999,
7.2%
$150,000 or More, 2.3%
$15,000 to $24,999, 14.8%
Incomes of transit riders differ by vehicle mode. Only 20.8 percent of rail modes trips are made by persons from households with annual incomes less than $25,000 while 43.4 percent of bus riders are from households with these lower income levels. Conversely, 30.3 percent of rail mode riders have incomes of $75,000 or more while only 11.5 percent of roadway mode rides are taken by persons with these higher household incomes. The percentage of rides taken by persons with higher incomes increases for larger population groups. Table 13: Household Income of Transit Riders
Household Income (2004 Dollars)
Sample Group Less Than $15,000
$15,000 to $24,999
$25,000 to $49,999
$50,000 to $74,999
$75,000 to $99,999
$100,000 to
$149,999
$150,000 or More Total
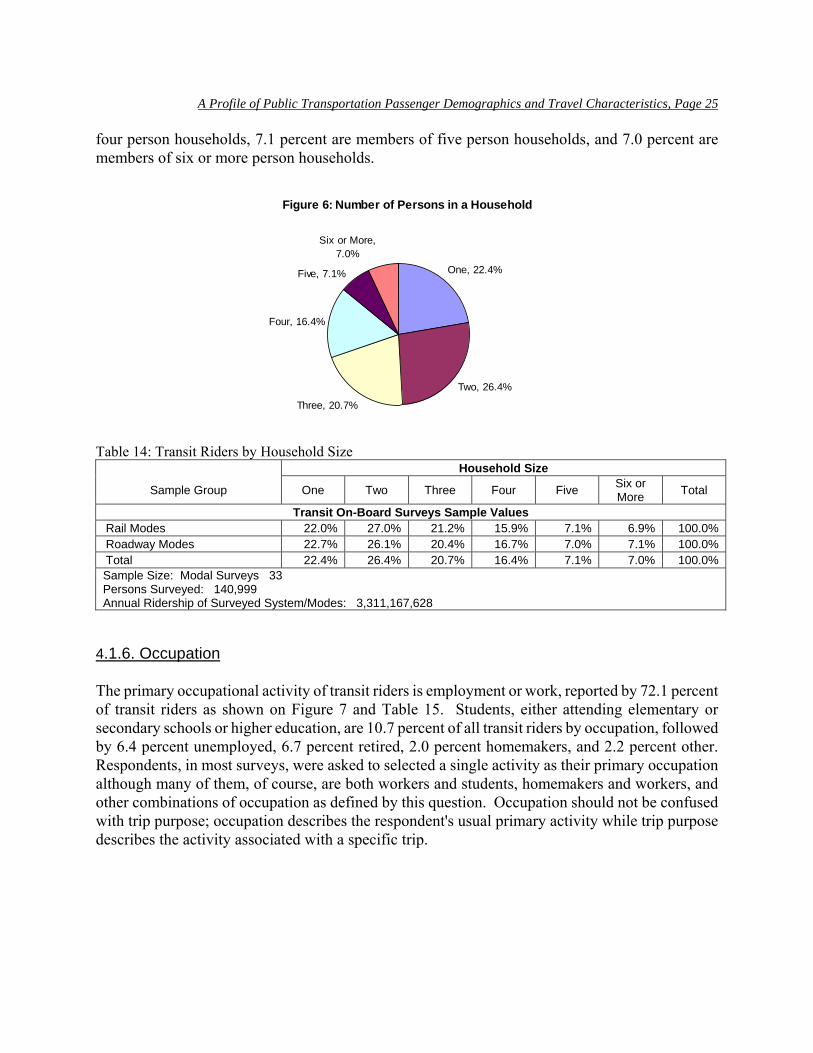
Transit On-Board Surveys Sample Values Survey Data by Mode: Rail Modes 10.0% 10.8% 29.4% 19.5% 12.7% 12.3% 5.3% 100.0% Roadway Modes 26.2% 17.2% 31.6% 13.7% 6.8% 4.2% 0.5% 100.0% Total 20.1% 14.8% 30.8% 15.8% 9.0% 7.2% 2.3% 100.0% Survey Data for All Modes by Population: 1,000,000 + Population 16.6% 14.1% 31.7% 16.9% 9.8% 8.2% 2.7% 100.0% 200,000 to 999,999 Pop. 40.7% 19.5% 25.6% 9.3% 3.8% 1.1% 0.0% 100.0% Less Than 200,000 Pop. 42.2% 18.1% 24.0% 9.4% 5.0% 1.4% 0.0% 100.0% Sample Size: Modal Surveys 126 Persons Surveyed: 384,539 Annual Ridership of Surveyed System/Modes: 5,477,769,428 4.1.5. Household Size Two persons is the most common transit rider household size, reported by 26.4 percent of all transit riders as shown on Figure 6 and reported on Table 14. One person households include 22.4 percent of transit riders, 20.7 percent are members of three person households, 16.4 percent are members of
A Profile of Public Transportation Passenger Demographics and Travel Characteristics, Page 25
four person households, 7.1 percent are members of five person households, and 7.0 percent are members of six or more person households.
Figure 6: Number of Persons in a Household
One, 22.4%
Two, 26.4%
Three, 20.7%
Four, 16.4%
Five, 7.1%
Six or More, 7.0%
Table 14: Transit Riders by Household Size
Household Size
Sample Group One Two Three Four Five Six or More Total
Transit On-Board Surveys Sample Values Rail Modes 22.0% 27.0% 21.2% 15.9% 7.1% 6.9% 100.0% Roadway Modes 22.7% 26.1% 20.4% 16.7% 7.0% 7.1% 100.0% Total 22.4% 26.4% 20.7% 16.4% 7.1% 7.0% 100.0% Sample Size: Modal Surveys 33 Persons Surveyed: 140,999 Annual Ridership of Surveyed System/Modes: 3,311,167,628
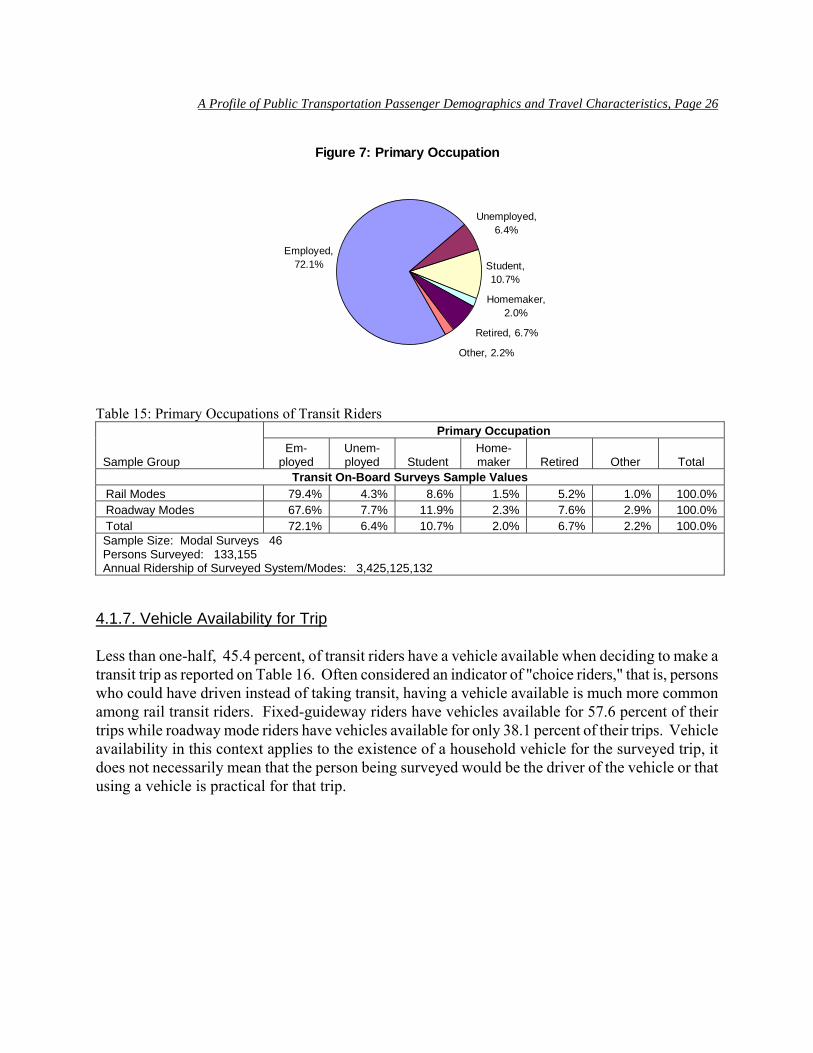
4.1.6. Occupation The primary occupational activity of transit riders is employment or work, reported by 72.1 percent of transit riders as shown on Figure 7 and Table 15. Students, either attending elementary or secondary schools or higher education, are 10.7 percent of all transit riders by occupation, followed by 6.4 percent unemployed, 6.7 percent retired, 2.0 percent homemakers, and 2.2 percent other. Respondents, in most surveys, were asked to selected a single activity as their primary occupation although many of them, of course, are both workers and students, homemakers and workers, and other combinations of occupation as defined by this question. Occupation should not be confused with trip purpose; occupation describes the respondent's usual primary activity while trip purpose describes the activity associated with a specific trip.
A Profile of Public Transportation Passenger Demographics and Travel Characteristics, Page 26
Figure 7: Primary Occupation
Employed, 72.1%
Unemployed, 6.4%
Student, 10.7%
Homemaker, 2.0%
Retired, 6.7%
Other, 2.2%
Table 15: Primary Occupations of Transit Riders Primary Occupation
Sample Group Em-
ployed Unem-ployed Student
Home-maker Retired Other Total
Transit On-Board Surveys Sample Values Rail Modes 79.4% 4.3% 8.6% 1.5% 5.2% 1.0% 100.0% Roadway Modes 67.6% 7.7% 11.9% 2.3% 7.6% 2.9% 100.0% Total 72.1% 6.4% 10.7% 2.0% 6.7% 2.2% 100.0% Sample Size: Modal Surveys 46 Persons Surveyed: 133,155 Annual Ridership of Surveyed System/Modes: 3,425,125,132
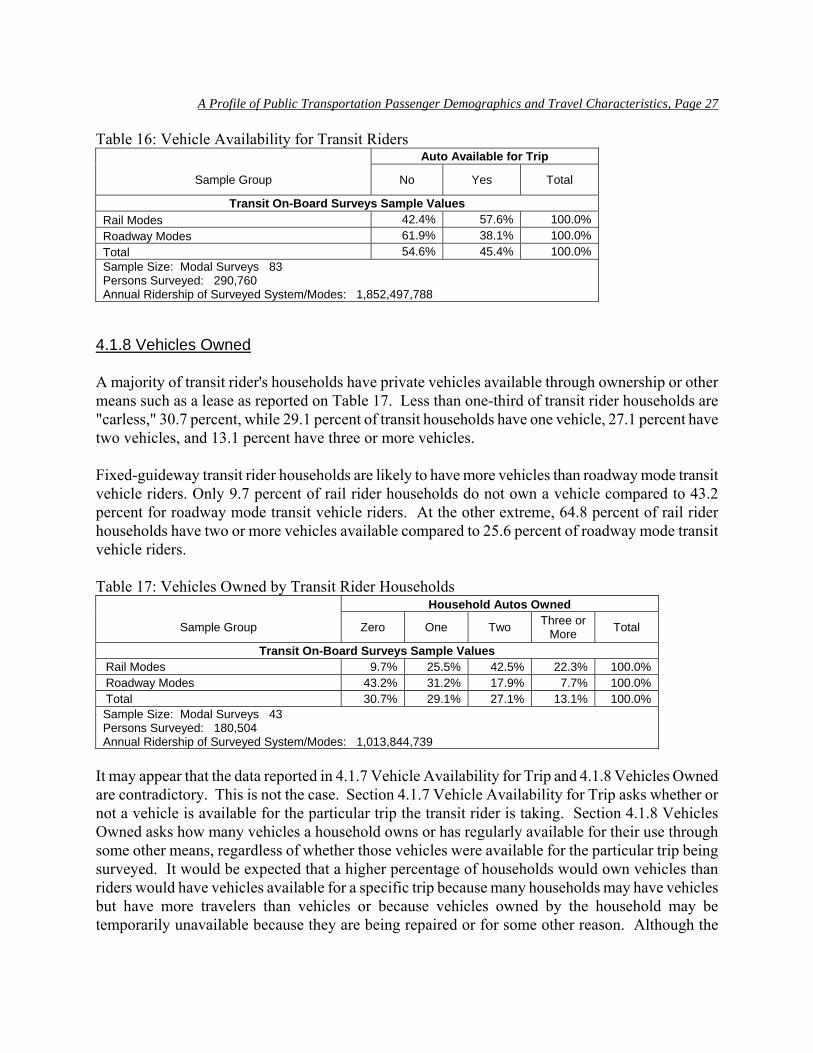
4.1.7. Vehicle Availability for Trip Less than one-half, 45.4 percent, of transit riders have a vehicle available when deciding to make a transit trip as reported on Table 16. Often considered an indicator of "choice riders," that is, persons who could have driven instead of taking transit, having a vehicle available is much more common among rail transit riders. Fixed-guideway riders have vehicles available for 57.6 percent of their trips while roadway mode riders have vehicles available for only 38.1 percent of their trips. Vehicle availability in this context applies to the existence of a household vehicle for the surveyed trip, it does not necessarily mean that the person being surveyed would be the driver of the vehicle or that using a vehicle is practical for that trip.
A Profile of Public Transportation Passenger Demographics and Travel Characteristics, Page 27
Table 16: Vehicle Availability for Transit Riders Auto Available for Trip
Sample Group No Yes Total
Transit On-Board Surveys Sample Values Rail Modes 42.4% 57.6% 100.0% Roadway Modes 61.9% 38.1% 100.0% Total 54.6% 45.4% 100.0% Sample Size: Modal Surveys 83 Persons Surveyed: 290,760 Annual Ridership of Surveyed System/Modes: 1,852,497,788
4.1.8 Vehicles Owned A majority of transit rider's households have private vehicles available through ownership or other means such as a lease as reported on Table 17. Less than one-third of transit rider households are "carless," 30.7 percent, while 29.1 percent of transit households have one vehicle, 27.1 percent have two vehicles, and 13.1 percent have three or more vehicles. Fixed-guideway transit rider households are likely to have more vehicles than roadway mode transit vehicle riders. Only 9.7 percent of rail rider households do not own a vehicle compared to 43.2 percent for roadway mode transit vehicle riders. At the other extreme, 64.8 percent of rail rider households have two or more vehicles available compared to 25.6 percent of roadway mode transit vehicle riders. Table 17: Vehicles Owned by Transit Rider Households
Household Autos Owned
Sample Group Zero One Two Three or More Total
Transit On-Board Surveys Sample Values Rail Modes 9.7% 25.5% 42.5% 22.3% 100.0% Roadway Modes 43.2% 31.2% 17.9% 7.7% 100.0% Total 30.7% 29.1% 27.1% 13.1% 100.0% Sample Size: Modal Surveys 43 Persons Surveyed: 180,504 Annual Ridership of Surveyed System/Modes: 1,013,844,739
It may appear that the data reported in 4.1.7 Vehicle Availability for Trip and 4.1.8 Vehicles Owned are contradictory. This is not the case. Section 4.1.7 Vehicle Availability for Trip asks whether or not a vehicle is available for the particular trip the transit rider is taking. Section 4.1.8 Vehicles Owned asks how many vehicles a household owns or has regularly available for their use through some other means, regardless of whether those vehicles were available for the particular trip being surveyed. It would be expected that a higher percentage of households would own vehicles than riders would have vehicles available for a specific trip because many households may have vehicles but have more travelers than vehicles or because vehicles owned by the household may be temporarily unavailable because they are being repaired or for some other reason. Although the
A Profile of Public Transportation Passenger Demographics and Travel Characteristics, Page 28
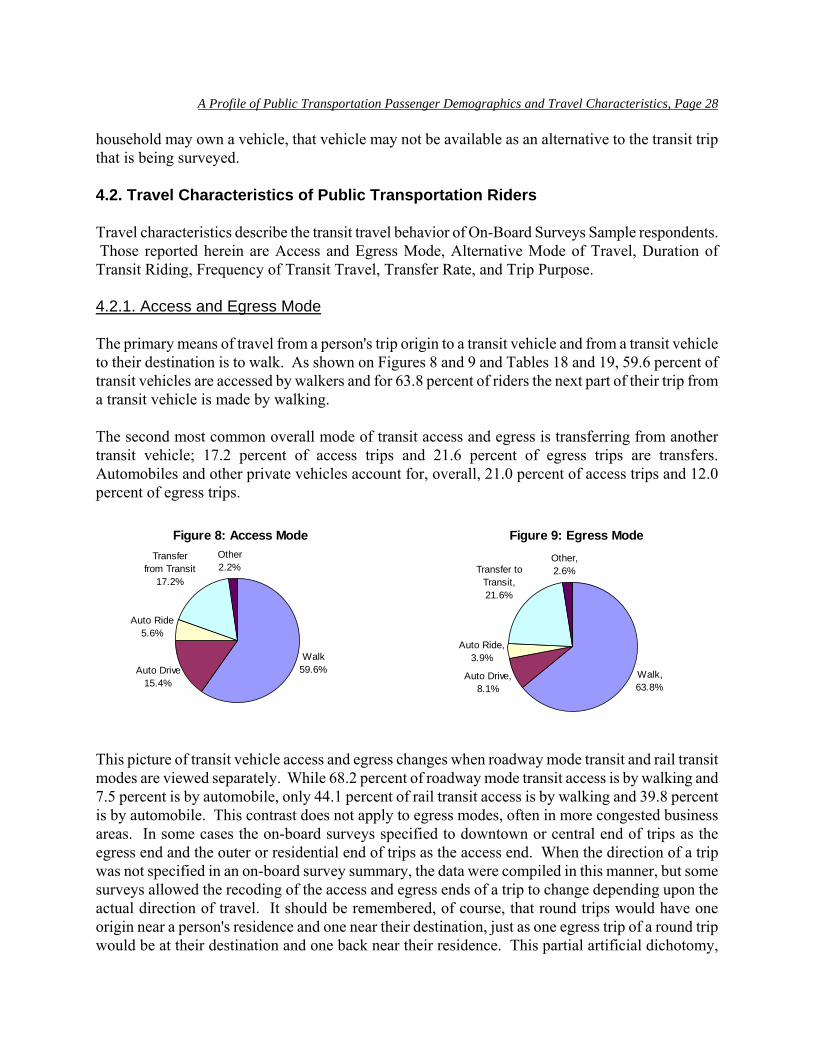
household may own a vehicle, that vehicle may not be available as an alternative to the transit trip that is being surveyed. 4.2. Travel Characteristics of Public Transportation Riders Travel characteristics describe the transit travel behavior of On-Board Surveys Sample respondents. Those reported herein are Access and Egress Mode, Alternative Mode of Travel, Duration of Transit Riding, Frequency of Transit Travel, Transfer Rate, and Trip Purpose. 4.2.1. Access and Egress Mode The primary means of travel from a person's trip origin to a transit vehicle and from a transit vehicle to their destination is to walk. As shown on Figures 8 and 9 and Tables 18 and 19, 59.6 percent of transit vehicles are accessed by walkers and for 63.8 percent of riders the next part of their trip from a transit vehicle is made by walking. The second most common overall mode of transit access and egress is transferring from another transit vehicle; 17.2 percent of access trips and 21.6 percent of egress trips are transfers. Automobiles and other private vehicles account for, overall, 21.0 percent of access trips and 12.0 percent of egress trips.
Figure 8: Access Mode
Walk59.6%Auto Drive
15.4%
Auto Ride5.6%
Transfer from Transit
17.2%
Other2.2%
Figure 9: Egress Mode
Walk, 63.8%
Auto Ride, 3.9%
Other, 2.6%Transfer to
Transit, 21.6%
Auto Drive, 8.1%
This picture of transit vehicle access and egress changes when roadway mode transit and rail transit modes are viewed separately. While 68.2 percent of roadway mode transit access is by walking and 7.5 percent is by automobile, only 44.1 percent of rail transit access is by walking and 39.8 percent is by automobile. This contrast does not apply to egress modes, often in more congested business areas. In some cases the on-board surveys specified to downtown or central end of trips as the egress end and the outer or residential end of trips as the access end. When the direction of a trip was not specified in an on-board survey summary, the data were compiled in this manner, but some surveys allowed the recoding of the access and egress ends of a trip to change depending upon the actual direction of travel. It should be remembered, of course, that round trips would have one origin near a person's residence and one near their destination, just as one egress trip of a round trip would be at their destination and one back near their residence. This partial artificial dichotomy,
A Profile of Public Transportation Passenger Demographics and Travel Characteristics, Page 29
however, helps visualize the difference between access at the residential end of trips compared to the other end of transit trips. At the destination or egress end, 56.7 percent of rail trip egress was by walking and 20.1 percent by automobile and 67.9 percent of roadway mode transit vehicle egress was by walking and 7.1 percent by automobile, more similar values than for access mode. Table 18: Access Mode to Transit of Transit Riders
Access Mode
Sample Group Walk Drive Auto Ride
Transfer from
Transit Other Total
Transit On-Board Surveys Sample Values Rail Modes 44.1% 29.6% 10.2% 14.2% 1.9% 100.0% Roadway Modes 68.2% 4.5% 3.0% 21.8% 2.5% 100.0% Total 59.6% 15.4% 5.6% 17.2% 2.2% 100.0%
Sample Size: Modal Surveys 84 Persons Surveyed: 360,073 Annual Ridership of Surveyed System/Modes: 1,675.750.099
Table 19: Egress Mode from Transit for Transit Riders
Egress Mode
Sample Group Walk Drive Auto Ride
Transfer from
Transit Other Total
Transit On-Board Surveys Sample Values Rail Modes 56.7% 15.0% 5.4% 19.8% 3.1% 100.0% Roadway Modes 67.9% 4.1% 3.0% 22.7% 2.3% 100.0% Total 63.8% 8.1% 3.9% 21.6% 2.6% 100.0%
Sample Size: Modal Surveys 65 Persons Surveyed: 310,654 Annual Ridership of Surveyed System/Modes: 1,227,428,833
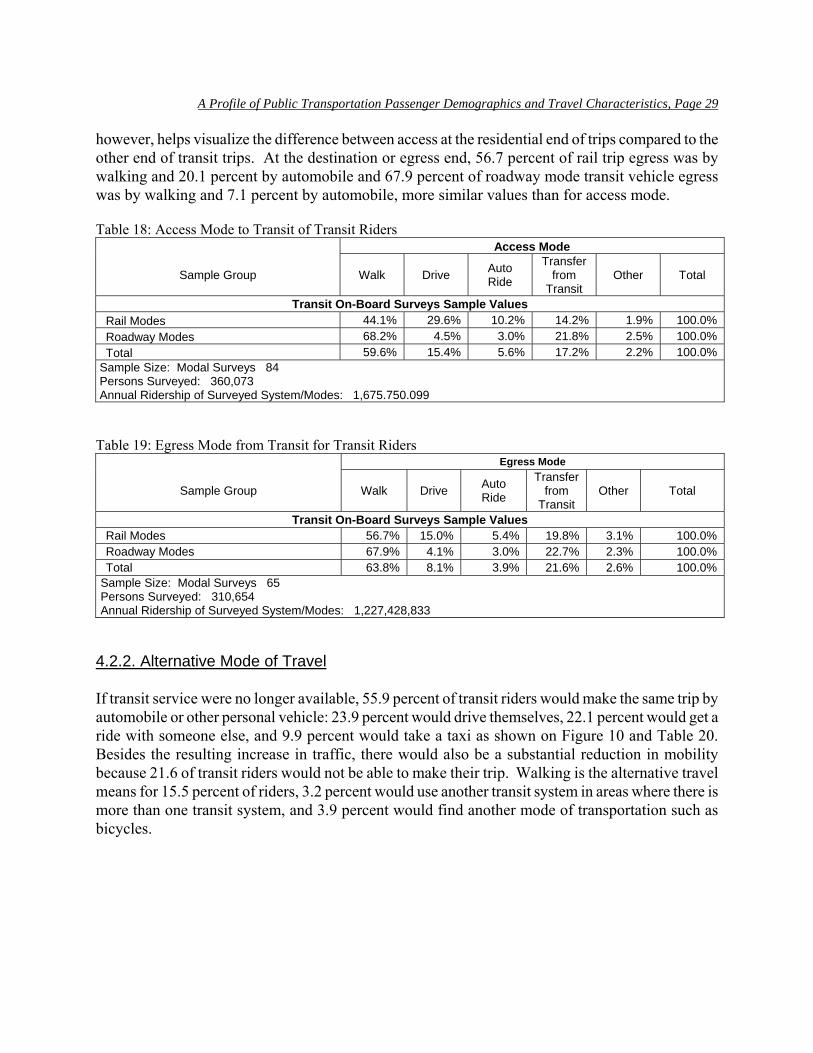
4.2.2. Alternative Mode of Travel If transit service were no longer available, 55.9 percent of transit riders would make the same trip by automobile or other personal vehicle: 23.9 percent would drive themselves, 22.1 percent would get a ride with someone else, and 9.9 percent would take a taxi as shown on Figure 10 and Table 20. Besides the resulting increase in traffic, there would also be a substantial reduction in mobility because 21.6 of transit riders would not be able to make their trip. Walking is the alternative travel means for 15.5 percent of riders, 3.2 percent would use another transit system in areas where there is more than one transit system, and 3.9 percent would find another mode of transportation such as bicycles.
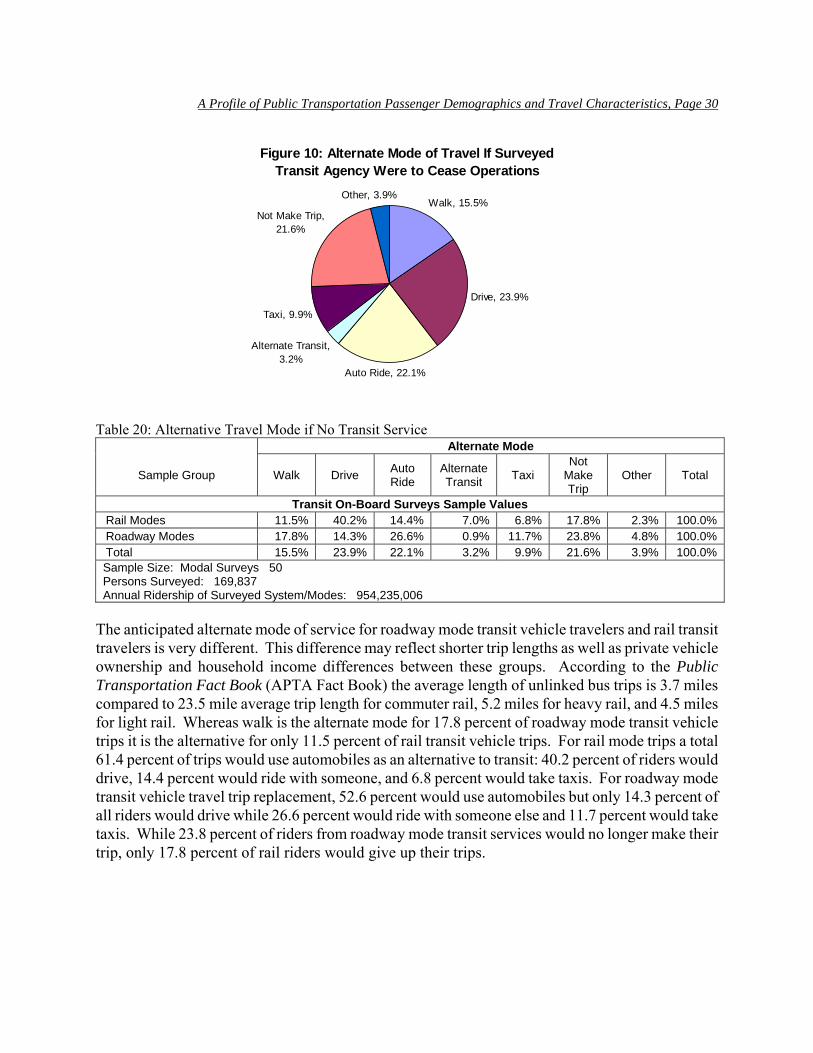
A Profile of Public Transportation Passenger Demographics and Travel Characteristics, Page 30
Figure 10: Alternate Mode of Travel If SurveyedTransit Agency Were to Cease Operations
Walk, 15.5%
Drive, 23.9%
Auto Ride, 22.1%
Alternate Transit, 3.2%
Taxi, 9.9%
Not Make Trip, 21.6%
Other, 3.9%
Table 20: Alternative Travel Mode if No Transit Service
Alternate Mode
Sample Group Walk Drive Auto Ride
Alternate Transit Taxi
Not Make Trip
Other Total
Transit On-Board Surveys Sample Values Rail Modes 11.5% 40.2% 14.4% 7.0% 6.8% 17.8% 2.3% 100.0% Roadway Modes 17.8% 14.3% 26.6% 0.9% 11.7% 23.8% 4.8% 100.0% Total 15.5% 23.9% 22.1% 3.2% 9.9% 21.6% 3.9% 100.0% Sample Size: Modal Surveys 50 Persons Surveyed: 169,837 Annual Ridership of Surveyed System/Modes: 954,235,006
The anticipated alternate mode of service for roadway mode transit vehicle travelers and rail transit travelers is very different. This difference may reflect shorter trip lengths as well as private vehicle ownership and household income differences between these groups. According to the Public Transportation Fact Book (APTA Fact Book) the average length of unlinked bus trips is 3.7 miles compared to 23.5 mile average trip length for commuter rail, 5.2 miles for heavy rail, and 4.5 miles for light rail. Whereas walk is the alternate mode for 17.8 percent of roadway mode transit vehicle trips it is the alternative for only 11.5 percent of rail transit vehicle trips. For rail mode trips a total 61.4 percent of trips would use automobiles as an alternative to transit: 40.2 percent of riders would drive, 14.4 percent would ride with someone, and 6.8 percent would take taxis. For roadway mode transit vehicle travel trip replacement, 52.6 percent would use automobiles but only 14.3 percent of all riders would drive while 26.6 percent would ride with someone else and 11.7 percent would take taxis. While 23.8 percent of riders from roadway mode transit services would no longer make their trip, only 17.8 percent of rail riders would give up their trips.
A Profile of Public Transportation Passenger Demographics and Travel Characteristics, Page 31
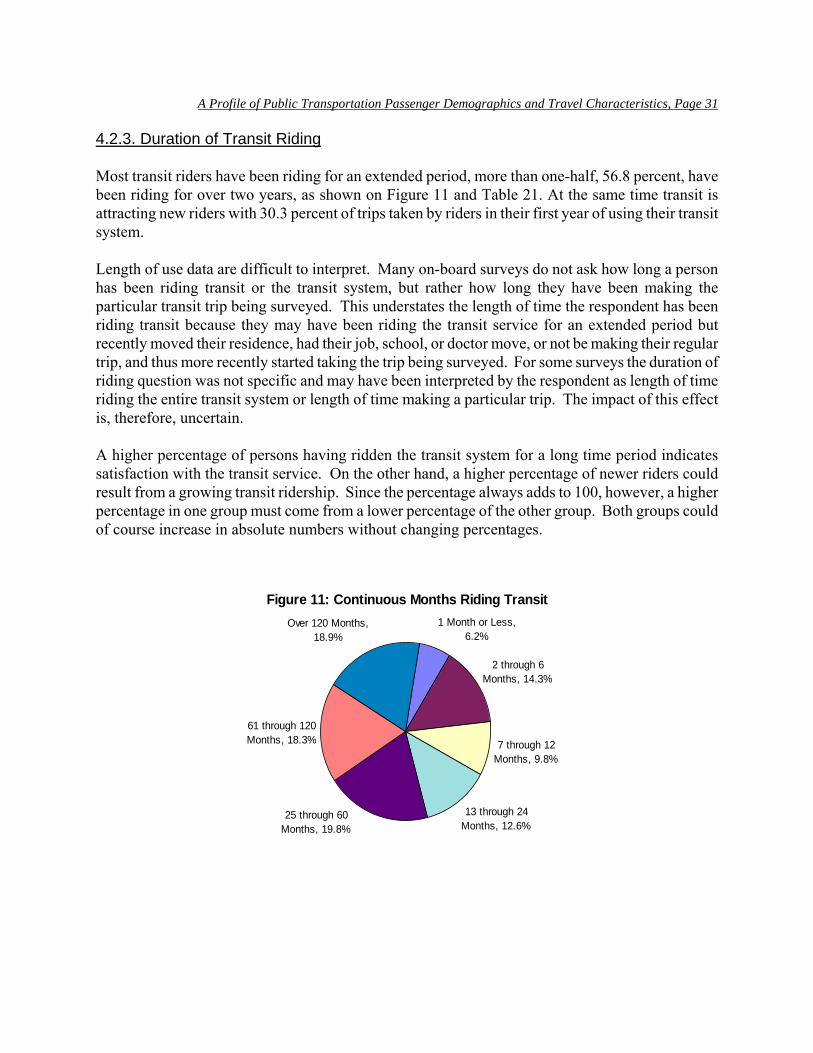
4.2.3. Duration of Transit Riding Most transit riders have been riding for an extended period, more than one-half, 56.8 percent, have been riding for over two years, as shown on Figure 11 and Table 21. At the same time transit is attracting new riders with 30.3 percent of trips taken by riders in their first year of using their transit system. Length of use data are difficult to interpret. Many on-board surveys do not ask how long a person has been riding transit or the transit system, but rather how long they have been making the particular transit trip being surveyed. This understates the length of time the respondent has been riding transit because they may have been riding the transit service for an extended period but recently moved their residence, had their job, school, or doctor move, or not be making their regular trip, and thus more recently started taking the trip being surveyed. For some surveys the duration of riding question was not specific and may have been interpreted by the respondent as length of time riding the entire transit system or length of time making a particular trip. The impact of this effect is, therefore, uncertain. A higher percentage of persons having ridden the transit system for a long time period indicates satisfaction with the transit service. On the other hand, a higher percentage of newer riders could result from a growing transit ridership. Since the percentage always adds to 100, however, a higher percentage in one group must come from a lower percentage of the other group. Both groups could of course increase in absolute numbers without changing percentages.
Figure 11: Continuous Months Riding Transit1 Month or Less,
6.2%
2 through 6 Months, 14.3%
7 through 12 Months, 9.8%
13 through 24 Months, 12.6%
61 through 120 Months, 18.3%
Over 120 Months, 18.9%
25 through 60 Months, 19.8%
A Profile of Public Transportation Passenger Demographics and Travel Characteristics, Page 32
Table 21: Length of Time Riding Transit Service Provided by Survey Agency Time Riding Transit
Sample Group 1 Month or Less
2 through
6 Months
7 through
12 Months
13 through
24 Months
25 through
60 Months
61 through
120 Months
Over 120 Months Total
Transit On-Board Surveys Sample Values Rail Modes 4.8% 12.9% 7.3% 12.3% 19.8% 21.6% 21.3% 100.0% Roadway Modes 6.5% 16.1% 10.8% 13.1% 19.6% 16.1% 17.7% 100.0% Total 5.9% 14.9% 9.5% 12.8% 19.7% 18.1% 19.0% 100.0% Sample Size: Modal Surveys 66 Persons Surveyed: 200,299 Annual Ridership of Surveyed System/Modes: 1,051,530,560
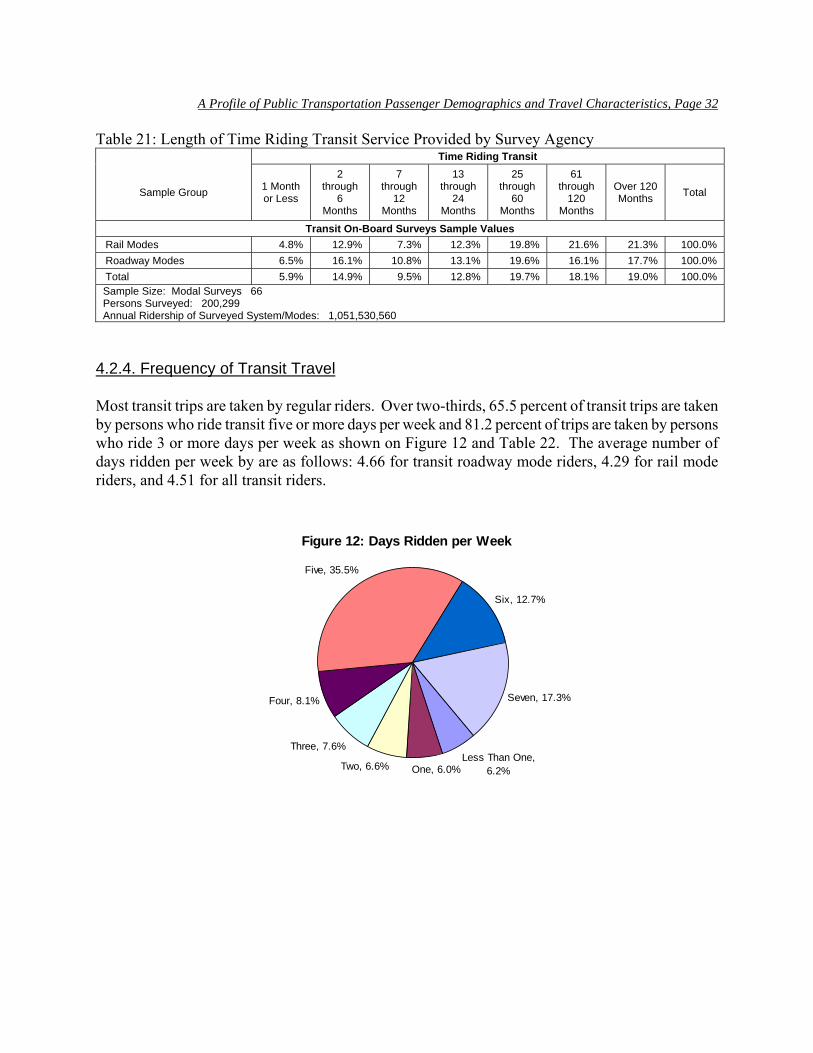
4.2.4. Frequency of Transit Travel Most transit trips are taken by regular riders. Over two-thirds, 65.5 percent of transit trips are taken by persons who ride transit five or more days per week and 81.2 percent of trips are taken by persons who ride 3 or more days per week as shown on Figure 12 and Table 22. The average number of days ridden per week by are as follows: 4.66 for transit roadway mode riders, 4.29 for rail mode riders, and 4.51 for all transit riders.
Figure 12: Days Ridden per Week
Less Than One, 6.2%One, 6.0%Two, 6.6%
Three, 7.6%
Four, 8.1%
Five, 35.5%
Six, 12.7%
Seven, 17.3%
A Profile of Public Transportation Passenger Demographics and Travel Characteristics, Page 33
Table 22: Number of Days per Week Riding Transit Service Days Ridden per Week by a Person Who Rides
Sample Group Less Than One
One Two Three Four Five Six Seven "Daily" Five or More
Total
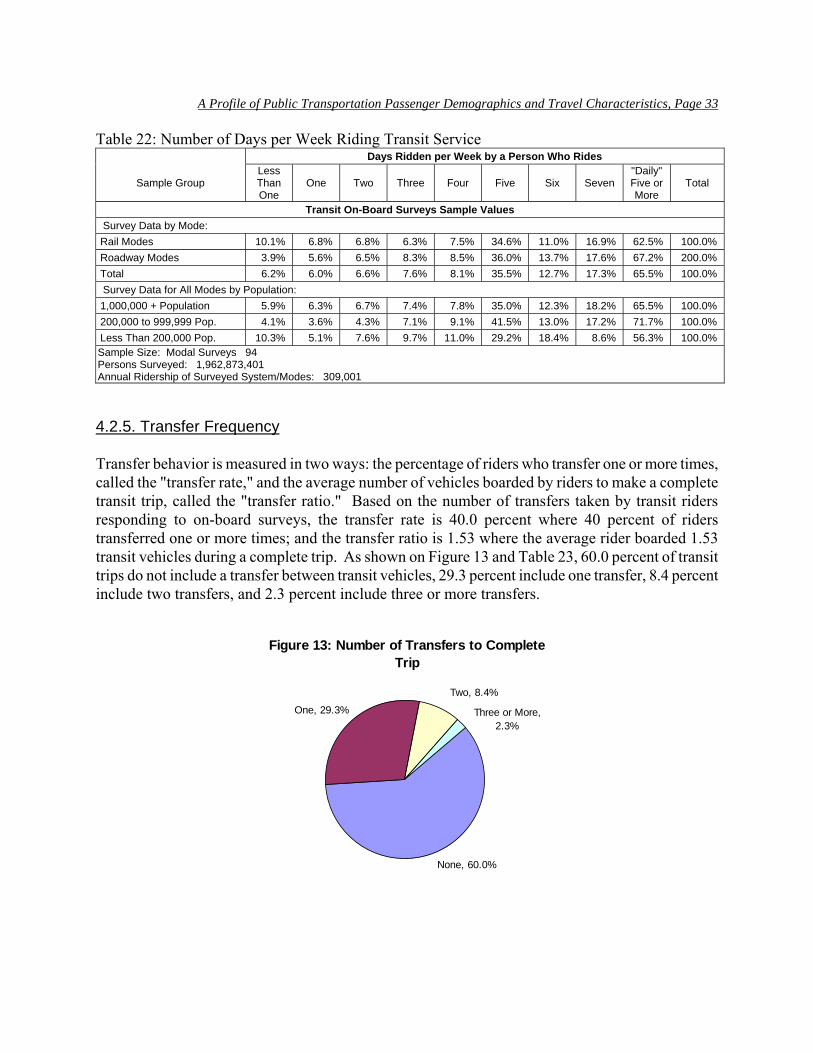
Transit On-Board Surveys Sample Values Survey Data by Mode: Rail Modes 10.1% 6.8% 6.8% 6.3% 7.5% 34.6% 11.0% 16.9% 62.5% 100.0% Roadway Modes 3.9% 5.6% 6.5% 8.3% 8.5% 36.0% 13.7% 17.6% 67.2% 200.0% Total 6.2% 6.0% 6.6% 7.6% 8.1% 35.5% 12.7% 17.3% 65.5% 100.0% Survey Data for All Modes by Population: 1,000,000 + Population 5.9% 6.3% 6.7% 7.4% 7.8% 35.0% 12.3% 18.2% 65.5% 100.0% 200,000 to 999,999 Pop. 4.1% 3.6% 4.3% 7.1% 9.1% 41.5% 13.0% 17.2% 71.7% 100.0% Less Than 200,000 Pop. 10.3% 5.1% 7.6% 9.7% 11.0% 29.2% 18.4% 8.6% 56.3% 100.0% Sample Size: Modal Surveys 94 Persons Surveyed: 1,962,873,401 Annual Ridership of Surveyed System/Modes: 309,001 4.2.5. Transfer Frequency Transfer behavior is measured in two ways: the percentage of riders who transfer one or more times, called the "transfer rate," and the average number of vehicles boarded by riders to make a complete transit trip, called the "transfer ratio." Based on the number of transfers taken by transit riders responding to on-board surveys, the transfer rate is 40.0 percent where 40 percent of riders transferred one or more times; and the transfer ratio is 1.53 where the average rider boarded 1.53 transit vehicles during a complete trip. As shown on Figure 13 and Table 23, 60.0 percent of transit trips do not include a transfer between transit vehicles, 29.3 percent include one transfer, 8.4 percent include two transfers, and 2.3 percent include three or more transfers.
Figure 13: Number of Transfers to Complete Trip
None, 60.0%
One, 29.3%
Two, 8.4%
Three or More, 2.3%
A Profile of Public Transportation Passenger Demographics and Travel Characteristics, Page 34
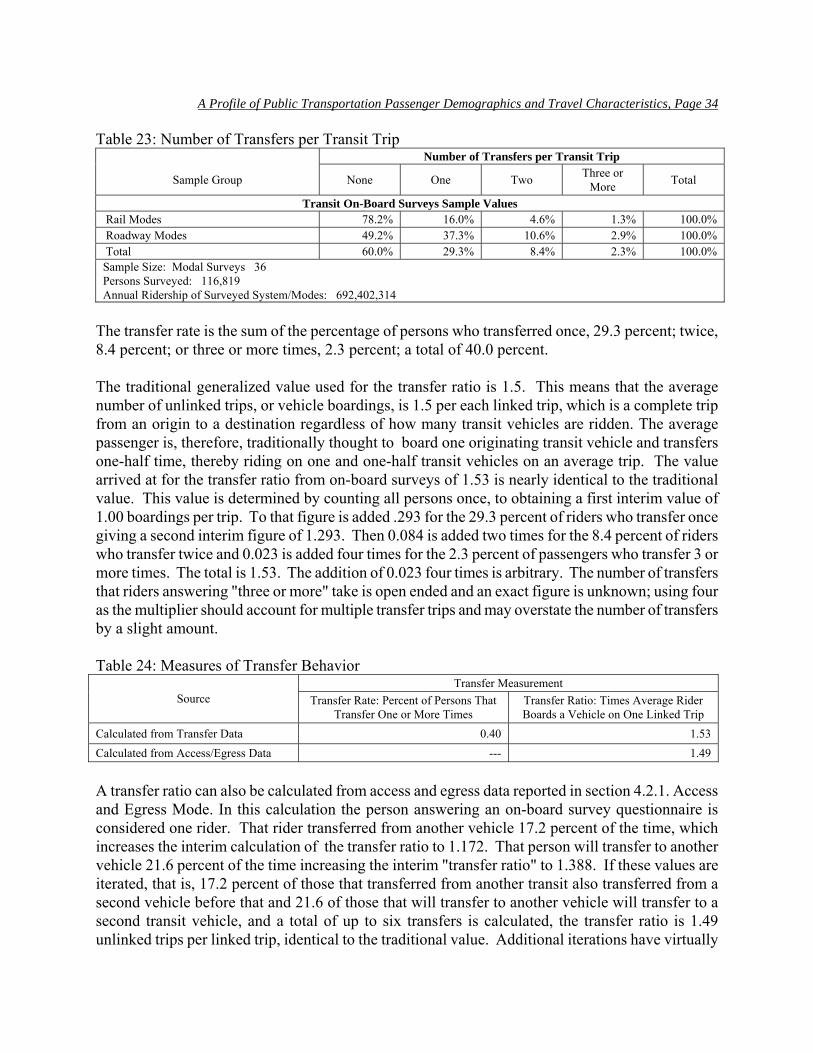
Table 23: Number of Transfers per Transit Trip Number of Transfers per Transit Trip
Sample Group None One Two Three or More Total
Transit On-Board Surveys Sample Values Rail Modes 78.2% 16.0% 4.6% 1.3% 100.0% Roadway Modes 49.2% 37.3% 10.6% 2.9% 100.0% Total 60.0% 29.3% 8.4% 2.3% 100.0% Sample Size: Modal Surveys 36 Persons Surveyed: 116,819 Annual Ridership of Surveyed System/Modes: 692,402,314
The transfer rate is the sum of the percentage of persons who transferred once, 29.3 percent; twice, 8.4 percent; or three or more times, 2.3 percent; a total of 40.0 percent. The traditional generalized value used for the transfer ratio is 1.5. This means that the average number of unlinked trips, or vehicle boardings, is 1.5 per each linked trip, which is a complete trip from an origin to a destination regardless of how many transit vehicles are ridden. The average passenger is, therefore, traditionally thought to board one originating transit vehicle and transfers one-half time, thereby riding on one and one-half transit vehicles on an average trip. The value arrived at for the transfer ratio from on-board surveys of 1.53 is nearly identical to the traditional value. This value is determined by counting all persons once, to obtaining a first interim value of 1.00 boardings per trip. To that figure is added .293 for the 29.3 percent of riders who transfer once giving a second interim figure of 1.293. Then 0.084 is added two times for the 8.4 percent of riders who transfer twice and 0.023 is added four times for the 2.3 percent of passengers who transfer 3 or more times. The total is 1.53. The addition of 0.023 four times is arbitrary. The number of transfers that riders answering "three or more" take is open ended and an exact figure is unknown; using four as the multiplier should account for multiple transfer trips and may overstate the number of transfers by a slight amount. Table 24: Measures of Transfer Behavior
Transfer Measurement Source Transfer Rate: Percent of Persons That
Transfer One or More Times Transfer Ratio: Times Average Rider Boards a Vehicle on One Linked Trip
Calculated from Transfer Data 0.40 1.53 Calculated from Access/Egress Data --- 1.49
A transfer ratio can also be calculated from access and egress data reported in section 4.2.1. Access and Egress Mode. In this calculation the person answering an on-board survey questionnaire is considered one rider. That rider transferred from another vehicle 17.2 percent of the time, which increases the interim calculation of the transfer ratio to 1.172. That person will transfer to another vehicle 21.6 percent of the time increasing the interim "transfer ratio" to 1.388. If these values are iterated, that is, 17.2 percent of those that transferred from another transit also transferred from a second vehicle before that and 21.6 of those that will transfer to another vehicle will transfer to a second transit vehicle, and a total of up to six transfers is calculated, the transfer ratio is 1.49 unlinked trips per linked trip, identical to the traditional value. Additional iterations have virtually
A Profile of Public Transportation Passenger Demographics and Travel Characteristics, Page 35
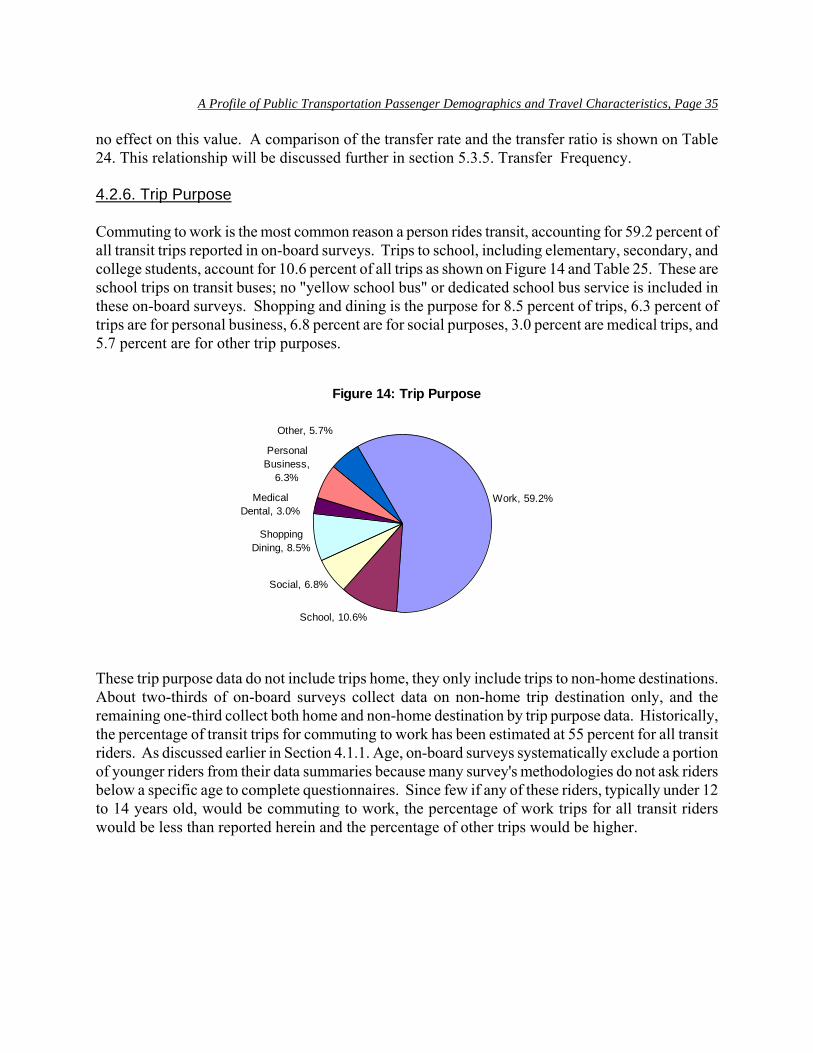
no effect on this value. A comparison of the transfer rate and the transfer ratio is shown on Table 24. This relationship will be discussed further in section 5.3.5. Transfer Frequency. 4.2.6. Trip Purpose Commuting to work is the most common reason a person rides transit, accounting for 59.2 percent of all transit trips reported in on-board surveys. Trips to school, including elementary, secondary, and college students, account for 10.6 percent of all trips as shown on Figure 14 and Table 25. These are school trips on transit buses; no "yellow school bus" or dedicated school bus service is included in these on-board surveys. Shopping and dining is the purpose for 8.5 percent of trips, 6.3 percent of trips are for personal business, 6.8 percent are for social purposes, 3.0 percent are medical trips, and 5.7 percent are for other trip purposes.
Figure 14: Trip Purpose
Work, 59.2%
School, 10.6%
Social, 6.8%
Shopping Dining, 8.5%
Medical Dental, 3.0%
Personal Business,
6.3%
Other, 5.7%
These trip purpose data do not include trips home, they only include trips to non-home destinations. About two-thirds of on-board surveys collect data on non-home trip destination only, and the remaining one-third collect both home and non-home destination by trip purpose data. Historically, the percentage of transit trips for commuting to work has been estimated at 55 percent for all transit riders. As discussed earlier in Section 4.1.1. Age, on-board surveys systematically exclude a portion of younger riders from their data summaries because many survey's methodologies do not ask riders below a specific age to complete questionnaires. Since few if any of these riders, typically under 12 to 14 years old, would be commuting to work, the percentage of work trips for all transit riders would be less than reported herein and the percentage of other trips would be higher.
A Profile of Public Transportation Passenger Demographics and Travel Characteristics, Page 36
Table 25: Trip Purpose Trip Purpose, Excludes "Home" Trips
Sample Group Work School Social Shopping
Dining Medical Dental
Personal Business Other Total
Transit On-Board Surveys Sample Values Survey Data by Mode: Rail Modes 71.7% 6.3% 7.4% 5.1% 0.7% 6.5% 2.3% 100.0% Roadway Modes 51.8% 13.1% 6.4% 10.5% 4.4% 6.1% 7.7% 100.0% Total 59.2% 10.6% 6.8% 8.5% 3.0% 6.3% 5.7% 100.0% Survey Data for All Modes by Population: 1,000,000 + Population 62.5% 9.8% 5.1% 7.6% 2.3% 8.0% 4.8% 100.0% 200,000 to 999,999 Pop. 48.3% 17.7% 5.0% 9.6% 3.7% 4.3% 11.3% 100.0% Less Than 200,000 Pop. 34.2% 11.5% 7.0% 17.3% 8.6% 10.5% 11.0% 100.0% Sample Size: Modal Surveys 121 Persons Surveyed: 460,759 Annual Ridership of Surveyed System/Modes; 2,202,393,184
5. COMPARISON TO PREVIOUS STUDIES 5.1. Previous Studies Describing Transit Rider Characteristics Descriptions of America's transit riders on a national basis are infrequent and usually of a limited nature. The American Public Transportation Association (APTA) first reported on transit users characteristics in 1992 in Americans In Transit: A Profile of Public Transit Passengers (APTA Profile 1992). The Center for Urban Transportation Research compiled data from the 1995 Nationwide Personal Transportation Survey (NPTS 1995) and the 2001 National Household Travel Survey (NHTS 2001). Two summaries of coordinated on-board transit vehicle passenger surveys were compiled by McCollom Management Consulting for APTA and the Federal Transit Administration (FTA) using data from 58 surveys conducted from 1996 through 2003 (TPMS I and II and TPMS III). The U.S. Census Bureau also published characteristics of commuters for work trips by mode, including separate data for transit, from the 2004 American Community Survey (ACS 2004). The following sections compare the results of this survey to those earlier surveys. The characteristics that are compared are limited to those that were reported in earlier surveys and to those that could be summarized in the same or similar groupings of data that summarize each characteristic. 5.2. Demographic Characteristics of Public Transportation Riders 5.2.1. Age Transit riders are much older than the general population as shown on Table 26. Two sets of age data are shown for On-Board Surveys Sample transit riders, with a low age adjustment and without adjustment. This adjustment is to account for those On-Board Surveys Sample summaries that do not report data for the number of trips taken by riders below a certain age and is explained in detail
A Profile of Public Transportation Passenger Demographics and Travel Characteristics, Page 37
in Section 4.1.1. Age. Even with the adjustment, younger riders are believed to be systematically undercounted by on-board survey methodologies. Nevertheless, these data show a significant difference in the age distribution of transit riders to the general population with transit riders including much lower proportions of younger and older persons. Table 26: On-Board Surveys Sample Age Distribution Data Compared to 2000 United States Census, Census and APTA Standard Age Categories
Age
Sample Group 14 and Under
15 to 19
20 to 24
25 to 34
35 to 44
45 to 54
55 to 64
65 and Over Total
Transit On-Board Surveys Sample Values with Low Age Adjustment 4.0% 8.5% 11.5% 21.7% 20.2% 17.5% 9.8% 6.7% 100.0%
Transit On-Board Surveys Sample Values As Reported, No Adjustment 1.7% 7.0% 12.0% 22.6% 21.1% 18.2% 10.2% 7.1% 100.0%
2000 United States Census, Total U.S. Population 21.4% 7.2% 6.7% 14.2% 16.0% 13.4% 8.6% 12.4% 100.0%
2000 United States Census, Inside Metropolitan Areas Only 21.6% 7.1% 6.8% 14.7% 16.3% 13.3% 8.4% 11.8% 100.0%
2000 United States Census, Inside Metropolitan Statistical Area Central Cities Only
21.1% 7.3% 8.6% 16.3% 15.2% 12.2% 7.6% 11.6% 100.0%
Because transit is more prevalent in central cities and other higher population density areas, the On-Board Surveys Sample data are also compared to age distributions for Metropolitan Areas and the central cities of Metropolitan Areas. The Metropolitan Area and central city data have somewhat larger percentage of persons in the mid range of ages but still vary significantly from the age breakdown of transit rider in the youngest and oldest age groups. The National Household Travel Survey (NHTS 2001) includes age data grouped into different sets of years than Census data is normally grouped. Figure 15 and Table 27 compare NHTS data to regrouped Census data for 2001 (Statistical Abstract 2002) and regrouped APTA On-Board Surveys Sample data. The NHTS data are similar to Census data but show a disproportionately high percentage of younger persons riding transit. While 29.7 percent of all Americans in 2001 were 20 years old or younger, the NHTS reports 31.2 percent of all transit riders as 20 years of age or younger. This result appears to be too high. Of the 130 system/mode on-board survey reports, 92 reported data for younger riders. The estimated unweighted average percentage of riders 15 years or younger in those 92 surveys is 4.0 percent, less than the one-fifth of the 20.2 percent reported by the NHTS. Only one of those 92 surveys had a percentage as high as the NHTS value. The estimated unweighted percentage of riders 20 years or younger for the 92 on-board surveys was 13.4 percent, less than one-half the NHTS 31.2 percent. Only four of the 92 system/mode on-board surveys showed values as high as 31.2 percent. The Transit Performance Monitoring System: Phases I and II (TPMS I and II) reported 19 system/modes where persons 12 years of age and younger were counted separately from the distribution of questionnaires. Although this is a different grouping of ages from the NHTS, it is still indicative that the NHTS overestimates the number of younger transit riders. Riders 12 years of age
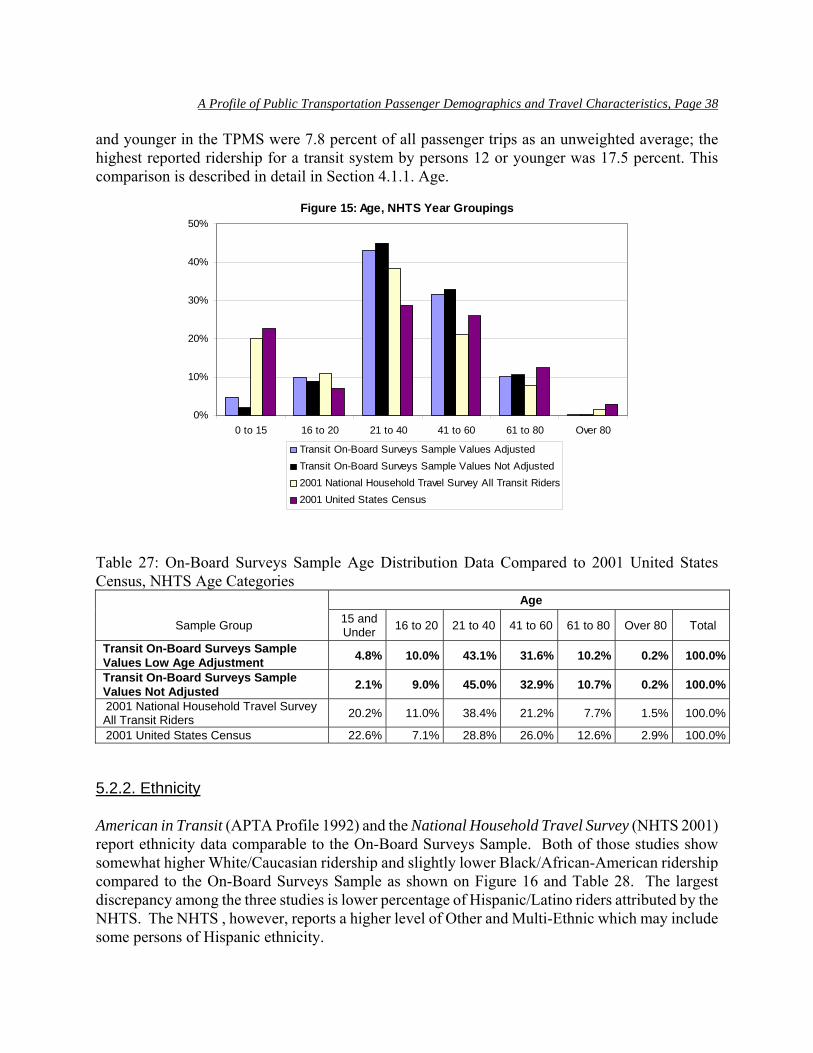
A Profile of Public Transportation Passenger Demographics and Travel Characteristics, Page 38
and younger in the TPMS were 7.8 percent of all passenger trips as an unweighted average; the highest reported ridership for a transit system by persons 12 or younger was 17.5 percent. This comparison is described in detail in Section 4.1.1. Age.
Figure 15: Age, NHTS Year Groupings
0%
10%
20%
30%
40%
50%
0 to 15 16 to 20 21 to 40 41 to 60 61 to 80 Over 80
Transit On-Board Surveys Sample Values AdjustedTransit On-Board Surveys Sample Values Not Adjusted2001 National Household Travel Survey All Transit Riders2001 United States Census
Table 27: On-Board Surveys Sample Age Distribution Data Compared to 2001 United States Census, NHTS Age Categories
Age
Sample Group 15 and Under 16 to 20 21 to 40 41 to 60 61 to 80 Over 80 Total
Transit On-Board Surveys Sample Values Low Age Adjustment 4.8% 10.0% 43.1% 31.6% 10.2% 0.2% 100.0%
Transit On-Board Surveys Sample Values Not Adjusted 2.1% 9.0% 45.0% 32.9% 10.7% 0.2% 100.0%
2001 National Household Travel Survey All Transit Riders 20.2% 11.0% 38.4% 21.2% 7.7% 1.5% 100.0%
2001 United States Census 22.6% 7.1% 28.8% 26.0% 12.6% 2.9% 100.0% 5.2.2. Ethnicity American in Transit (APTA Profile 1992) and the National Household Travel Survey (NHTS 2001) report ethnicity data comparable to the On-Board Surveys Sample. Both of those studies show somewhat higher White/Caucasian ridership and slightly lower Black/African-American ridership compared to the On-Board Surveys Sample as shown on Figure 16 and Table 28. The largest discrepancy among the three studies is lower percentage of Hispanic/Latino riders attributed by the NHTS. The NHTS , however, reports a higher level of Other and Multi-Ethnic which may include some persons of Hispanic ethnicity.
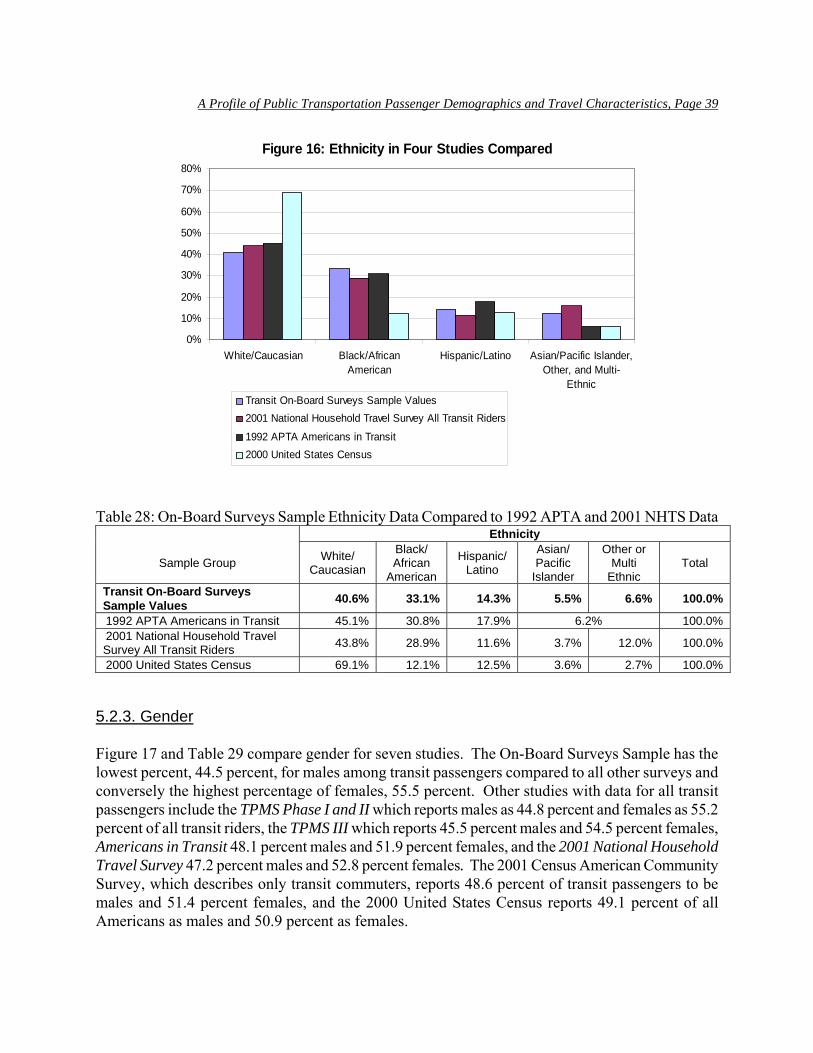
A Profile of Public Transportation Passenger Demographics and Travel Characteristics, Page 39
Figure 16: Ethnicity in Four Studies Compared
0%
10%
20%
30%
40%
50%
60%
70%
80%
White/Caucasian Black/AfricanAmerican
Hispanic/Latino Asian/Pacific Islander,Other, and Multi-
EthnicTransit On-Board Surveys Sample Values2001 National Household Travel Survey All Transit Riders
1992 APTA Americans in Transit2000 United States Census
Table 28: On-Board Surveys Sample Ethnicity Data Compared to 1992 APTA and 2001 NHTS Data
Ethnicity
Sample Group White/ Caucasian
Black/ African
American
Hispanic/ Latino
Asian/ Pacific
Islander
Other or Multi
Ethnic Total
Transit On-Board Surveys Sample Values 40.6% 33.1% 14.3% 5.5% 6.6% 100.0%
1992 APTA Americans in Transit 45.1% 30.8% 17.9% 6.2% 100.0% 2001 National Household Travel Survey All Transit Riders 43.8% 28.9% 11.6% 3.7% 12.0% 100.0%
2000 United States Census 69.1% 12.1% 12.5% 3.6% 2.7% 100.0% 5.2.3. Gender Figure 17 and Table 29 compare gender for seven studies. The On-Board Surveys Sample has the lowest percent, 44.5 percent, for males among transit passengers compared to all other surveys and conversely the highest percentage of females, 55.5 percent. Other studies with data for all transit passengers include the TPMS Phase I and II which reports males as 44.8 percent and females as 55.2 percent of all transit riders, the TPMS III which reports 45.5 percent males and 54.5 percent females, Americans in Transit 48.1 percent males and 51.9 percent females, and the 2001 National Household Travel Survey 47.2 percent males and 52.8 percent females. The 2001 Census American Community Survey, which describes only transit commuters, reports 48.6 percent of transit passengers to be males and 51.4 percent females, and the 2000 United States Census reports 49.1 percent of all Americans as males and 50.9 percent as females.
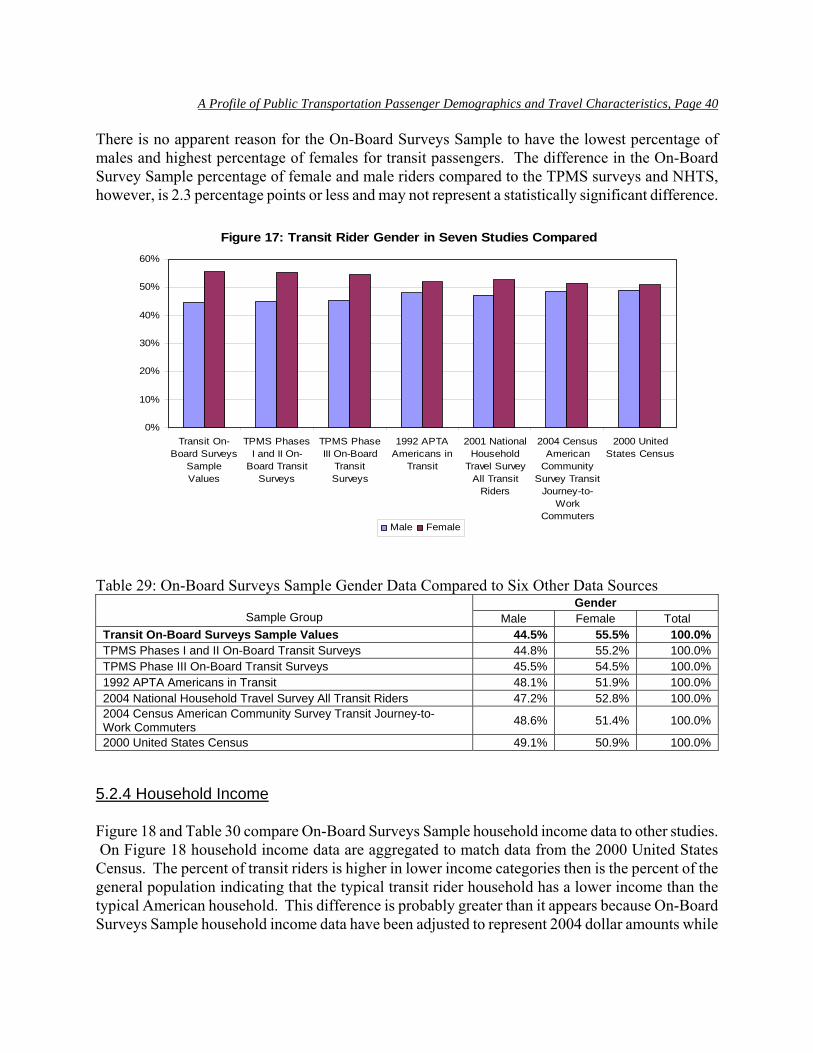
A Profile of Public Transportation Passenger Demographics and Travel Characteristics, Page 40
There is no apparent reason for the On-Board Surveys Sample to have the lowest percentage of males and highest percentage of females for transit passengers. The difference in the On-Board Survey Sample percentage of female and male riders compared to the TPMS surveys and NHTS, however, is 2.3 percentage points or less and may not represent a statistically significant difference.
Figure 17: Transit Rider Gender in Seven Studies Compared
0%
10%
20%
30%
40%
50%
60%
Transit On-Board Surveys
SampleValues
TPMS PhasesI and II On-
Board TransitSurveys
TPMS PhaseIII On-Board
TransitSurveys
1992 APTAAmericans in
Transit
2001 NationalHousehold
Travel SurveyAll Transit
Riders
2004 CensusAmerican
CommunitySurvey Transit
Journey-to-Work
Commuters
2000 UnitedStates Census
Male Female
Table 29: On-Board Surveys Sample Gender Data Compared to Six Other Data Sources
Gender Sample Group Male Female Total
Transit On-Board Surveys Sample Values 44.5% 55.5% 100.0% TPMS Phases I and II On-Board Transit Surveys 44.8% 55.2% 100.0% TPMS Phase III On-Board Transit Surveys 45.5% 54.5% 100.0% 1992 APTA Americans in Transit 48.1% 51.9% 100.0% 2004 National Household Travel Survey All Transit Riders 47.2% 52.8% 100.0% 2004 Census American Community Survey Transit Journey-to- Work Commuters 48.6% 51.4% 100.0%
2000 United States Census 49.1% 50.9% 100.0% 5.2.4 Household Income Figure 18 and Table 30 compare On-Board Surveys Sample household income data to other studies. On Figure 18 household income data are aggregated to match data from the 2000 United States Census. The percent of transit riders is higher in lower income categories then is the percent of the general population indicating that the typical transit rider household has a lower income than the typical American household. This difference is probably greater than it appears because On-Board Surveys Sample household income data have been adjusted to represent 2004 dollar amounts while
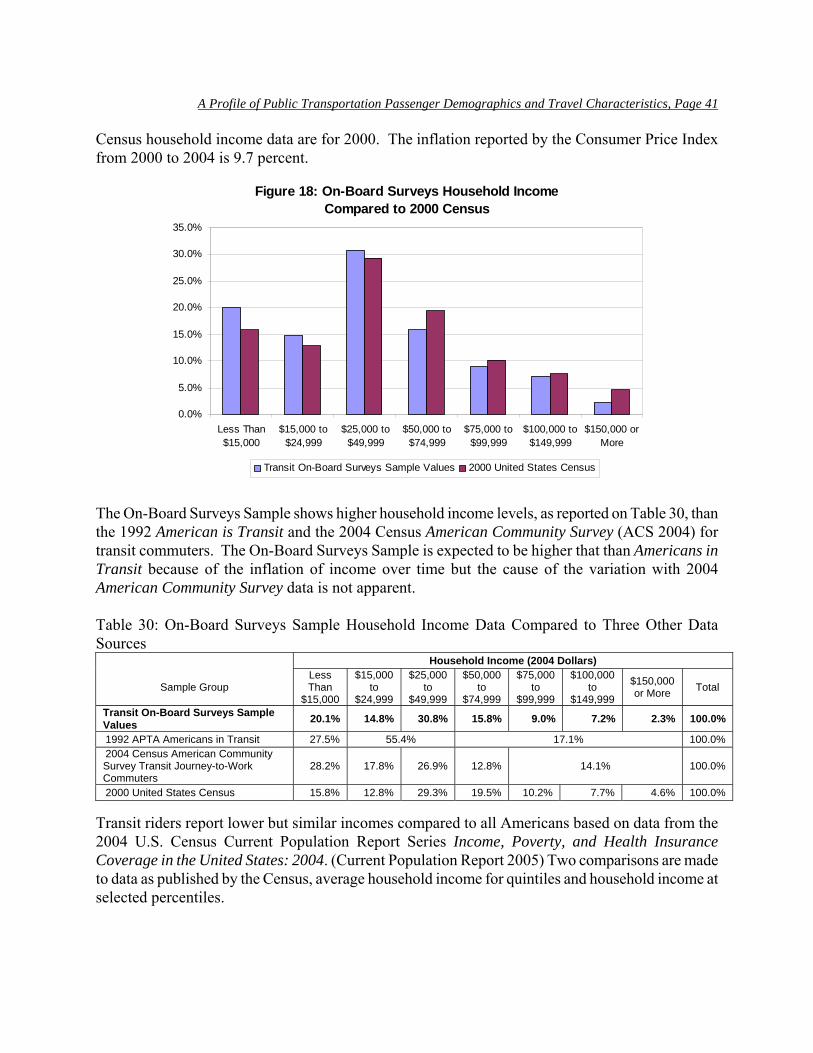
A Profile of Public Transportation Passenger Demographics and Travel Characteristics, Page 41
Census household income data are for 2000. The inflation reported by the Consumer Price Index from 2000 to 2004 is 9.7 percent.
Figure 18: On-Board Surveys Household IncomeCompared to 2000 Census
0.0%
5.0%
10.0%
15.0%
20.0%
25.0%
30.0%
35.0%
Less Than$15,000
$15,000 to$24,999
$25,000 to$49,999
$50,000 to$74,999
$75,000 to$99,999
$100,000 to$149,999
$150,000 orMore
Transit On-Board Surveys Sample Values 2000 United States Census
The On-Board Surveys Sample shows higher household income levels, as reported on Table 30, than the 1992 American is Transit and the 2004 Census American Community Survey (ACS 2004) for transit commuters. The On-Board Surveys Sample is expected to be higher that than Americans in Transit because of the inflation of income over time but the cause of the variation with 2004 American Community Survey data is not apparent. Table 30: On-Board Surveys Sample Household Income Data Compared to Three Other Data Sources
Household Income (2004 Dollars)
Sample Group Less Than
$15,000
$15,000 to
$24,999
$25,000 to
$49,999
$50,000 to
$74,999
$75,000 to
$99,999
$100,000 to
$149,999
$150,000 or More Total
Transit On-Board Surveys Sample Values 20.1% 14.8% 30.8% 15.8% 9.0% 7.2% 2.3% 100.0%
1992 APTA Americans in Transit 27.5% 55.4% 17.1% 100.0% 2004 Census American Community Survey Transit Journey-to-Work Commuters
28.2% 17.8% 26.9% 12.8% 14.1% 100.0%
2000 United States Census 15.8% 12.8% 29.3% 19.5% 10.2% 7.7% 4.6% 100.0% Transit riders report lower but similar incomes compared to all Americans based on data from the 2004 U.S. Census Current Population Report Series Income, Poverty, and Health Insurance Coverage in the United States: 2004. (Current Population Report 2005) Two comparisons are made to data as published by the Census, average household income for quintiles and household income at selected percentiles.
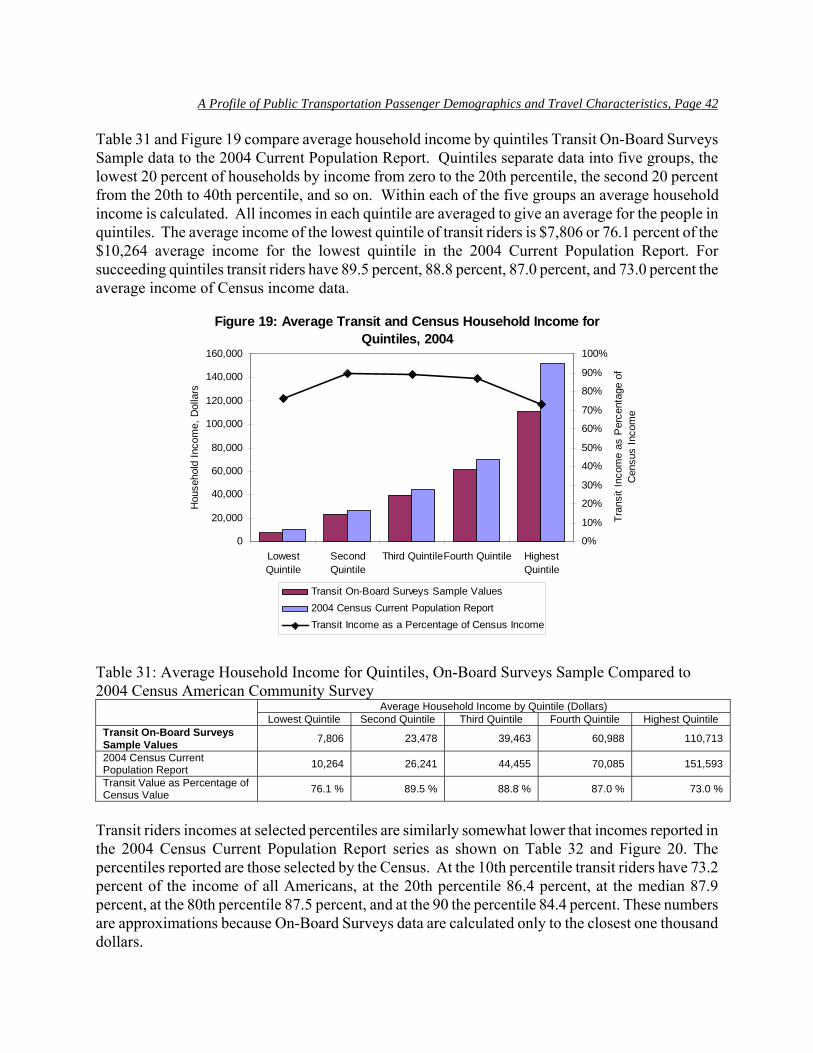
A Profile of Public Transportation Passenger Demographics and Travel Characteristics, Page 42
Table 31 and Figure 19 compare average household income by quintiles Transit On-Board Surveys Sample data to the 2004 Current Population Report. Quintiles separate data into five groups, the lowest 20 percent of households by income from zero to the 20th percentile, the second 20 percent from the 20th to 40th percentile, and so on. Within each of the five groups an average household income is calculated. All incomes in each quintile are averaged to give an average for the people in quintiles. The average income of the lowest quintile of transit riders is $7,806 or 76.1 percent of the $10,264 average income for the lowest quintile in the 2004 Current Population Report. For succeeding quintiles transit riders have 89.5 percent, 88.8 percent, 87.0 percent, and 73.0 percent the average income of Census income data.
Figure 19: Average Transit and Census Household Income for Quintiles, 2004
0
20,000
40,000
60,000
80,000
100,000
120,000
140,000
160,000
LowestQuintile
SecondQuintile
Third QuintileFourth Quintile HighestQuintile
Hou
seho
ld In
com
e, D
olla
rs
0%
10%
20%
30%
40%
50%
60%
70%
80%
90%
100%
Tran
sit I
ncom
e as
Per
cent
age
ofC
ensu
s In
com
e
Transit On-Board Surveys Sample Values2004 Census Current Population ReportTransit Income as a Percentage of Census Income
Table 31: Average Household Income for Quintiles, On-Board Surveys Sample Compared to 2004 Census American Community Survey
Average Household Income by Quintile (Dollars) Lowest Quintile Second Quintile Third Quintile Fourth Quintile Highest Quintile Transit On-Board Surveys Sample Values 7,806 23,478 39,463 60,988 110,713
2004 Census Current Population Report 10,264 26,241 44,455 70,085 151,593
Transit Value as Percentage of Census Value 76.1 % 89.5 % 88.8 % 87.0 % 73.0 %
Transit riders incomes at selected percentiles are similarly somewhat lower that incomes reported in the 2004 Census Current Population Report series as shown on Table 32 and Figure 20. The percentiles reported are those selected by the Census. At the 10th percentile transit riders have 73.2 percent of the income of all Americans, at the 20th percentile 86.4 percent, at the median 87.9 percent, at the 80th percentile 87.5 percent, and at the 90 the percentile 84.4 percent. These numbers are approximations because On-Board Surveys data are calculated only to the closest one thousand dollars.
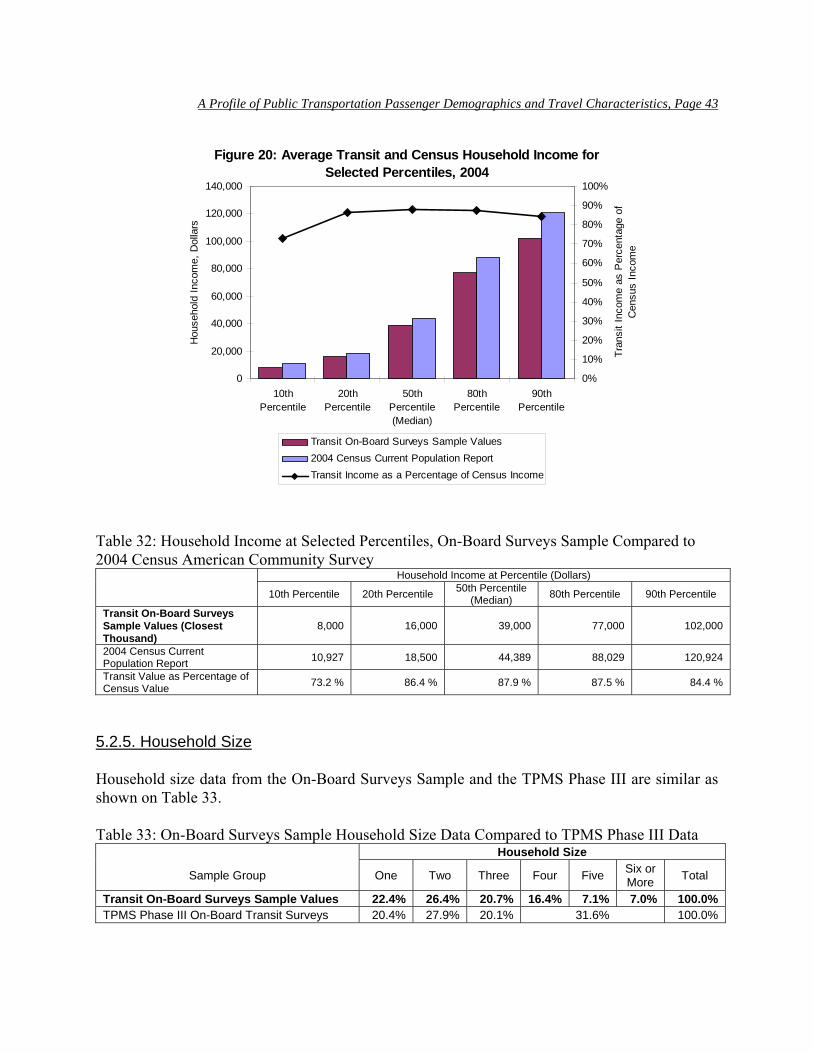
A Profile of Public Transportation Passenger Demographics and Travel Characteristics, Page 43
Figure 20: Average Transit and Census Household Income for Selected Percentiles, 2004
0
20,000
40,000
60,000
80,000
100,000
120,000
140,000
10thPercentile
20thPercentile
50thPercentile(Median)
80thPercentile
90thPercentile
Hou
seho
ld In
com
e, D
olla
rs
0%
10%
20%
30%
40%
50%
60%
70%
80%
90%
100%
Tran
sit I
ncom
e as
Per
cent
age
ofC
ensu
s In
com
e
Transit On-Board Surveys Sample Values2004 Census Current Population ReportTransit Income as a Percentage of Census Income
Table 32: Household Income at Selected Percentiles, On-Board Surveys Sample Compared to 2004 Census American Community Survey
Household Income at Percentile (Dollars) 10th Percentile 20th Percentile 50th Percentile
(Median) 80th Percentile 90th Percentile
Transit On-Board Surveys Sample Values (Closest Thousand)
8,000 16,000 39,000 77,000 102,000
2004 Census Current Population Report 10,927 18,500 44,389 88,029 120,924
Transit Value as Percentage of Census Value 73.2 % 86.4 % 87.9 % 87.5 % 84.4 %
5.2.5. Household Size Household size data from the On-Board Surveys Sample and the TPMS Phase III are similar as shown on Table 33. Table 33: On-Board Surveys Sample Household Size Data Compared to TPMS Phase III Data
Household Size
Sample Group One Two Three Four Five Six or More Total
Transit On-Board Surveys Sample Values 22.4% 26.4% 20.7% 16.4% 7.1% 7.0% 100.0% TPMS Phase III On-Board Transit Surveys 20.4% 27.9% 20.1% 31.6% 100.0%
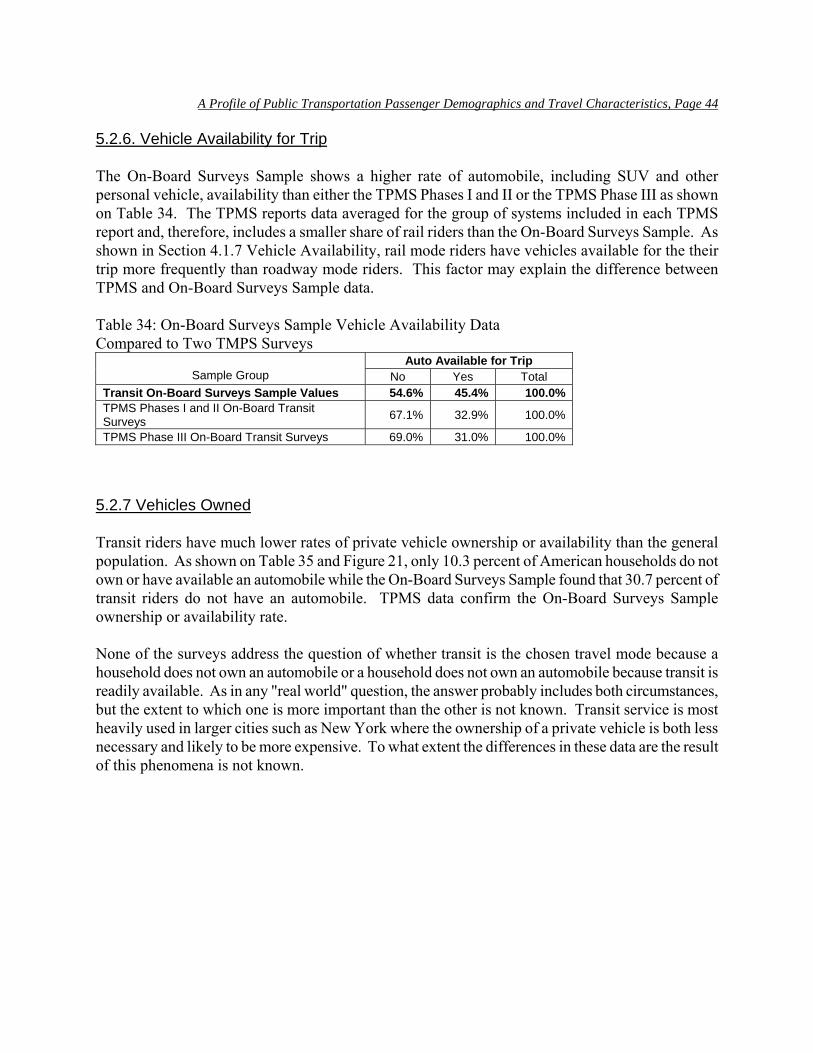
A Profile of Public Transportation Passenger Demographics and Travel Characteristics, Page 44
5.2.6. Vehicle Availability for Trip The On-Board Surveys Sample shows a higher rate of automobile, including SUV and other personal vehicle, availability than either the TPMS Phases I and II or the TPMS Phase III as shown on Table 34. The TPMS reports data averaged for the group of systems included in each TPMS report and, therefore, includes a smaller share of rail riders than the On-Board Surveys Sample. As shown in Section 4.1.7 Vehicle Availability, rail mode riders have vehicles available for the their trip more frequently than roadway mode riders. This factor may explain the difference between TPMS and On-Board Surveys Sample data. Table 34: On-Board Surveys Sample Vehicle Availability Data Compared to Two TMPS Surveys
Auto Available for Trip Sample Group No Yes Total
Transit On-Board Surveys Sample Values 54.6% 45.4% 100.0% TPMS Phases I and II On-Board Transit Surveys 67.1% 32.9% 100.0%
TPMS Phase III On-Board Transit Surveys 69.0% 31.0% 100.0% 5.2.7 Vehicles Owned Transit riders have much lower rates of private vehicle ownership or availability than the general population. As shown on Table 35 and Figure 21, only 10.3 percent of American households do not own or have available an automobile while the On-Board Surveys Sample found that 30.7 percent of transit riders do not have an automobile. TPMS data confirm the On-Board Surveys Sample ownership or availability rate. None of the surveys address the question of whether transit is the chosen travel mode because a household does not own an automobile or a household does not own an automobile because transit is readily available. As in any "real world" question, the answer probably includes both circumstances, but the extent to which one is more important than the other is not known. Transit service is most heavily used in larger cities such as New York where the ownership of a private vehicle is both less necessary and likely to be more expensive. To what extent the differences in these data are the result of this phenomena is not known.
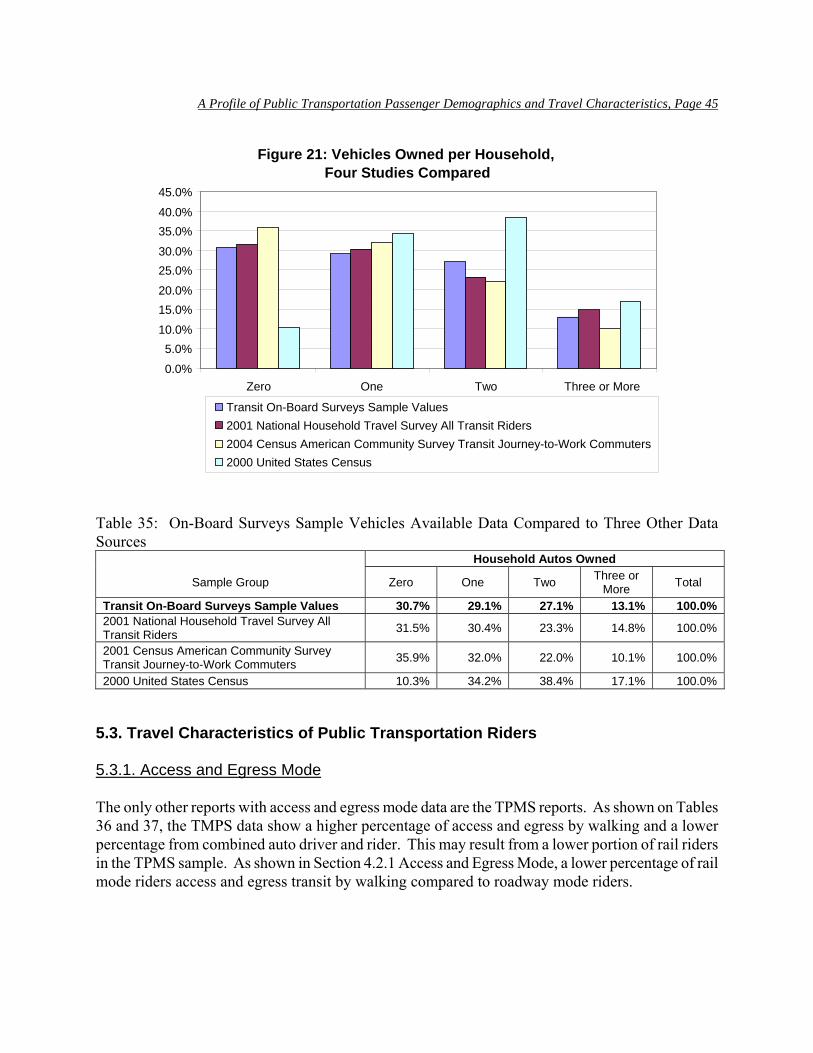
A Profile of Public Transportation Passenger Demographics and Travel Characteristics, Page 45
Table 35: On-Board Surveys Sample Vehicles Available Data Compared to Three Other Data Sources
Household Autos Owned
Sample Group Zero One Two Three or More Total
Transit On-Board Surveys Sample Values 30.7% 29.1% 27.1% 13.1% 100.0% 2001 National Household Travel Survey All Transit Riders 31.5% 30.4% 23.3% 14.8% 100.0%
2001 Census American Community Survey Transit Journey-to-Work Commuters 35.9% 32.0% 22.0% 10.1% 100.0%
2000 United States Census 10.3% 34.2% 38.4% 17.1% 100.0% 5.3. Travel Characteristics of Public Transportation Riders 5.3.1. Access and Egress Mode The only other reports with access and egress mode data are the TPMS reports. As shown on Tables 36 and 37, the TMPS data show a higher percentage of access and egress by walking and a lower percentage from combined auto driver and rider. This may result from a lower portion of rail riders in the TPMS sample. As shown in Section 4.2.1 Access and Egress Mode, a lower percentage of rail mode riders access and egress transit by walking compared to roadway mode riders.
Figure 21: Vehicles Owned per Household,Four Studies Compared
0.0% 5.0%
10.0% 15.0% 20.0% 25.0% 30.0% 35.0% 40.0% 45.0%
Zero One Two Three or More Transit On-Board Surveys Sample Values2001 National Household Travel Survey All Transit Riders2004 Census American Community Survey Transit Journey-to-Work Commuters 2000 United States Census
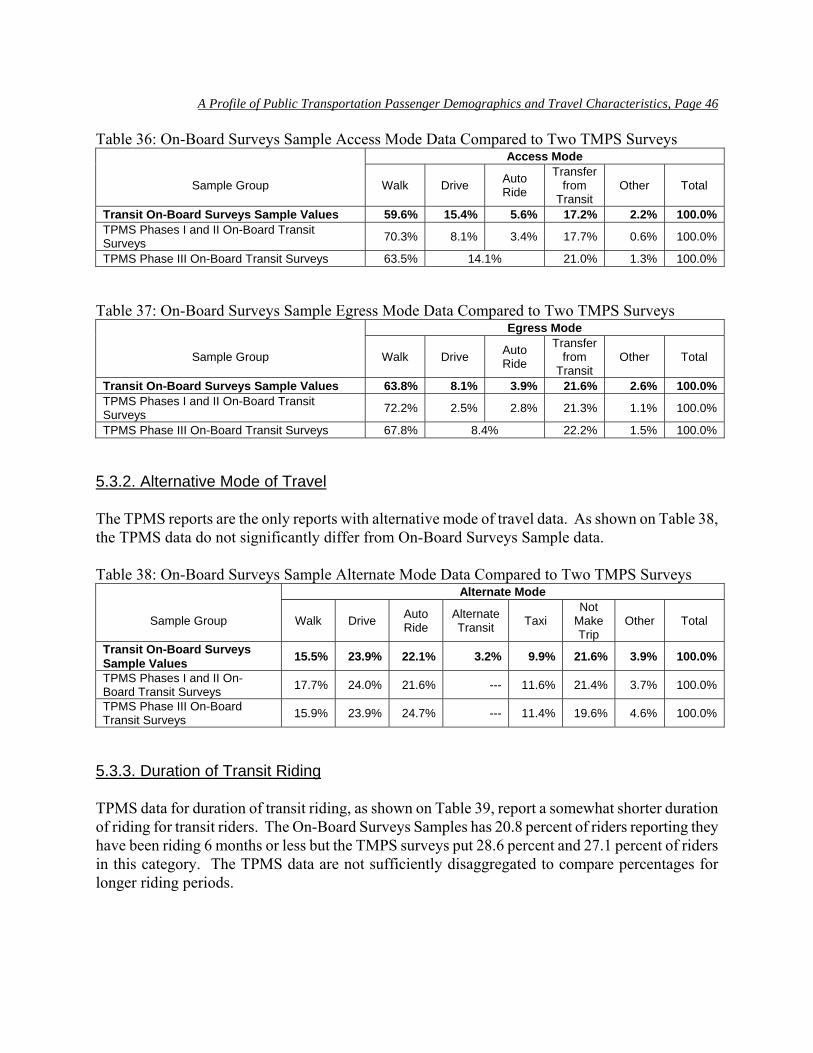
A Profile of Public Transportation Passenger Demographics and Travel Characteristics, Page 46
Table 36: On-Board Surveys Sample Access Mode Data Compared to Two TMPS Surveys Access Mode
Sample Group Walk Drive Auto Ride
Transfer from
Transit Other Total
Transit On-Board Surveys Sample Values 59.6% 15.4% 5.6% 17.2% 2.2% 100.0% TPMS Phases I and II On-Board Transit Surveys 70.3% 8.1% 3.4% 17.7% 0.6% 100.0%
TPMS Phase III On-Board Transit Surveys 63.5% 14.1% 21.0% 1.3% 100.0% Table 37: On-Board Surveys Sample Egress Mode Data Compared to Two TMPS Surveys
Egress Mode
Sample Group Walk Drive Auto Ride
Transfer from
Transit Other Total
Transit On-Board Surveys Sample Values 63.8% 8.1% 3.9% 21.6% 2.6% 100.0% TPMS Phases I and II On-Board Transit Surveys 72.2% 2.5% 2.8% 21.3% 1.1% 100.0%
TPMS Phase III On-Board Transit Surveys 67.8% 8.4% 22.2% 1.5% 100.0% 5.3.2. Alternative Mode of Travel The TPMS reports are the only reports with alternative mode of travel data. As shown on Table 38, the TPMS data do not significantly differ from On-Board Surveys Sample data. Table 38: On-Board Surveys Sample Alternate Mode Data Compared to Two TMPS Surveys
Alternate Mode
Sample Group Walk Drive Auto Ride
Alternate Transit Taxi
Not Make Trip
Other Total
Transit On-Board Surveys Sample Values 15.5% 23.9% 22.1% 3.2% 9.9% 21.6% 3.9% 100.0%
TPMS Phases I and II On-Board Transit Surveys 17.7% 24.0% 21.6% --- 11.6% 21.4% 3.7% 100.0%
TPMS Phase III On-Board Transit Surveys 15.9% 23.9% 24.7% --- 11.4% 19.6% 4.6% 100.0%
5.3.3. Duration of Transit Riding TPMS data for duration of transit riding, as shown on Table 39, report a somewhat shorter duration of riding for transit riders. The On-Board Surveys Samples has 20.8 percent of riders reporting they have been riding 6 months or less but the TMPS surveys put 28.6 percent and 27.1 percent of riders in this category. The TPMS data are not sufficiently disaggregated to compare percentages for longer riding periods.
A Profile of Public Transportation Passenger Demographics and Travel Characteristics, Page 47
Table 39: On-Board Surveys Sample Months Riding Transit Data Compared to Two TMPS Surveys Months Riding Transit System
Sample Group 1 Month or Less
2 through
6 Months
7 through
12 Months
13 through
24 Months
25 through
60 Months
61 through
120 Months
Over 120
Months Total
Transit On-Board Surveys Sample Values 5.9% 14.9% 9.5% 12.8% 19.7% 18.1% 19.0% 100.0%
TPMS Phases I and II On-Board Transit Surveys 28.6% 9.5% 15.0% 47.0% 100.0%
TPMS Phase III On-Board Transit Surveys 27.1% 11.3% 61.6% 100.0%
5.3.4. Frequency of Transit Travel TPMS data, as shown on Table 40, show an even larger percentage of transit trips taken by regular riders and "daily" riders who ride at least 5 days per week, than is reported for the On-Board Surveys Sample. The TPMS Phases I and II report 70.2 percent of riders as "daily" riders and the TPMS Phase III reports 69.3 percent of riders as "daily" riders compared 65.5 percent of "daily" riders in the On-Board Surveys Sample. Table 40: On-Board Surveys Sample Day per Week Riding Transit Data Compared to Two TMPS Surveys
Days Ridden per Week by a Person Who Rides Transit
Sample Group Less Than One
One Two Three Four Five Six Seven "Daily," Five or More
Total
Transit On-Board Surveys Sample Values 6.2% 6.0% 6.6% 7.6% 8.1% 35.5% 12.7% 17.3% 65.5% 100.0%
TPMS Phases I and II On-Board Transit Surveys 7.0% 4.3% 5.5% 6.3% 6.7% 40.9% 29.3% 70.2% 100.0%
TPMS Phase III On-Board Transit Surveys 6.4% 8.5% 15.8% 40.3% 29.0% 69.3% 100.0%
5.3.5. Transfer Frequency The On-Board Surveys Sample and the 2001 NHTS report very different transfer ratios as shown on Table 41 and Figure 22. The On-Board Surveys Sample reports the average number of transfers in a linked trip to be 0.53, that is, the average trip requires the boarding of 1.53 vehicles. As described in Section 4.2.5. Transfer Frequency, estimating the transfer ratio from access and egress mode data results in the boarding of 1.49 transit vehicles per complete trip. The NHTS has a lower value of 0.20 transfers per trip or a transfer ratio of 1.20 vehicles boarded per complete trip. The NHTS reports 2001 linked transit trips as 6,409 million and unlinked trips as 7,673 million. A linked trip is a complete trip by a transit rider from an origin to a final destination, counted as one trip no matter how many transfers the traveler makes and how many transit vehicles the traveler rides on. A unlinked trip is a traveler's trip on one transit vehicle; each time the traveler boards a new vehicle another unlinked trip is counted. Unlinked trips are the standard for transit industry
A Profile of Public Transportation Passenger Demographics and Travel Characteristics, Page 48
passenger counts and are the required count when reporting data to the Federal Transit Administration's National Transit Database.
Figure 22: Comparison of Transfer Frequency, On-Board Surveys and NHTS
Transit On-Board Surveys Sample
No Transfer, 60.0%
One Transfer, 29.3%
Two or More
Transfers, 10.7%
2001 NHTS
No Transfer, 86.2%
One Transfer, 11.4%
Two or More
Transfers, 2.4%
The relationship of NHTS unlinked to linked trips results in 1.20 unlinked trips per linked trip. APTA reported a total of 9,653 million unlinked trips for 2001. The NHTS states that "Matching APTA reported unlinked ridership numbers [to NHTS linked ridership numbers] would require a transfer rate of about 50 percent (ratio of 1.5), i.e., half of all transit trips involved a person needing to use two vehicles to complete the trip." (NHTS 2001, p. 11) That ratio is the same as the "traditional" ratio and nearly the same as the 1.49 ratio arrived at using On-Board Surveys Sample access and egress data, and only slightly lower than the ratio of 1.53 obtained using On-Board Sample Surveys transfer rate data. The NHTS report finds that transfers may be undercounted. "It is probable that a number of transfer trips, especially by persons who might be making a routine cross-platform or within-station transfer between public transit vehicles, are not perceived and reported as transfers when reporting for NHTS purposes. There is no empirically measured national estimate of transfer rate or standard factor for converting unlinked to linked transit trips for those trips counted by APTA or NTD methods. An estimate of 1.3 unlinked trips per linked trips is occasionally used; however, others estimate that transferring is more common." (NHTS 2001, p. 10-11) Table 41: On-Board Surveys Sample Times Transferred per Linked Trip Data Compared to 2001 NHTS
Transfer Ratio: Boardings per Linked Trip
Sample Group None One Two Three or More Total
Transit On-Board Surveys Sample Values 60.0% 29.3% 8.4% 2.3% 100.0% 2001 National Household Travel Survey All Transit Riders 86.2% 11.4% 2.4% 100.0%
A Profile of Public Transportation Passenger Demographics and Travel Characteristics, Page 49
Section 4.2.5. Transfer Frequency compares transfer rate and transfer ratio data for On-Board Sample Survey Data and further explains transfer frequency counting procedures. 5.3.6. Trip Purpose Trip purpose data are available from four other studies, the results of which are reported on Figure 21 and Table 42. The 2001 National Household Travel Survey data have been adjusted from actual reported data which included "Return Home" as a trip purpose option such that all trip purposes other than "Return Home" are increased proportionately to total 100.0%. The original and adjusted data are shown on Table 43. All studies except the NHTS report work trips to be between 50.3 percent and 59.3 percent of all transit trips whereas the NHTS, when adjusted, reports work trips as 33.4 percent of all transit trips. The Transit On-Board Surveys Sample and the TPMS reports, because of the under sampling of children, are expected to overstate work trips. This effect, however, cannot reasonably account for the difference in trip purpose data between the NHTS and the other surveys. The cause of this difference is unknown. As pointed out in Section 3.1.5, because Transit On-Board Surveys Sample data were developed for surveys that in some cases did not include children and in others were conducted only on weekdays or during limited hours of the day, trip purpose for work travel may be overestimated by approximately 2.5 percent to 5.0 percent. If this were correct, a value of 54.2 percent to 56.7 percent would be more accurate for the percent of trips for work travel in the Transit On-Board Surveys Sample, and would be similar to other surveys except for the NHTS. Table 42: On-Board Surveys Sample Trip Purpose Data Compared to Four Other Data Sources
Trip Purpose, Excludes "Home" Trips
Sample Group Work School Social Shopping Dining
Medical Dental
Personal Business Other Total
Transit On-Board Surveys Sample Values 59.2% 10.6% 6.8% 8.5% 3.0% 6.3% 5.7% 100.0%
TPMS Phases I and II On-Board Transit Surveys 50.3% 11.7% 13.9% 12.9% 4.1% In Social 7.1% 100.0%
TPMS Phase III On-Board Transit Surveys 51.7% 16.0% --- 11.3% --- --- 20.9% 100.0%
1992 APTA Americans in Transit 54.4% 14.6% 9.1% 8.8% 5.5% --- 7.6% 100.0%
2001 National Household Travel Survey All Transit Riders (Adjusted, See Table 43)
33.4% 16.7% 21.2% 11.3% 4.2% 13.2% --- 100.0%
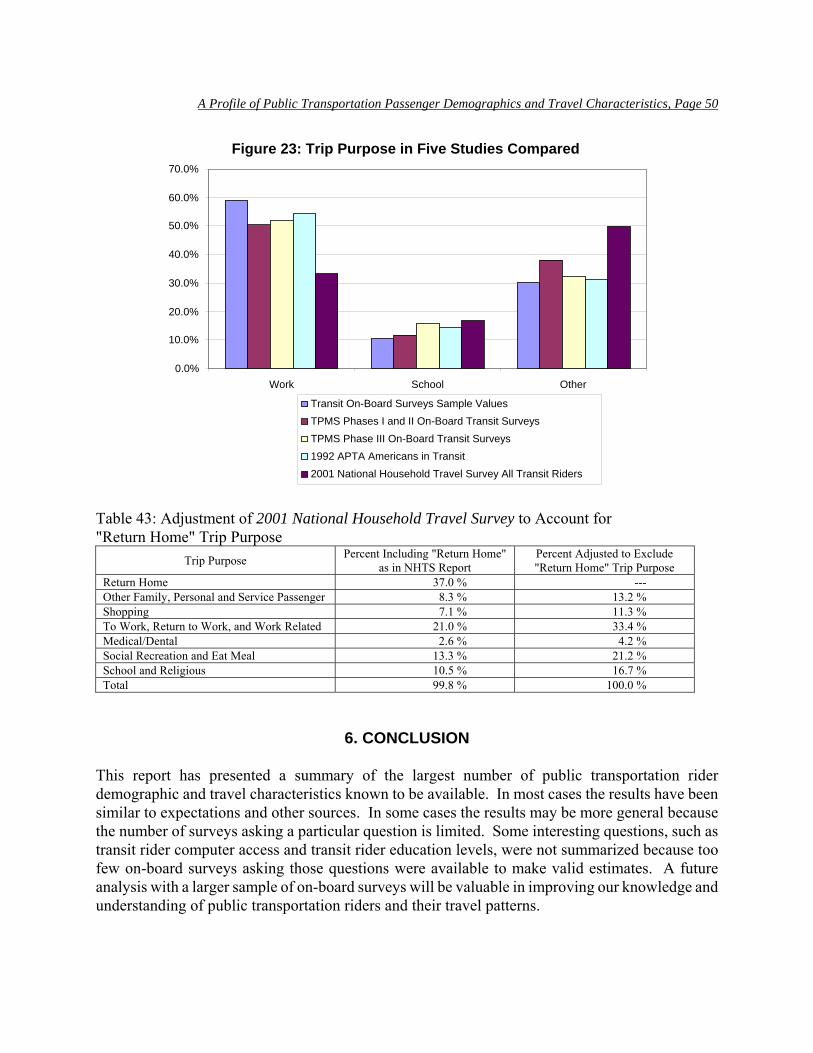
A Profile of Public Transportation Passenger Demographics and Travel Characteristics, Page 50
Table 43: Adjustment of 2001 National Household Travel Survey to Account for "Return Home" Trip Purpose
Trip Purpose Percent Including "Return Home" as in NHTS Report
Percent Adjusted to Exclude "Return Home" Trip Purpose
Return Home 37.0 % --- Other Family, Personal and Service Passenger 8.3 % 13.2 % Shopping 7.1 % 11.3 % To Work, Return to Work, and Work Related 21.0 % 33.4 % Medical/Dental 2.6 % 4.2 % Social Recreation and Eat Meal 13.3 % 21.2 % School and Religious 10.5 % 16.7 % Total 99.8 % 100.0 %
6. CONCLUSION This report has presented a summary of the largest number of public transportation rider demographic and travel characteristics known to be available. In most cases the results have been similar to expectations and other sources. In some cases the results may be more general because the number of surveys asking a particular question is limited. Some interesting questions, such as transit rider computer access and transit rider education levels, were not summarized because too few on-board surveys asking those questions were available to make valid estimates. A future analysis with a larger sample of on-board surveys will be valuable in improving our knowledge and understanding of public transportation riders and their travel patterns.
Figure 23: Trip Purpose in Five Studies Compared
0.0%
10.0%
20.0%
30.0%
40.0%
50.0%
60.0%
70.0%
Work School Other Transit On-Board Surveys Sample ValuesTPMS Phases I and II On-Board Transit SurveysTPMS Phase III On-Board Transit Surveys1992 APTA Americans in Transit2001 National Household Travel Survey All Transit Riders
A Profile of Public Transportation Passenger Demographics and Travel Characteristics, Page 51
7. REFERENCES
(ACS 2004) U.S. Census Bureau. 2004 American Community Survey, Table S0802. Means of Transportation to Work by Selected Characteristics. Washington: U.S. Census Bureau, 2005. at http://factfinder.census.gov/ (APTA Fact Book) Public Transportation Fact Book 2006. Washington: American Public Transportation Association, 2006. (APTA Profile 1992) Linsalata, Jim. Americans in Transit: A Profile of Public Transit Passengers. Washington: American Public Transportation Association, December 1992. (APTA Ridership Report) "Transit Ridership Report." Washington: American Public Transportation Association, quarterly. (Census Demographic Profiles 2000) "United States Census 2000 Demographic Profiles." Washington: U.S. Census Bureau. at http://censtats.census.gov/pub/Profiles.shtml (Census J-t-W 2000) "Table QT-P23. Journey to Work: 2000, Census 2000 Summary File 3 (SF 3) - Sample Data." American Fact Finder. Washington: U.S. Census Bureau. at http://factfinder.census.gov/ (Current Population Report 2005) DaNavas-Walt, Carmen, Bernadette D. Proctor, and Cheryl Hill Lee. Income, Poverty, and Health Insurance Coverage in the United States: 2004. Current Population Reports, P60-229. Washington: U.S. Census Bureau, 2005. (NHTS 2001) Polzin, Steven and Xuehao Chu. Public Transit in America: Results from the 2001 National Household Travel Survey. Tampa, FL: Center for Urban Transportation Research, University of South Florida, September 2005. (NPTS 1995) Polzin, Steven E., Joel R. Rey, and Xuehao Chu. Public Transit in America: Findings from the 1995 Nationwide Personal Transportation Survey. Tampa, FL: Center for Urban Transportation Research, University of South Florida, September 1998. (NTD Report) National Transit Database. Washington: Federal Transit Administration, annual. (Statistical Abstract 2002) Statistical Abstract of the United States 2002. Washington: U.S. Census Bureau, 2002. at www.census.gov (TCRP Synthesis 63) Schaller, Bruce. TCRP Synthesis 63: On-Board and Intercept Transit Survey Techniques. Washington: Transportation Research Board, 2005.
A Profile of Public Transportation Passenger Demographics and Travel Characteristics, Page 52
(TPMS I and II) McCollom Management Consulting. Transit Performance Monitoring System (TPMS) Results: Summary Report Phases I and II. Washington: American Public Transportation Association, Federal Transit Administration, February 2002. (TPMS III) McCollom Management Consulting. Transit Performance Monitoring System (TPMS) Results: Summary Report Phases III. Washington: American Public Transportation Association, Federal Transit Administration, June 2004.