a practical approach to automation and quality control · a practical approach to automation and...
TRANSCRIPT
A Practical Approach to Automation and Quality Control
Hourly Photochemical Assessment Monitoring Station Monitoring of Non‑Methane Hydrocarbons by AutoGC

Orsat, LLC1416 Southmore AvePasadena, TX 77502www.orsat.com877‑477‑0171
Product specifications and descriptions in this document subject to change without notice.
© Orsat, LLC.
Published 05/05/17 5385‑EN
877-477-0171
A Practical Approach to Automation and Quality Control
WORKING PAPER | June 2016 | 1
ABSTRACT New National Ambient Air Quality Standards (NAAQS) for ozone in 2014 have precipitated rulings which change the scope and implementation of the existing Photochemical Assessment Monitoring Station (PAMS) Network. These changes include a redistribution of existing sites to increase spacial distribution of these monitoring activities and a focus on continuous, hourly measurements rather than less frequent canister sampling. These changes will result in more continuous monitoring activities by state agencies who will be required to implement such stations based on Core Based Statisti‑cal Areas (CSBA) with populations of greater than one million. While newer technology no doubt exists for this type of AutoGC continuous monitoring, the strategies for ensuring data quality and for handling the large amounts of data generated across a nationwide network of monitors need to be formulated. Based on 20 years of continuous AutoGC monitoring in Texas, some basic issues are presented related to instrument calibration and quality controls which might be beneficial to the development of such strategies.
Originally presented by Carol Meyer on June 21, 2016, as paper #941 during the Development of Air Monitoring Techniques Technical Session of the 109th Annual Air & Waste Manage-ment Annual Conference in New Or-leans, LA, June 20–23, 2016.
2 | Orsat, LLC www.orsat.com
INTRODUCTIONThe analysis of ozone precursors has been a feature of the EPA air quality surveillance regulations since 1992 with the establishment of Photochemi‑cal Assessment Monitoring Stations (PAMS) as part of State Implementation Plans (SIP) for ozone non‑attainment areas classified as serious, severe or extreme. At that time, guidance documentation allowed for the measure‑ments of volatile organic carbon (VOC) precursors either by canister sampling or by continuous measurement using a GC–FID with a thermal desorber collecting hourly samples (U.S.EPA, 1998). Only a few agencies chose to do continuous sampling, and since that time a lot has been learned about the issues associated with the continuous field measurement of VOCs.
In 2011 the EPA initiated an effort to re‑evaluate the PAMS requirements and the technology being used for continuous field measurements in conjunc‑tion with upcoming changes to the National Ambient Air Quality Standards (NAAQS) for ozone. With guidance from the Clean Air Science Advisory Committee Air Monitoring Methods Subcommittee (CASAC AMMS) and the National Association of Clean Air Agencies (NACAA) Monitoring Steering Committee (MSC) the EPA has promulgated revisions to the network design and is evaluating newer technology for continuous measurements. The new EPA ruling has recommended a redistribution of PAMS sites in an effort to increase the spatial coverage of this data for modeling performance evalu‑ations (Cavender, 2015). More agencies may find themselves responsible for implementing continuous hourly VOC monitoring in conjunction with their existing national core (NCore) monitoring network sites. In conjunction with this new rule‑making the EPA has commissioned a study to evaluate the currently available instrumentation for fully automated, hourly PAMS monitoring which includes both laboratory assessment and field assessment of a number of commercially available systems (US EPA, 2014).
While this type of hourly AutoGC monitoring represents a significant increase in complexity in both implementation and data management, systems have been developed and deployed to fully automate and streamline data col‑lection and management.
CONTINUOUS PAMS VOC FIELD MONITORINGFully automated systems should be implemented with clear network Data Quality Objectives (DQO) in mind. Monitoring up to 56 speciated non‑methane hydrocarbons (NMHCs) on an hourly basis generates large amounts of data which must be collected, checked and validated. To reduce the cost of review and reprocessing of data, the system should be configured to identify and quantitate each target at the time the sample is analyzed, thus reducing post analysis processing. Ideally data should be evaluated post analysis as a data set and include sufficient quality control samples which can be readily identified and easily reviewed to assess the quality of ambient data being collected.
“More agencies may
find themselves
responsible for
implementing
continuous hourly
volatile organic
carbon (VOC)
monitoring...”
877-477-0171
A Practical Approach to Automation and Quality Control
WORKING PAPER | June 2016 | 3
A number of different systems have been utilized for continuous speciated NMHC analysis in ambient air monitoring networks worldwide. Several studies have attempted to quantitate the variation in NMHC measurements between different methods as well as different laboratories (Apel, et. al., 1994; Apel, et. al., 1999; Apel, et. al., 2003; Apel, et. al., 2003; Rappengluck, et. al., 2006; Slemr, et. al., 2002; Hoerger, et. al., 2015; Pearson, 2014). These inter‑comparisons generally regarded samples collected in canisters and those collected from continuous field activities as similar and focused primarily on instrumental challenges with the resulting analysis focused on uncertainties associated with instrumental techniques and generation and usage of calibra‑tion standards. The Accurate Measurements of Hydrocarbons in Atmosphere (AMOHA) project did address comparisons aimed at assessing differences in sample collection which discussed a large number of issues associated with sample collection in canisters (Plass‑Dülmer, et. al., 2006). Most if not all these inter‑comparisons report many of the same issues associated with accuracy of various techniques and several address the specific differences associated with detection by mass spectroscopy versus flame ionization detection. However, few if any studies detail comparisons of large amounts of ambient data related to trend analysis. A common approach to scrutinizing the trees and never really seeing the forest. Many did however express the need for global DQOs and uniform quality assurance plans to ensure that data used in modeling activities would be precise if not absolutely accurate.
The AutoGC SystemAlthough a number of studies have utilized TD–GC–MS for limited continu‑ous monitoring it has not proved to be the best system for large scale field monitoring. Challenges with stability, data handling, standards and the overall complexity of this analytical procedure does not lend itself to implementa‑tion in a large scale, unattended, field monitoring network (Demeestere, et. al, 2008). The above mentioned comparisons all included this type of instrumentation but it was largely used for monitoring involving canister collection of samples. It is significant to note that the requirements for air toxics monitoring which commonly relies on GC–MS technology because of the complex nature of the targets being quantitated, makes it commonly available in environmental laboratories. For species not sensitive to flame ionization, mass spectroscopy is often preferred. However, where species present a generally carbon specific response in the FID, this instrumentation provides a more sensitive, more cost effective and more easily calibrated detection scheme.
In conjunction with implementation of this type of monitoring, agencies will have to develop the necessary Quality Assurance Project Plan (QAPP) as well as the necessary Standard Operating Procedures (SOP) to accomplish this more enhanced monitoring. Simplification of the quality control strategies as well as calibration requirements will play a key role in the success of any monitoring plan. The identification and quantitation of up to 56 NMHC spe‑cies hourly requires a quality control strategy which is easy to implement and maintain. Two commercially available systems were employed in this study. The PerkinElmer Ozone Precursor system composed of the Turbomatrix thermal desorber in conjunction with a Clarus dual FID gas chromatograph
56
NMHCs
“When 60% of
the analyzed
components fall
below 100 pptv,
instrumental and
sampling system
contributions
become an
integral part of the
measurement.
”
4 | Orsat, LLC www.orsat.com
equipped with a Dean’s switch has been used extensively in operations in Texas for over 20 years and has a long history of use in continuous ambient monitoring (Broadway and Tipler, 2009). This system has been completely automated using the Totalchrom data system in conjunction with automation software and a dynamic dilution system supplied by Orsat, LLC. Additionally an Agilent GC–FID system equipped with a Dean’s switch and coupled with the Markes Unity thermal desorption system was automated using Agilent OpenLAB CDS EZChrom edition software for unattended operation (Markes International, 2013). Both systems have had wide use in both the continuous field monitoring networks worldwide and for laboratory toxic organic (TO) method analysis by either GC–FID or GC–MS.
While currently available equipment has proven to be robust and capable of fully unattended operation, the operational aspects of quality assurance must be considered as an integral part of the successful collection of large amounts of VOC data. It becomes important that the analytical system be operated with minimum input from users to reduce errors in data collection and potential equipment failures related to instrument manipulation. To fa‑cilitate this, it is necessary to implement quality control checks which allow operators to access the performance of instrumentation regularly. Routine quality controls should be fully automated with a frequency based on DQOs and validation requirements. In addition, operators and data validators should have data available on a daily basis to confirm not only successful data col‑lection but that the data meets the network quality control limits and has not deviated or drifted from previous measurements. As mentioned before, these systems collect a large amount of data and can just as easily collect a large amount of data which fails to meet the necessary DQOs. Unlike canister sampling activities, there is no second chance to analyze these samples.
Data portability plays a significant role in field applications which generate large amounts of data. Since sites are generally located in monitoring stations which are not connected to robust client/server networks, data often needs to be moved to centralized locations for evaluation and possibly reprocessing. Data systems which generate compact hourly data files capable of preserving all the necessary parameters to recreate the processing method at the time of collection are advantageous and facilitate retrieval from the field stations via file transfer protocols over broadband connections. Systems which can be configured to allow specialized filenames allow both operators and data users to easily identify data by site, month, day and hour of the day and thus facilitate data evaluation and handling.
As with any field sampling activity, problems do arise. Power failures, equip‑ment malfunction and poor quality control results can cause significant data loss if these issues are not designed for in the implementation of the network. Successful strategies for reducing data losses include uninterrupt‑ible power supplies, redundant air and hydrogen supplies, remote equip‑ment control and annual preventative maintenance in addition to having backup equipment for easy replacement and repair of purification systems, broadband routers, sample pumps, compressors and other parts prone to failure. Consumables such as driers and traps should be on‑hand and robust
“However, few if
any studies detail
comparisons of
large amounts
of ambient data
related to trend
analysis.
”
877-477-0171
A Practical Approach to Automation and Quality Control
WORKING PAPER | June 2016 | 5
procedures for replacement can reduce data losses due to replacement of parts integral to the sampling system.
MAINTAINING DATA QUALITY ACROSS NETWORKSFor agencies with multiple systems the comparability of data from multiple field monitors will be of concern. However, on a larger scale the measure‑ments collected to be incorporated into the EPA Air Quality System should also be viewed as part of the larger national network and efforts should be made to provide agencies with guidance to ensure comparability. Studies such as Accurate Measurements of Hydrocarbons in the Atmosphere (AMOHA), (Plass‑Dülmer, et. al., 2006; Slemr, et. al, 2002), Nonmethane Hydrocarbon Inter‑comparison Experiment (NOMHICE), (Apel, et. al, 1994, 1999, 2003) and Aerosols, Clouds, and Trace gases Research Infrastructure Network (ACTRIS), (Hoerger, et. al., 2015) to name only a few, have all generally supported the necessity for comprehensive quality assurance and quality control, well‑characterized systems and well documented operating procedures for both analysis and data review to produce comparable data across large networks. Key to these goals is a uniform calibration strategy specific to the instrumen‑tation being chosen as well as guidance on standards used.
Quality Control
To this end, the Texas Commission on Environmental Quality (TCEQ) with the help of Orsat, LLC has accomplished this through a mixture of commercially
Table 1. Data Quality Controls for PAMS AutoGCs.
Quality Control Check Composition Purpose Frequency Acceptance Criteria
Retention Time Standard (RTS)
Mixture containing all target compounds ideally between 1‑5 ppbC
To help assess retention time shifts and optimize processing methods
Twice a month or weekly
100% of the compounds are identified correctly in the multicomponent RTS
Calibration Verification Standard (CVS)
Mixture of 15 reference compounds including propane and benzene used for calibration
To assess the instrument drift and ensure continued instrument calibration
Daily 1. Propane and benzene % recoveries within 75% – 125% and all other calibrants within 55 – 145%
2. Data must be bracketed by valid CVS
Method (Analytical) Blank
Humidified, clean air To assess system contribution to the measurement
Daily 1. All target compounds < 2.0 ppbC2. TNMHC < 20 ppbC3. Data must be bracketed by valid
blanks
Precision Check Mixture used for CVS To assess analytical precision
Weekly Propane and benzene %RPD < 20% in two consecutive CVS runs
Laboratory Calibration Standard (LCS)
Mixture of 15 reference compounds including propane and benzene used for calibration
Second source standard, statically blended 5 ppbv
Twice a month or weekly
Propane and benzene % recoveries within 70 – 130%
6 | Orsat, LLC www.orsat.com
available equipment and added features that have allowed their network to expand to over 35 monitoring stations collecting hourly data on 48 NMHCs, year round. Data Quality Objectives (DQOs) which specify the limits of ac‑ceptable data for all quality control checks are the basis of maintaining instrumental uniformity and defines when instrument performance is not acceptable and requires maintenance or repair. Table 1 shows the Quality Control Checks used in the TCEQ network for validation of PAMS data.
Instrument Calibration and Calibration Verification Standard Checks
To achieve uniformity each system is configured the same and maintained under strict parameters. Some operational elements have been implemented to ensure that each system is deployed, initially tested and continuously operated in the same fashion. Systems are all configured for fully automated quality control checks which are run daily and include both a calibration verification standard (CVS) and a system blank. These checks are then used by validation team members to determine the validity of measurements and used to bracket all ambient data. Systems are re‑calibrated when CVS results deviate from accepted limits or whenever maintenance is performed. The calibration curve is generated using a dynamic dilution system (Merlin MicroScience, MMSD–VOC) which dilutes a standard containing 14 targets at a concentration of 1 ppmv with purified and humidified air. Standards at this concentration are more easily procured at the necessary 5% blend tolerance and have generally good shelf life. This standard is trans‑filled into a 33 L SUMMA canisters for use at the field monitoring site and connected to the dilution system. The dilution system is supplied with compressed air which has been purified using a Parker TOC Gas Generator and has an integral humidifier. The standard is diluted to nominally 5 ppbv for the nightly CVS and the system is capable of manually providing calibration curves from 5 to 100 ppbv to test the system linearity.
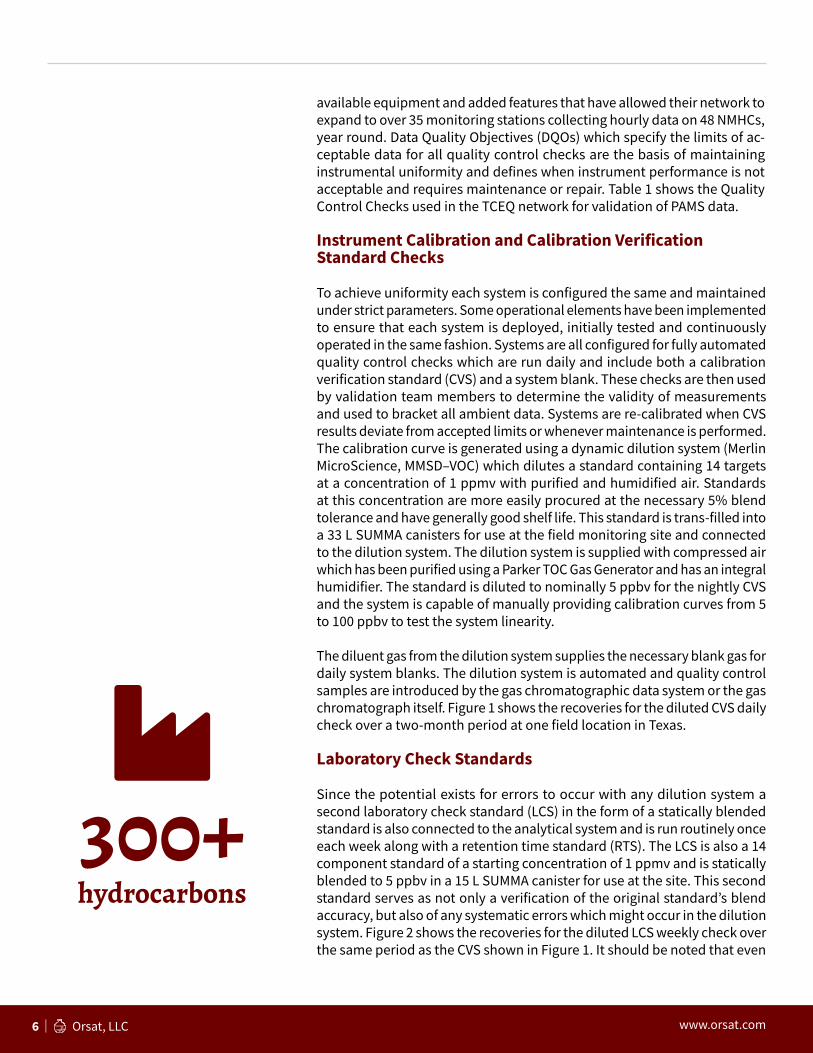
The diluent gas from the dilution system supplies the necessary blank gas for daily system blanks. The dilution system is automated and quality control samples are introduced by the gas chromatographic data system or the gas chromatograph itself. Figure 1 shows the recoveries for the diluted CVS daily check over a two‑month period at one field location in Texas.
Laboratory Check Standards
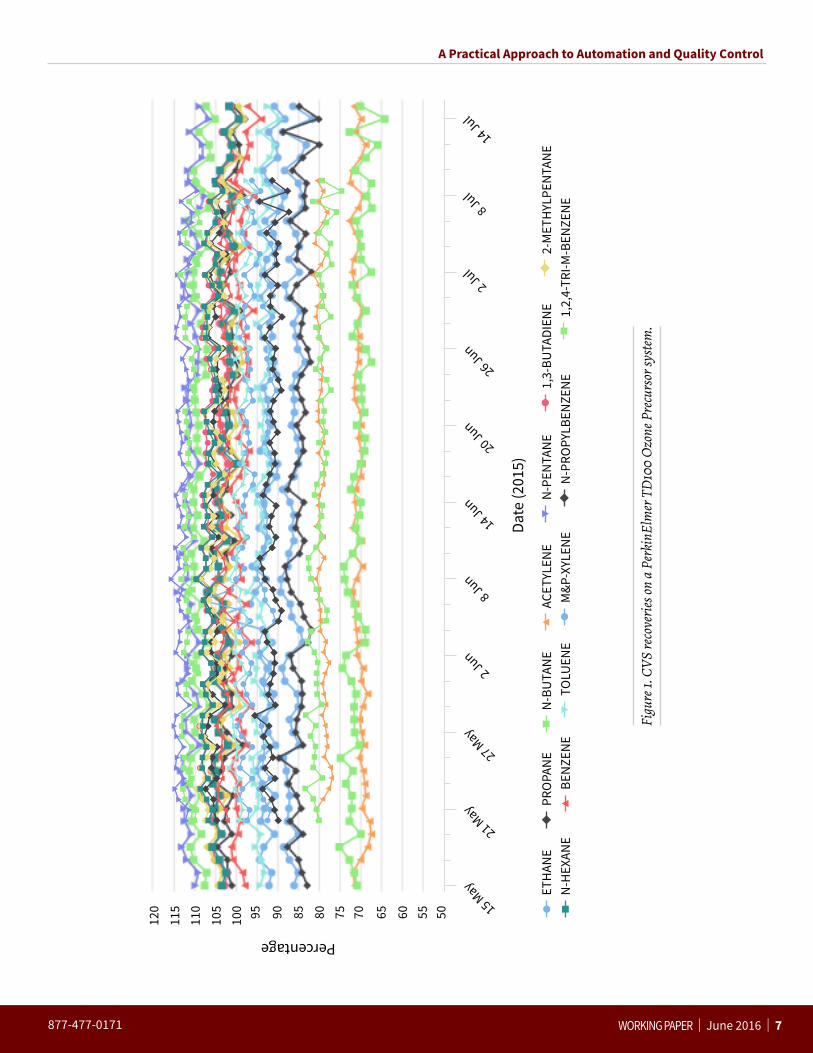
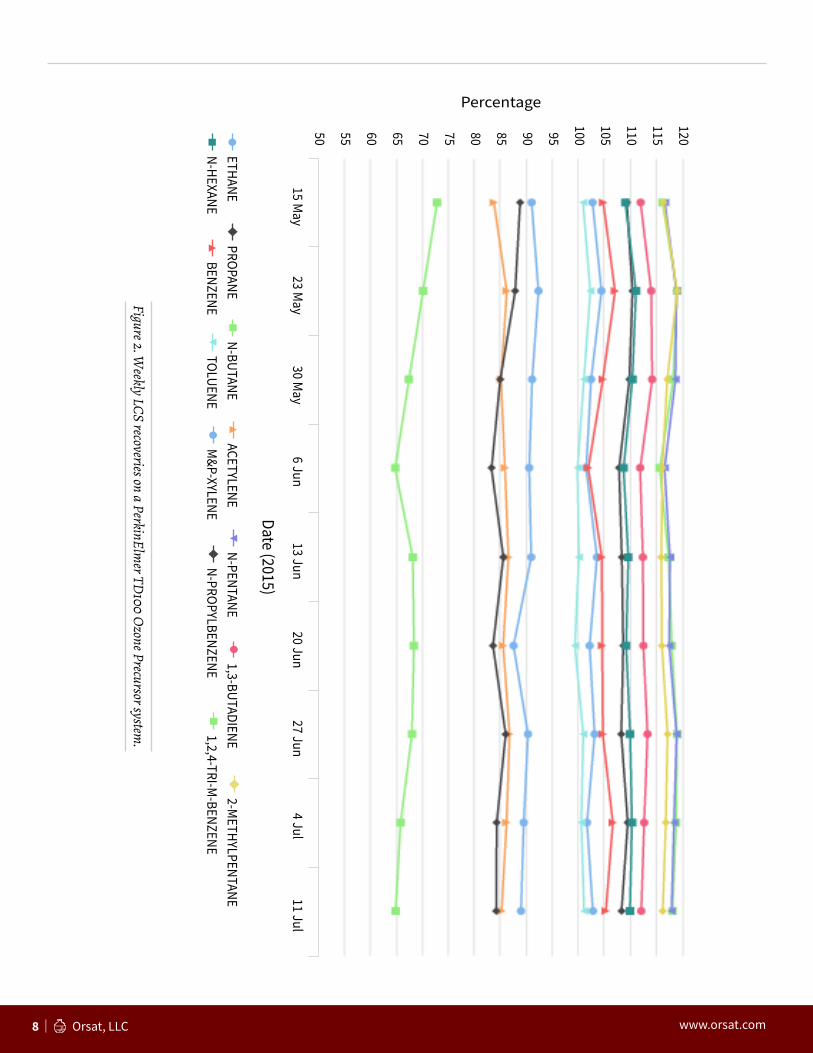
Since the potential exists for errors to occur with any dilution system a second laboratory check standard (LCS) in the form of a statically blended standard is also connected to the analytical system and is run routinely once each week along with a retention time standard (RTS). The LCS is also a 14 component standard of a starting concentration of 1 ppmv and is statically blended to 5 ppbv in a 15 L SUMMA canister for use at the site. This second standard serves as not only a verification of the original standard’s blend accuracy, but also of any systematic errors which might occur in the dilution system. Figure 2 shows the recoveries for the diluted LCS weekly check over the same period as the CVS shown in Figure 1. It should be noted that even
300+hydrocarbons
877-477-0171
A Practical Approach to Automation and Quality Control
WORKING PAPER | June 2016 | 7
556065707580859095100
105
110
115 50120 15 M
ay
Percentage
21 May
27 May
2 Jun
8 Jun
14 Jun
20 Jun
26 Jun
2 Jul
8 Jul
14 Jul
Date
(201
5)
1,3-
BUTA
DIEN
E 1,2,
4-TR
I-M-B
ENZE
NE
2-M
ETH
YLPE
NTA
NE
N-P
ROPY
LBEN
ZEN
EN
-PEN
TAN
EAC
ETYL
ENE
M&P
-XYL
ENE
TOLU
ENE
N-B
UTA
NE
BEN
ZEN
EPR
OPA
NE
ETH
ANE
N-H
EXAN
E
Fi
gure
1. C
VS re
cove
ries o
n a
Perk
inEl
mer
TD
100
Ozo
ne P
recu
rsor
syst
em.
8 | Orsat, LLC www.orsat.com
55 60 65 70 75 80 85 90 95
100
105
110
11550
120
15 May
Percentage
23 May
30 May
6 Jun13 Jun
20 Jun27 Jun
4 Jul11 Jul
Date (2015)
1,3-BUTADIENE1,2,4-TRI-M-BENZENE2-M
ETHYLPENTANEN-PROPYLBENZENE
N-PENTANEACETYLENE
M&P-XYLENE
TOLUENEN-BUTANE
BENZENEPROPANE
ETHANEN-HEXANE
Figure 2. W
eekly LCS recoveries on a PerkinElmer TD
100 Ozone Precursor system
.
877-477-0171
A Practical Approach to Automation and Quality Control
WORKING PAPER | June 2016 | 9
at a concentration of 1 ppmv these standards show losses of some targets like acetylene due to the canister humidity and contact with steel surfaces. These losses have been reported by others as well (Slemr, et. al., 2002; Plass‑Dülmer, et. al., 2006). Losses that occur due to the humidification of canisters and sample lines can be mitigated somewhat by the use of prod‑ucts like Silcosteel. However, there are also losses which occur due to the instrumental analysis itself. An accurate assessment of the individual losses from various issues such as steel surfaces, trap efficiencies and irreversible adsorption and losses to nafion driers has not been done for these systems, so the recoveries reported are the sum total of all losses.
Field Blanks
Field blanks are possibly the most difficult quality control check to gener‑ate and the most crucial for evaluation of contributions to the analytical measurement. FID systems combined with thermal desorption used for field monitoring are capable of sufficient sensitivity to achieve sub‑ppbv detection limits when presented with target species in manufactured blends. How‑ever, it is another issue when presented with the complex matrix normally experienced in ambient air monitoring which, depending on the locale, can contain in excess of 300 hydrocarbons.
Contamination issues in canisters are also a common problem in the genera‑tion of good analytical blanks which are representative of the true instru‑mental contributions. In the field monitoring activities in Texas field blanks are generated using compressed air which is purified using a Parker TOC Gas Generator (Parker Balston TOC1250). The purified gas is used in a field dilution system as the diluent for the blended CVS check standard. It flows continuously through the dilution system which has an internal humidifica‑tion system and thus can be automatically run in conjunction with the CVS check standard. In this fashion it provided information on any contribution to the check standard which might occur as a result of the dilution as well as providing verification of any carry‑over which might occur from the check standard.
NETWORK UNIFORMITYThe network in Texas is composed of more than 35 PerkinElmer systems. These systems have been modified for the specific automation which al‑lows for the unattended introduction of all the necessary quality control checks. This alone provides some control of site‑to‑site variations since this facilitates the successful implementation standard operating procedures and maintenance procedures across a single platform. However, in an attempt to evaluate the Markes Unity 2 thermal desorption system coupled with an Agilent gas chromatograph for similar highly structured automation, the Markes‑Agilent system has been set up and operated in the same fashion as the PerkinElmer system with great success and similar results.
“... the unusually
large distribution
for propylene
along with its
high recoveries
is consistent
with common
issues associated
with propylene
contamination of
the nafion drier.
”
10 | Orsat, LLC www.orsat.com
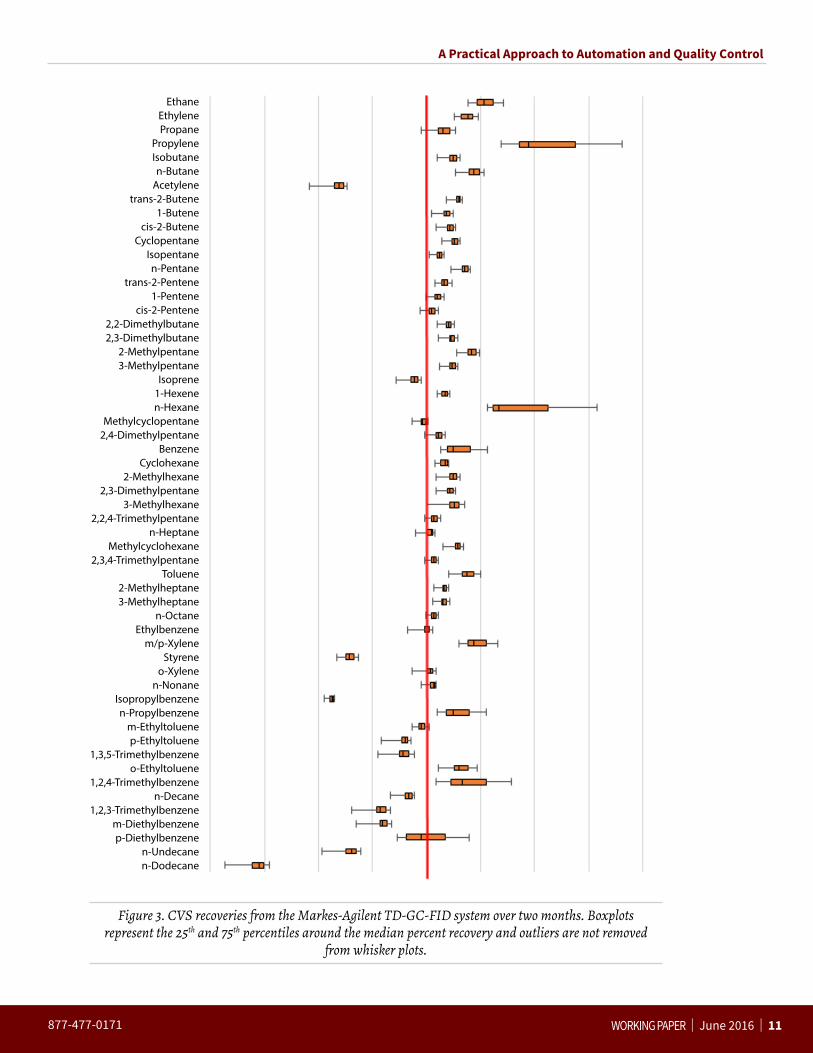
The Markes‑Agilent system was set up with automation to allow the same quality control strategy. Figure 3 shows the distribution for 56 target analytes in uncensored data for the daily CVS over a period of two months. The small quartile distributions of the nightly recoveries for most targets indicate good precision and the compounds showing larger distributions are consistent with known contamination problems or common data errors. For instance, the unusually large distribution for propylene along with its high recoveries is consistent with common issues associated with propylene contamination of the nafion drier. Likewise, issues are often noted for n‑hexane associated with poor integration attributable to the switching of the Dean’s switch. The multidimensional separation technique in this analysis utilizes a Dean’s switch between a boiling point column (BP1, dimethyl polysiloxane column, 0.22 mm i.d. × 50 m, SGE) which separates the higher boiling analytes and a Porous Layer Open Tubular (PLOT) column (CP‑Al2O3/Na2SO4, 0.32 mm × 50 m × 5 µm, Varian) used to separate the light gases through 1‑hexene. Hexane elutes from the BP1 column just after the Dean’s switch is activated to divert the effluent of the BP column away from the PLOT column. This sometimes results in slight changes in the baseline which if incorporated into the integration of the hexane peak cause either losses or additions to its area if the switch time is too long or too short.1
The Markes‑Agilent system was calibrated using propane and benzene aver‑age response factors for the PLOT and BP columns respectively and thus the commonly experienced lower recovery for heavier targets is shown in this data. However this bias does not appear to be dissimilar to that experienced with the PerkinElmer systems. Provided the same care is taken with instru‑ment configurations and automation, this system clearly performs well in the same environment.
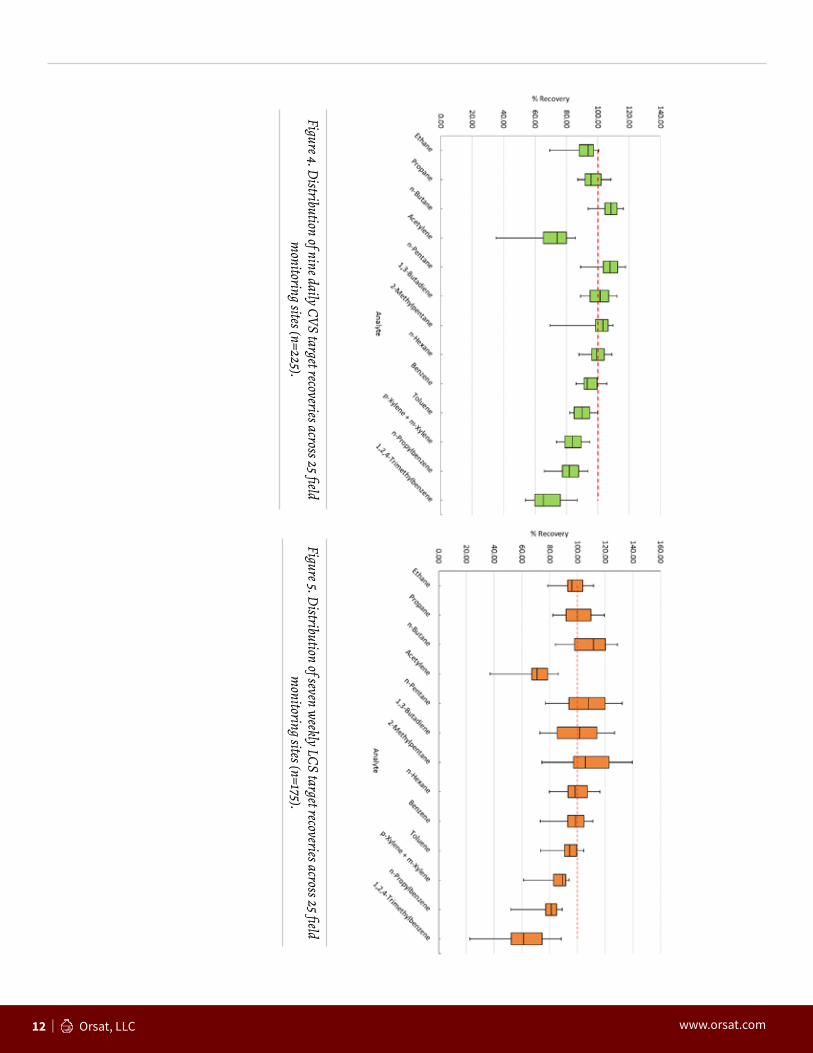
The recoveries shown in Figures 1 and 2 represent a single monitor. To assess the uniformity of performance across the TCEQ network, a comparison of multiple sites is shown in Figures 4 and 5. Figure 4 represents the distribution of recoveries for the selected targets in the CVS check standard across 25 separate sites in Texas over the same time period. CVS data is represented by nine daily check standards from each site spanning nine consecutive days. Figure 5 shows a similar distribution for LCS data represented by seven data points from each site spanning a longer period of seven weeks. While the known bias for low acetylene recoveries and a trend toward lower recoveries for higher boiling targets, the variance across the network is low suggesting good inter network precision.
1 See Broadway and Tipler, 2009 and Markes International, 2013 for a full discussion of the separation system for both the PerkinElmer and Markes‑Agilent systems.
56target
components
877-477-0171
A Practical Approach to Automation and Quality Control
WORKING PAPER | June 2016 | 11
20% 40% 60% 80% 100% 120% 140% 160% 180%
EthaneEthylenePropane
PropyleneIsobutanen-ButaneAcetylene
trans-2-Butene1-Butene
cis-2-ButeneCyclopentane
Isopentanen-Pentane
trans-2-Pentene1-Pentene
cis-2-Pentene2,2-Dimethylbutane2,3-Dimethylbutane
2-Methylpentane3-Methylpentane
Isoprene1-Hexenen-Hexane
Methylcyclopentane2,4-Dimethylpentane
BenzeneCyclohexane
2-Methylhexane2,3-Dimethylpentane
3-Methylhexane2,2,4-Trimethylpentane
n-HeptaneMethylcyclohexane
2,3,4-TrimethylpentaneToluene
2-Methylheptane3-Methylheptane
n-OctaneEthylbenzenem/p-Xylene
Styreneo-Xylenen-Nonane
Isopropylbenzenen-Propylbenzenem-Ethyltoluenep-Ethyltoluene
1,3,5-Trimethylbenzeneo-Ethyltoluene
1,2,4-Trimethylbenzenen-Decane
1,2,3-Trimethylbenzenem-Diethylbenzenep-Diethylbenzene
n-Undecanen-Dodecane
Figure 3. CVS recoveries from the Markes-Agilent TD-GC-FID system over two months. Boxplots
represent the 25th and 75th percentiles around the median percent recovery and outliers are not removed from whisker plots.
12 | Orsat, LLC www.orsat.com
Figure 4. D
istribution of nine daily CVS target recoveries across 25 field m
onitoring sites (n=225).
Figure 5. D
istribution of seven weekly LCS target recoveries across 25 field
monitoring sites (n=175).
877-477-0171
A Practical Approach to Automation and Quality Control
WORKING PAPER | June 2016 | 13
SUMMARY While there are any number of analytical systems which may be able to provide the necessary detection limits, resolution and even in some cases the automation for field monitoring, this is only a small part of the challenge associated with achieving the data completeness and consistency neces‑sary for this population of data to be useful to modelers. Strong uniform guidance for the implementation, quality assurance and validation of this data will be necessary across agencies to generate a uniform population of data for modelers. The implementation of a nationwide AutoGC network of field monitoring sites for the continuous hourly NMHC monitoring required for the new NAAQS PAMS rules will require agencies to have a consistent view of the necessary DQOs. Consistency between calibration techniques, calibration levels, and sampling systems along with the availability of reli‑able standards will be instrumental in defining the uniformity of the data generated across the network.
Instrument manufacturer’s challenges include not only reliable identification and quantitation, but also data portability. Data from workstations operating in field environments needs to be moved routinely to a central location for review and possible reprocessing in the data validation stages. The optimum data handling strategies involve data files which are uniquely identified as to site, sample type, date, time and hour to make the handling and review of large quantities manageable. Files which carry all the calibration and identification parameters used in the processing of results offer significant advantages for ensuring accurate reprocessing where necessary when data is reviewed days, weeks or even months after the original collection.
Achieving sampling systems which do not contribute to the measurement is another area that needs improvement. When 60% of the analyzed compo‑nents fall below 100 pptv, instrumental and sampling system contributions become an integral part of the measurement (Plass‑Dülmer, 2006). Indeed, maximizing recoveries for all components which may be affected by losses in the sampling systems or from other analytical issues will contribute to the overall uniformity of the population of data generated across the network. Data from the TCEQ AutoGC network represents over 40 systems operating from several years to more than 20 years collecting hourly data for 56–48 target compounds. This network represents a significant amount of data which indicates that this type of sampling can generate good precision if not perfect accuracy. Although there is room for improvement in the areas of co‑elution and losses to sampling, a strong set of data quality objectives and standard operating procedures for the invalidation of targets which do not meet those objectives can result in a population of data which is stable and uniform.
“While the known
bias for low
acetylene recoveries
and a trend toward
lower recoveries
for higher boiling
targets, the variance
across the network
is low suggesting
good inter network
precision.
”
14 | Orsat, LLC www.orsat.com
ACKNOWLEDGEMENTSThe author would like to acknowledge the assistance of Nicola Watson, Markes International and Kelly Beard, Agilent Technologies in the loan of and configuration of the Markes Unity 2 and Agilent Chromatographic system. In addition, Project Managers at the TCEQ Patti De La Cruz, Cindy Maresh and Melanie Hotchkiss for their feedback and continued support of the AutoGC network in Texas. As always Orsat, LLC is eternally grateful for the help and guidance of Lee Marotta at PerkinElmer.
REFERENCESU.S. EPA. 1998. “Technical Assistance Document for Sampling and Analy‑
sis of Ozone Precursors”. Guidance Document. EPA/600‑R‑98/161 Research Triangle Park, North Carolina 27711: U.S. EPA National Expo‑sure Research Laboratory Human Exposure and Atmospheric Sciences Division
Cavender, Kevin A. 2015. “Summary of Final Photochemical Assessment Monitoring Stations (PAMS) Network Design”. Memorandum OAQPS.
U. S. EPA. 2014. “Gas Chromatograph (GC) Evaluation Study: Laboratory Evaluation Phase Report” Prepared by RTI International and EC/R Incorporated Under Contract EP‑D‑12‑043, Work Assignment 2‑01. RTI/0213957/Revised Final Research Triangle Park, North Carolina 27711: Office of Air Quality Planning and Standards (OAQP)
Apel, Eric, Jack Calvert, and Fred Fehsenfeld. 1994. “The Nonmethane Hydrocarbon Intercomparison Experiment (NOMHICE): Tasks 1 and 2.” Journal of Geophysical Research: Atmospheres (1984–2012) 99 (D8): 16651–16664. doi:10.1029/94JD00086.
Apel, Calvert, Gilpin, Fehsenfeld, Parrish, and Lonneman. 1999. “The Non‑methane Hydrocarbon Intercomparison Experiment (NOMHICE): Task 3.” Journal of Geophysical Research: Atmospheres (1984–2012) 104 (D21): 26069–26086. doi:10.1029/1999JD900793
Apel, Calvert, Gilpin, Fehsenfeld, and Lonneman. 2003. “Nonmethane Hydrocarbon Intercomparison Experiment (NOMHICE): Task 4, Ambient Air.” Journal of Geophysical Research: Atmospheres (1984–2012) 108 (D9). doi:10.1029/2002JD002936.
Apel, Calvert, Gilpin, Fehsenfeld, and Lonneman. 2003. “Correction to ‘Nonmethane Hydrocarbon Intercomparison Experiment (NOMHICE): Task 4, Ambient Air.’” Journal of Geophysical Research: Atmospheres (1984–2012) 108 (D12). doi:10.1029/2003JD003783
“...when data is
reviewed days,
weeks or even
months after the
original collection.
”
877-477-0171
A Practical Approach to Automation and Quality Control
WORKING PAPER | June 2016 | 15
Rappenglück, Apel, Bauerfeind, Bottenheim, Brickell, Čavolka, Cech, et al. 2006. “The First VOC Intercomparison Exercise within the Global Atmo‑sphere Watch (GAW).” Atmospheric Environment 40 (39): 7508–7527. doi:10.1016/j.atmosenv.2006.07.016.
Slemr, Slemr, D’Souza, and Partridge. 2004. “Study of the Relative Re‑sponse Factors of Various Gas Chromatograph–flame Ionisation Detec‑tor Systems for Measurement of C2–C9 Hydrocarbons in Air.” Journal of Chromatography A 1061 (1): 75–84. doi:10.1016/j.chroma.2004.10.037.
Slemr, Slemr, Partridge, D’Souza, and Schmidbauer. 2002. “Accu‑rate Measurements of Hydrocarbons in the Atmosphere (AMOHA): Three European Intercomparisons.” Journal of Geophysical Re‑search: Atmospheres (1984–2012) 107 (D19): ACH 15–1–ACH 15–25. doi:10.1029/2001JD001357.
Hoerger, CC, A Claude, C Plass‑Duelmer, S Reimann, E Eckart, R Stein‑brecher, J Aalto, et al. 2015. “ACTRIS Non‑Methane Hydrocarbon In‑tercomparison Experiment in Europe to Support WMO GAW and EMEP Observation Networks.” Atmospheric Measurement Techniques 8 (7): 2715–2736. doi:10.5194/amt‑8‑2715‑2015.
Pearson, Charles L. 2014. “Interlaboratory Comparison of Ambient Air Samples”. The California Air Resources Board (CARB).
Demeestere, Kristof, Jo Dewulf, Karlien Roo, Patrick Wispelaere, and Her‑man Langenhove. 2008. “Quality Control in Quantification of Volatile Organic Compounds Analysed by Thermal Desorption–gas Chromatog‑raphy–mass Spectrometry.” Journal of Chromatography A 1186 (1‑2): 348–357. doi:10.1016/j.chroma.2007.11.036
Plass‑Dülmer, Schmidbauer, Slemr, Slemr, and D’Souza. 2006. “European Hydrocarbon Intercomparison Experiment AMOHA Part 4: Canister Sampling of Ambient Air.” Journal of Geophysical Research: Atmo‑spheres (1984–2012) 111 (D4). doi:10.1029/2005JD006351.
Broadway, Graham, and Andrew Tipler. 2009. “Ozone Precursor Analysis Using a Thermal Desorption – GC System.”
Markes International. 2013. “Continuous on‑Line Monitoring of Hazardous Air Pollutants by TD–GC–FID”. Markes International.
40
SYSTEMS
16 | Orsat, LLC www.orsat.com
Carol Meyer has been actively involved with PAMS moni-toring since the initial 1993 Coastal Ozone Assessment for Southeastern Texas (COAST) study. Orsat, LLC has provided ambient monitoring services to both state and industry, and currently operates 25 PAMS AutoGC monitor-ing sites in Texas for the TCEQ, UT CEER and AECOM. Using both the PerkinElmer Ozone Precursor system and the Agilent GC System with a Markes Unity 2 thermal desorber, Orsat has developed a fully automated applica-tion for the continuous monitoring of 56 NMHCs hourly.
“...a strong set
of data quality
objectives and
standard operating
procedures for
the invalidation
of targets which
do not meet those
objectives can result
in a population of
data which is stable
and uniform.
”

877-477-0171
A Practical Approach to Automation and Quality Control
WORKING PAPER | June 2016 | 17
Orsat, LLC1416 Southmore AvePasadena, TX 77502www.orsat.com877‑477‑0171
Product specifications and descriptions in this document subject to change without notice.
© Orsat, LLC.
Published 05/05/17 5385‑EN
Fully Automated, Round-the-Clock, Photochemical Assessment Monitoring Stations (PAMS)Orsat has customized the installation of hardware and software to produce a robust application for the measurement of VOCs in the ambient air known as the AutoGC. Orsat has been involved with continuous unattended ambient air VOC monitoring since its earliest implementation in the State of Texas Coastal Oxidant Assessment for Southeast Texas (COAST) program in 1994. Today, Orsat’s services encompass all aspects of site operation from deployment to operator training and application assistance in topics ranging from Microsoft Windows operation to gas chromatographic theory. Over the past three decades, Orsat has deployed over 40 sites and currently maintains over 35 sites in the state of Texas for both public and private industry. In particular, Orsat has worked closely with the Texas Commission on Environmental Quality (TCEQ) to monitor air quality in the Barnett and Eagle Ford Shale Formations.