a practical and integrated depth migration approach to ... · ninth international congress of the...
TRANSCRIPT
Ninth International Congress of the Brazilian Geophysical Society
A practical and integrated depth migration approach to prospect identification in BM-ES-11. Mark Rhodes*, Statoil [Norway], Mike Frismanis, Seismic City [Houston], Bjørn Dalstrøm, Statoil [London]. Copyright 2005, SBGf - Sociedade Brasileira de Geofísica
This paper was prepared for presentation at the 9th International Congress of the Brazilian Geophysical Society held in Salvador, Brazil, 11-14 September 2005.
Contents of this paper were reviewed by the Technical Committee of the 9th International Congress of the Brazilian Geophysical Society. Ideas and concepts of the text are authors’ responsibility and do not necessarily represent any position of the SBGf, its officers or members. Electronic reproduction or storage of any part of this paper for commercial purposes without the written consent of the Brazilian Geophysical Society is prohibited. ____________________________________________________________________
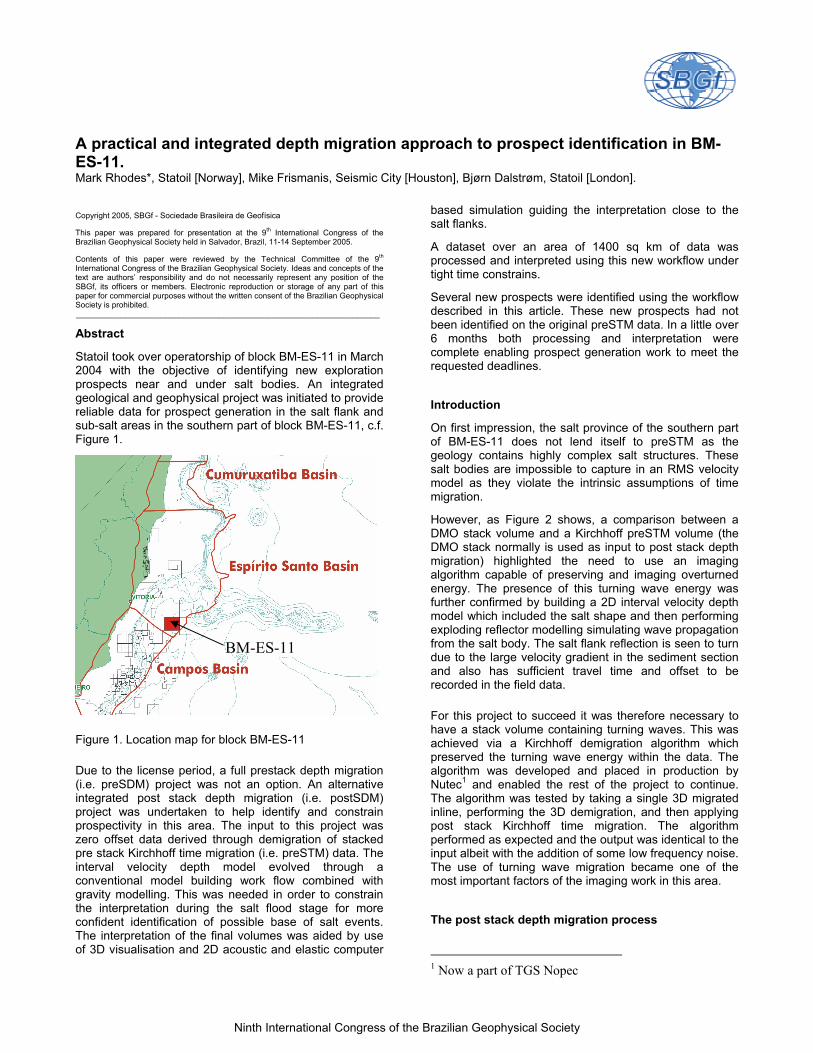
Abstract Statoil took over operatorship of block BM-ES-11 in March 2004 with the objective of identifying new exploration prospects near and under salt bodies. An integrated geological and geophysical project was initiated to provide reliable data for prospect generation in the salt flank and sub-salt areas in the southern part of block BM-ES-11, c.f. Figure 1.
Figure 1. Location map for block BM-ES-11 Due to the license period, a full prestack depth migration (i.e. preSDM) project was not an option. An alternative integrated post stack depth migration (i.e. postSDM) project was undertaken to help identify and constrain prospectivity in this area. The input to this project was zero offset data derived through demigration of stacked pre stack Kirchhoff time migration (i.e. preSTM) data. The interval velocity depth model evolved through a conventional model building work flow combined with gravity modelling. This was needed in order to constrain the interpretation during the salt flood stage for more confident identification of possible base of salt events. The interpretation of the final volumes was aided by use of 3D visualisation and 2D acoustic and elastic computer
based simulation guiding the interpretation close to the salt flanks. A dataset over an area of 1400 sq km of data was processed and interpreted using this new workflow under tight time constrains. Several new prospects were identified using the workflow described in this article. These new prospects had not been identified on the original preSTM data. In a little over 6 months both processing and interpretation were complete enabling prospect generation work to meet the requested deadlines.
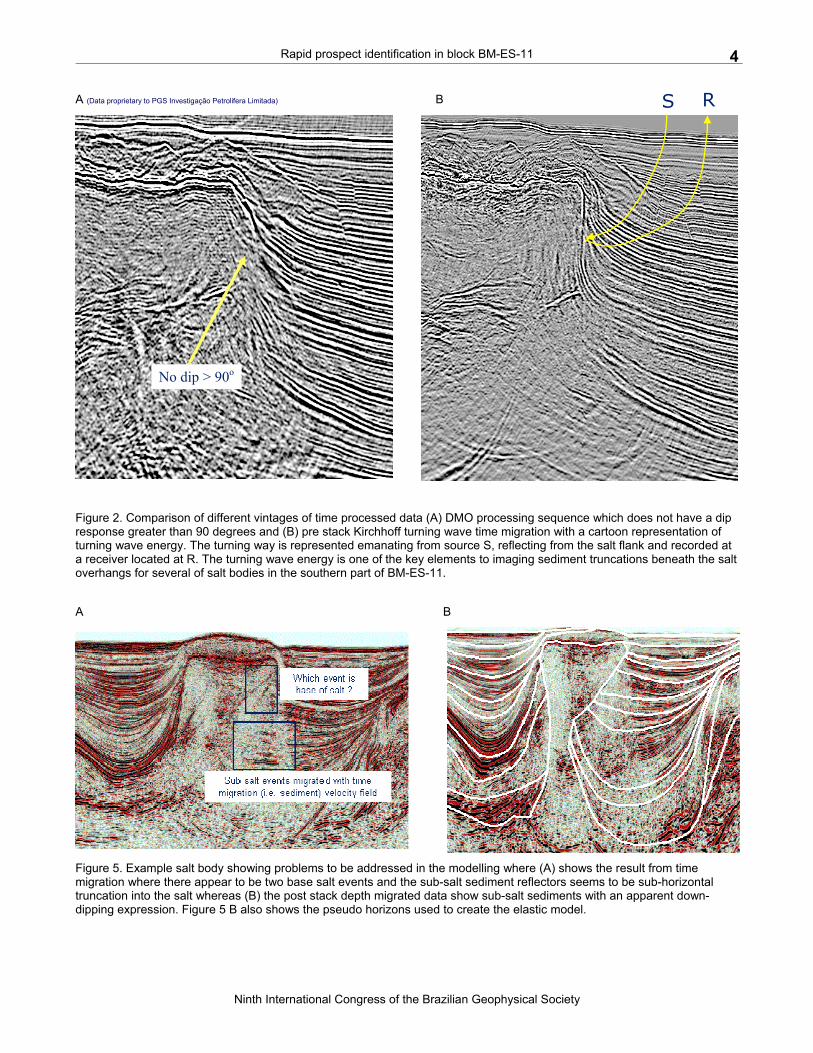
Introduction On first impression, the salt province of the southern part of BM-ES-11 does not lend itself to preSTM as the geology contains highly complex salt structures. These salt bodies are impossible to capture in an RMS velocity model as they violate the intrinsic assumptions of time migration. However, as Figure 2 shows, a comparison between a DMO stack volume and a Kirchhoff preSTM volume (the DMO stack normally is used as input to post stack depth migration) highlighted the need to use an imaging algorithm capable of preserving and imaging overturned energy. The presence of this turning wave energy was further confirmed by building a 2D interval velocity depth model which included the salt shape and then performing exploding reflector modelling simulating wave propagation from the salt body. The salt flank reflection is seen to turn due to the large velocity gradient in the sediment section and also has sufficient travel time and offset to be recorded in the field data.
For this project to succeed it was therefore necessary to have a stack volume containing turning waves. This was achieved via a Kirchhoff demigration algorithm which preserved the turning wave energy within the data. The algorithm was developed and placed in production by Nutec1 and enabled the rest of the project to continue. The algorithm was tested by taking a single 3D migrated inline, performing the 3D demigration, and then applying post stack Kirchhoff time migration. The algorithm performed as expected and the output was identical to the input albeit with the addition of some low frequency noise. The use of turning wave migration became one of the most important factors of the imaging work in this area.
The post stack depth migration process
1 Now a part of TGS Nopec
BM-ES-11
Rapid prospect identification in block BM-ES-11 ________________________________________________________________________________________________________________________________________________________________________________________________________________________________________________________________________________________________________________________________________________________________________________________________________________________________________________________________________________
Ninth International Congress of the Brazilian Geophysical Society
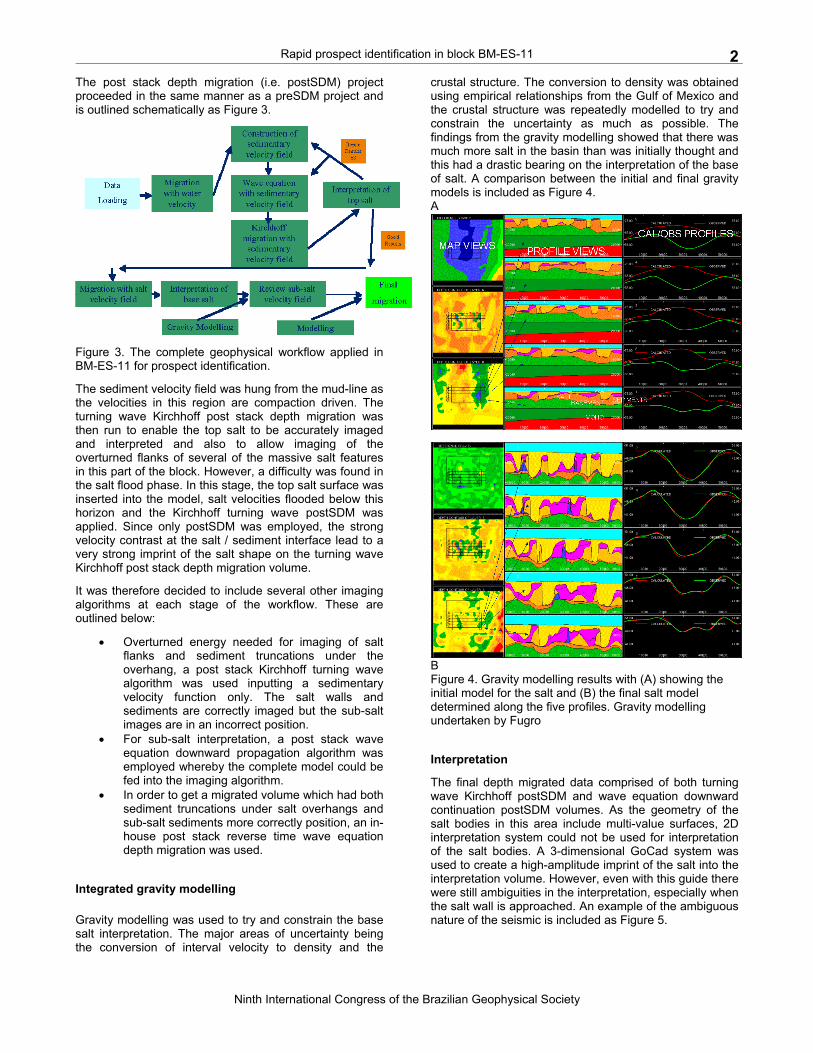
2The post stack depth migration (i.e. postSDM) project proceeded in the same manner as a preSDM project and is outlined schematically as Figure 3.
Figure 3. The complete geophysical workflow applied in BM-ES-11 for prospect identification. The sediment velocity field was hung from the mud-line as the velocities in this region are compaction driven. The turning wave Kirchhoff post stack depth migration was then run to enable the top salt to be accurately imaged and interpreted and also to allow imaging of the overturned flanks of several of the massive salt features in this part of the block. However, a difficulty was found in the salt flood phase. In this stage, the top salt surface was inserted into the model, salt velocities flooded below this horizon and the Kirchhoff turning wave postSDM was applied. Since only postSDM was employed, the strong velocity contrast at the salt / sediment interface lead to a very strong imprint of the salt shape on the turning wave Kirchhoff post stack depth migration volume. It was therefore decided to include several other imaging algorithms at each stage of the workflow. These are outlined below:
• Overturned energy needed for imaging of salt flanks and sediment truncations under the overhang, a post stack Kirchhoff turning wave algorithm was used inputting a sedimentary velocity function only. The salt walls and sediments are correctly imaged but the sub-salt images are in an incorrect position.
• For sub-salt interpretation, a post stack wave equation downward propagation algorithm was employed whereby the complete model could be fed into the imaging algorithm.
• In order to get a migrated volume which had both sediment truncations under salt overhangs and sub-salt sediments more correctly position, an in-house post stack reverse time wave equation depth migration was used.
Integrated gravity modelling Gravity modelling was used to try and constrain the base salt interpretation. The major areas of uncertainty being the conversion of interval velocity to density and the
crustal structure. The conversion to density was obtained using empirical relationships from the Gulf of Mexico and the crustal structure was repeatedly modelled to try and constrain the uncertainty as much as possible. The findings from the gravity modelling showed that there was much more salt in the basin than was initially thought and this had a drastic bearing on the interpretation of the base of salt. A comparison between the initial and final gravity models is included as Figure 4. A
B Figure 4. Gravity modelling results with (A) showing the initial model for the salt and (B) the final salt model determined along the five profiles. Gravity modelling undertaken by Fugro
Interpretation The final depth migrated data comprised of both turning wave Kirchhoff postSDM and wave equation downward continuation postSDM volumes. As the geometry of the salt bodies in this area include multi-value surfaces, 2D interpretation system could not be used for interpretation of the salt bodies. A 3-dimensional GoCad system was used to create a high-amplitude imprint of the salt into the interpretation volume. However, even with this guide there were still ambiguities in the interpretation, especially when the salt wall is approached. An example of the ambiguous nature of the seismic is included as Figure 5.
Rhodes, Frismanis, Dalstrøm. ________________________________________________________________________________________________________________________________________________________________________________________________________________________________________________________________________________________________________________________________________________________________________________________________________________________________________________________________________________
Ninth International Congress of the Brazilian Geophysical Society
3
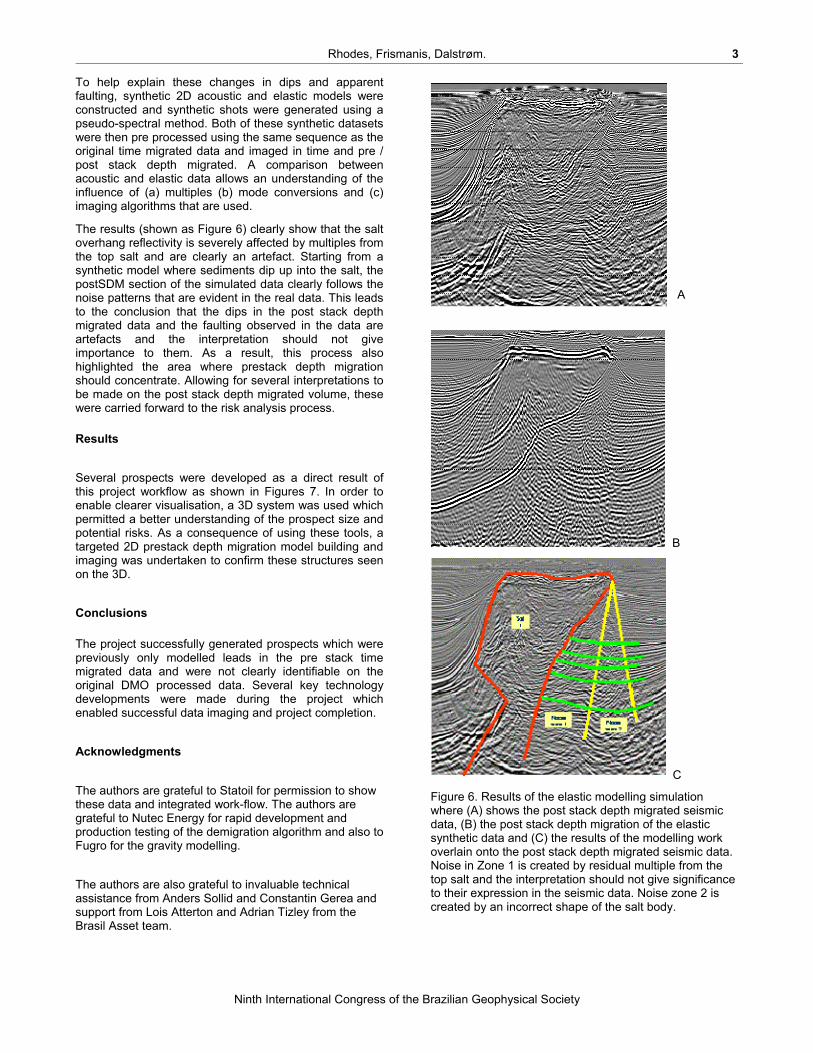
To help explain these changes in dips and apparent faulting, synthetic 2D acoustic and elastic models were constructed and synthetic shots were generated using a pseudo-spectral method. Both of these synthetic datasets were then pre processed using the same sequence as the original time migrated data and imaged in time and pre / post stack depth migrated. A comparison between acoustic and elastic data allows an understanding of the influence of (a) multiples (b) mode conversions and (c) imaging algorithms that are used. The results (shown as Figure 6) clearly show that the salt overhang reflectivity is severely affected by multiples from the top salt and are clearly an artefact. Starting from a synthetic model where sediments dip up into the salt, the postSDM section of the simulated data clearly follows the noise patterns that are evident in the real data. This leads to the conclusion that the dips in the post stack depth migrated data and the faulting observed in the data are artefacts and the interpretation should not give importance to them. As a result, this process also highlighted the area where prestack depth migration should concentrate. Allowing for several interpretations to be made on the post stack depth migrated volume, these were carried forward to the risk analysis process.
Results
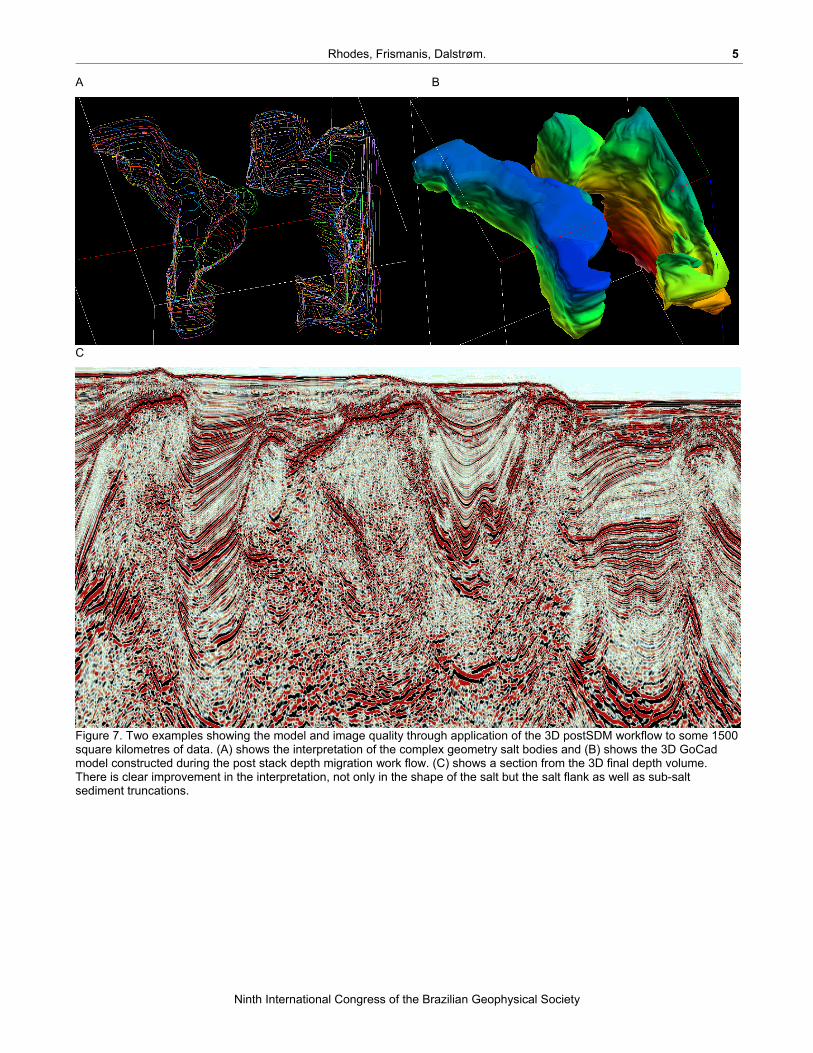
Several prospects were developed as a direct result of this project workflow as shown in Figures 7. In order to enable clearer visualisation, a 3D system was used which permitted a better understanding of the prospect size and potential risks. As a consequence of using these tools, a targeted 2D prestack depth migration model building and imaging was undertaken to confirm these structures seen on the 3D.
Conclusions The project successfully generated prospects which were previously only modelled leads in the pre stack time migrated data and were not clearly identifiable on the original DMO processed data. Several key technology developments were made during the project which enabled successful data imaging and project completion.
Acknowledgments
The authors are grateful to Statoil for permission to show these data and integrated work-flow. The authors are grateful to Nutec Energy for rapid development and production testing of the demigration algorithm and also to Fugro for the gravity modelling.
The authors are also grateful to invaluable technical assistance from Anders Sollid and Constantin Gerea and support from Lois Atterton and Adrian Tizley from the Brasil Asset team.
A
B
C
Figure 6. Results of the elastic modelling simulation where (A) shows the post stack depth migrated seismic data, (B) the post stack depth migration of the elastic synthetic data and (C) the results of the modelling work overlain onto the post stack depth migrated seismic data. Noise in Zone 1 is created by residual multiple from the top salt and the interpretation should not give significance to their expression in the seismic data. Noise zone 2 is created by an incorrect shape of the salt body.
Rapid prospect identification in block BM-ES-11 ________________________________________________________________________________________________________________________________________________________________________________________________________________________________________________________________________________________________________________________________________________________________________________________________________________________________________________________________________________
Ninth International Congress of the Brazilian Geophysical Society
4
A (Data proprietary to PGS Investigação Petrolifera Limitada) B
Figure 2. Comparison of different vintages of time processed data (A) DMO processing sequence which does not have a dip response greater than 90 degrees and (B) pre stack Kirchhoff turning wave time migration with a cartoon representation of turning wave energy. The turning way is represented emanating from source S, reflecting from the salt flank and recorded at a receiver located at R. The turning wave energy is one of the key elements to imaging sediment truncations beneath the salt overhangs for several of salt bodies in the southern part of BM-ES-11.
A B
Figure 5. Example salt body showing problems to be addressed in the modelling where (A) shows the result from time migration where there appear to be two base salt events and the sub-salt sediment reflectors seems to be sub-horizontal truncation into the salt whereas (B) the post stack depth migrated data show sub-salt sediments with an apparent down-dipping expression. Figure 5 B also shows the pseudo horizons used to create the elastic model.
No dip > 90o
S R
Rhodes, Frismanis, Dalstrøm. ________________________________________________________________________________________________________________________________________________________________________________________________________________________________________________________________________________________________________________________________________________________________________________________________________________________________________________________________________________
Ninth International Congress of the Brazilian Geophysical Society
5
A B
C
Figure 7. Two examples showing the model and image quality through application of the 3D postSDM workflow to some 1500 square kilometres of data. (A) shows the interpretation of the complex geometry salt bodies and (B) shows the 3D GoCad model constructed during the post stack depth migration work flow. (C) shows a section from the 3D final depth volume. There is clear improvement in the interpretation, not only in the shape of the salt but the salt flank as well as sub-salt sediment truncations.