a photodiode-based, low-cost telemetric- lidar for …...a photodiode-based, low-cost telemetric-...
TRANSCRIPT
7
A Photodiode-Based, Low-Cost Telemetric- Lidar for the Continuous
Monitoring of Urban Particulate Matter
Massimo Del Guasta, Massimo Baldi and Francesco Castagnoli Istituto Fisica Applicata “Nello Carrara” (IFAC) CNR
Italy
1. Introduction
Photodiodes are widely used in LIDARs (Light Detection And Ranging) (Measures, 1988). In ordinary LIDARs, a pulsed laser source is used to probe the atmosphere, while a fast photomultiplier or Avalanche photodiode (APD) is used to receive the high-frequency return from the atmosphere. APDs are used mainly in the near infrared, where photomultipliers are blind. APDs were used in both analog (Porter et al., 2002) and photon counting mode ( Tatsumi & Tadashi, 1999) for the fast detection of IR LIDAR signals. In our simple telemetric LIDAR, a “vintage” technique used in the 1930s for pioneer studies on atmospheric aerosols (Duclaux,1936) and since then seldom reassessed (Meki et al.,1996), has been re-examined for the remote measurement of urban aerosols. Indeed, it represents a simplified and less expensive version of the elastic-backscatter LIDAR for short-range applications in which a continuous monitoring of particulate matter (PM) is required. It meets the requisite of being a simple instrument for the unattended, real time monitoring of PM to be used in urban pollution monitoring networks. For short-distance applications in which aerosols are to be measured within one hundred meters, a telemetric LIDAR can replace an ordinary LIDAR with a cost that is approximately 40 times lower than that of any ordinary LIDAR. The technique consists of illuminating the atmosphere with a laser beam modulated at low frequency, and then collecting the light scattered by aerosols by means of a photodiode array placed at the output of a telescope located at a certain distance from the laser. The observation angle defines the distance of the probed air volume through triangulation; the received intensity is related to PM10 in non-condensing conditions. The instrument is inexpensive, rugged, and suitable for outdoor operation, 24 h/day; it provides, moreover, all-weather measurement of PM with a time resolution of a few minutes. In the prototype, a green laser is modulated (on/off) at 620 Hz and emitted into the atmosphere. The choice of a visible wavelength simplifies both the alignment of the system and the calibration of the system in terms of volume backscatter (ch.2). The light backscattered by clean air and suspended matter is observed by means of a simple refractive telescope placed at a distance of 50 cm. The light received, which is filtered by means of an interference filter, is focused on a photodiode array placed on the telescope-focus surface. Each photodiode receives light scattered from different distances due to the telemetric geometry. A single photodiode may be selected for continuous measurements at a fixed
www.intechopen.com
Photodiodes – Communications, Bio-Sensings, Measurements and High-Energy Physics
120
distance, while a cyclic scan of different photodiodes is possible in order to measure it at different distances. A lock-in filter centred at the modulation frequency extracts and amplifies the weak signal produced by molecular air and aerosols. The DC signal produced by the lock-in is easily acquired by the digital electronics, which is based on a Microchip PIC18F6720 microcontroller. The telemetric-LIDAR data are acquired together with meteo and house-keeping data. The same board controls the laser, the meteorological sensors, and a GPS-GSRM module for the remote transmission of data. Remote PM measurements at distances of between a few meters and a maximum of 100 m can be obtained using this instrument. The signal obtained is almost proportional to the mass concentration of urban aerosols, as will be shown in this chapter through comparisons with standard PM10 instruments.
2. Theory of operation
Urban atmospheric aerosol is composed of particles of varying sizes. The size distribution
N(r) for LIDAR applications can be modelled as the sum of two lognormal modes (John et
al.,1990): the “accumulation mode”, composed of mature aerosol particles, and the “coarse
mode”, composed of dust that has a short life in the atmosphere:
22
i mi2
i 1 i i
rln ( )
dN(r) N rexp
dr r ln(s ) 2 2 ln s
(1)
where r is the particle radius, rmi is the median radius, Ni the total concentration, while si is
the geometric width for the i-th mode. The elastic-backscatter LIDAR technique (including
the telemetric LIDAR described here) measures the light backscattered at almost 180° by
gases (Rayleigh scattering) and aerosols. The interpretation of LIDAR measurements in
terms of aerosol quantities is based on a simulation of the scattering of the light by means of
particles of known composition, shape and size. The scattering by a generic, spherical
particle is described by the EM field transformation matrix:
( )
1
02
( ) ( ) 0*
( ) 0 ( )
i t k Rs so
p p
E ES e
E ES ikR
(2)
where is the scattering angle, R is the distance vector, ,p sE E are the EM field components
with polarization parallel and perpendicular, respectively, to the incidence plane, and
( )iS are elements defined by the geometry and composition of the particle. The scattering
by homogeneous, spherical particles is formally solved (Mie scattering), and simple series
expansions provide good numerical approximations (Van de Hulst, 1957).
The differential scattering cross section, defined by:
2 21 2
2
( ) ( )'( )
2
S S
k
(3)
is simplified in the case of LIDARs into the backscatter (=180°) differential cross section:
www.intechopen.com

A Photodiode-Based, Low-Cost Telemetric- Lidar for the Continuous Monitoring of Urban Particulate Matter
121
21
2
(180 )'(180 )
S
k (4)
This quantity represents the power received by the LIDAR per unit of solid angle divided by
the power of the incident plane wave for a single scatterer. In the presence of a volume
concentration of N [part/m3] of identical spheres, the volume backscatter coefficient is
defined by β=N*β’(180°) [m-1 sr-1]. In general, both aerosols and gases contribute to the
backscatter. After conversion of the backscattered light into electrical signals, the LIDAR
signal V(z) received from distance z from the elastic-backscatter LIDAR can be expressed
as (Collis & Russel, 1976) :
'
0
2 ( ') ( ') '
0 2
1( ) ( ) ( )
z
a mz z dz
a mV z k E z z ez
(5)
where Eo is the emitted laser power, k is an instrumental constant, and a and m refer,
respectively, to the aerosol and molecular components. The exponential term accounts for
the dispersion of the laser beam in the atmosphere due to the extinction by aerosols (σa) and
gases (σm). In the instrument described here, the extinction terms can be disregarded due to
the short working distances, and thus the LIDAR signal can be simplified to:
0 2
1( ) ( ) ( )a mV z kE z z
z (6)
By assuming a discrete number of measurement distances, for each j-th measurement distance, and by assuming a constant laser power Eo, the telemetric-LIDAR output is simply proportional to the volume backscattering cross section:
j j aj mV K (7)
The molecular component of the backscatter m (Penndorf, 1955; Bucholz, 1995) is practically
constant in the first 100 meters of atmosphere, and is numerically well-known (m=1.59E-6
[m-1 sr-1 ] at 532 nm and NPT conditions). This quantity is proportional to -4 In conditions of clean air (βa<<βm) the constants Kj can thus be obtained from the signal Vj:
cleanj
m
VjK (8)
(being Vj clear proportional to -4 , the use of visible, green light makes this calibration easier than using of IR light). After this measurement, the instrument is calibrated in terms of volume backscatter units [m-1 sr-1], and the aerosol volume backscatter can be derived from
the calibrated measurement as: a = - m. The aerosol volume backscatter is related, in a complex and nonlinear way, to the concentration, size distribution, shape and composition of the aerosol particles . Scattering simulations performed at 532 and 1064 nm (Kent, 1978;
Del Guasta & Marini, 2000) on spherical particles of different nature showed that a is, roughly, directly proportional to the aerosol wet-mass concentration [µg/m3] in most of the practical cases encountered in the urban environment. The proportionality factor as
obtained by simulation (Del Guasta & Marini, 2000) is found to be ≈2 *107 5*106
www.intechopen.com
Photodiodes – Communications, Bio-Sensings, Measurements and High-Energy Physics
122
[(ug/m3)/(1/m sr)] at 532 nm. The aerosol mass concentration was relatively independent from particle size distribution and composition in simulated urban conditions. The simple
proportionality between wet-mass aerosol concentration and a could be used in the presence of relative humidity in the 70%<RH<98% range and in the absence of strong coarse aerosol (dust) loadings. In all the other cases the uncertainty in the conversion could increase significantly. The main indication resulting from these simulations is that the output of a simple elastic backscatter LIDAR (like the telemetric instrument described here) is roughly proportional to the wet-mass concentration of urban aerosols. The instrument output could thus simply be calibrated in terms of urban aerosol mass concentration in many conditions. This technique has been utilized experimentally with the use of an ordinary backscatter LIDAR (Del Guasta, 2002). The LIDAR-derived PM concentration is affected by much larger uncertainty than standard techniques are. Nevertheless, the capability of this optical technique to provide unattended remote measurements with a time resolution of minutes makes it a precious complementary tool for urban pollution studies. We can also point out that the wet mass concentration measured by LIDAR refers to aerosol in equilibrium with environmental humidity, and it must be corrected by means of a proper aerosol growth factor (McMurry & Stolzenburg, 1989) used together with the measured relative humidity when the dry aerosol mass concentration (assimilable to the well known PM10) is the final, required quantity. In cases of RH<80% the wet and dry aerosol mass concentrations coincide, at least for monitoring purposes.
3. The instrument
3.1 Overview The system (Fig.1) is basically composed of a modulated laser source and a receiving system. The backscattered light coming from different ranges is focused on different pixels of a photodiode array. The signal from the photodiodes is amplified, filtered and demodulated by means of lock-in electronics. The final DC voltage is acquired and stored in a microcontroller board. The microcontroller communicates with the external PC, and also manages meteorological and ancillary sensors. A description of the different components follows. Telemetric LIDAR specifications Laser 532 nm, 100 mW, 620 Hz modulation Telescope Ø 80 mm, f=300 mm Laser-telescope Distance 0.5 m Interference Filter BW 10 nm Photodiode (pixel) size 0.9 x 1.45 mm Photodiode Preamp Gain 1E7 V/A Lock-in 0.12 Hz BW, 1E6 Gain
3.2 Laser The laser is a commercial, low-cost solid-state CW Nd-YAG laser, operating in the green, and equipped with on/off 620 Hz modulation. The laser modulation is obtained by means of a 620Hz quartz oscillator provided with two outputs: the first output drives the laser, while the second is the reference signal to the Lock-in. The delay between the two outputs is adjusted in order to nullify the lag between the TTL modulation of the laser and the effective modulation of the laser emission.
www.intechopen.com
A Photodiode-Based, Low-Cost Telemetric- Lidar for the Continuous Monitoring of Urban Particulate Matter
123
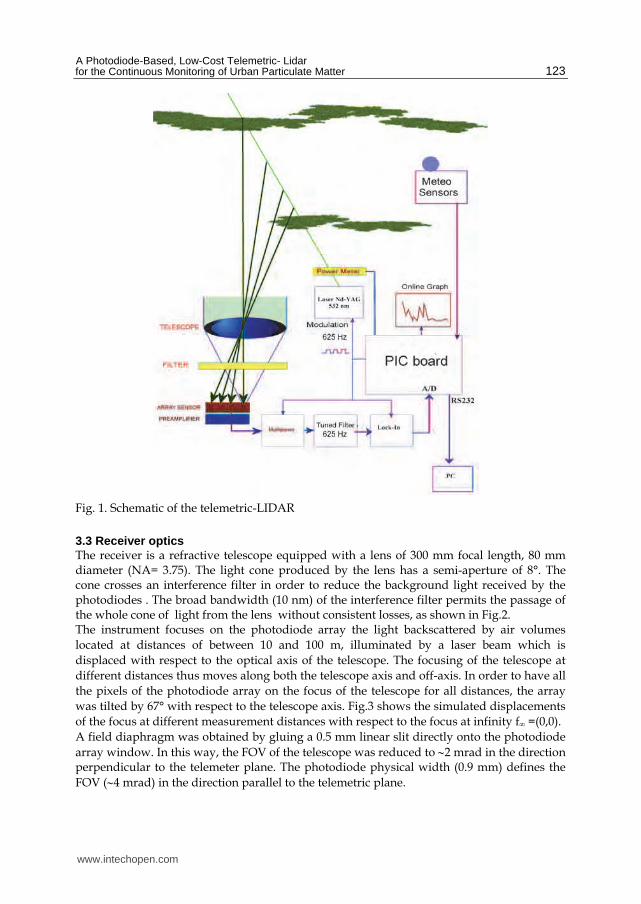
Fig. 1. Schematic of the telemetric-LIDAR
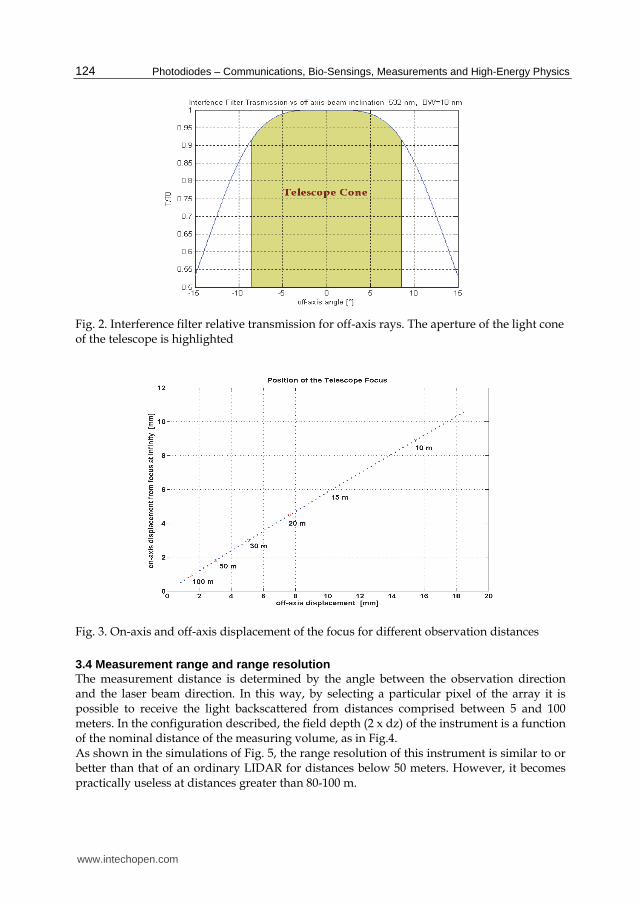
3.3 Receiver optics The receiver is a refractive telescope equipped with a lens of 300 mm focal length, 80 mm diameter (NA= 3.75). The light cone produced by the lens has a semi-aperture of 8°. The cone crosses an interference filter in order to reduce the background light received by the photodiodes . The broad bandwidth (10 nm) of the interference filter permits the passage of the whole cone of light from the lens without consistent losses, as shown in Fig.2. The instrument focuses on the photodiode array the light backscattered by air volumes
located at distances of between 10 and 100 m, illuminated by a laser beam which is
displaced with respect to the optical axis of the telescope. The focusing of the telescope at
different distances thus moves along both the telescope axis and off-axis. In order to have all
the pixels of the photodiode array on the focus of the telescope for all distances, the array
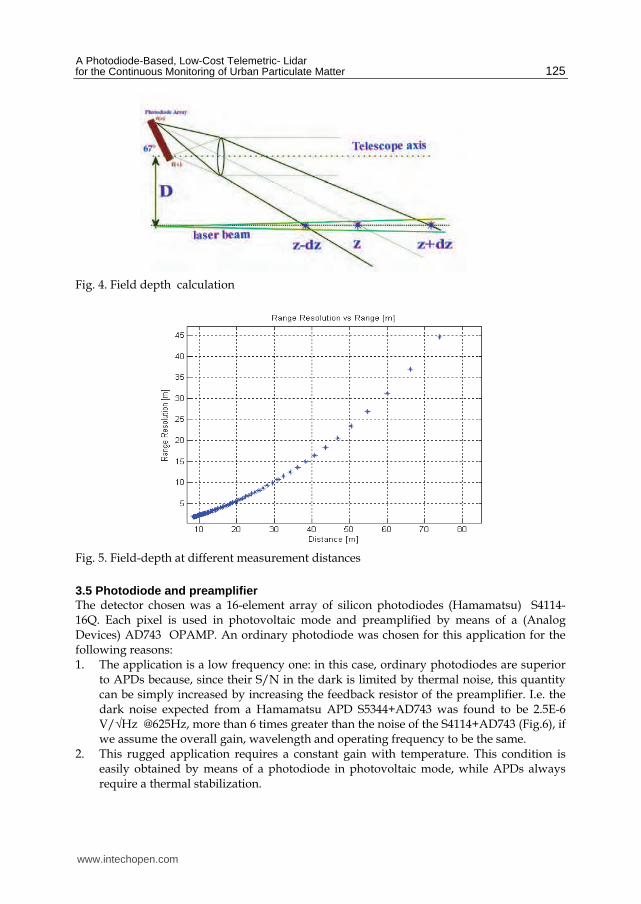
was tilted by 67° with respect to the telescope axis. Fig.3 shows the simulated displacements
of the focus at different measurement distances with respect to the focus at infinity f∞ =(0,0).
A field diaphragm was obtained by gluing a 0.5 mm linear slit directly onto the photodiode
array window. In this way, the FOV of the telescope was reduced to 2 mrad in the direction perpendicular to the telemeter plane. The photodiode physical width (0.9 mm) defines the
FOV (4 mrad) in the direction parallel to the telemetric plane.
www.intechopen.com
Photodiodes – Communications, Bio-Sensings, Measurements and High-Energy Physics
124
Fig. 2. Interference filter relative transmission for off-axis rays. The aperture of the light cone of the telescope is highlighted
Fig. 3. On-axis and off-axis displacement of the focus for different observation distances
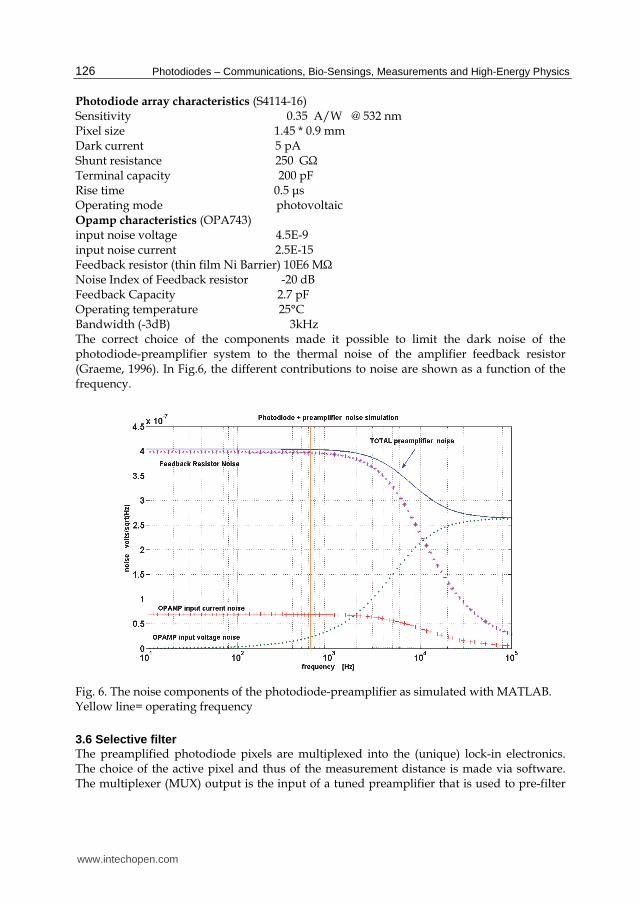
3.4 Measurement range and range resolution The measurement distance is determined by the angle between the observation direction and the laser beam direction. In this way, by selecting a particular pixel of the array it is possible to receive the light backscattered from distances comprised between 5 and 100 meters. In the configuration described, the field depth (2 x dz) of the instrument is a function of the nominal distance of the measuring volume, as in Fig.4. As shown in the simulations of Fig. 5, the range resolution of this instrument is similar to or better than that of an ordinary LIDAR for distances below 50 meters. However, it becomes practically useless at distances greater than 80-100 m.
www.intechopen.com
A Photodiode-Based, Low-Cost Telemetric- Lidar for the Continuous Monitoring of Urban Particulate Matter
125
Fig. 4. Field depth calculation
Fig. 5. Field-depth at different measurement distances
3.5 Photodiode and preamplifier The detector chosen was a 16-element array of silicon photodiodes (Hamamatsu) S4114-16Q. Each pixel is used in photovoltaic mode and preamplified by means of a (Analog Devices) AD743 OPAMP. An ordinary photodiode was chosen for this application for the following reasons: 1. The application is a low frequency one: in this case, ordinary photodiodes are superior
to APDs because, since their S/N in the dark is limited by thermal noise, this quantity can be simply increased by increasing the feedback resistor of the preamplifier. I.e. the dark noise expected from a Hamamatsu APD S5344+AD743 was found to be 2.5E-6 V/√Hz @625Hz, more than 6 times greater than the noise of the S4114+AD743 (Fig.6), if we assume the overall gain, wavelength and operating frequency to be the same.
2. This rugged application requires a constant gain with temperature. This condition is easily obtained by means of a photodiode in photovoltaic mode, while APDs always require a thermal stabilization.
www.intechopen.com
Photodiodes – Communications, Bio-Sensings, Measurements and High-Energy Physics
126
Photodiode array characteristics (S4114-16) Sensitivity 0.35 A/W @ 532 nm Pixel size 1.45 * 0.9 mm Dark current 5 pA Shunt resistance 250 GΩ Terminal capacity 200 pF Rise time 0.5 μs Operating mode photovoltaic Opamp characteristics (OPA743) input noise voltage 4.5E-9 input noise current 2.5E-15 Feedback resistor (thin film Ni Barrier) 10E6 MΩ Noise Index of Feedback resistor -20 dB Feedback Capacity 2.7 pF Operating temperature 25°C Bandwidth (-3dB) 3kHz The correct choice of the components made it possible to limit the dark noise of the photodiode-preamplifier system to the thermal noise of the amplifier feedback resistor (Graeme, 1996). In Fig.6, the different contributions to noise are shown as a function of the frequency.
Fig. 6. The noise components of the photodiode-preamplifier as simulated with MATLAB. Yellow line= operating frequency
3.6 Selective filter The preamplified photodiode pixels are multiplexed into the (unique) lock-in electronics. The choice of the active pixel and thus of the measurement distance is made via software. The multiplexer (MUX) output is the input of a tuned preamplifier that is used to pre-filter
www.intechopen.com

A Photodiode-Based, Low-Cost Telemetric- Lidar for the Continuous Monitoring of Urban Particulate Matter
127
the signal for the lock-in board. The selective filter, together with the optical filtering provided by the interference filter, contributes to the reduction of the noise received by the system during daylight operation. The selective amplifier, which is based on an OPAMP gyrator (Fig.7), provides a narrow-band pass filtering (2.4 Hz (-3 dB) Bandwidth, Gain=5000) of the signal received, that is centered around the 620 Hz modulation frequency. Thanks to an appropriate choice of the passive components, the adopted circuit (Fig.7) was found to be stable with temperature, with a drift of the resonant frequency of less than 0.065 Hz/°C in the temperature range of -25°/+50°C, and a corresponding gain drift of less than 0.05 dB/°C. The phase shift is practically zero in the same temperature range.
Fig. 7. Schematic of the selective amplifier
3.7 Lock-in An analog lock-in (Horowitz, 1989), tuned to the modulation frequency (620 Hz), is used to convert the AC signal in phase with the modulating signal into a DC voltage. This lock-in is based on a AD630 modulator-demodulator chip followed by a Sallen-Key, II order active low-pass filter with 0.1 Hz bandwidth and Gain=10. The active filter is followed by a final amplifier with gain=10, and low-pass cutoff of 1 Hz. The final output of the lock-in circuitry is limited to 0-5V in order to match the voltage span of the microcontroller AD inputs. The step response at the output of the lock-in is shown in Fig.8. It is possible to sample the output 100 msec after the application of the step. The sampling rate of the lock-in output by means of the microcontroller board was thus set at 20 Hz.
3.8 Microcontroller board The microcontroller board, which controls the whole instrument and acquires the telemetric LIDAR signals, is based on a Microchip PIC18F6720, that is programmed in PicBasicPro. The board manages the whole instrument by converting and averaging the lock-in output, and
www.intechopen.com
Photodiodes – Communications, Bio-Sensings, Measurements and High-Energy Physics
128
acquiring meteo and house-keeping data. The board communicates with the PC via RS232, allowing a 20 meters distance between the instrument and the PC. Data are both logged and sent to the remote PC. The same serial line link is used to change the micro controller firmware and to change the measurement settings.
Fig. 8. Step response at the output of the Lock-in
4. Testing the instrument
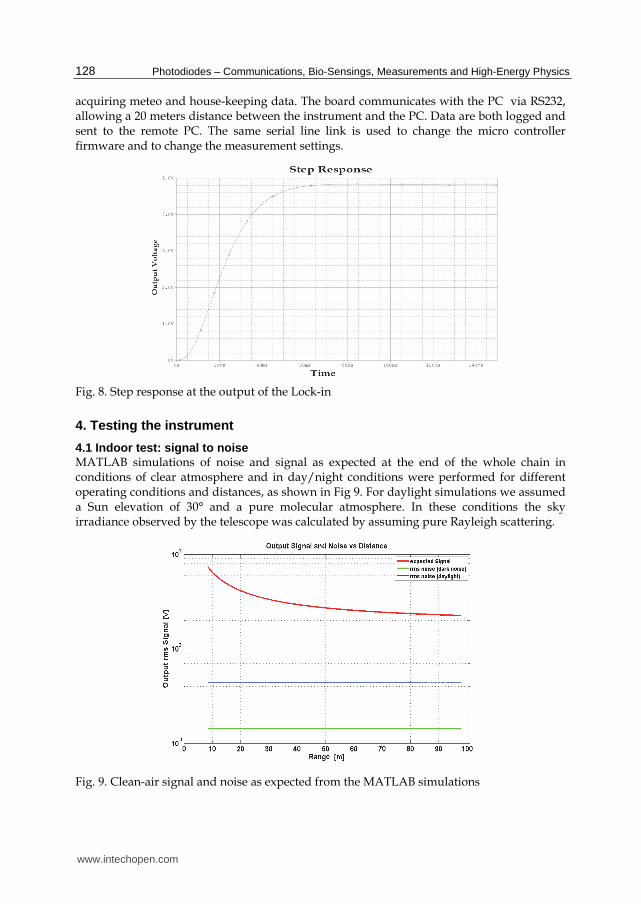
4.1 Indoor test: signal to noise MATLAB simulations of noise and signal as expected at the end of the whole chain in conditions of clear atmosphere and in day/night conditions were performed for different operating conditions and distances, as shown in Fig 9. For daylight simulations we assumed a Sun elevation of 30° and a pure molecular atmosphere. In these conditions the sky irradiance observed by the telescope was calculated by assuming pure Rayleigh scattering.
Fig. 9. Clean-air signal and noise as expected from the MATLAB simulations
www.intechopen.com
A Photodiode-Based, Low-Cost Telemetric- Lidar for the Continuous Monitoring of Urban Particulate Matter
129
In the case of nighttime operation, the dark noise of the system was considered. An output average power of 50mW for the laser source, a transmission of 0.7 for the interference filter and an overall optical efficiency of 0.6 for the rest of the optics were assumed. In the prototype, the measurement of the noise at the output of the complete chain in the
dark was 160 mV rms, close to the simulated dark noise in Fig. 9. The different photodiodes
showed slight differences in terms of dark noise.
From simulations a S/N>4 was found in daylight conditions for any distance. In practice,
when operating the instrument in the atmosphere, a S/N close to 1 was obtained in daylight
conditions at the output of the chain. An empirical integration time of 5 minutes was thus
chosen for operating the instrument in daytime with a S/N>4.
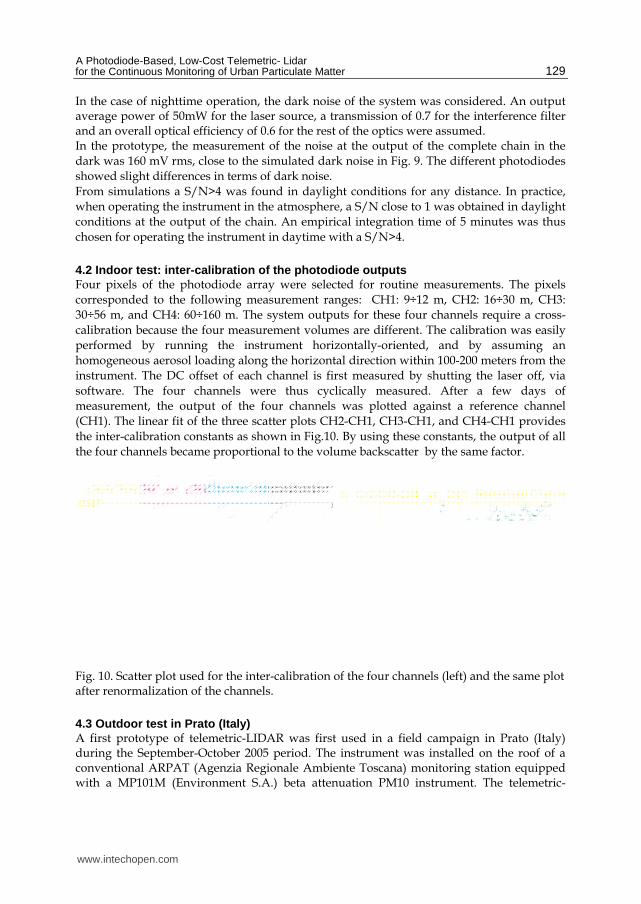
4.2 Indoor test: inter-calibration of the photodiode outputs Four pixels of the photodiode array were selected for routine measurements. The pixels
corresponded to the following measurement ranges: CH1: 9÷12 m, CH2: 16÷30 m, CH3:
30÷56 m, and CH4: 60÷160 m. The system outputs for these four channels require a cross-
calibration because the four measurement volumes are different. The calibration was easily
performed by running the instrument horizontally-oriented, and by assuming an
homogeneous aerosol loading along the horizontal direction within 100-200 meters from the
instrument. The DC offset of each channel is first measured by shutting the laser off, via
software. The four channels were thus cyclically measured. After a few days of
measurement, the output of the four channels was plotted against a reference channel
(CH1). The linear fit of the three scatter plots CH2-CH1, CH3-CH1, and CH4-CH1 provides
the inter-calibration constants as shown in Fig.10. By using these constants, the output of all
the four channels became proportional to the volume backscatter by the same factor.
Fig. 10. Scatter plot used for the inter-calibration of the four channels (left) and the same plot after renormalization of the channels.
4.3 Outdoor test in Prato (Italy) A first prototype of telemetric-LIDAR was first used in a field campaign in Prato (Italy) during the September-October 2005 period. The instrument was installed on the roof of a conventional ARPAT (Agenzia Regionale Ambiente Toscana) monitoring station equipped with a MP101M (Environment S.A.) beta attenuation PM10 instrument. The telemetric-
www.intechopen.com

Photodiodes – Communications, Bio-Sensings, Measurements and High-Energy Physics
130
LIDAR instrument operated 30° above the horizon. Data obtained every 5 minutes for a fixed measurement altitude of 6(±1) meters were compared with the hourly beta-attenuation PM10 data (Fig. 11). The calibration of the telemetric LIDAR output in terms of PM10 was obtained from a linear regression between the hourly-averages of the LIDAR signal and the beta-attenuation data.
Fig. 11. Comparison between LIDAR-derived and β-attenuation PM10 data (Prato, Italy).
Relative humidity is also plotted The comparison of the two time series shows a general agreement even if some peaks are uncorrelated. On 2-5 October rain events occurred, a fact which explains the overestimation of PM in the LIDAR data. LIDAR measured the wet PM, which in this case was larger than the dry PM measured by the MP101M instrument. On the other hand, in the case of high RH the sampling head of the MP101M cut out the large water droplets, thus leading to an underestimate the PM concentration. Furthermore, the beta attenuation instrument is not reliable when used with integration times as short as one hour.
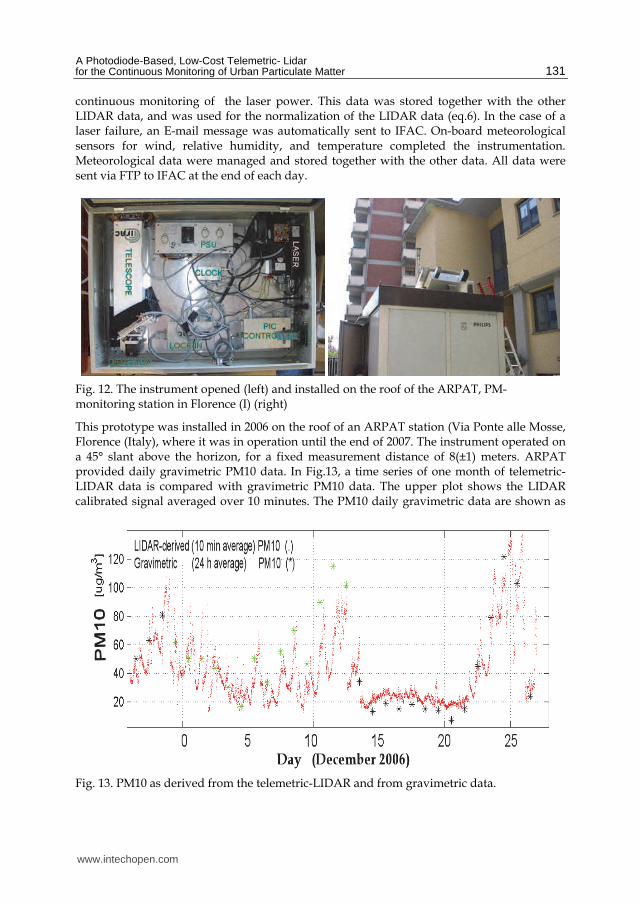
4.4 Outdoor measurements in Florence (Italy) A second, rugged prototype for fully outdoor operation was developed in 2005. In this prototype, the window of the telescope was equipped with two optical sensors that were developed at IFAC CNR: one sensor detected, from inside the box, the dust-cover of the external face of the optical window. This is an important measurement in the urban environment, because sooty/oily particles tend to stick rapidly onto the window, thus increasing the optical losses of the instrument and spoiling the calibration. The other sensor detected dew forming on the optical window in the case of foggy weather. Data from both sensors were managed and stored together with the other data. The Telemetric LIDAR was equipped with a GPS-GSRM-GPS module for the remote transmission of data and alarms. In the case of a dirty or wet window, an alarm message was automatically sent to IFAC via E-mail and SMS. The new prototype was also equipped with a laser power sensor for the
www.intechopen.com
A Photodiode-Based, Low-Cost Telemetric- Lidar for the Continuous Monitoring of Urban Particulate Matter
131
continuous monitoring of the laser power. This data was stored together with the other LIDAR data, and was used for the normalization of the LIDAR data (eq.6). In the case of a laser failure, an E-mail message was automatically sent to IFAC. On-board meteorological sensors for wind, relative humidity, and temperature completed the instrumentation. Meteorological data were managed and stored together with the other data. All data were sent via FTP to IFAC at the end of each day.
Fig. 12. The instrument opened (left) and installed on the roof of the ARPAT, PM-monitoring station in Florence (I) (right)
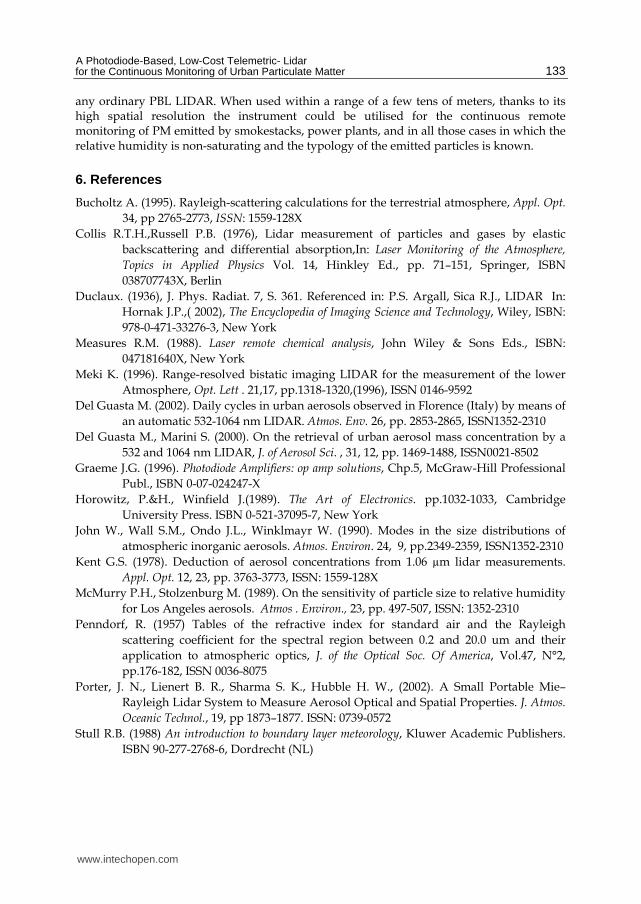
This prototype was installed in 2006 on the roof of an ARPAT station (Via Ponte alle Mosse, Florence (Italy), where it was in operation until the end of 2007. The instrument operated on a 45° slant above the horizon, for a fixed measurement distance of 8(±1) meters. ARPAT provided daily gravimetric PM10 data. In Fig.13, a time series of one month of telemetric-LIDAR data is compared with gravimetric PM10 data. The upper plot shows the LIDAR calibrated signal averaged over 10 minutes. The PM10 daily gravimetric data are shown as
Fig. 13. PM10 as derived from the telemetric-LIDAR and from gravimetric data.
www.intechopen.com

Photodiodes – Communications, Bio-Sensings, Measurements and High-Energy Physics
132
symbols. The ARPAT monitoring station collected PM10 and PM2.5, alternatively, for 15-day periods. Black stars indicate genuine PM10 measurements, while green stars indicate PM10 values calculated from PM2.5 data by applying a constant, empirical factor of 1.4, as suggested by ARPAT. Until December 14 the diurnal cycle of PM, related to traffic, is evident in the telemetric-LIDAR data. During the 14-21 December period, northern winds cleaned-up the PBL (Planetary Boundary Layer) (Stull, 1988) and prevented the formation of inversion layers, thus reducing the PM10 and cancelling its diurnal cycle. During the 22-26 December period, a strong thermal inversion occurred, which led to high PM10 concentrations. The comparison between the LIDAR-derived and gravimetric data was unfortunately undermined by the different time resolutions of the two types of measurements. The LIDAR information had to be degraded to 24-hour averages in order to compare it with the daily gravimetric data, the only official information available in many Italian towns. The said comparison was used to obtain an empirical system calibration, as shown in Fig.14.
Fig. 14. Correlation between LIDAR-derived and gravimetric PM10 values. 24-hour averages. The Pearson linear correlation coefficient is R= 0.89, p<0.001. The experimental calibration factor for the telemetric-LIDAR is reported.
5. Conclusions
We described an application for a Silicon photodiode array consisting in a low-cost, rugged instrument for the continuous remote monitoring of urban particulate matter (PM). The experimental tests confirmed the optical and electronic simulations, which suggested the possibility of measuring PM in the urban environment 24 hours/day within a range of several tens of meters, with a time resolution of 5-10 minutes. The instrument is a candidate tool for complementing ordinary gravimetric PM10 measurements, with the advantage of offering a high temporal resolution and the absence of pumps or other moving parts. The instrument was found to be suitable for unattended operation and much less expensive than
www.intechopen.com
A Photodiode-Based, Low-Cost Telemetric- Lidar for the Continuous Monitoring of Urban Particulate Matter
133
any ordinary PBL LIDAR. When used within a range of a few tens of meters, thanks to its high spatial resolution the instrument could be utilised for the continuous remote monitoring of PM emitted by smokestacks, power plants, and in all those cases in which the relative humidity is non-saturating and the typology of the emitted particles is known.
6. References
Bucholtz A. (1995). Rayleigh-scattering calculations for the terrestrial atmosphere, Appl. Opt.
34, pp 2765-2773, ISSN: 1559-128X
Collis R.T.H.,Russell P.B. (1976), Lidar measurement of particles and gases by elastic
backscattering and differential absorption,In: Laser Monitoring of the Atmosphere,
Topics in Applied Physics Vol. 14, Hinkley Ed., pp. 71–151, Springer, ISBN
038707743X, Berlin
Duclaux. (1936), J. Phys. Radiat. 7, S. 361. Referenced in: P.S. Argall, Sica R.J., LIDAR In:
Hornak J.P.,( 2002), The Encyclopedia of Imaging Science and Technology, Wiley, ISBN:
978-0-471-33276-3, New York
Measures R.M. (1988). Laser remote chemical analysis, John Wiley & Sons Eds., ISBN:
047181640X, New York
Meki K. (1996). Range-resolved bistatic imaging LIDAR for the measurement of the lower
Atmosphere, Opt. Lett . 21,17, pp.1318-1320,(1996), ISSN 0146-9592
Del Guasta M. (2002). Daily cycles in urban aerosols observed in Florence (Italy) by means of
an automatic 532-1064 nm LIDAR. Atmos. Env. 26, pp. 2853-2865, ISSN1352-2310
Del Guasta M., Marini S. (2000). On the retrieval of urban aerosol mass concentration by a
532 and 1064 nm LIDAR, J. of Aerosol Sci. , 31, 12, pp. 1469-1488, ISSN0021-8502
Graeme J.G. (1996). Photodiode Amplifiers: op amp solutions, Chp.5, McGraw-Hill Professional
Publ., ISBN 0-07-024247-X
Horowitz, P.&H., Winfield J.(1989). The Art of Electronics. pp.1032-1033, Cambridge
University Press. ISBN 0-521-37095-7, New York
John W., Wall S.M., Ondo J.L., Winklmayr W. (1990). Modes in the size distributions of
atmospheric inorganic aerosols. Atmos. Environ. 24, 9, pp.2349-2359, ISSN1352-2310
Kent G.S. (1978). Deduction of aerosol concentrations from 1.06 µm lidar measurements.
Appl. Opt. 12, 23, pp. 3763-3773, ISSN: 1559-128X
McMurry P.H., Stolzenburg M. (1989). On the sensitivity of particle size to relative humidity
for Los Angeles aerosols. Atmos . Environ., 23, pp. 497-507, ISSN: 1352-2310
Penndorf, R. (1957) Tables of the refractive index for standard air and the Rayleigh
scattering coefficient for the spectral region between 0.2 and 20.0 um and their
application to atmospheric optics, J. of the Optical Soc. Of America, Vol.47, N°2,
pp.176-182, ISSN 0036-8075
Porter, J. N., Lienert B. R., Sharma S. K., Hubble H. W., (2002). A Small Portable Mie–
Rayleigh Lidar System to Measure Aerosol Optical and Spatial Properties. J. Atmos.
Oceanic Technol., 19, pp 1873–1877. ISSN: 0739-0572
Stull R.B. (1988) An introduction to boundary layer meteorology, Kluwer Academic Publishers.
ISBN 90-277-2768-6, Dordrecht (NL)
www.intechopen.com
Photodiodes – Communications, Bio-Sensings, Measurements and High-Energy Physics
134
Tatsumi K. Tadashi I . (1999). Characteristics of Lidar Signal Using Silicon Avalanche
Photodiode Single Photon-Counting Module. Rev. of Laser Engin.27;3;pp 190-193,
ISSN 0387-0200
Van de Hulst H.C., (1998). Light scattering by small particles, Wiley & sons Inc., ISBN
0471293407, New York
www.intechopen.com
Photodiodes - Communications, Bio-Sensings, Measurements andHigh-Energy PhysicsEdited by Associate Professor Jin-Wei Shi
ISBN 978-953-307-277-7Hard cover, 284 pagesPublisher InTechPublished online 06, September, 2011Published in print edition September, 2011
InTech EuropeUniversity Campus STeP Ri Slavka Krautzeka 83/A 51000 Rijeka, Croatia Phone: +385 (51) 770 447 Fax: +385 (51) 686 166www.intechopen.com
InTech ChinaUnit 405, Office Block, Hotel Equatorial Shanghai No.65, Yan An Road (West), Shanghai, 200040, China
Phone: +86-21-62489820 Fax: +86-21-62489821
This book describes different kinds of photodiodes for applications in high-speed data communication,biomedical sensing, high-speed measurement, UV-light detection, and high energy physics. The photodiodesdiscussed are composed of several different semiconductor materials, such as InP, SiC, and Si, which coveran extremely wide optical wavelength regime ranging from infrared light to X-ray, making the suitable fordiversified applications. Several interesting and unique topics were discussed including: the operation of high-speed photodiodes at low-temperature for super-conducting electronics, photodiodes for bio-medical imaging,single photon detection, photodiodes for the applications in nuclear physics, and for UV-light detection.
How to referenceIn order to correctly reference this scholarly work, feel free to copy and paste the following:
Massimo Del Guasta, Massimo Baldi and Francesco Castagnoli (2011). A Photodiode-Based, Low-CostTelemetric- Lidar for the Continuous Monitoring of Urban Particulate Matter, Photodiodes - Communications,Bio-Sensings, Measurements and High-Energy Physics, Associate Professor Jin-Wei Shi (Ed.), ISBN: 978-953-307-277-7, InTech, Available from: http://www.intechopen.com/books/photodiodes-communications-bio-sensings-measurements-and-high-energy-physics/a-photodiode-based-low-cost-telemetric-lidar-for-the-continuous-monitoring-of-urban-particulate-matt

© 2011 The Author(s). Licensee IntechOpen. This chapter is distributedunder the terms of the Creative Commons Attribution-NonCommercial-ShareAlike-3.0 License, which permits use, distribution and reproduction fornon-commercial purposes, provided the original is properly cited andderivative works building on this content are distributed under the samelicense.