a performance tuning methodology: from the system...
TRANSCRIPT
Software & Services Group, Developer Products Division
Copyright © 2014, Intel Corporation. All rights reserved.
*Other brands and names are the property of their respective owners.
A Performance Tuning Methodology: From the System Down to the Hardware - Introduction
Jackson Marusarz
Intel Corporation
ATPESC 2014
1
Software & Services Group, Developer Products Division
Copyright © 2014, Intel Corporation. All rights reserved.
*Other brands and names are the property of their respective owners.
Why performance profiling?
2
Project performance tuning for:
• Reducing direct compute time costs
• Decreasing indirect costs
• Better user/customer experience
If you are not in that business, don’t bother
Software & Services Group, Developer Products Division
Copyright © 2014, Intel Corporation. All rights reserved.
*Other brands and names are the property of their respective owners.
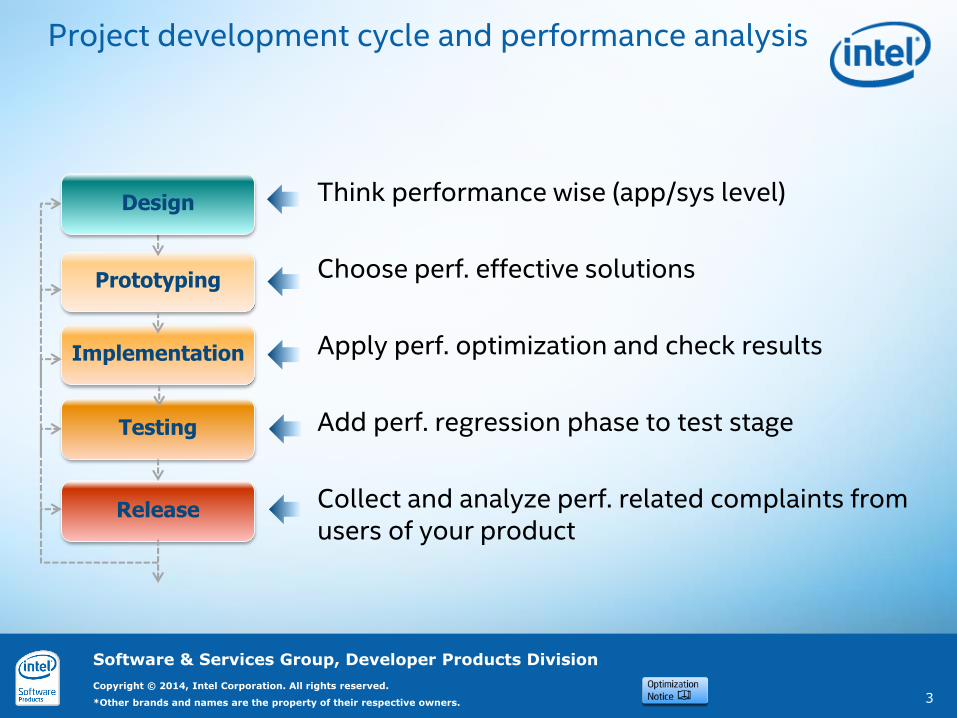
Release
Testing
Prototyping
Think performance wise (app/sys level)
Choose perf. effective solutions
Apply perf. optimization and check results
Add perf. regression phase to test stage
Collect and analyze perf. related complaints from users of your product
3
Project development cycle and performance analysis
Implementation
Design
Software & Services Group, Developer Products Division
Copyright © 2014, Intel Corporation. All rights reserved.
*Other brands and names are the property of their respective owners.
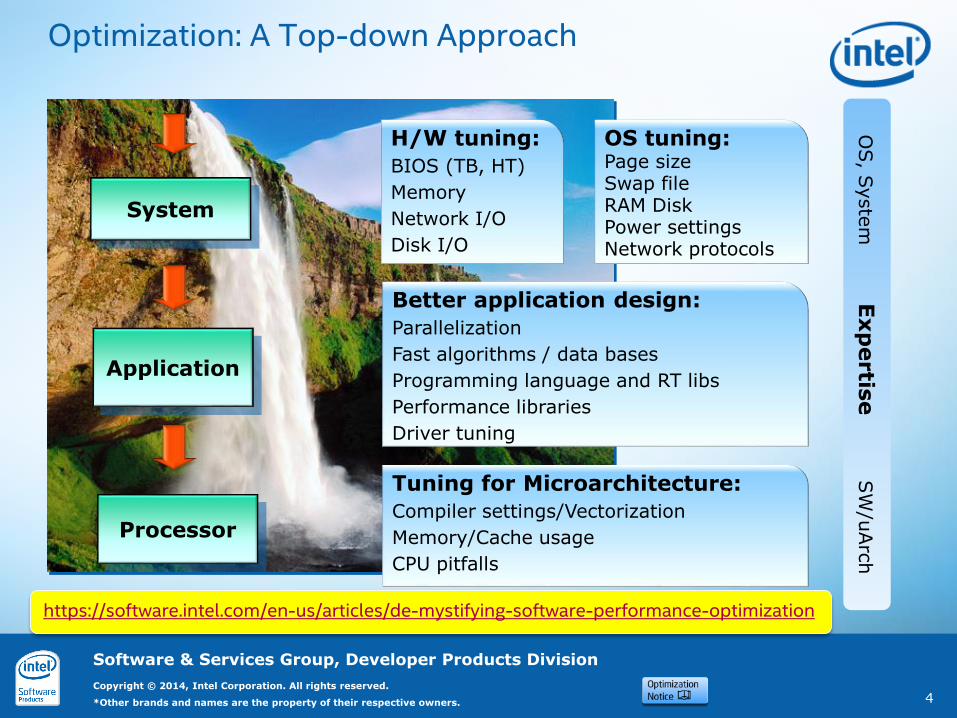
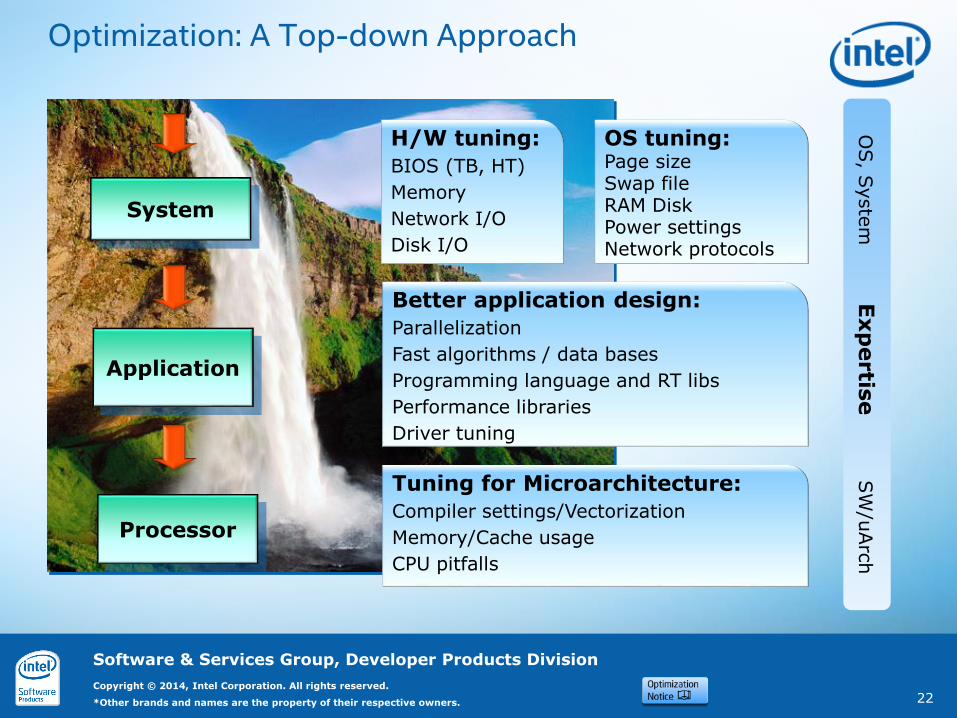
Optimization: A Top-down Approach
4
System
Application
Processor
H/W tuning:
BIOS (TB, HT)
Memory
Network I/O
Disk I/O
OS tuning:Page sizeSwap fileRAM DiskPower settingsNetwork protocols
Better application design:
Parallelization
Fast algorithms / data bases
Programming language and RT libs
Performance libraries
Driver tuning
Tuning for Microarchitecture:
Compiler settings/Vectorization
Memory/Cache usage
CPU pitfalls
OS, S
yste
m E
xp
ertis
eSW
/uArc
h
https://software.intel.com/en-us/articles/de-mystifying-software-performance-optimization
Software & Services Group, Developer Products Division
Copyright © 2014, Intel Corporation. All rights reserved.
*Other brands and names are the property of their respective owners.
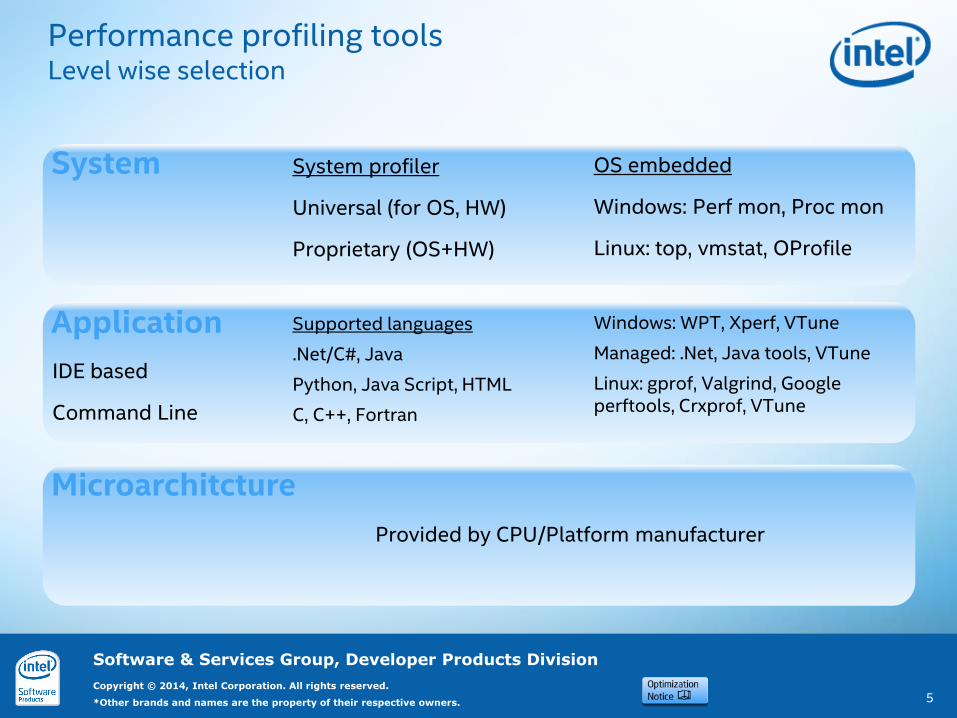
Performance profiling toolsLevel wise selection
5
System OS embedded
Windows: Perf mon, Proc mon
Linux: top, vmstat, OProfile
System profiler
Universal (for OS, HW)
Proprietary (OS+HW)
Application
IDE based
Command Line
Supported languages
.Net/C#, Java
Python, Java Script, HTML
C, C++, Fortran
Windows: WPT, Xperf, VTune
Managed: .Net, Java tools, VTune
Linux: gprof, Valgrind, Google perftools, Crxprof, VTune
Microarchitcture
Provided by CPU/Platform manufacturer
Software & Services Group, Developer Products Division
Copyright © 2014, Intel Corporation. All rights reserved.
*Other brands and names are the property of their respective owners.
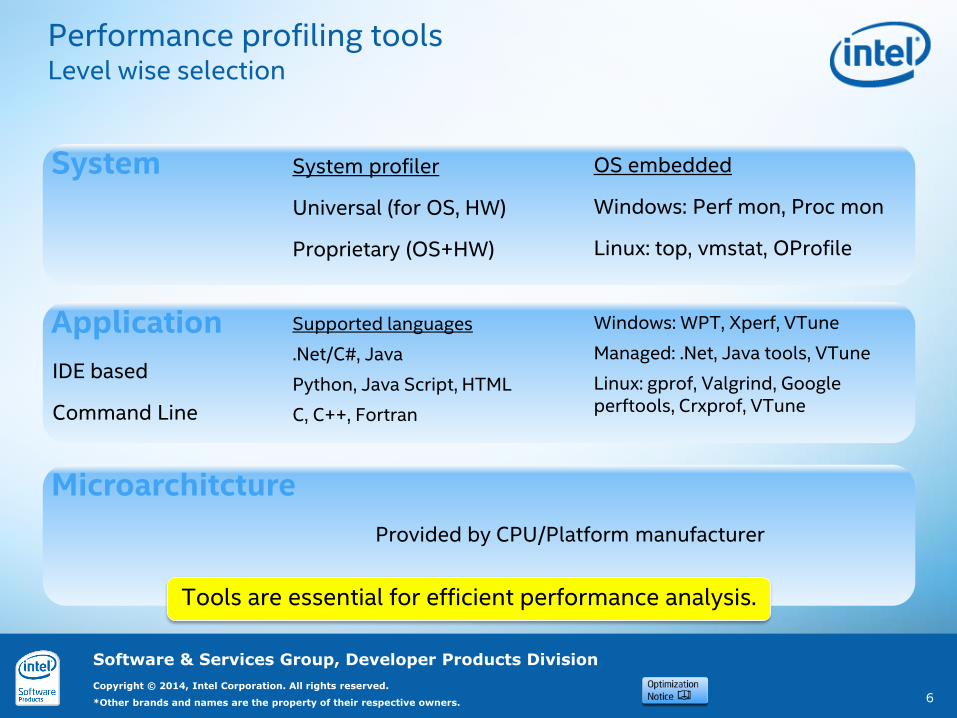
Performance profiling toolsLevel wise selection
6
System OS embedded
Windows: Perf mon, Proc mon
Linux: top, vmstat, OProfile
System profiler
Universal (for OS, HW)
Proprietary (OS+HW)
Application
IDE based
Command Line
Supported languages
.Net/C#, Java
Python, Java Script, HTML
C, C++, Fortran
Windows: WPT, Xperf, VTune
Managed: .Net, Java tools, VTune
Linux: gprof, Valgrind, Google perftools, Crxprof, VTune
Microarchitcture
Provided by CPU/Platform manufacturer
Tools are essential for efficient performance analysis.

Software & Services Group, Developer Products Division
Copyright © 2014, Intel Corporation. All rights reserved.
*Other brands and names are the property of their respective owners.
Optimization: A Top-down Approach
7
System
H/W tuning:
BIOS (TB, HT)
Memory
Network I/O
Disk I/O
OS tuning:Page sizeSwap fileRAM DiskPower settingsNetwork protocols
OS, S
yste
m

Software & Services Group, Developer Products Division
Copyright © 2014, Intel Corporation. All rights reserved.
*Other brands and names are the property of their respective owners.
System Tuning
8
Who: System Administrators, Performance Engineers, Machine Owners, etc…
How:• Benchmarks
• Stream: www.cs.virginia.edu/stream/• Numerous FLOPS benchmarks• Network/MPI Benchmarks: www.intel.com/go/imb• <insert your favorite here>
• Tools• vmstat, top, sysprof, iostat, sar, Task Manager, etc…• Many vendor/platform specific tools
• Fixes• Upgrade Hardware - $$$• Check BIOS and OS configurations
• Prefetchers, NUMA, Memory Configuration, Power Management, SMT
Software & Services Group, Developer Products Division
Copyright © 2014, Intel Corporation. All rights reserved.
*Other brands and names are the property of their respective owners.
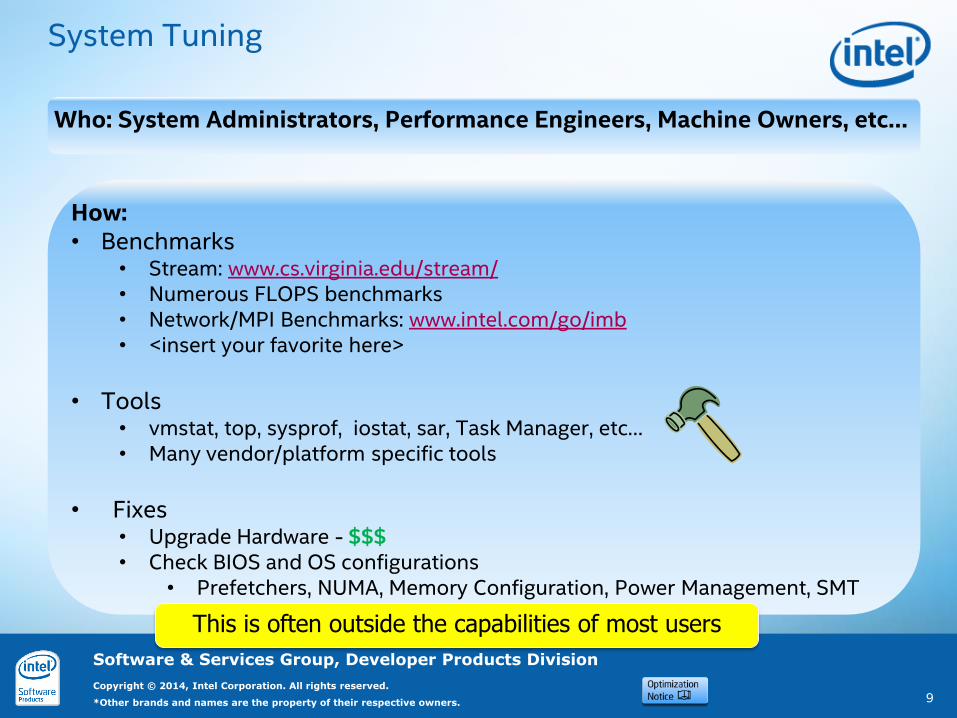
System Tuning
9
Who: System Administrators, Performance Engineers, Machine Owners, etc…
How:• Benchmarks
• Stream: www.cs.virginia.edu/stream/• Numerous FLOPS benchmarks• Network/MPI Benchmarks: www.intel.com/go/imb• <insert your favorite here>
• Tools• vmstat, top, sysprof, iostat, sar, Task Manager, etc…• Many vendor/platform specific tools
• Fixes• Upgrade Hardware - $$$• Check BIOS and OS configurations
• Prefetchers, NUMA, Memory Configuration, Power Management, SMT
This is often outside the capabilities of most users
Software & Services Group, Developer Products Division
Copyright © 2014, Intel Corporation. All rights reserved.
*Other brands and names are the property of their respective owners.
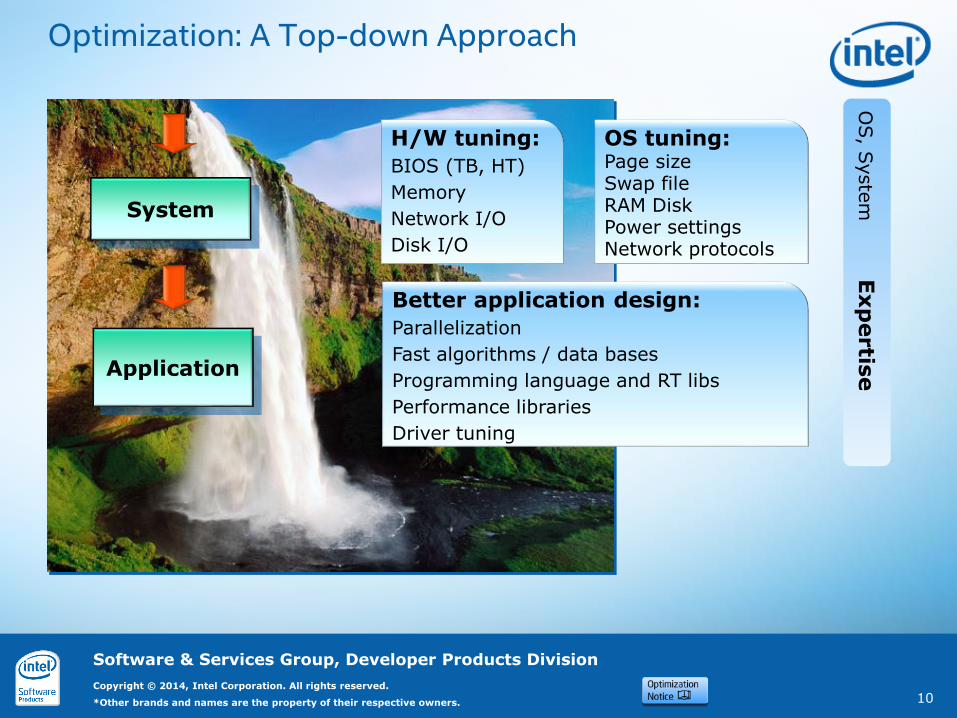
Optimization: A Top-down Approach
10
System
Application
H/W tuning:
BIOS (TB, HT)
Memory
Network I/O
Disk I/O
OS tuning:Page sizeSwap fileRAM DiskPower settingsNetwork protocols
Better application design:
Parallelization
Fast algorithms / data bases
Programming language and RT libs
Performance libraries
Driver tuning
OS, S
yste
m E
xp
ertis
e

Software & Services Group, Developer Products Division
Copyright © 2014, Intel Corporation. All rights reserved.
*Other brands and names are the property of their respective owners.
Application Tuning
11
Who: Software Developers, Performance Engineers, Domain Experts
How:• Workload selection
• Repeatable results• Steady state
• Define Metrics and Collect Baseline• Wall-clock time, FLOPS, FPS • <insert your metric here>
• Identify Hotspots• Focus effort where it counts• Use Tools
• Determine inefficiencies• Is there parallelism?• Are you memory bound?• Will better algorithms or programming languages help?
This step often requires some knowledge of the application and its algorithms
Software & Services Group, Developer Products Division
Copyright © 2014, Intel Corporation. All rights reserved.
*Other brands and names are the property of their respective owners.
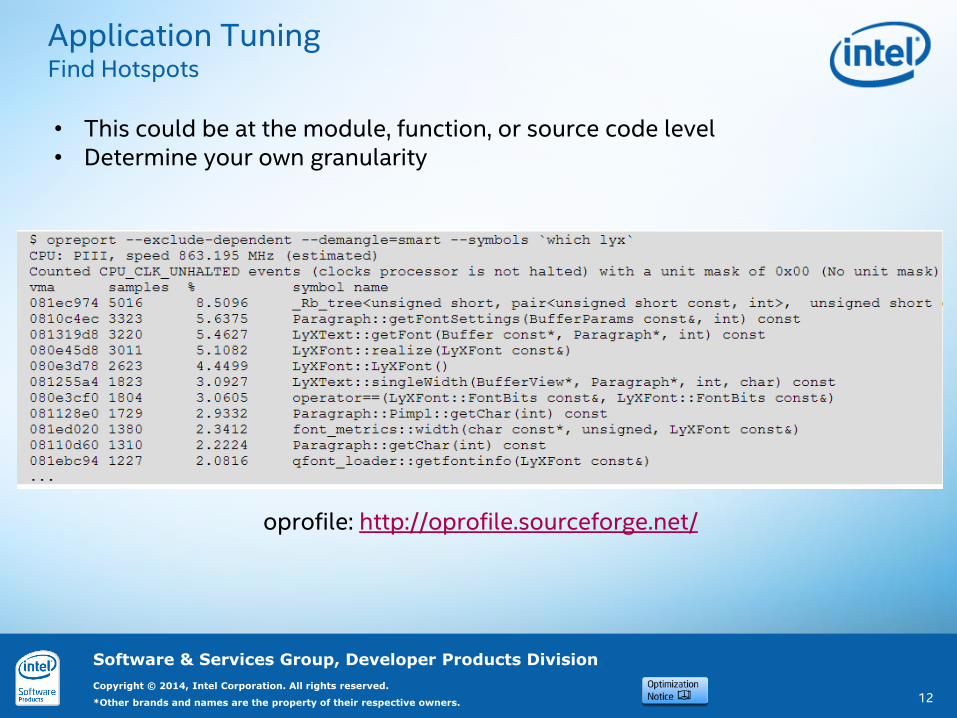
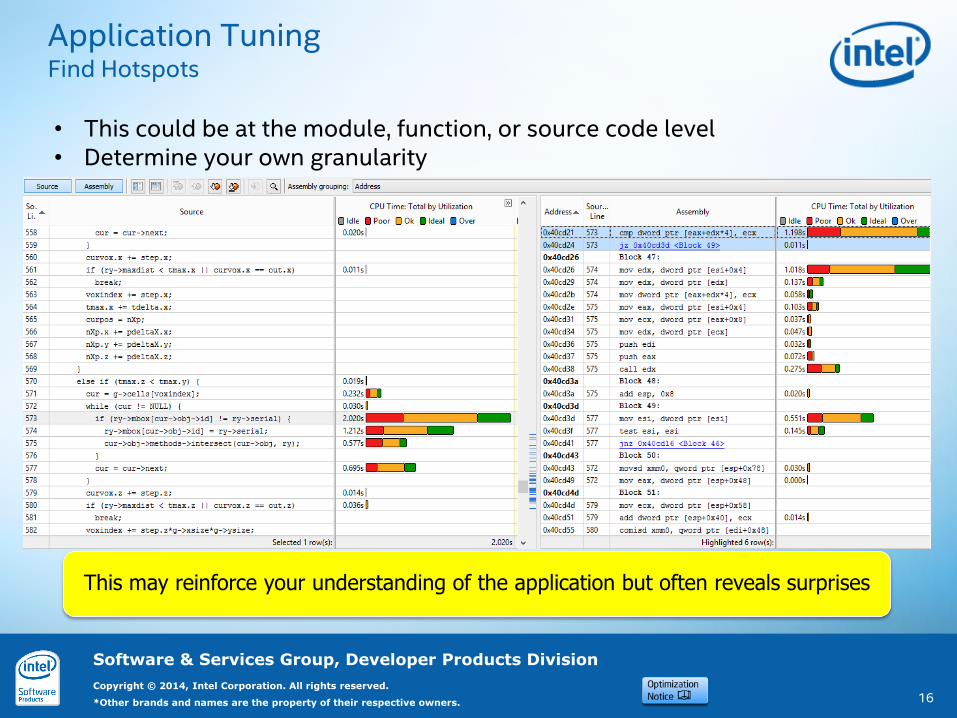
Application TuningFind Hotspots
12
• This could be at the module, function, or source code level• Determine your own granularity
oprofile: http://oprofile.sourceforge.net/
Software & Services Group, Developer Products Division
Copyright © 2014, Intel Corporation. All rights reserved.
*Other brands and names are the property of their respective owners.
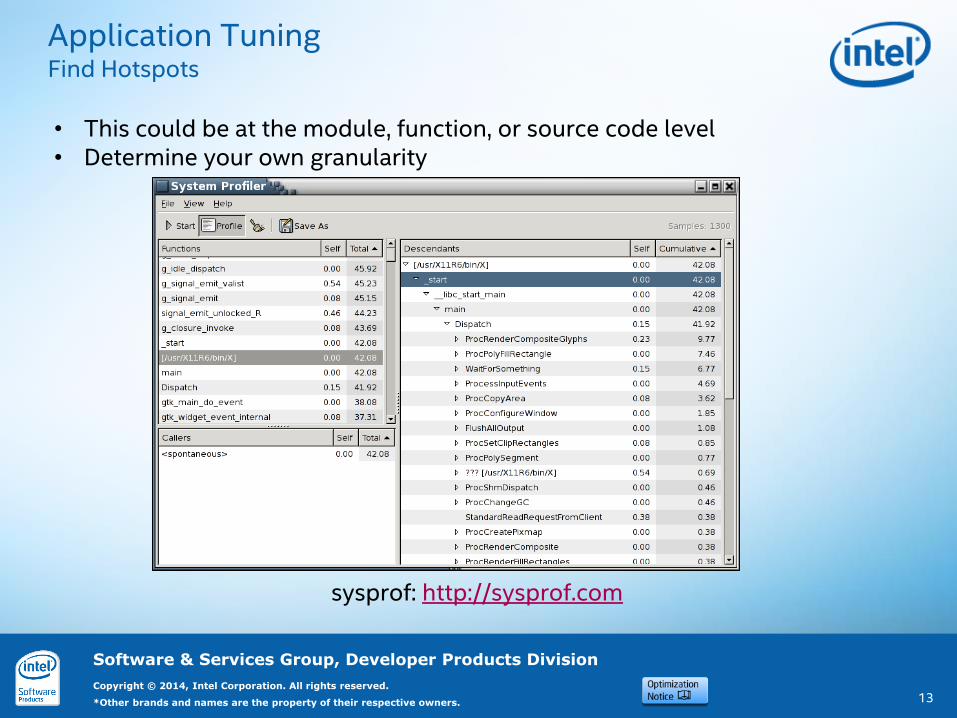
Application TuningFind Hotspots
13
• This could be at the module, function, or source code level• Determine your own granularity
sysprof: http://sysprof.com
Software & Services Group, Developer Products Division
Copyright © 2014, Intel Corporation. All rights reserved.
*Other brands and names are the property of their respective owners.
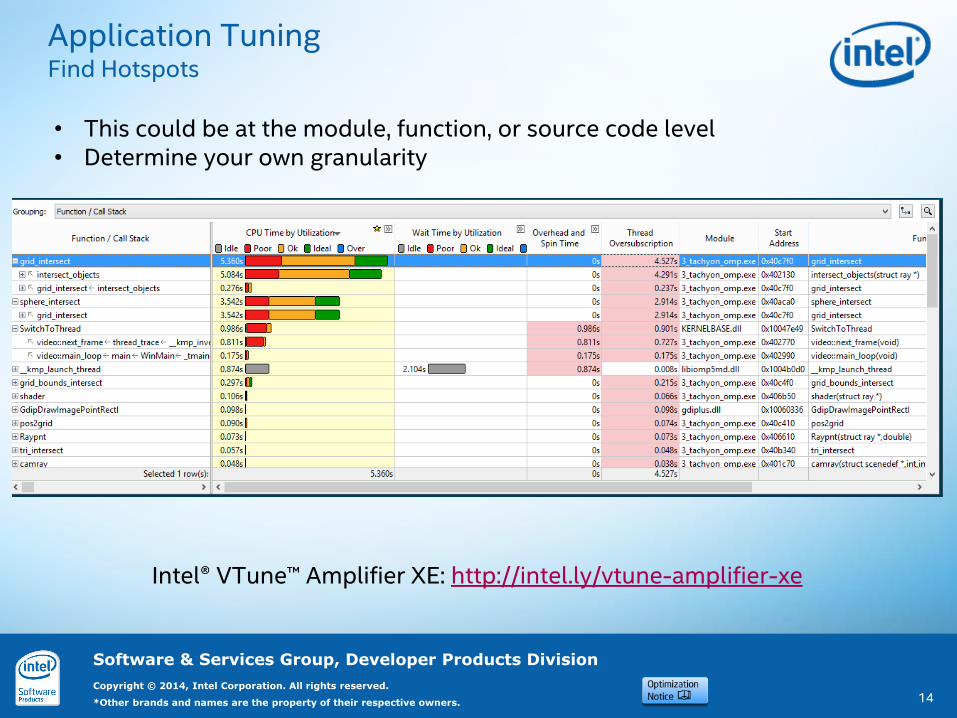
Application TuningFind Hotspots
14
• This could be at the module, function, or source code level• Determine your own granularity
Intel® VTune™ Amplifier XE: http://intel.ly/vtune-amplifier-xe
Software & Services Group, Developer Products Division
Copyright © 2014, Intel Corporation. All rights reserved.
*Other brands and names are the property of their respective owners.
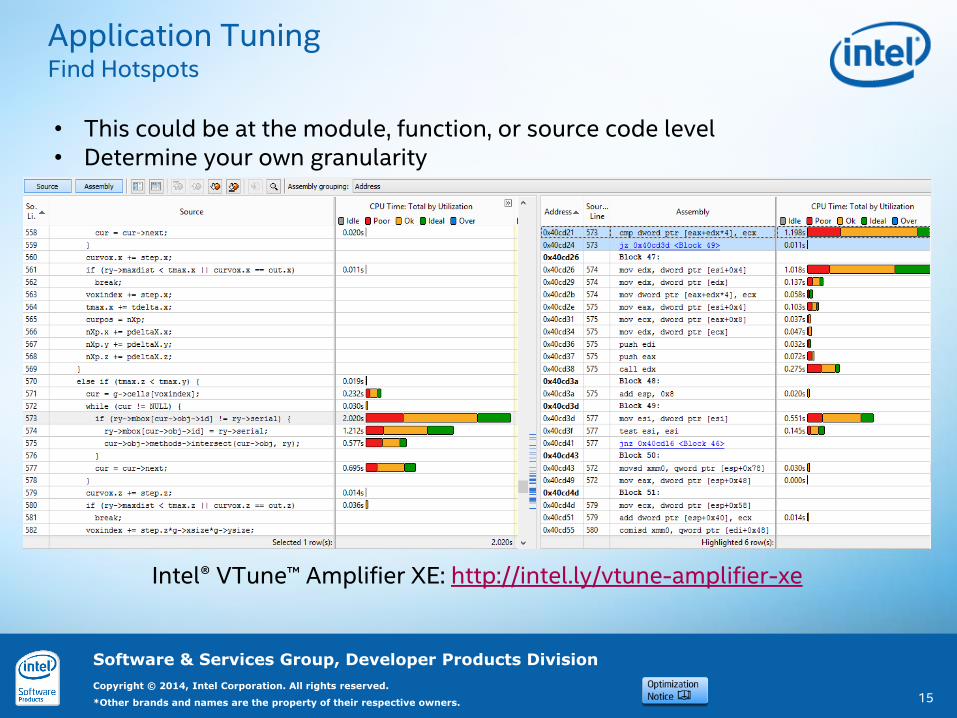
Application TuningFind Hotspots
15
• This could be at the module, function, or source code level• Determine your own granularity
Intel® VTune™ Amplifier XE: http://intel.ly/vtune-amplifier-xe
Software & Services Group, Developer Products Division
Copyright © 2014, Intel Corporation. All rights reserved.
*Other brands and names are the property of their respective owners.
Application TuningFind Hotspots
16
• This could be at the module, function, or source code level• Determine your own granularity
Intel® VTune™ Amplifier XE: http://intel.ly/vtune-amplifier-xeThis may reinforce your understanding of the application but often reveals surprises
Software & Services Group, Developer Products Division
Copyright © 2014, Intel Corporation. All rights reserved.
*Other brands and names are the property of their respective owners.
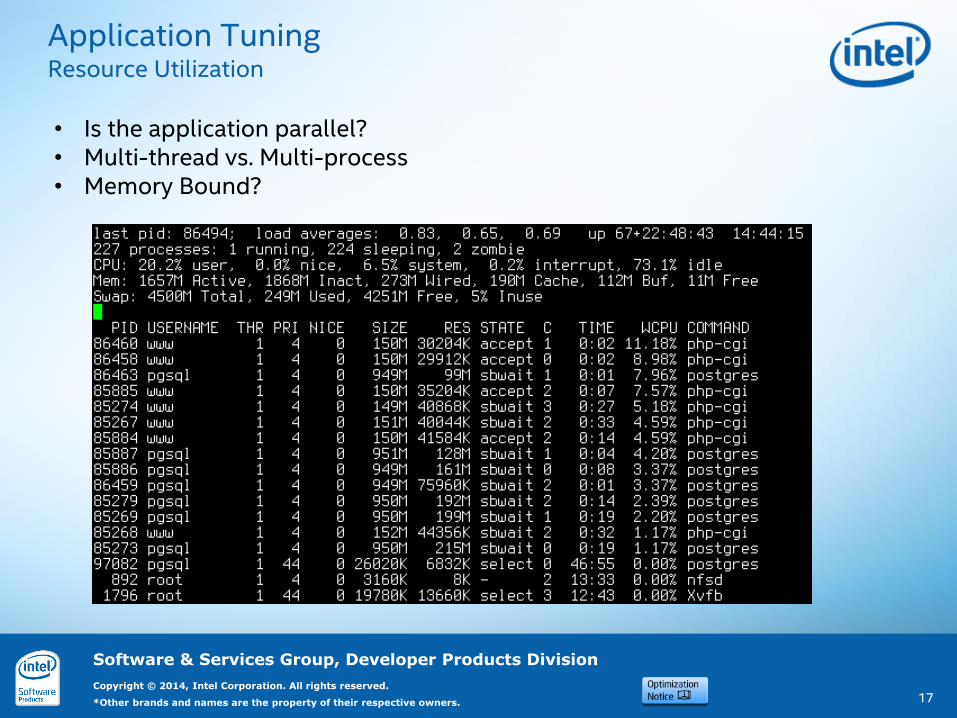
Application TuningResource Utilization
17
• Is the application parallel? • Multi-thread vs. Multi-process• Memory Bound?

Software & Services Group, Developer Products Division
Copyright © 2014, Intel Corporation. All rights reserved.
*Other brands and names are the property of their respective owners.
Application TuningResource Utilization
18
• Is the application parallel?
Software & Services Group, Developer Products Division
Copyright © 2014, Intel Corporation. All rights reserved.
*Other brands and names are the property of their respective owners.
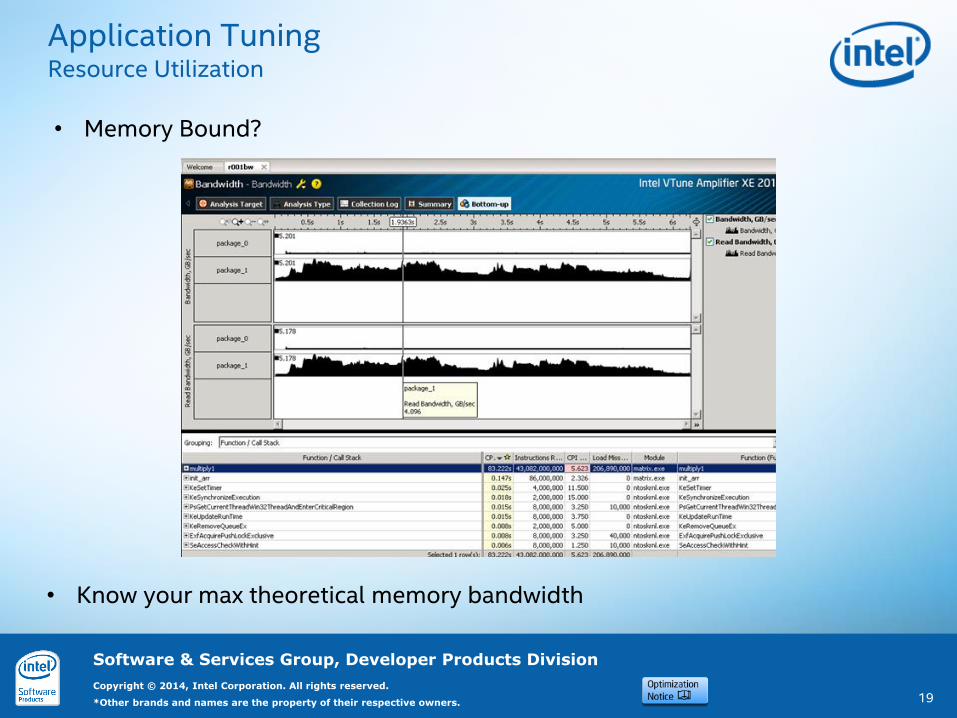
Application TuningResource Utilization
19
• Memory Bound?
• Know your max theoretical memory bandwidth

Software & Services Group, Developer Products Division
Copyright © 2014, Intel Corporation. All rights reserved.
*Other brands and names are the property of their respective owners.
Application TuningResource Utilization
20
MPI applications have added communication complexity
Intel® Trace Analyzer and Collector: http://intel.ly/traceanalyzer-collector
Software & Services Group, Developer Products Division
Copyright © 2014, Intel Corporation. All rights reserved.
*Other brands and names are the property of their respective owners.
Application TuningWhat’s Next?
21
• If your Hotspots are common algorithms:• Look for optimized libraries
• If your Hotspots are uncommon:• Compiler optimizations• Expert analysis and refactoring of an algorithm
• The opposite of “low-hanging fruit”• Deeper analysis of hardware performance
• If the system is underutilized:• Add parallelism - multi-thread or multi-process
• OpenMP, TBB, Cilk, MPI, etc…
Tools can help you determine where to look and may identify some issues. Some tools may provide suggestions for fixes. In the end – the developer and/or expert has to make the changes and decisions – there is no sliver
bullet.
Software & Services Group, Developer Products Division
Copyright © 2014, Intel Corporation. All rights reserved.
*Other brands and names are the property of their respective owners.
Optimization: A Top-down Approach
22
System
Application
Processor
H/W tuning:
BIOS (TB, HT)
Memory
Network I/O
Disk I/O
OS tuning:Page sizeSwap fileRAM DiskPower settingsNetwork protocols
Better application design:
Parallelization
Fast algorithms / data bases
Programming language and RT libs
Performance libraries
Driver tuning
Tuning for Microarchitecture:
Compiler settings/Vectorization
Memory/Cache usage
CPU pitfalls
OS, S
yste
m E
xp
ertis
eSW
/uArc
h
Software & Services Group, Developer Products Division
Copyright © 2014, Intel Corporation. All rights reserved.
*Other brands and names are the property of their respective owners.
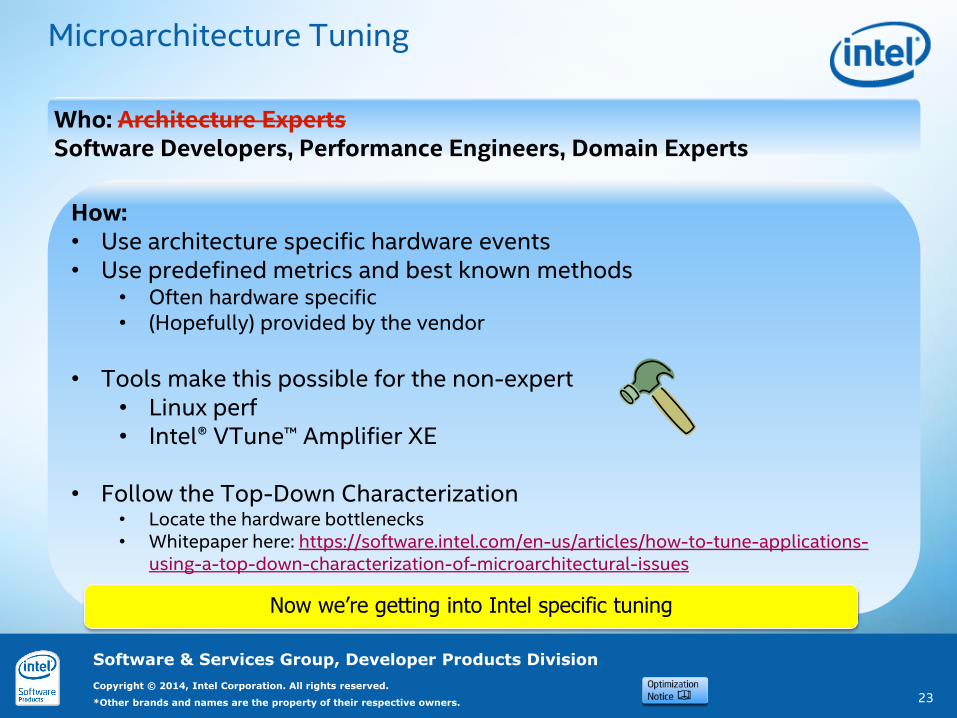
Microarchitecture Tuning
23
Who: Architecture ExpertsSoftware Developers, Performance Engineers, Domain Experts
How:• Use architecture specific hardware events• Use predefined metrics and best known methods
• Often hardware specific • (Hopefully) provided by the vendor
• Tools make this possible for the non-expert• Linux perf• Intel® VTune™ Amplifier XE
• Follow the Top-Down Characterization• Locate the hardware bottlenecks• Whitepaper here: https://software.intel.com/en-us/articles/how-to-tune-applications-
using-a-top-down-characterization-of-microarchitectural-issues
Now we’re getting into Intel specific tuning

Software & Services Group, Developer Products Division
Copyright © 2014, Intel Corporation. All rights reserved.
*Other brands and names are the property of their respective owners.
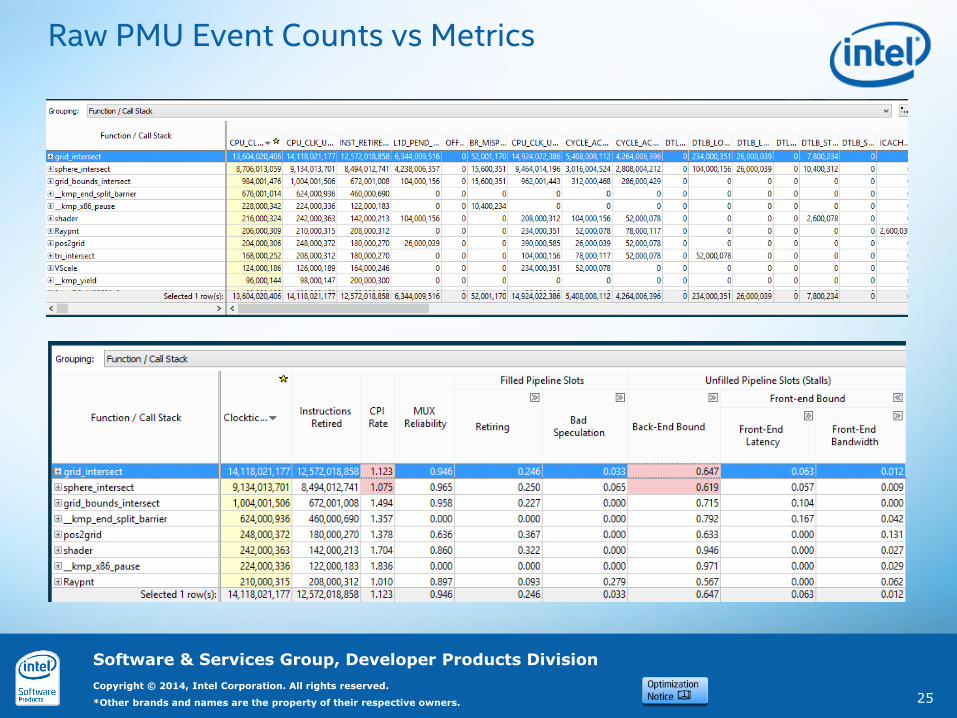
• Registers on Intel CPUs to count architectural events– E.g. Instructions, Cache Misses, Branch Mispredict
• Events can be counted or sampled– Sampled events include Instruction Pointer
• Raw event counts are difficult to interpret– Use a tool like VTune or Perf with predefined metrics
24
Introduction to Performance Monitoring Unit (PMU)
Software & Services Group, Developer Products Division
Copyright © 2014, Intel Corporation. All rights reserved.
*Other brands and names are the property of their respective owners. 25
Raw PMU Event Counts vs Metrics
Software & Services Group, Developer Products Division
Copyright © 2014, Intel Corporation. All rights reserved.
*Other brands and names are the property of their respective owners.
Adding Regression Tests for Performance
• Regression testing isn’t just for bugs
1. Create a baseline performance characterization
2. After each change or at a regular interval1. Compare new results to baseline
2. Compare new results to previous results
3. Evaluate the change
3. goto (1)
• Performance tuning is easier if it’s always on your mind and integrated into your development
26

Copyright © 2014, Intel Corporation. All rights reserved. *Other names and brands may be claimed as the property of others.Optimization Notice
INFORMATION IN THIS DOCUMENT IS PROVIDED “AS IS”. NO LICENSE, EXPRESS OR IMPLIED, BY ESTOPPEL OR OTHERWISE, TO ANY INTELLECTUAL PROPERTY RIGHTS IS GRANTED BY THIS DOCUMENT. INTEL ASSUMES NO LIABILITY WHATSOEVER AND INTEL DISCLAIMS ANY EXPRESS OR IMPLIED WARRANTY, RELATING TO THIS INFORMATION INCLUDING LIABILITY OR WARRANTIES RELATING TO FITNESS FOR A PARTICULAR PURPOSE, MERCHANTABILITY, OR INFRINGEMENT OF ANY PATENT, COPYRIGHT OR OTHER INTELLECTUAL PROPERTY RIGHT.
Software and workloads used in performance tests may have been optimized for performance only on Intel microprocessors. Performance tests, such as SYSmark and MobileMark, are measured using specific computer systems, components, software, operations and functions. Any change to any of those factors may cause the results to vary. You should consult other information and performance tests to assist you in fully evaluating your contemplated purchases, including the performance of that product when combined with other products.
Copyright © , Intel Corporation. All rights reserved. Intel, the Intel logo, Xeon, Core, VTune, and Cilk are trademarks of Intel Corporation in the U.S. and other countries.
Optimization Notice
Intel’s compilers may or may not optimize to the same degree for non-Intel microprocessors for optimizations that are not unique to Intel microprocessors. These optimizations include SSE2, SSE3, and SSSE3 instruction sets and other optimizations. Intel does not guarantee the availability, functionality, or effectiveness of any optimization on microprocessors not manufactured by Intel. Microprocessor-dependent optimizations in this product are intended for use with Intel microprocessors. Certain optimizations not specific to Intel microarchitecture are reserved for Intel microprocessors. Please refer to the applicable product User and Reference Guides for more information regarding the specific instruction sets covered by this notice.
Notice revision #20110804
Legal Disclaimer & Optimization Notice
Copyright© 2012, Intel Corporation. All rights reserved. *Other brands and names are the property of their respective owners.
28