a new material model for 2d numerical simulation of ... · pdf filea new material model for 2d...
TRANSCRIPT

HAL Id: hal-00911076https://hal.archives-ouvertes.fr/hal-00911076
Submitted on 28 Nov 2013
HAL is a multi-disciplinary open accessarchive for the deposit and dissemination of sci-entific research documents, whether they are pub-lished or not. The documents may come fromteaching and research institutions in France orabroad, or from public or private research centers.
L’archive ouverte pluridisciplinaire HAL, estdestinée au dépôt et à la diffusion de documentsscientifiques de niveau recherche, publiés ou non,émanant des établissements d’enseignement et derecherche français ou étrangers, des laboratoirespublics ou privés.
A new material model for 2D numerical simulation ofserrated chip formation when machining titanium alloy
Ti-6Al-4VMadalina Calamaz, Dominique Coupard, Franck Girot
To cite this version:Madalina Calamaz, Dominique Coupard, Franck Girot. A new material model for 2D nu-merical simulation of serrated chip formation when machining titanium alloy Ti-6Al-4V. In-ternational Journal of Machine Tools and Manufacture, Elsevier, 2008, 48 (3-4), pp.275-288.<10.1016/j.ijmachtools.2007.10.014>. <hal-00911076>

Science Arts & Métiers (SAM)is an open access repository that collects the work of Arts et Métiers ParisTech
researchers and makes it freely available over the web where possible.
This is an author-deposited version published in: http://sam.ensam.euHandle ID: .http://hdl.handle.net/10985/7549
To cite this version :
Madalina CALAMAZ, Dominique COUPARD, Franck GIROT - A new material model for 2Dnumerical simulation of serrated chip formation when machining titanium alloy Ti-6Al-4V -International Journal of Machine Tools and Manufacture - Vol. 48, n°3-4, p.275-288 - 2008
Any correspondence concerning this service should be sent to the repository
Administrator : [email protected]

A new material model for 2D numerical simulation of serrated chip
formation when machining titanium alloy Ti–6Al–4V
Madalina Calamaz, Dominique Coupard, Franck Girot�
Laboratoire Materiaux Endommagement Fiabilite Ingenierie des Procedes (LAMEFIP), ENSAM CER Bordeaux,
Esplanade des Arts et Metiers, 33405 Talence Cedex, France
Abstract
A new material constitutive law is implemented in a 2D finite element model to analyse the chip formation and shear localisation whenmachining titanium alloys. The numerical simulations use a commercial finite element software (FORGE 2005s) able to solve complex thermo-mechanical problems. One of the main machining characteristics of titanium alloys is to produce segmented chips for a widerange of cutting speeds and feeds. The present study assumes that the chip segmentation is only induced by adiabatic shear banding,without material failure in the primary shear zone. The new developed model takes into account the influence of strain, strain rate andtemperature on the flow stress and also introduces a strain softening effect. The tool chip friction is managed by a combined
Coulomb–Tresca friction law. The influence of two different strain softening levels and machining parameters on the cutting forces andchip morphology has been studied. Chip morphology, cutting and feed forces predicted by numerical simulations are compared withexperimental results.
Keywords: Machining; Finite element method; Chip segmentation
1. Introduction
Machining (turning, milling, drilling, etc.) is one of the
oldest industrial processes and it is the most frequently
used in the manufacture of industrial workpieces. It is
estimated that approximately 15% of the value of all
mechanical components manufactured in the world comes
from a machining operation. In spite of its economic and
technical importance, metal cutting remains one of the least
understood processes because of the bad predictive
capacity of the models. A study made in the USA showed
that a correct tool choice is made in less than 50% of the
cases and only in 38% of the cases it is used until its real
‘‘tool life’’ [1].
Numerical models are very important in the machining
process comprehension and for the reduction of experi-
mental tests necessary for the optimisation of cutting
conditions, tools geometries and other parameters like the
choice of the tool material and coating. None of the
analytical models can predict with enough precision the
adequate conditions of a machining practical situation.
Numerical models are interesting candidates because they
might explain the observed phenomena and help in
defining the optimal cutting conditions.
Numerical simulation of machining is not yet reliable
enough for predictive results. On the mesoscopic level,
adequate constitutive laws are needed for both the
machined material and the tool. However, these properties
are often unavailable or incomplete and constitute a brake
for the numerical simulation.
A correct simulation enables good predictions in terms
of temperature, strain and stress distribution. This will
contribute to cost reductions for the machining process
optimisation which is still experimentally done and thus
expensive.
Ti–6Al–4V titanium alloy is often used in the aircraft
industry due to the good compromise between mechanical
resistance and tenacity, together with its low density and
excellent corrosion resistance. However, this material is
�Corresponding author. Tel.: +33556 845 348; fax: +33 556 845 366.
E-mail address: [email protected] (F. Girot).

known to be difficult to machine. One of the reasons is
due to its low thermal conductivity which gives rise to (a)
high pressures and temperatures at the tool–chip interface,
(b) a plastic instability localised in adiabatic shear bands,
(c) tool wear by thermal fatigue and diffusion.
The high chemical reactivity with many tool materials
and the low elastic modulus, which generates harmful
vibrations for the tool and the workpiece, also contribute
to the difficult machinability of this aeronautic material.
At high cutting speeds, many materials give rise to
segmented chips. The Ti–6Al–4V titanium alloy is one of
the materials often generating segmented chips (also named
‘‘saw-tooth’’ chips) at relatively low cutting speeds. The
chip segmentation affects the machining process (cutting
forces, temperature and workpiece surface quality) so
that a thorough understanding of this phenomenon is
important.
Two theories about saw-tooth chip formation predomi-
nate, namely (i) the thermoplastic instability and (ii) the
initiation and propagation of cracks inside the primary
shear zone of the workpiece material. Shaw et al. [2],
Komanduri and Turkovich [3] explain that the titanium
chip morphology is due to a plastic instability during the
cutting process resulting from the competition between
the thermal softening and work hardening in the primary
shear zone.
Vyas and Shaw [4] and Hua and Shivpuri [5] explain the
titanium alloy chip segmentation by a crack initiation
followed by propagation inside the primary shear zone.
The presence of adiabatic shear bands does not exclude
the theory of saw-tooth chip formation by crack initiation.
Bai and Dodd [6] suggested that the adiabatic shear bands
are commonly the precursors to fracture.
The cutting speed (Vc) and the feed (f) are the main
parameters controlling the shear frequency during the chip
formation [7]. According to Bayoumi and Xie [7], the chip
load, defined by the factor Vc� f, should be considered as a
good criterion for the appearance of shear bands. In the
case of Ti–6Al–4V alloy, the chip load should be around
0.004m2/min [7].
On the other hand, Hou and Komanduri [8] suggested
that the important parameter is the cutting speed and
propose a critical cutting speed around 9m/min above
which a thermoplastic instability takes place.
Different methods have been used to simulate the saw-
tooth chip formation in machining such as the pure
deformation model without taking into account any
fracture criterion [9,10] and many material laws such as
the Johnson–Cook (JC) material model, the Baummann–
Chiesa–Johnson (BCJ) law [11], Obikawa and Usui, Rhim
and Oh [12,13] models, etc., coupled with a fracture
criterion such as the JC damage law [14–18], deformation
energy-based criterion [5,19], ductile fracture criterion [12].
Therefore, apart from pure deformation model [9,10],
a fracture criterion is implemented in most numerical
simulations to obtain the saw-tooth chip geometry
[12,14–19].
An important factor to be considered for a correct
simulation of Ti–6Al–4V machining is the material
constitutive law. Classically, the JC material law, the
Obikawa and Usui [12] model or the Marusich material law
[20] are used to correlate the material flow stress to strain,
strain rate and temperature. The parameters identified for
these laws are usually fitted to the stress–strain curves
obtained by split Hopkinson bars. The levels of strain,
strain rate and temperature achieved with this experimental
device are lower than those developed during the machin-
ing process. These experiments can achieve a maximum
strain of about 0.5 and strain rate around 103 s�1, whereas
the cutting process generates higher strains (41) and strain
rates (4104 s�1) in the workpiece material. Within the
experimental range of strain, strain rate and temperature,
the material model correlates quite well the experimental
results. Outside the experimentally studied range, the flow
stress is extrapolated which may be considered as an
incorrect hypothesis unable to take into account presumed
microstructural changes.
Some attempts have been made to account for micro-
structural transformations of the material, the history of
loading, the kinematic and isotropic hardening and the
recrystallisation and recovery phenomena [11,13,21]. For
example, an interesting phenomenon called strain softening
has been introduced in the flow stress model in order to
explain the saw-tooth chip formation [5]. Strain softening is
represented by a decrease in stress with increasing strain
beyond a critical strain value. Below that critical strain, the
material exhibits strain hardening.
The strain softening was identified by carrying out
torsion tests at high temperature on pure aluminium [22]
and on different AlMgSi alloys [23]. Kassner et al. [22]
affirm that for pure aluminium, the peak stress is reached
at strains less than 0.5. Increasing the strain further leads to
a gradual material softening before a relatively constant
level is reached. This type of flow stress–strain curves has
also been obtained for Ti–6Al–4V titanium alloy [24,25].
The physical phenomena giving rise to the softening
effect are not completely understood. The main reasons
would be related with a texture softening (decrease of the
Taylor factor) or a microstructural softening induced by a
dynamic recovery and/or dynamic recrystallisation. The
most wide-spread theories agreed that large deformation
results in a dramatic increase in the high-angle grain
boundary (HAB) areas which are annihilation sites for
dislocations [22]. Pettersen and Nes [23] confirmed that the
flow stress decrease is due to a change in the grain size and
a new operating deformation mechanism (such as grain-
boundary sliding) due to the dramatic increase in the
HAB area with increasing strain. The dynamic recovery
and/or recrystallisation have also been observed in
Ti–6Al–4V titanium alloy microstructure after hot proces-
sing at temperatures above the b-transus [26]. Another
cause of strain softening in Ti–6Al–4V would be a
texture change corresponding to an a/b platelet kinking
[25]. According to Ding and Guo [26], the dynamic

recrystallisation is more pronounced when the material
undergoes high strains.
Baker et al. [9] assumed a critical strain value around
0.25 below which strain hardening occurs and above which
Ti–6Al–4V alloy exhibits strain softening. This phenom-
enon should enhance the chip segmentation during
machining by introducing an easy slip band in the primary
shear zone. Hua and Shivpuri [5] also introduce this
phenomenon in their Ti–6Al–4V machining numerical
simulations. At room temperature, rapid strain hardening
occurs followed by strain softening after a peak flow stress.
As the temperature is raised both the strain hardening and
strain softening responses are reduced. No mathematical
formulation has been proposed in these studies to take into
account the strain-softening phenomenon. Guo et al. [11]
call this phenomenon adiabatic shearing and, contrary to
Hua and Shivpuri [5], asserted that this effect is much more
significant at high temperatures.
The JC law exhibits a flow stress increase with increasing
strain whatever the temperature. Some authors [11] affirm
that the JC model cannot predict the adiabatic phenom-
enon responsible for the saw-tooth chip formation which is
common in machining process because the strain softening
is not taken into account.
According to Rhim and Oh [13], at high strain rates
(higher than 103 s�1) and high temperatures (higher than
half of the material’s melting temperature), a dynamic
recrystallisation phenomenon occurs. This phenomenon
should appear in adiabatic shear bands, leading to a
material softening. In order to model the material
behaviour, they use two equations suitable for two
different temperature ranges. Below half of the melting
temperature, the material behaviour is modelled by a
strain-hardening equation and above this temperature, a
new equation introduces the strain softening effect [13].
Owen and Vaz [21] talk about a failure softening
phenomenon which induces a decrease in stress with
increasing strain. Generally, the failure of a material is a
consequence of a dislocation accumulation resulting from a
high level of deformation and microscopic damage.
According to Giovanola [27] the material failure in
adiabatic shear bands happens in two separated phases.
First a thermal softening appears followed by a nucleation
and growth of microcavities. Owen and Vaz [21] describe
the material’s failure with (a) a failure indicator or rupture
criterion and (b) a factor of energy dissipation. The rupture
criterion indicates the failure onset and the other defines
the amount of energy dissipated during the softening
process.
Another parameter investigated in numerical simulations
is the influence of the friction conditions at the tool–chip
interface. In most studies, the Coulomb friction model is
commonly used [13–15,17,28]. Guo et al. [11,18] used a
Coulomb friction law and Tresca shear stress limit to
model the sticking and sliding conditions at the tool–chip
interface. The Tresca friction law has also been implemen-
ted in some computations in order to simulate the
tool–chip friction [10]. Since friction at the interface is
not precisely known, some authors neglect the friction
coefficient in their numerical simulations [9,16,29].
Childs [30] studied the effect of both the Coulomb and
Tresca friction laws in the case of continuous chip
simulations and proposed a new model in which the
friction coefficient depends on the plastic strain rate. An
important analysis about the influence of the friction
models on machining numerical simulation has been done
by Ozel [31] by comparing four friction models. He
concluded that the models with a variable friction
coefficient along the tool rake face deduced from the
normal and frictional stresses experimentally measured,
gave the best predictions. More recently, Filice et al. [32]
also analysed the influence of different friction models on
the results of numerical machining simulations. They
concluded that for the studied workpiece/tool couple, most
mechanical results are not influenced by the friction model
except the temperature at the tool–chip interface. Calamaz
et al. [33] obtained the same tendencies in the case of
Ti–6Al–4V machining simulation.
In this study, a new material model is proposed to take
into account not only the strain rate hardening and the
thermal-softening phenomenon but also the strain-soft-
ening phenomenon. The main feature of the new mathe-
matical formulation named TANH (Hyperbolic TANgent)
is to add a new term to the JC law in order to model the
strain softening effect. This strategy is interesting because
all the JC parameters (A, B, C, n, m) are usually known for
many metals and can be used in the new formulation.
The purpose of this paper is to study the influence of
both the strain softening phenomenon and the friction
coefficient at the tool–chip interface on the appearance of
shear localisation giving rise to segmented chips. The
workpiece material properties are modelled using two
different levels of strain softening. Friction at tool–chip
interface is studied by varying both the Coulomb and
Tresca friction coefficient. The influence of the material
and cutting parameters on cutting forces and chip
morphology are discussed. Estimated chip morphology
and cutting forces are compared with experimental results.
The commercial finite element software FORGE 2005s,
which is able to solve complex thermomechanical problems
in 2D, is used in this study to simulate the Ti–6Al–4V dry
machining.
2. Material and contact laws
The equation usually used to describe the material
behaviour is the JC law [9,14–18]:
s ¼ ðAþ B�nÞ 1þ C ln_�
_�0
� �
1� T � T r
Tm � T r
� �m� �
, (1)
where s is the equivalent flow stress, e the equivalent plastic
strain, _� the equivalent plastic strain rate, _�0 the reference
equivalent plastic strain, T the workpiece temperature, Tm

and Tr are, respectively, the material melting and room
temperature.
A, B, C, n and m are constitutive constants fitted to the
data obtained by split Hopkinson pressure bar (SHPB)
tests at strain rates up to 103 s�1, temperatures up to 600 1C
and strains until 0.5. This multiplicative law takes into
account the material strain and strain rate hardening as
well as the thermal softening phenomenon. It expresses
rather well the material behaviour up to strain rates of
103 s�1 and strains of 0.3.
This newly developed model (TANH) based on a
modified JC law is implemented in the FE code to
introduce the strain softening effect. The new material
flow stress is expressed by the following equation:
s ¼ Aþ B�n1
exp ð�aÞ
� �� �
1þ C ln_�
_�0
� �
� 1� T � T r
Tm � T r
� �m� �
Dþ ð1�DÞ tanh 1
ð�þ SÞc� �� �
ð2Þ
with
D ¼ 1� T
Tm
� �d
, (3)
S ¼ T
Tm
� �b
, (4)
where a, b, c, d are material constants. According to flow
stress–strain curves shown in [24], the strain corresponding
to the peak stress value decreases when increasing the
temperature. This phenomenon is taken into account in
Eq. (2) by means of the parameter S depending on the
temperature T. At low strains, the flow stress increases in a
similar way as that given by the JC equation (Fig. 1).
Beyond a given strain, the flow stress begins to decrease
until a strain around 1.5 after which a nearly constant
stress is obtained. This evolution corresponds to the
recovery and/or dynamic recrystallisation mechanisms.
Therefore, this new material law takes into account the
influence of the strain, strain rate, temperature on the flow
stress and also the hypothesis of dynamic recovery and
recrystallisation mechanism.
Two arbitrary values were chosen for the parameter d in
Eq. (3). These values were selected in order to obtain
different magnitudes of the softening phenomenon. Fig. 2
shows the flow stress–strain curves for different tempera-
tures when the parameter d is set to 1 and 1.5, respectively.
It can be seen that the lower the parameter d, the higher the
magnitude of the strain softening phenomenon. The
parameters ‘‘a’’ and ‘‘c’’ in Eq. (2) modify the slope of
stress–strain decrease at (i) high strains for ‘‘a’’, and (ii)
relatively low strains (after the pick stress) for ‘‘c’’. The
parameter ‘‘b’’ in Eq. (4) gives the strain value for which
the pick stress is obtained.
The constitutive material constants used in the simula-
tions are reported in Table 1 according to the work of Li
and He [14].
Fig. 3 shows the flow stress evolution versus strain rate
for both material laws at a strain of 0.3 and temperature of
598K. The stress values for the new model correspond to
the case d ¼ 1.5. The flow stress sensitivity to the strain rate
is the same for both models because the new model does
not consider any strain rate influence with respect to the
strain-softening phenomenon. The only difference shown
in Fig. 3 is the lower stress level given by the new model for
a given strain. This mismatch appears when the strain
softening begins and gets more and more pronounced as
the strain level increases.
0
200
400
600
800
1000
1200
1400
0 0.5 1.5 2 2.5 3
Str
ess (
MP
a)
JC TANH
1
Strain
Fig. 1. Flow stress–strain curves for the Johnson–Cook (JC) and the new
(TANH) material model at a temperature of 598K and a strain rate of
104 s�1.
0
200
400
600
800
1000
1200
1400
1600
1800
2000
0 0.5 1 1.5 2.5 3 3.5 4
Str
ess (
MP
a)
JC_298K TANH_298K_d = 1.5 TANH_298K_d = 1
JC_898K TANH_898K_d = 1.5 TANH_898K_d = 1
Strain
2
Fig. 2. Flow stress–strain curves versus temperature for Johnson–Cook
(JC) law and the new TANH model for a strain rate of 104 s�1.
Table 1
Constants of the Johnson–Cook law [14]
A (MPa) B (MPa) n C m
968 380 0.421 0.0197 0.577

The mechanical properties of titanium alloy are given
in Table 2. The Ti–6Al–4V specific heat increases from
565 J/KgK at room temperature to 1060 J/KgK at 980 1C.
The titanium alloy thermal conductivity also increases
from 6.6W/mK at 20 1C to 21.5W/mK at 1050 1C. The
coefficient of thermal expansion is nearly constant from
9.4e�006K�1 at room temperature and 1.07e�005K�1 at
1000 1C.
The workpiece is discretised using triangular elements in
2D. An automatic remeshing procedure is used to avoid
excessive element distortion. A very thin mesh (around
2 mm) is defined around the cutting edge and along the
primary shear zone in order to allow the appearance of
very localised shear bands. In all numerical simulations,
the cutting length is 1mm in order to reduce the com-
putation time.
The carbide tool geometry is defined by a �41 rake angle
(g) over 0.15mm, a 71 clearance angle (a) and a 20 mm tip
radius (r). Fig. 4 shows the tool geometry and the
workpiece undeformed mesh at the beginning of the
simulation. The tool is assumed to be rigid, but heat
conduction into the tool is taken into account via a high
value of the heat transfer coefficient (h ¼ 20 000W/m21C)
between the workpiece material and the tool. The work-
piece thermal properties are assumed to depend on
temperature as noted before.
Titanium alloys are particularly susceptible to strain
localisation and high cutting speeds and/or feeds amplify
this effect mainly because of high plastic power dissipation.
Prediction of narrow shear bands is usually difficult to
obtain during Ti–6Al–4V machining. In this study two
cutting conditions are studied by considering two cutting
speeds (60 and 180m/min) and a constant feed (uncut chip
thickness) of 0.1mm for both the orthogonal turning
experiments and the 2D simulation tests.
For each cutting condition, eight finite element simula-
tions are made by varying the parameter d and the friction
coefficients m and m according to Table 3.
When considering machining simulations of Ti–6Al–4V
titanium alloys, some authors [14] use a moderate friction
coefficient (about 0.3) and others neglect the effect of this
parameter [29]. In this study, friction at the tool–chip
interface is controlled by a Coulomb limited Tresca law
which is expressed by the following relations:
t ¼ msn; if msnoms0ffiffiffi
3p (5a)
600
650
700
750
800
850
900
950
1 10 100 1000 10000 100000
TANH J_C
Str
ess (
MP
a)
Strain rate (1/s)
Fig. 3. Flow stress evolution versus strain rate for Johnson–Cook (JC)
and the new TANH model for a strain of 0.3 and a temperature of 598K.
Table 2
Mechanical proprieties of the Ti–6Al–4V titanium alloy
Tensile stress
(MPa)
Yield stress
(MPa)
Elongation (%) Reduction in
area (%)
Young modulus
(GPa)
Hardness (HV) Density (g/cm3)
931 862 10 25 110 340 4.43
Tool
Workpiece
0.1
5
r
γ
Fig. 4. Initial tool geometry and workpiece undeformed mesh.
Table 3
Configurations of numerical simulations
Simulation Material law
parameter d
Friction
coefficient m
Friction
coefficient m
1 1 0.05 0.5
2 1 0.05 1
3 1 0.3 0.5
4 1 0.3 1
5 1.5 0.05 0.5
6 1.5 0.05 1
7 1.5 0.3 0.5
8 1.5 0.3 1

and
t ¼ ms0ffiffiffi
3p ; if msn4m
s0ffiffiffi
3p . (5b)
The shear stress (t) is either expressed by the product of
Coulomb friction coefficient (m) with normal stress (sn) or
by a fraction (m) of permissible shear stress of the
workpiece material.
3. Experimental and numerical results
3.1. Titanium alloy chip morphology
As already specified in Section 1, machining of Ti–6Al–
4V titanium alloys often generates segmented chips at
relatively low cutting speeds. Experiments showed that
machining with a cutting speed of 60m/min and a feed of
0.1mm gives rise to a segmented chip, as illustrated in Fig. 5.
Under the same cutting conditions, the use of the JC law
gives rise to a continuous chip (Fig. 6(a)). The chip shape is
far different from that shown in Fig. 5 which means that
the JC model is not correct. When the strain softening
phenomenon (Table 3) is introduced via the new TANH
model, the shear localisation and chip segmentation can
clearly be observed in Fig. 6(b). The simulated chip also
shows a very small tooth after the big one, as illustrated in
Fig. 6(b). This particularity of the predicted chip can also
be observed experimentally in some areas of real chips, as
shown in Fig. 5, where a sequence of two unequal segments
can be noted.
The chip morphology can be described using some
parameters such as the tooth width (Lt,), the maximum (h1)
and minimum (h2) tooth height. The experimental h2 value
is measured without taking into account the chip crack
since no fracture criterion is introduced into the numerical
simulations. A good correlation between the experimental
and simulated chip obtained using the new TANH model
can be noted in terms of tooth width (Lt) under these
previous cutting conditions (Figs. 5 and 6(b)).
Under a cutting speed of 180m/min, both the JC and the
TANH models give rise to segmented chips (Figs. 7(a) and
(b)). This is also the case for the experimental chip shape
(Fig. 8). Even before measuring the chip parameters it is
noted that the morphology of the chip obtained using the
new TANH law is much closer to experimental chip.
Under these cutting conditions, the main difficulty of the
JC model is the correct prediction of the h2 parameter. As
illustrated in Fig. 7(a), a very high h2 value is obtained
(120 mm) comparing with experimental result (h2 ¼ 62 mm)
(Fig. 8). The use of the new TANH material model enables
a good estimation of the previous chip parameter
(h2 ¼ 53mm), as shown in Fig. 7(b).
Therefore, the new material model improves significantly
the prediction of the chip shape giving rise to segmented
Tool Sequence of two unequal segments
10
0µ
m
Lt = 100µm
Workpiece
10
0µ
m
Fig. 6. Simulated chips at a cutting speed of 60m/min and a feed of 0.1mm: (a) Johnson–Cook material law and (b) new TANH material model
(Simulation 4 in Table 3).
Lt = 100µmSequence of two
unequal segments
100µm
100µm
Fig. 5. Experimental chips obtained when machining with a cutting speed of 60m/min and a feed of 0.1mm.

chips by strain localisation without implementation of a
fracture criterion into the simulation.
3.2. Cutting and feed forces
A comparison between experimental and simulated
cutting and feed forces under the same cutting condition
is shown in Figs. 9(a) and (b). For all numerical tests, both
cutting and feed forces are underestimated but quite
constant especially for the cutting forces. The strain
softening magnitude and the friction conditions at the
tool–chip interface has thus a low influence on the cutting
forces. Considering the feed forces, the greater mismatch
for a given d value is only 25%. Moreover, the higher the
friction coefficients the higher the feed forces.
As shown in Figs. 9(a) and (b), the experimental feed
force is around one half the cutting force. The same
tendency is obtained for numerically simulated forces.
The best agreement between experimental and simulated
feed forces is obtained for simulations 4 and 8, i.e. those
with the highest values of the friction coefficient. The only
difference between these two simulations is the magnitude
of the strain softening considered. Simulation 8 is made
with a weaker strain-softening effect (d ¼ 1.5) giving rise to
a higher mean stress level. This should be one of the
reasons for the slightly higher values of the cutting and feed
forces shown in Fig. 9. However, the influence of the
material parameter d remains negligible.
The cutting forces are also underestimated when the
cutting speed is increased to 180m/min under the same feed
of 0.1mm (Fig. 10). As for 60m/min, the cutting force is
not much affected by the strain softening magnitude and
the friction conditions. Simulation 8 gives, as before, the
best correlation with experimental results.
The main reason which would explain the mismatch
between experimental and simulated forces might be
related to the choice of the JC parameters. Many material
constants can be found in literature for the Ti–6Al–4V
alloy [14,34–38]. Fig. 11 shows the flow stress–strain curves
for different JC material parameters identified in literature
(Table 4). The JC parameters used in this study correspond
to the stress–strain curve no. 4 in Fig. 11. The material
constants corresponding to the stress–strain curve no. 1 in
Fig. 11 have been used in the new TANH model in order to
estimate their influence. The result of this supplementary
simulation is presented in Fig. 10 and corresponds to
Simulation 9. It can be seen in Fig. 10 that the simulated
cutting force is now very close to the experimental one. The
other parameters of Simulation 9 correspond to those of
simulation 8, i.e. d ¼ 1.5, m ¼ 0.3 and m ¼ 1. As expected,
the JC material constants have a great influence on the
simulated forces, but do not affect the chip shape.
3.3. Shear band frequency
At 60m/min, the shear band frequency is correctly
predicted for simulations 1–4, i.e. when using a high strain
softening level (d ¼ 1) while it is underestimated for
simulations 5–8 corresponding to a low strain softening
effect (d ¼ 1.5) (Fig. 12(a)). Increasing the parameter d will
lead to a small decrease of the shear band frequency and a
slight increase of the cutting and feed forces. When
increasing the cutting speed from 60 to 180m/min, the
predicted values of the shear band frequency are much
higher than the experimental ones (Fig. 12(b)). One of the
100
µm
Lt = 78µm
100
µm
Lt = 95µm
160µm 111µm
53µm
120µm
Tool
Tool
Fig. 7. Simulated chips at a cutting speed of 180m/min and a feed of 0.1mm: (a) Johnson–Cook material law and (b) new TANH material model
(Simulation 4 in Table 3).
Lt = 100µm
200µm
h1 = 131µm
h2 = 62µm
Fig. 8. Experimental chip obtained when machining with a cutting speed
of 180m/min and a feed of 0.1mm.

reasons for the mismatch between experimental and
simulated chip frequencies should be an imprecise model-
ling of the flow stress in the range of strain rate and
temperature obtained under such cutting conditions.
However, the new model is able to predict segmentation
for low cutting speeds and feeds while the JC model gives a
continuous chip under these cutting conditions.
3.4. Strain field inside the experimental and simulated
titanium alloy chips
The strain field of experimental and predicted chips
under a cutting speed of 60m/min and a feed of 0.1mm is
shown in Fig. 13. Under these cutting conditions, the JC
law gave a continuous chip where the deformation is low
and uniform (Fig. 13(a)), which is far from the experi-
mental chip (Fig. 13(c)).
The best prediction is obtained with the new TANH
material model. In this case, both the experimental
(Fig. 13(c)) and the simulated chips (Fig. 13(b)) show a
sequence of two unequal segments and one can distinguish
a high strain localisation in narrow bands and areas where
the deformation is very low.
Whatever the cutting speed (60 and 180m/min), the chip
microstructure enables two areas to be distinguished: (a) a
highly strained area along the shear band where the Ti b
phase is very elongated and (b) a small strain area inside
the tooth where the Ti grains are quite similar to
those observed in the initial microstructure of the metal
(Fig. 14(b)). This strain field distribution is correctly pre-
dicted by the simulation, as shown in Figs. 14(a) and (c).
The strong Ti b phase elongation in Fig. 14(b) indicates
very high strains in the shear bands. Although the global
strain field distribution, when using the JC model under
60_0.1
0
100
200
300
400
500
600
700
0 2 3 41 5 6 7 8 9
Fc (
N)
Fc FEM Fc exp 60_0.1
0
100
200
300
400
500
Ff
(N)
Ff FEM Ff exp
Simulation
0 2 3 41 5 6 7 8 9
Simulation
Fig. 9. Experimental and FEM (a) cutting forces (Fc) and (b) feed forces (Ff). Cutting speed ¼ 60m/min, feed ¼ 0.1mm.
180_0.1
0
200
400
600
800
0 1 2 3 4 5 6 7 8 9 10
Fc (
N)
Fc FEM Fc exp
Simulation
Fig. 10. Experimental and FEM cutting forces. Cutting speed ¼ 180m/min,
feed ¼ 0.1mm.
500
700
900
1100
1300
1500
1700
1900
2100
0 0.1 0.2 0.3 0.4 0.5 0.6
1 2 3 4 5 6
Str
ess (
MP
a)
Strain
Fig. 11. Flow stress strain curves for Johnson–Cook law at room
temperature and a strain rate of 500 000 s�1.
Table 4
Johnson–Cook material model parameters for Ti–6Al–4V
No. A (MPa) B (MPa) n C m References
1 782.7 498.4 0.28 0.028 1 [34]
2 870 990 0.25 0.011 1 [35]
3 724 683.1 0.47 0.035 1 [36]
4 968 380 0.421 0.0197 0.577 [14]
5 859 640 0.22 0.000022 1.1 [37]
6 862 331 0.34 0.012 0.8 [38]
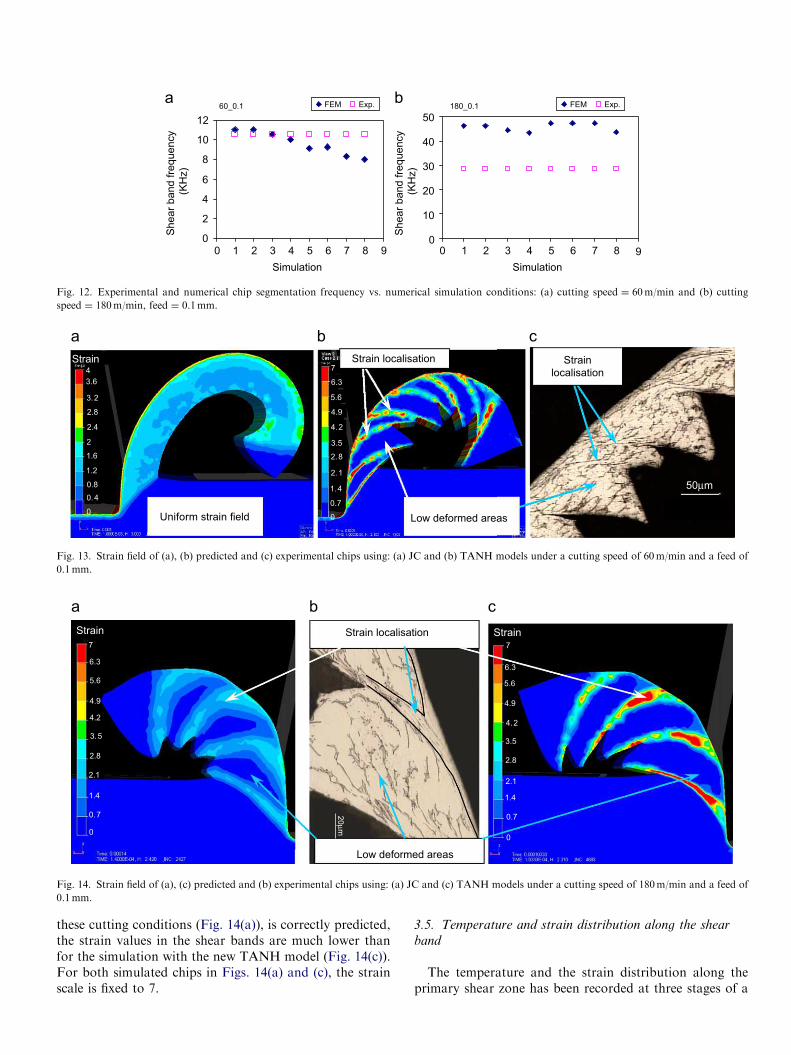
these cutting conditions (Fig. 14(a)), is correctly predicted,
the strain values in the shear bands are much lower than
for the simulation with the new TANH model (Fig. 14(c)).
For both simulated chips in Figs. 14(a) and (c), the strain
scale is fixed to 7.
3.5. Temperature and strain distribution along the shear
band
The temperature and the strain distribution along the
primary shear zone has been recorded at three stages of a
60_0.1
0
2
4
6
8
10
12
0 1 2 3 4 5 6 7 8 9
(KH
z)
180_0.1
0
10
20
30
40
50
FEM Exp.FEM Exp.
Shear
band fre
quency
(KH
z)
Shear
band fre
quency
Simulation
0 1 2 3 4 5 6 7 8 9
Simulation
Fig. 12. Experimental and numerical chip segmentation frequency vs. numerical simulation conditions: (a) cutting speed ¼ 60m/min and (b) cutting
speed ¼ 180m/min, feed ¼ 0.1mm.
Low deformed areas Uniform strain field
7
5.6
4.2
2.8
1.4
0
Strain localisation
50µm
4
3.2
2.4
1.6
0.8
0
3.6
2.8
2
1.2
0.4
Strain
0.7
2.1
3.5
4.9
6.3
Strain
localisation
Fig. 13. Strain field of (a), (b) predicted and (c) experimental chips using: (a) JC and (b) TANH models under a cutting speed of 60m/min and a feed of
0.1mm.
Low deformed areas
Strain localisationStrain Strain
6.3
5.6
3.5
2.8
0
0.7
2.1
1.4
4.2
4.9
7
6.3
5.6
3.5
2.8
0
0.7
2.1
1.4
4.2
4.9
7
20
µm
Fig. 14. Strain field of (a), (c) predicted and (b) experimental chips using: (a) JC and (c) TANH models under a cutting speed of 180m/min and a feed of
0.1mm.

segment formation (Fig. 15), i.e. (a) at the beginning (BSF)
(b) the middle (MSF) and the (c) end of a segment
formation (ESF).
For each stage, the data are recorded at five given points
along the primary shear band, as illustrated in Fig. 16.
Point no. 1 is near the tool rake face, no. 3 is taken at the
middle of the shear band and no. 5 is located close to the
chip free surface. Both the temperature and the strain
distribution in Figs. 17 and 18 correspond to Simulation 4,
when machining with a cutting speed of 180m/min.
As expected, during the segment formation, the tem-
perature is maximum near the tool tip (point 1) and
minimum close to the chip free surface (point 5). At the
BSF, the temperature is high near the tool tip but decreases
very quickly towards the chip free surface. It decreases
from about 520 to 120 1C, as shown in Fig. 17. At the
MSF, the increase in temperature is moderate at the tool
tip (point 1) and important for points 2–5 in such a way
that the temperature is much more homogeneous than at
the BSF. The temperature is quite constant, around 480 1C,
between position nos. 3 and 5 and only decreases by about
100 1C from the tool tip. At the ESF, the temperature
distribution is similar in shape as in MSF but only slightly
higher. One can thus consider that between the MSF and
ESF the temperature is stabilised (Fig. 17).
At the BSF, the strain close to the tool tip is already
high, around 4.5, and decreases quickly towards the chip
free surface where it is only around 0.2, as illustrated in
Fig. 18. At the MSF, the strain reaches 5.5 near the tool
rake face, a maximum of 7 at the middle of the primary
shear zone (point 3 in Fig. 18) and a minimum of 4.8 at the
chip free surface. A maximum strain value of about 13 is
recorded at the middle of the shear band for the ESF. For
all simulations, same temperature and strain evolutions
have been observed.
3.6. Temperature distribution at the tool–chip interface
The thermal load of the tool is different whether the chip
is continuous or segmented. When the machining process
gives rise to a continuous chip, the temperature near
the tool rake face is quite homogeneous, as illustrated in
Fig. 19.
Fig. 20 shows the temperature distribution at the
tool–chip interface when a segmented chip is obtained.
Fig. 15. Sequences of a chip segment formation: (a) beginning (BSF), (b) middle (MSF), and (c) end of segment formation (ESF).
1
2
3
54
650.5
581
372.5
303
94.5
442
511.5
164
233.5
25
720
Temperature (°C)
Fig. 16. Point nos. 1–5 along the primary shear band.
0
100
200
300
400
500
600
700
800
0 1 2 3 4 5 6
Point n° in the primary shear band
Tem
pera
ture
(°C
)
BSF MSF ESF
Near the
tool tip
Chip free
surface
Fig. 17. Temperature evolution into the primary shear band for different
stages of chip segment formation. Cutting speed ¼ 180m/min,
feed ¼ 0.1mm (Simulation 4).

The temperature along the tool rake face is in that case far
from being homogeneous, showing a periodic behaviour
between areas of low and high temperature. Therefore, the
tool rake face will undergo a cyclic thermal loading which
might contribute to a fast tool wear.
As mentioned before, increasing the friction coefficient
only generates a slight increase of the cutting and feed
forces and does not influence much the shear band
frequency. However, increasing the Coulomb friction
coefficient from 0.05 to 0.3 induces an increase of the
temperature at the tool–chip interface from 480 to 545 1C
and for higher friction coefficient, the temperature will
increase more as mentioned by Calamaz et al. [33].
As expected, the maximum temperature at the tool–chip
interface also increases when increasing the cutting speed.
Fig. 21 shows a temperature increase from about 570 1C
at a cutting speed of 60m/min to about 700 1C for
180m/min.
Usually, the tool holder is designed to be very rigid in
order to prevent vibrations or cutting condition variations.
However, observations with a high-speed camera of the
chip segmentation during orthogonal machining shown
cyclic deflection of the tool with a frequency close to that of
chip segmentation. Therefore, the tool rake angle and the
local cutting speed can be different from the set value. This
tool deflection induces a higher roughness of the workpiece
surface which will also generate a local and periodic
variation of the feed during machining.
In order to estimate the influence of the variation of feed
and tool rake angle on numerical results, two additional
simulations have been conducted. The conditions corre-
sponding to Simulation 1 have been chosen with a cutting
speed of 180m/min.
For the first simulation, only the feed value is changed
from 0.1 to 0.12mm. This increase of feed by only 20 mm
has generated a decrease of the shear band frequency from
46 kHz (Simulation 1) to 39 kHz and an increase of cutting
forces from 312N (Simulation 1) to 357N. For the second
simulation, only the rake angle is changed from �41 to
�81. This modification of the rake angle has generated a
lower shear band frequency (42 kHz) and a slightly higher
cutting force (329N). Therefore, the mismatch between
simulated cutting forces, shear band frequency and
experimental data can be explained by temporal variation
of the cutting conditions induced by vibration or by
uncertainties relating to the experimental settings.
Adiabatic shear bands are sometimes followed by
fracture, as shown in Fig. 22, especially when machining
with a high cutting speed and/or feed. A fracture
criterion implemented into the software could improve
0
2
4
6
8
10
12
14
0 1 2 3 4 5 6
Point n° in the primary shear band
Str
ain
BSF MSF ESF
Near the
tool tip
Chip free
surface
Fig. 18. Strain evolution into the primary shear band for different stages
of chip segment formation. Cutting speed ¼ 180m/min, feed ¼ 0.1mm
(Simulation 4).
88
156
224
20
Temperature (°C)700
632
564
496
428
360
292
Fig. 19. Temperature distribution at the tool–chip interface for a
continuous chip.
Areas at high temperature
Area at low temperature
650
525
587.5
462.5
400
337.5
275
212.5
150
87.5
25
Temperature (°C)
Fig. 20. Temperature distribution at the tool–chip interface. Cutting
speed 180m/min, feed ¼ 0.1mm, Simulation 5.
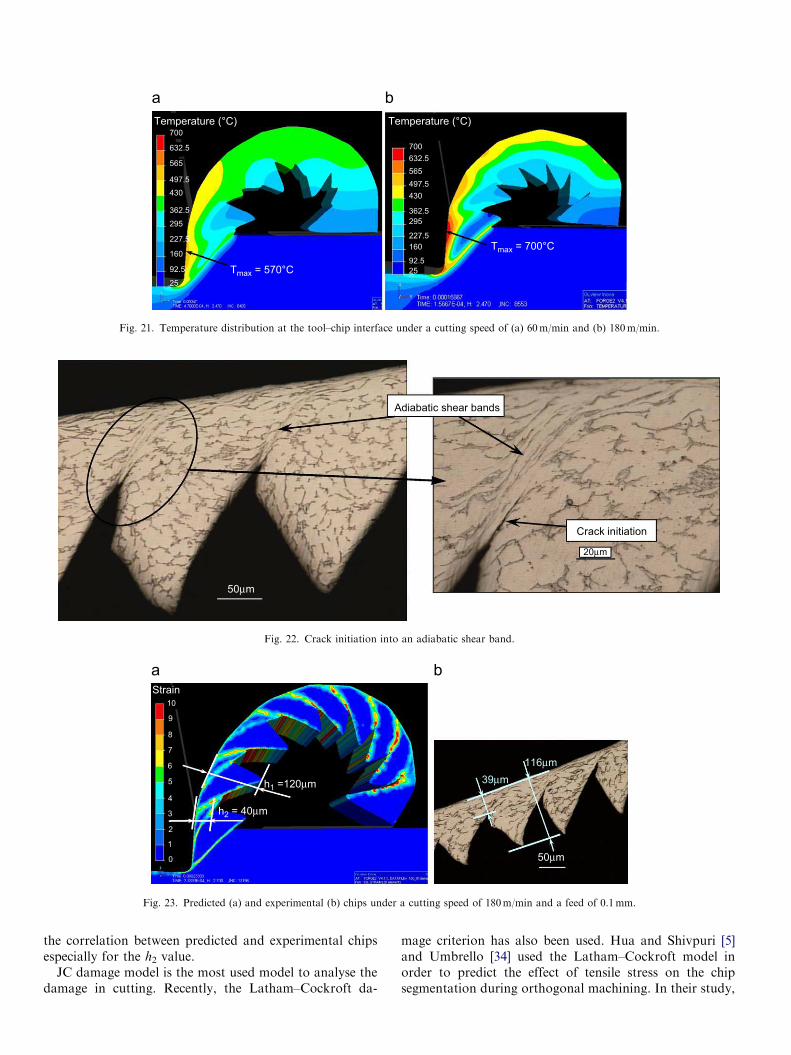
the correlation between predicted and experimental chips
especially for the h2 value.
JC damage model is the most used model to analyse the
damage in cutting. Recently, the Latham–Cockroft da-
mage criterion has also been used. Hua and Shivpuri [5]
and Umbrello [34] used the Latham–Cockroft model in
order to predict the effect of tensile stress on the chip
segmentation during orthogonal machining. In their study,
Tmax = 570°C
700
632.5
565
497.5
430
362.5
295
227.5
160
92.5
25
700
632.5
565
497.5
430
362.5
295
227.5
160
92.5
25
Temperature (°C)
Tmax = 700°C
Temperature (°C)
Fig. 21. Temperature distribution at the tool–chip interface under a cutting speed of (a) 60m/min and (b) 180m/min.
Adiabatic shear bands
Crack initiation
50µm
20µm
Fig. 22. Crack initiation into an adiabatic shear band.
h2 = 40µm
116µm
39µmh1 =120µm
10
9
8
7
6
5
4
3
2
1
0
Strain
50µm
Fig. 23. Predicted (a) and experimental (b) chips under a cutting speed of 180m/min and a feed of 0.1mm.

this damage value is found by an iterative procedure based
on the comparison between predicted and experimental
results concerning chip geometry and cutting forces. It is
also the case for our study, where the damage parameter
value of 2400 seems to generate the best correlation with
the experimental chip. The low values for the damage
parameter (100–400) in the study of Umbrello [34] are
probably due to the mesh size which is high with respect to
the one used in our numerical simulations.
A simulation with a damage criterion was also con-
ducted with the parameters of Simulation 8 and a cutting
speed of 180m/min. The Latham–Cockroft damage
criterion was used for this simulation, with the damage
parameter set to 2400. In that case, the fracture criterion
has generated higher chip segmentation, i.e. the chip
parameters h1 and h2 in Fig. 23(a) are closer to the
experimental values (Fig. 23(b)). A lower shear band
frequency (37.5 kHz) has also been obtained.
4. Conclusions
The choice of the material behaviour law is primordial
for the accuracy of the machining simulation. A correct
simulation includes a good prediction of the chip morphol-
ogy associated with a precise estimation of the cutting and
feed forces. The study has shown that the JC model is not
accurate for machining simulation, giving rise to a
continuous chip while the real chip is segmented when
machining with a cutting speed of 60m/min and a feed of
0.1mm. Also at higher cutting speeds (180m/min) it is not
able to give a good estimation of chip parameters, the
predicted h2 value being two times higher than the
experimental one.
The hypothesis of a material strain softening phenom-
enon enables prediction of a segmented chip under low
cutting speeds and feeds contrary to the JC model. Also the
predicted chip morphology and the strain field distribution
in the chip are in good agreement with experimental
results. The mathematical formulation of the constitutive
law must be improved in order to better predict the cutting
and feed forces, the shear band frequency and also the
transition from a continuous to a serrated chip.
The study has shown that the main reason for the
mismatch between numerical and experimental cutting
forces is the choice of the JC material parameters.
The cutting forces and the shear band frequency are not
very sensitive to the nature of the friction contact between
the chip and the tool during the machining process. Only
the temperature at the tool–chip interface is sensitive to the
contact conditions.
High-speed images showed a tool deflection during
titanium alloy dry machining, giving rise to a variation of
(a) the rake and clearance angles, (b) the local cutting speed
and also generating a rough workpiece surface. Small
variations of both the tool rake angle and the feed induced
significant modifications in terms of predicted forces and
shear band frequencies.
References
[1] E.J.A. Armarego, Predictive modelling of machining operations—a
means of bridging the gap between the theory and practice—a
keynote paper, in: The 13th Symposium on Engineering Applications
of Mechanics, CMSE, Hamilton, Ontario, Canada, 7–9 May 1996.
[2] M.C. Shaw, S.O. Dirke, P.A. Smith, N.H. Cook, E.G. Loewen, C.T.
Yang, Machining Titanium, Massachusetts Institute of Technology,
1954.
[3] R. Komanduri, B.F. Turkovich, New observations on the mechanism
of chip formation when machining titanium alloys, Wear 69 (1981)
179–188.
[4] A. Vyas, M.C. Shaw, Mechanics of saw-tooth chip formation in
metal cutting, Journal of Manufacturing Science and Engineering 121
(1999) 163–172.
[5] J. Hua, R. Shivpuri, Prediction of chip morphology and segmentation
during the machining of titanium alloys, Journal of Materials
Processing Technology 150 (2004) 124–133.
[6] Y. Bai, B. Dodd, Adiabatic Shear Localisation: Occurrence, Theories
and Applications, Pergamon Press, Oxford, 1992.
[7] A.E. Bayoumi, J.Q. Xie, Some metallurgical aspects of chip
formation in cutting Ti–6wt.%Al–4wt.%V alloy, Materials Science
and Engineering A 190 (1995) 173–180.
[8] Z.-B. Hou, R. Komanduri, On a thermo-mechanical model of shear
instability in machining, CIRP Annals 44/1 (1995) 69–73.
[9] M. Baker, J. Rosler, C. Siemers, A finite element model of high speed
metal cutting with adiabatic shearing, Computers and Structures 80
(5,6) (2002) 495–513.
[10] Y.-C. Yen, A. Jain, T. Altan, A finite element analysis of orthogonal
machining using different tool edge geometries, Journal of Materials
Processing Technology 146 (2004) 72–81.
[11] Y.B. Guo, Q. Wen, K.A. Woodbury, Dynamic material behavior
modelling using internal state variable plasticity and its application in
hard machining simulations, Journal of Manufacturing Science and
Engineering 128 (2006) 749–756.
[12] T. Obikawa, E. Usui, Computational machining of titanium alloy—
finite element modelling and a few results, Transactions of the ASME
118 (1996).
[13] S.-H. Rhim, S.-I. Oh, Prediction of serrated chip formation in metal
cutting process with new flow stress model for AISI 1045 steel,
Journal of Materials Processing Technology 171 (2006) 417–422.
[14] L. Li, N. He, A FEA study on mechanisms of saw-tooth chip
deformation in high speed cutting of Ti–6–Al–4V alloy, in: Fifth
International Conference on High Speed Machining (HSM), Metz,
France, 14–16 March 2006, pp. 759–767.
[15] P.J. Arrazola, D. Ugarte, J.A. Villar, S. Marya, Finite element
modelling: a qualitative tool to study high speed machining, in: Fifth
International Conference on High Speed Machining (HSM), Metz,
France, 14–16 March 2006, pp. 239–246.
[16] M. Barge, H. Hamdi, J. Rech, J.-M. Bergheau, Numerical modelling
of orthogonal cutting: influence of numerical parameters, Journal of
Materials Processing Technology 164,165 (2005) 1148–1153.
[17] O. Pantale, J.-L. Bacaria, O. Dalverny, R. Rokotomalala, S.
Caperaa, 2D and 3D numerical models of metal cutting with damage
effects, Computer Methods in Applied Mechanics and Engineering
193 (2004) 4383–4399.
[18] Y.B. Guo, D.W. Yen, A FEM study on mechanisms of discontinuous
chip formation in hard machining, Journal of Materials Processing
Technology 155,156 (2004) 1350–1356.
[19] E. Ceretti, T. Lucchi, T. Altan, FEM simulation of orthogonal
cutting: serrated chip formation, Journal of Materials Processing
Technology 95 (1999) 17–26.
[20] T.D. Marusich, M. Ortiz, Modelling and simulation of high-speed
machining, International Journal of Numerical Methods in Engineer-
ing 38 (21) (1995) 3675–3694.
[21] D.R.J. Owen, M. Vaz Jr., Computational techniques applied to high-
speed machining under adiabatic strain localisation conditions,

Computer Methods in Applied Mechanics and Engineering 171
(1999) 445–461.
[22] M.E. Kassner, M.Z. Wang, M.-T. Perez-Prado, S. Alhajeri,
Large-strain softening of aluminium in shear at elevated tempe-
rature, Metallurgical and Materials Transactions A 33A (2002)
3145–3153.
[23] T. Pettersen, E. Nes, On the origin of strain softening during
deformation of aluminium in torsion to large strains, Metallurgical
and Materials Transactions A 34A (2003) 2727–2736.
[24] E. Doege, H. Meyer-Nnolkemper, I. Saeed, Fliebkurven—Atlas
Metallischer Werkstoffe, Munich, Hanser Verlag, Vienna, 1986.
[25] R.M. Miller, T.R. Bieler, S.L. Semiatin, Flow softening during hot
working of Ti–6Al–4V with a lamellar colony microstructure, Scripta
Materialia 40 (12) (1999) 1387–1393.
[26] R. Ding, Z.X. Guo, Miscrostructural evolution of a Ti–6Al–4V
alloy during b-phase processing: experimental and simulative
investigations, Materials Science and Engineering A 365 (2004)
172–179.
[27] H. Giovanola, Adiabatic shear banding under pur shear loading. Part
II: fractographic and metallographic observation, Mechanics of
Materials 7 (1988) 73–87.
[28] V. Kalhori, Doctoral Thesis, Institutionen for Maskinteknik, Lulea
Tekniska Universitet, 2001.
[29] M. Baker, Finite element simulation of high-speed cutting forces,
Journal of Materials Processing Technology 176 (2006) 117–126.
[30] T.H.C. Childs, Friction modelling in metal cutting, Wear 260 (2006)
310–318.
[31] T. Ozel, The influence of friction models on finite element simulations
of machining, International Journal of Machine Tools and Manu-
facture 46 (5) (2006) 518–530.
[32] L. Filice, F. Micari, S. Rizzuti, D. Umbrello, A critical analysis on the
friction modelling in orthogonal machining, International Journal of
Machine Tools and Manufacture 47 (2007) 709–714.
[33] M. Calamaz, D. Coupard, M. Nouari, F. Girot, A finite element
model of high speed machining of TA6V titanium alloy, in: Sixth
International Conference on High Speed Machining (HSM), San
Sebastian, Spain, 21–22 March 2007 (edited CD).
[34] D. Umbrello, Finite element simulation of conventional and high
speed machining of Ti6Al4V alloy, Journal of Materials Processing
Technology (2007), doi:10.1016/j.jmatprotec.2007.05.007 (accepted
manuscript—unedited).
[35] R. Shivpuri, J. Hua, Microstructure-mechanics interactions in
modeling chip segmentation during titanium machining, CIRP
Annals 51 (2001) 85–89.
[36] W.S. Lee, C.F. Lin, Plastic deformation and fracture behavior of
Ti–6Al–4V alloy, Materials Science and Engineering A 241 (1998)
48–59.
[37] T. Ozel, E. Zeren, Determination of work material flow stress and
friction properties for FEA of machining using orthogonal cutting
tests, Journal of Materials Processing Technology 153,154 (2004)
1019–1025.
[38] H.W. Meyer, D.S. Kleponis, Modeling the high strain rate behavior
of titanium undergoing ballistic impact and penetration, Interna-
tional Journal of Impact Engineering 26 (2001) 509–521.