a new global perspective: yesterday, today and … · a new global perspective: yesterday, today...
TRANSCRIPT
1
Citadel Investment GroupCitadel Investment Group
A New Global Perspective:Yesterday, Today and Tomorrow
A New Global Perspective:Yesterday, Today and Tomorrow
ChicagoMarch 1, 2011
Michael MilkenChairman, The Milken Institute
ChicagoMarch 1, 2011
Michael MilkenChairman, The Milken Institute
• Perception vs. Reality• Perception vs. Reality
A New Global Perspective:Yesterday, Today and Tomorrow
A New Global Perspective:Yesterday, Today and Tomorrow
• Capital Markets
• Building Human Capital
• Toward a New American Century
• Capital Markets
• Building Human Capital
• Toward a New American Century
• Democracy• Disease• Education
• Democracy• Disease• Education
Humanity’s Top 10 Problems for Next 50 Years
Humanity’s Top 10 Problems for Next 50 Years
Education• Energy• Environment• Food• Population• Poverty• Terrorism & War• Water
Education• Energy• Environment• Food• Population• Poverty• Terrorism & War• Water
Humanity’s Top 10 Problems for Next 50 Years
Humanity’s Top 10 Problems for Next 50 Years
EducationEducation• Education• Energy• Education• Energy
Nobel Laureates in Science/Medicine
Nobel Laureates in Science/Medicine
• Democracy• Disease• Education
• Democracy• Disease• Education
• Education• Education• Education
• Education• Education• Education
Humanity’s Top 10 Solutions for Next 50 Years
Humanity’s Top 10 Solutions for Next 50 Years
• Energy• Environment• Food• Population• Poverty• Terrorism & War• Water
• Energy• Environment• Food• Population• Poverty• Terrorism & War• Water
• Energy• Energy• Energy• Education• Education• Education• Energy
• Energy• Energy• Energy• Education• Education• Education• Energy
“Real estate pricescollapsed, creditdried up, house
“Real estate pricescollapsed, creditdried up, housebuilding stopped ...
in 1792.”
building stopped ...
in 1792.”

2
• The stock market dropped 50 percent.
• Banks curtailed lending.
• Commentators predicted widespread industrial bankruptcies
• The stock market dropped 50 percent.
• Banks curtailed lending.
• Commentators predicted widespread industrial bankruptcies
…in 1974.…in 1974.
industrial bankruptcies.
• Unemployment rose quickly.
• Interest rates were volatile.
industrial bankruptcies.
• Unemployment rose quickly.
• Interest rates were volatile.
What is the most valuable real estate in the world?
What is the most valuable real estate in the world?
1. New York City
2. Moscow
1. New York City
2. Moscow
3. London
4. Dubai
5. Beverly Hills
6. Tokyo
3. London
4. Dubai
5. Beverly Hills
6. Tokyo
What is the most valuable real estate in the world?
What is the most valuable real estate in the world?
BlockbusterBlockbuster$4.5 billion$4.5 billion40 Netflix = 1 Blockbuster
Blockbuster vs. Netflix - 2002Market Value
Blockbuster vs. Netflix - 2002Market Value
$$
Netflix$0.16 billion
Netflix$0.16 billion
Blockbuster vs. Netflix - 2011Market Value
Blockbuster vs. Netflix - 2011Market Value
Netflix$11.2 billionNetflix
$11.2 billion431 Blockbusters = 1 Netflix
BlockbusterBlockbuster$26 million$26 million
Source: WSJ.com – 2-25-11
U.S. (23.6%)China (8.7%) Japan (8.6%) Germany (5 2%)
U.S. (23.6%)China (8.7%) Japan (8.6%) Germany (5 2%)
TodayToday
The World’s Top 10 Economies(Percent of World GDP)
The World’s Top 10 Economies(Percent of World GDP)
China (18.5%) U.S. (16.5%) India (12.0%)Brazil (4 8%)
China (18.5%) U.S. (16.5%) India (12.0%)Brazil (4 8%)
20502050 18201820China (28.7%) India (16.0%)France (5.4%) England (5 2%)
China (28.7%) India (16.0%)France (5.4%) England (5 2%) Germany (5.2%)
France (4.4%) U.K. (3.6%)Italy (3.4%) Brazil (3.1%)Canada (2.6%)Russia (2.4%)
Germany (5.2%)France (4.4%) U.K. (3.6%)Italy (3.4%) Brazil (3.1%)Canada (2.6%)Russia (2.4%)
Sources: World Bank/Angus Maddison, “The World Economy: Historical Statistics” (OECD)/PricewaterhouseCoopers/Milken Institute/Goldman Sachs (9/09)
Brazil (4.8%)Indonesia (3.5%)Japan (3.1%)Mexico (3.0%)Russia (2.7%) U.K. (2.3%)Germany (2.3%)
Brazil (4.8%)Indonesia (3.5%)Japan (3.1%)Mexico (3.0%)Russia (2.7%) U.K. (2.3%)Germany (2.3%)
England (5.2%) Prussia (4.9%) Japan (3.1%) Austria (1.9%)Spain (1.9%) U.S. (1.8%) Russia (1.7%)
England (5.2%) Prussia (4.9%) Japan (3.1%) Austria (1.9%)Spain (1.9%) U.S. (1.8%) Russia (1.7%)

3
Market Capitalization: 1950Market Capitalization: 1950
EuropeEurope
Japan9%
Japan9%
Other6%
Other6%
Europe26%
Europe26% U.S.
59%U.S.59%
US + Japan = 68%US + Japan = 68%
Europe17%
Europe17%
JapanJapan
Other14%
Other14%
Market Capitalization: 1988Market Capitalization: 1988
17%17%
U.S.29%U.S.29%
Japan40%
Japan40%
US + Japan = 69%US + Japan = 69%
Europe25%
Europe25%
Japan8%
Japan8%
U SU S
Market Capitalization: 2011Market Capitalization: 2011
U.S.30%U.S.30%
Other37%
Other37%
US + Japan = 38%US + Japan = 38%
2009The Third Greatest Year of Wealth Creation
2009The Third Greatest Year of Wealth Creation
Brazil 143%Russia 129%Indonesia 123%
Brazil 143%Russia 129%Indonesia 123%
Chile 85% China 80%Israel 75%
Chile 85% China 80%Israel 75%Indonesia 123%
Peru 118%Turkey 102%India 97%Argentina 95%Ukraine 91%
Indonesia 123%Peru 118%Turkey 102%India 97%Argentina 95%Ukraine 91%
Israel 75%S. Korea 69%Mexico 51%U.K. 35%U.S. (S&P 500) 23%U.S. (Dow) 18%
Israel 75%S. Korea 69%Mexico 51%U.K. 35%U.S. (S&P 500) 23%U.S. (Dow) 18%
Date: Bloomberg / December 31, 2009
1406%
World Stock Market PerformancePercent Gain (January 2000 to February 24, 2011)
World Stock Market PerformancePercent Gain (January 2000 to February 24, 2011)
962%715%704% EstoniaEstonia
611% RomaniaRomania571% QatarQatar
Sri LankaSri LankaRussiaRussia
PeruPeru
Japan -45%Japan -45%
Source: Bloomberg, February 24, 2011
-100%-100% 900%900% 1200%1200% 1500%1500%
UK -15%UK -15%
600%600%300%300%
429%434%
4% US/DJIA4% US/DJIA2.5% Germany2.5% Germany
418%
0%0%
PakistanPakistanKuwaitKuwait
Czech RepublicCzech Republic
2009The Third Greatest Year of Wealth Creation
2009The Third Greatest Year of Wealth Creation
Brazil 143%Russia 129%Indonesia 123%
Brazil 143%Russia 129%Indonesia 123%
Chile 85% China 80%Israel 75%
Chile 85% China 80%Israel 75%Indonesia 123%
Peru 118%Turkey 102%India 97%Argentina 95%Ukraine 91%
Indonesia 123%Peru 118%Turkey 102%India 97%Argentina 95%Ukraine 91%
Israel 75%S. Korea 69%Mexico 51%U.K. 35%U.S. (S&P 500) 23%U.S. (Dow) 18%
Israel 75%S. Korea 69%Mexico 51%U.K. 35%U.S. (S&P 500) 23%U.S. (Dow) 18%
Date: Bloomberg / December 31, 2009

4
1406%
World Stock Market PerformancePercent Gain (January 2000 to February 24, 2011)
World Stock Market PerformancePercent Gain (January 2000 to February 24, 2011)
962%715%704% EstoniaEstonia
611% RomaniaRomania571% QatarQatar
Sri LankaSri LankaRussiaRussia
PeruPeru
Japan -45%Japan -45%
Source: Bloomberg, February 24, 2011
-100%-100% 900%900% 1200%1200% 1500%1500%
UK -15%UK -15%
600%600%300%300%
429%434%
4% US/DJIA4% US/DJIA2.5% Germany2.5% Germany
418%
0%0%
PakistanPakistanKuwaitKuwait
Czech RepublicCzech Republic
The Nature of CreditThe Nature of Credit
1. Credit is what counts, not leverage.
2. Most loans to real estate are not investment-grade.
1. Credit is what counts, not leverage.
2. Most loans to real estate are not investment-grade.
3. Interest rates are volatile and unpredictable.
4. Credit research is more than ratings.
5. Sovereign debt is historically risky.
6. Debt values underpin all capital markets.
3. Interest rates are volatile and unpredictable.
4. Credit research is more than ratings.
5. Sovereign debt is historically risky.
6. Debt values underpin all capital markets.
High-Yield Corporate Bond Spread1986-2010
1,200
1,400
1,600
1,800
2,000
ds (
basi
s po
ints
)
L t
0
200
400
600
800
1,000
1,200
1986 1988 1990 1992 1994 1996 1998 2000 2002 2004 2006 2008 2010
Hig
h-Yi
eld
Bond
Spr
ead Long-term average
(1986-2010)
Data is as of October 2010.Source: Bloomberg.
Leverage Finance YieldsLeverage Finance Yields
15%
18%
21%
High yield bond yieldHigh yield bond yield
Source: JPMorgan.
6%
9%
12%
15%
86 88 90 92 94 96 98 00 02 04 06 08 10
Institutional loan yieldInstitutional loan yield8.06%8.06%7.03%7.03%
Most Texas Banks were AAA in the 1980sMost Texas Banks were AAA in the 1980s
First RepublicBank CorporationFirst RepublicBank Corporation
The prices of residential real estate in Houston (in real terms) declined 40% from
The prices of residential real estate in Houston (in real terms) declined 40% from te s) dec ed 0% f o 1983-1988.
- OFEHO Housing Index / FRB study
te s) dec ed 0% f o 1983-1988.
- OFEHO Housing Index / FRB study

5
Foreclosures in HoustonForeclosures in Houston
30,00030,000
20,00020,000,,
19801980
10,00010,000
1,0001,00019861986 19921992
Source: Harris County Foreclosure Listing ServiceSource: Harris County Foreclosure Listing Service
Annual U.S. Bank Failures 1979-2007Annual U.S. Bank Failures 1979-2007
200200
150150
Source: FDIC
100100
5050
19801980 19851985 19901990 19951995 20002000 20052005
AAA 16,907AA+ 240AA 2,098AA- 3 414
AAA 16,907AA+ 240AA 2,098AA- 3 414
BB+ 238BB 313BB- 331B+ 339
BB+ 238BB 313BB- 331B+ 339
Investment-Grade SecuritiesInvestment-Grade Securities Non-investment Grade SecuritiesNon-investment Grade Securities
Standard & Poor’s RatingsNew Issues: 1/1/2000 to 9/30/2008
Standard & Poor’s RatingsNew Issues: 1/1/2000 to 9/30/2008
AA- 3,414A 2,602A- 2,027BBB+ 903BBB 1,371BBB- 1,359
AA- 3,414A 2,602A- 2,027BBB+ 903BBB 1,371BBB- 1,359
B+ 339B 330B- 1,189CCC+ 293CCC 214CCC- 104CC 36C 11
B+ 339B 330B- 1,189CCC+ 293CCC 214CCC- 104CC 36C 11
Source: Bloomberg 11/6/08
U.S. Lending to Third-World CountriesAt Face Value
U.S. Lending to Third-World CountriesAt Face Value
$1,300$1,300
$1,500$1,500$ billions$ billions
$700$700
$900$900
$1,100$1,100
19821982 19831983 19841984 19851985 19861986 19871987 19881988 19891989
“When national debts have once been accumulated to a certain degree, there is “When national debts have once been accumulated to a certain degree, there is
Sovereign Debt Has Long Been SuspectSovereign Debt Has Long Been Suspect
scarce, I believe, a single instance of their having been fairly and completely paid.”
Adam Smith
scarce, I believe, a single instance of their having been fairly and completely paid.”
Adam Smith
Secondary Market Prices of Third-World Debt
Secondary Market Prices of Third-World Debt
7070
8080
100100Cents on the dollarCents on the dollar
2020
3030
4040
5050
6060
19821982 19831983 19841984 19851985 19861986 19871987 19881988 19891989
6
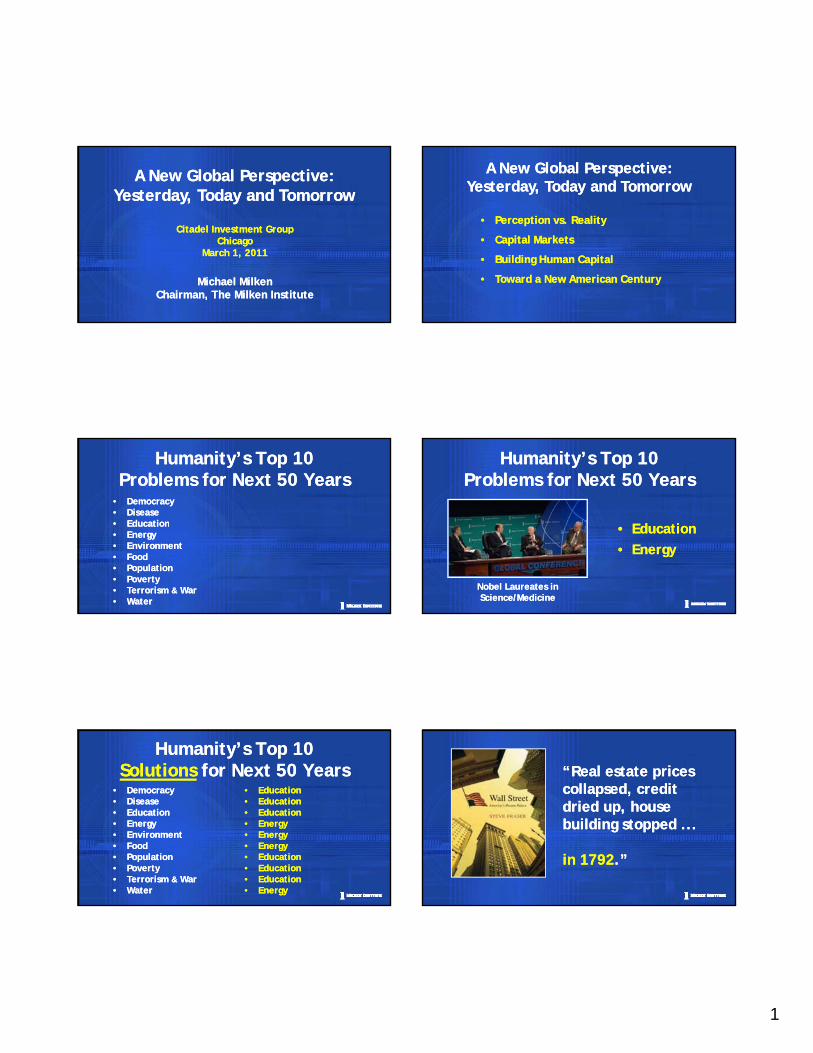
Sovereign Debt DefaultsSovereign Debt DefaultsArgentinaArgentina EcuadorEcuador ParaguayParaguay RomaniaRomania TurkeyTurkey UruguayUruguay
•• 18301830•• 18901890•• 19151915
•• 18321832•• 18681868•• 19111911
•• 18271827•• 18741874•• 18921892
••18761876••19151915••19401940
•• 18761876•• 18911891•• 19151915
••19151915••19331933••19811981
Sources: Sturzenegger and Zettelmayer (2006), Moody‘s, Milken Institute.
•• 19151915•• 1930s1930s•• 19821982•• 20012001
•• 19111911•• 19141914•• 19311931•• 19821982•• 19991999•• 20082008
•• 18921892•• 19201920•• 19321932•• 19861986•• 20032003
••19401940••19781978
•• 19151915•• 19331933•• 19831983•• 20032003
••19811981• Perception vs. Reality• Perception vs. Reality
A New Global Perspective:Yesterday, Today and Tomorrow
A New Global Perspective:Yesterday, Today and Tomorrow
• Capital Markets
• Building Human Capital
• Toward a New American Century
• Capital Markets
• Building Human Capital
• Toward a New American Century
Berkeley1964
Los Angeles Under Siege
P = ProsperityP = Prosperity
P=ΣFti*(ΣHCi+ΣSCi+ΣRAi)P=ΣFti*(ΣHCi+ΣSCi+ΣRAi)P = ProsperityFt = Financial TechnologyHC = Human CapitalSC = Social CapitalRA = Real Assets
P = ProsperityFt = Financial TechnologyHC = Human CapitalSC = Social CapitalRA = Real Assets
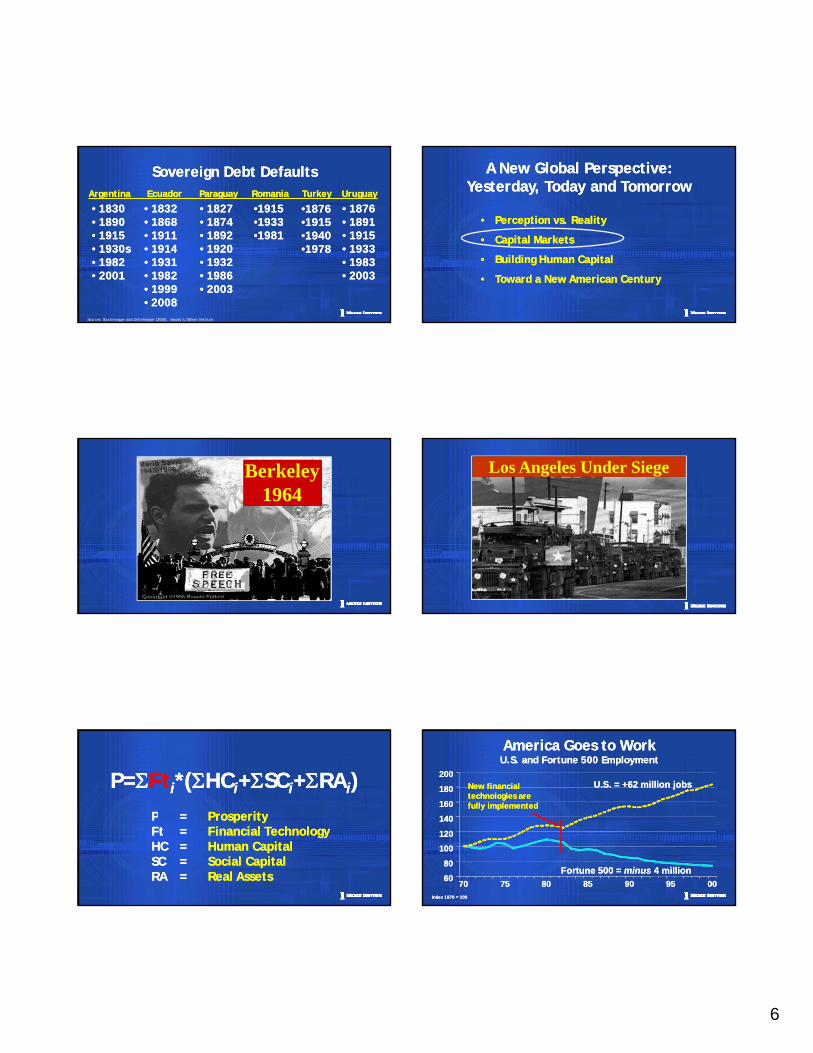
America Goes to WorkU.S. and Fortune 500 EmploymentAmerica Goes to WorkU.S. and Fortune 500 Employment
200200
180180
160160
140140
U.S. = +62 million jobsU.S. = +62 million jobsNew financialtechnologies arefully implemented
New financialtechnologies arefully implemented
0000959590908585808075757070
140140
120120
100100
8080
6060Fortune 500 = minus 4 millionFortune 500 = minus 4 million
Index 1970 = 100Index 1970 = 100

7
Partnering Talent with CapitalPartnering Talent with Capital
Ted TurnerTed Turner
Craig McCawCraig McCaw
Bill McGowanBill McGowan
Research Sales
The Wall Street Pyramid^
Trading
Sales Research
Trading
The $55 Billion MisunderstandingInvesting in the Nifty Fifty
12/31/72 – 12/31/81
The $55 Billion MisunderstandingInvesting in the Nifty Fifty
12/31/72 – 12/31/81
90% of the “Nifty Fifty” showed a 90% of the “Nifty Fifty” showed a negative return over nine years. The average inflation-adjusted
rate of return was -46%.
negative return over nine years. The average inflation-adjusted
rate of return was -46%.
The $55 Billion MisunderstandingInvesting in the Nifty Fifty
12/31/72 – 12/31/81
The $55 Billion MisunderstandingInvesting in the Nifty Fifty
12/31/72 – 12/31/81
The average P/E ratio of these 16 i d d f 66
The average P/E ratio of these 16 i d d f 66 companies dropped from 66 to 11.companies dropped from 66 to 11.
Avon ADP Coke Disney
Dr. Pepper Kodak H-P J&J
Eli Lilly Marriott McDonald’s Merck
Polaroid Rite-Aid Wal-Mart Xerox
Avon ADP Coke Disney
Dr. Pepper Kodak H-P J&J
Eli Lilly Marriott McDonald’s Merck
Polaroid Rite-Aid Wal-Mart Xerox
19741974RESULT #1:
Companies with the highest returns on capital fastest rates of growth in market
RESULT #1:Companies with the highest returns on
capital fastest rates of growth in market capital, fastest rates of growth in market share and employment, and greatest
innovation were denied access to equity and debt capital.
capital, fastest rates of growth in market share and employment, and greatest
innovation were denied access to equity and debt capital.
19741974RESULT #2:
With financial institutions weakened by the recession public and private markets
RESULT #2:With financial institutions weakened by
the recession public and private markets the recession, public and private markets began displacing banks as the source of
most corporate financing.
the recession, public and private markets began displacing banks as the source of
most corporate financing.

8
Institutional Investor Base forNon-investment Grade LoansInstitutional Investor Base forNon-investment Grade Loans
100%
BanksBanks CLOsCLOs Hedge, distressed andhigh-yield fundsHedge, distressed andhigh-yield funds
Prime rate funds, financial and insurance companiesPrime rate funds, financial and insurance companies
Sources: S&P LCD, JPMorgan (4/12/2010).
20%
40%
60%
80%
1994 1995 1996 1997 1998 1999 2000 2001 2002 2003 2004 2005 2006 2007 2008 2009
CompanyCompany
Effects of Regulation … or Just Proposed Regulation
Effects of Regulation … or Just Proposed Regulation
• 1985 – Media attacks high-yield bonds (nomenclature changes to “junk”)
• 1985 – Media attacks high-yield bonds (nomenclature changes to “junk”)
• 1987 – Congress considers limiting tax deductibility of interest on acquisition-related debt
• 1989 – FIRREA (S&L); HLT (banks)
• 1987 – Congress considers limiting tax deductibility of interest on acquisition-related debt
• 1989 – FIRREA (S&L); HLT (banks)
Effects of Regulation … or Just Proposed Regulation
Effects of Regulation … or Just Proposed Regulation
• 1990 – Largest negative rate of return on high-yield bonds (-9-10%)
• 1990 – Largest negative rate of return on high-yield bonds (-9-10%)
• 1991 – Highest rate of return on high-yield bonds in one year since WWII (higher than 1975-76)
• 1990-1991 - High yield-bonds out-perform all investment classes, including equities and government
• 1991 – Highest rate of return on high-yield bonds in one year since WWII (higher than 1975-76)
• 1990-1991 - High yield-bonds out-perform all investment classes, including equities and government
High-Yield Annual Returns 1982 - 1991High-Yield Annual Returns 1982 - 1991
40%40%
30%30%
46.3%46.3%
19821982 19831983 19841984 19851985 19861986 19871987 19881988 19891989 19901990 19911991
20%20%
10%10%
0%0%
-10%-10%
Sources: Bloomberg and Merrill Lynch
Dow Industrials: 1973-76 and 2008-11
11500
13000
900
1000
DJIA, 1973-1976 DJIA, 2008-2011
Feb 28, 2011
5500
7000
8500
10000
500
600
700
800
578 on Dec. 6, 1974 6,547 on March 9, 2009

9
High-Yield Annual Returns 2004 - 2010High-Yield Annual Returns 2004 - 2010
2020
4040
6060PercentPercent
-4040
-2020
00
2020
20042004 20052005 20062006 20072007 20082008 20092009
Sources: Bank of America; Merrill Lynch, July 12, 2010
2010YTD2010YTD
Neutron LegislationLate 1980s
Neutron LegislationLate 1980s
“It was OK to lend money to build a “It was OK to lend money to build a money to build a building, but it wasn’t OK to lend money to any company that would hire a person to work in the building.”
money to build a building, but it wasn’t OK to lend money to any company that would hire a person to work in the building.”
Merck1986 - 1992
Merck1986 - 1992
250$ billions
Market Caps of Top 10 Pharma
$257B
$190B125
0August 1992 April 1994
$190B
"I thought we were doing God's work.”"I thought we were doing God's work.”
- Gordon BinderFormer CEO, Amgen
- Gordon BinderFormer CEO, Amgen
• Perception vs. Reality• Perception vs. Reality
A New Global Perspective:Yesterday, Today and Tomorrow
A New Global Perspective:Yesterday, Today and Tomorrow
• Capital Markets
• Building Human Capital
• Toward a New American Century
• Capital Markets
• Building Human Capital
• Toward a New American Century

10
2010 U.S. Household Balance Sheet$69 Trillion Total
2010 U.S. Household Balance Sheet$69 Trillion Total
Insurance Reserve Funds
20%
Insurance Reserve Funds
20%Other Financial Other Financial
Shares and Securities
33%
Shares and Securities
33%
Loans1%
Loans1%
Deposits and Currency
9%
Deposits and Currency
9%
Source: Federal Reserve Flow of Funds, Q3 2010
Real Estate27%
Real Estate27%
Assets3%
Assets3%
Other tangible7%
Other tangible7%
Gary Becker1992 Nobel Prize in Economics
(at the Milken Institute Global Conference)
Gary Becker1992 Nobel Prize in Economics
(at the Milken Institute Global Conference)
U.S. Financial Assets24%
U.S. Financial Assets24%
Q3 2010 Human Capital in the U.S.$295 Trillion Total
Q3 2010 Human Capital in the U.S.$295 Trillion Total
Human and SocialCapital
76%
Human and SocialCapital
76% Source: Derived from Kevin Murphy and Federal Reserve, Flow of Funds Q3, 2010
Human capitalis the largest asset class.
Human capitalis the largest asset class.
The 21st Century will see a worldwide competition The 21st Century will see a worldwide competition a worldwide competition
for human capital.a worldwide competition
for human capital.
People Make the DifferencePeople Make the Difference
e
487,000
651,000737,000 $30
Att
enda
nce
1984
261,000
1985 1986 1989$15

11
“Innovation has nothing to do with how many R&D dollars you have. When Apple came up with the Mac, IBM was spending at
“Innovation has nothing to do with how many R&D dollars you have. When Apple came up with the Mac, IBM was spending at least 100 times more on R&D. It's about the people you have [and] how you're led.”
-Steve Jobs
least 100 times more on R&D. It's about the people you have [and] how you're led.”
-Steve Jobs
Apple vs. Sony 1997Market Value
Apple vs. Sony 1997Market Value
Sony$34 3 billi
21 Apple = 1 Sony$34.3 billion
Apple$1.65 billion
Apple$1.65 billion
8 Sony = 1 Apple
AppleApple
Apple vs. Sony 2011Market Value
Apple vs. Sony 2011Market Value
Sony$37 billion
Sony$37 billion
Date: February 24, 2011
Apple$321 billion
Apple$321 billion
SingaporeSingapore
Per Capita GDPPer Capita GDP
19601960
$40,336$40,336
20102010
$2,229$2,229
JamaicaJamaica
$4,825$4,825
Source: IFS, WEO;IMF; in 2008 USD
,,
$2,213$2,213
• Perception vs. Reality• Perception vs. Reality
A New Global Perspective:Yesterday, Today and Tomorrow
A New Global Perspective:Yesterday, Today and Tomorrow
• Capital Markets
• Building Human Capital
• Toward a New American Century
• Capital Markets
• Building Human Capital
• Toward a New American Century
Toward a New American CenturyToward a New American Century•• HousingHousing
•• EducationEducation
•• ImmigrationImmigration
•• EntitlementsEntitlements
•• EnergyEnergy
•• Health / Medical ResearchHealth / Medical Research

12
Fallacy:“Any loan to real estate is a good loan … ”
Fallacy:“Any loan to real estate is a good loan … ”
• Low down payments• Tax preferences
Extended payback terms
• Low down payments• Tax preferences
Extended payback terms
The American Dream Turns into A NightmareThe American Dream Turns into A Nightmare
• Extended payback terms• Lack of pre-payment penalties• Non-recourse terms that shield non-housing assets• The myth that housing prices always rise
• Extended payback terms• Lack of pre-payment penalties• Non-recourse terms that shield non-housing assets• The myth that housing prices always rise
The image cannot be displayed. Your computer may not have enough memory to open the image, or the image may have been corrupted. Restart your computer, and then open the file again. If the red x still appears, you may have to delete the image and then insert it again.
The image cannot be displayed. Your computer may not have enough memory to open the image, or the image may have been corrupted. Restart your computer, and then open the file again. If the red x still appears, you may have to delete the image and then insert it again.
The image cannot be displayed. Your computer may not have enough memory to open the image, or the image may have been corrupted. Restart your computer, and then open the file again. If the red x still appears, you may have to delete the image and then insert it again.
The image cannot be displayed. Your computer may not have enough memory to open the image, or the image may have been corrupted. Restart your computer, and then open the file again. If the red x still appears, you may have to delete the image and then insert it again.
The image cannot be displayed. Your computer may not have enough memory to open the image, or the image may have been corrupted. Restart your computer, and then open the file again. If the red x still appears, you may have to delete the image and then insert it again.
The image cannot be displayed. Your computer may not have enough memory to open the image, or the image may have been corrupted. Restart your computer, and then open the file again. If the red x still appears, you may have to delete the image and then insert it again.
WWIWWI WWIIWWIIGreat
DepressionGreat
Depression70’s
Boom70’s
Boom80’s
Boom80’s
BoomLatestBoomLatestBoom30%30%
20%20%
Home prices don’t go up foreverChange in home prices in 100-plus years
Home prices don’t go up foreverChange in home prices in 100-plus years
19901990
Sources: Robert Shiller, Milken Institute.
18901890 19001900 19101910 19201920 19301930 19401940 19501950 19601960 19701970 19801980 20002000 20102010
10%10%
0%0%
-10%-10%
-20%-20%
When Lenders Make Non-Recourse LoansHeads they lose -- Tails they lose
When Lenders Make Non-Recourse LoansHeads they lose -- Tails they lose
• If prices rise, the borrower keeps the gain
• If prices fall, the borrower can
• If prices rise, the borrower keeps the gain
• If prices fall, the borrower can walk, sticking the lender witha long-term depreciating asset
• If interest rates rise, the value ofthe loan depreciates as the “real” average life of the asset is extended
• If interest rates fall, the borrower prepays
walk, sticking the lender witha long-term depreciating asset
• If interest rates rise, the value ofthe loan depreciates as the “real” average life of the asset is extended
• If interest rates fall, the borrower prepays
•• These loans were never worth what the government These loans were never worth what the government
… the biggest problem was government… the biggest problem was government--guaranteed mortgage loans.guaranteed mortgage loans.
said they were worth.said they were worth.
•• They were worth less the day they were issued.They were worth less the day they were issued.•• Lack of call protectionLack of call protection•• High transaction costHigh transaction cost
• An investor can sell 1,000 shares of IBM stock –worth about $165,000 – in less than a second with a transaction cost under $10.
• An investor can sell 1,000 shares of IBM stock –worth about $165,000 – in less than a second with a transaction cost under $10.
High Transaction CostsHigh Transaction Costs
• But a $165,000 house in foreclosure takes months to sell with fix-up costs, commissions and legal fees that can exceed $20,000.
• But a $165,000 house in foreclosure takes months to sell with fix-up costs, commissions and legal fees that can exceed $20,000.

13
Current Home Ownership RatesCurrent Home Ownership Rates
70%70%
75%75%
Sources: EuroStat, HUD, Milken Institute.
50%50%
55%55%
60%60%
65%65%
U.K.U.K. CanadaCanada U.S.U.S. DenmarkDenmark FranceFrance JapanJapan GermanyGermany
Historical U.S. Home Ownership RatesHistorical U.S. Home Ownership Rates
60%
65%
70%
Sources: HUD, Historical Statistics of the United States, Milken Institute.
40%
45%
50%
55%
60%
1900 1910 1920 1930 1940 1950 1960 1970 1980 1990 2000 2010
In the second quarter 2010, the U.S. home ownership rate was 66.9 percent, the lowest since 1999.
In the second quarter 2010, the U.S. home ownership rate was 66.9 percent, the lowest since 1999.
July 27, 2010U.S. Census Bureau
July 27, 2010U.S. Census Bureau
Housing 32.7%Transportation 18.0%Food 12.8%
Housing 32.7%Transportation 18.0%Food 12.8%
Consumer SpendingConsumer SpendingU.S.U.S. AsiaAsia
Food 23%Education 15%Housing 10%
Food 23%Education 15%Housing 10%
Insurance/pensions 11.2%Healthcare 5.7%Entertainment 5.1%Apparel and services 4.1%Cash contributions 3.6%Education 2.0%Personal care products 1.2%
Insurance/pensions 11.2%Healthcare 5.7%Entertainment 5.1%Apparel and services 4.1%Cash contributions 3.6%Education 2.0%Personal care products 1.2% Source: U.S. Bureau of Labor Statistics/CLSA
Clothing 8%Other 8%Transportation 6%Healthcare 5%Communication 5%
Clothing 8%Other 8%Transportation 6%Healthcare 5%Communication 5%
2,1352,135
Average Size of American HousesAverage Size of American Houses
2,5002,500
2 0002 000
square feetsquare feet2,4692,469
2009200919701970 19801980 19901990 20002000 20062006
2,0002,000
1,5001,500
1,0001,000
Source: National Association of Home Builders / U.S. Census Bureau
Housing 32.7%Transportation 18.0%Food 12.8%
Housing 32.7%Transportation 18.0%Food 12.8%
Consumer SpendingConsumer SpendingU.S.U.S. AsiaAsia
Food 23%Education 15%Housing 10%
Food 23%Education 15%Housing 10%
Insurance/pensions 11.2%Healthcare 5.7%Entertainment 5.1%Apparel and services 4.1%Cash contributions 3.6%Education 2.0%Personal care products 1.2%
Insurance/pensions 11.2%Healthcare 5.7%Entertainment 5.1%Apparel and services 4.1%Cash contributions 3.6%Education 2.0%Personal care products 1.2% Source: U.S. Bureau of Labor Statistics/CLSA
Clothing 8%Other 8%Transportation 6%Healthcare 5%Communication 5%
Clothing 8%Other 8%Transportation 6%Healthcare 5%Communication 5%

14
Culture change is coming.America’s priorities will change.
Culture change is coming.America’s priorities will change.
• We’ll spend relatively less on housing, cars and consumables.
• We’ll spend relatively less on housing, cars and consumables.and consumables.
• A greater portion of household income will be allocated to education, medical research and savings.
and consumables.
• A greater portion of household income will be allocated to education, medical research and savings.
Toward a New American CenturyToward a New American Century•• HousingHousing
•• EducationEducation
•• ImmigrationImmigration
•• EntitlementsEntitlements
•• EnergyEnergy
•• Health / Medical ResearchHealth / Medical Research
Between 1870 and 1950, Americans added almost one year of education each decade.
By 1960, the highest average grade level in the U.S. exceeded every other nation by two
Between 1870 and 1950, Americans added almost one year of education each decade.
By 1960, the highest average grade level in the U.S. exceeded every other nation by two the U.S. exceeded every other nation by two years.
Since 1960, we have made no progress and several other nations have surpassed us.
the U.S. exceeded every other nation by two years.
Since 1960, we have made no progress and several other nations have surpassed us.
“If an unfriendly foreign power had attempted to impose on America the mediocre educational
f th t i t
“If an unfriendly foreign power had attempted to impose on America the mediocre educational
f th t i t performance that exists today, we might have viewed it as an act of war.”
- 1983
performance that exists today, we might have viewed it as an act of war.”
- 1983
• Hong Kong 542• Canada 534• Japan 531
Estonia 531
• Hong Kong 542• Canada 534• Japan 531
Estonia 531
How 15-Year-Olds Score in SchoolHow 15-Year-Olds Score in SchoolScienceScience
• Hong Kong 547• South Korea 547• Canada 527
Japan 523
• Hong Kong 547• South Korea 547• Canada 527
Japan 523
MathMath
Source: OECD Programme for International Student Assessment 2006
• Estonia 531• South Korea 522• United Kingdom 515• Germany 513• OECD average 500• Poland 498• United States 489• Russian Federation 479
• Estonia 531• South Korea 522• United Kingdom 515• Germany 513• OECD average 500• Poland 498• United States 489• Russian Federation 479
• Japan 523• Estonia 515• Germany 504• OECD average 498• Poland 495• United Kingdom 495• Russian Federation 476• United States 474
• Japan 523• Estonia 515• Germany 504• OECD average 498• Poland 495• United Kingdom 495• Russian Federation 476• United States 474
The Jobs Problem(It Isn’t Jobs – It’s Trained Workers)
The Jobs Problem(It Isn’t Jobs – It’s Trained Workers)
125125
100100 123,000,000 123,000,000
Millions
Source: Edward Gordon, “Winning the Global Talent Showdown”
7575
5050
2525
high-skilled U.S. jobs will be
available in 2020
high-skilled U.S. jobs will be
available in 2020 50,000,000 Americans will qualify
for those jobs
50,000,000 Americans will qualify
for those jobs

15
Five times more people
are learning English in
China than there are
l i E l d ”
Five times more people
are learning English in
China than there are
l i E l d ”people in England.”
- HSBC Bank
people in England.”
- HSBC Bank
India… India… • Extracurricular activities
consisted of academic coaching in 95% of the households
• Extracurricular activities consisted of academic coaching in 95% of the householdshouseholds.
• 43% of parents want their children to get a Master’s degree; 29% want them to get a PhD.
households.
• 43% of parents want their children to get a Master’s degree; 29% want them to get a PhD.
South KoreaSouth Korea•Spend more on education
(22%) than housing (13%)
•70% of Korean parents
•Spend more on education (22%) than housing (13%)
•70% of Korean parents pexpect their children to work overseas, of which more than half expect their children to work in the US.
pexpect their children to work overseas, of which more than half expect their children to work in the US.
Knowledge UniverseEarly Childhood EducationKnowledge UniverseEarly Childhood Education
Knowledge UniversePrimary and Secondary Education
Knowledge UniversePrimary and Secondary Education
We must not be afraid of competition.
We must not be afraid of competition.
We must be ready to compete.
We must be ready to compete.

16
Eddie “The Eagle” EdwardsEddie “The Eagle” Edwards
• 1988 Calgary Olympics
• Britain’s first (and last!) ski jumper
• 1988 Calgary Olympics
• Britain’s first (and last!) ski jumper
• Last place finish with a jump of 253 feet
• Last place finish with a jump of 253 feet
Matti Nykanen of Finland wins the gold with a jump of 412 feet.
Eddie “The Eagle” EdwardsEddie “The Eagle” Edwards
• 1988 Calgary Olympics
• Britain’s first (and last!) ski jumper
• 1988 Calgary Olympics
• Britain’s first (and last!) ski jumper
• Last place finish with a jump of 253 feet
• Last place finish with a jump of 253 feet
Eddie “The Eagle” Rule:Olympic qualifiers must compete in international events and place in the Top 30 percent or Top 50 competitors.
Eddie “The Eagle” Rule:Olympic qualifiers must compete in international events and place in the Top 30 percent or Top 50 competitors.
Toward a New American CenturyToward a New American Century•• HousingHousing
•• EducationEducation
•• ImmigrationImmigration
•• EntitlementsEntitlements
•• EnergyEnergy
•• Health / Medical ResearchHealth / Medical Research
Highly skilled, entrepreneurial
and educated immigrants are
Highly skilled, entrepreneurial
and educated immigrants are g
crucial to the United States’
prosperity.
g
crucial to the United States’
prosperity.
Doctorates Awarded in the U.S.Doctorates Awarded in the U.S.
• 1/3 of all doctoral students in the U.S. are foreign born, up from one in ten 30 years ago
• 1/3 of all doctoral students in the U.S. are foreign born, up from one in ten 30 years ago
Sources: National Science Foundation/Div of Science Resource Statistics
years ago.
• 84% of their doctorates are in engineering and the sciences.
years ago.
• 84% of their doctorates are in engineering and the sciences.
A 3-Point Plan to Invest in AmericaA 3-Point Plan to Invest in America
• Encourage skilled non-citizen workers and their families to live legally in the U.S.
• Encourage skilled non-citizen workers and their families to live legally in the U.S.
• Retain the students we train.
• Induce entrepreneurs to invest in the American dream.
• Retain the students we train.
• Induce entrepreneurs to invest in the American dream.

17
It’s time to level the playing field.It’s time to level the playing field.
• Canada, the United Kingdom and Australia encourage immigrant investors
• Canada, the United Kingdom and Australia encourage immigrant investors
• Singapore entices leading researchers and technologists to its $2 billion Biopolisbiomedical center.
• Singapore entices leading researchers and technologists to its $2 billion Biopolisbiomedical center.
Albert EinsteinAlbert Einstein
Building Human Capital Through ImmigrationBuilding Human Capital Through Immigration
Jerry YangJerry Yang Madeleine AlbrightMadeleine Albright(Germany)(Germany) (Taiwan)(Taiwan)
Sergey Brin(Russia)
Sergey Brin(Russia)
Alex. Graham Bell(Scotland)
Alex. Graham Bell(Scotland)
(Czechoslovakia)(Czechoslovakia)
Gustavo Dudamel(Venezuela)
Gustavo Dudamel(Venezuela)
Toward a New American CenturyToward a New American Century•• HousingHousing
•• EducationEducation
•• ImmigrationImmigration
•• EntitlementsEntitlements
•• EnergyEnergy
•• Health / Medical ResearchHealth / Medical Research
• Unrealistic assumptions about rates of return on assets
• Unrealistic assumptions about rates of return on assets
Entitlements Entitlements –– The Math Doesn’t Add UpThe Math Doesn’t Add Up
• Falling ratios of current workers to retirees• Workers who pay in to the system for too few years• Pensioners who live longer than the original system
planners assumed.
• Falling ratios of current workers to retirees• Workers who pay in to the system for too few years• Pensioners who live longer than the original system
planners assumed.
When Social Security was introduced in When Social Security was introduced in 1935, the average life span in the U.S. was 1935, the average life span in the U.S. was 61.7 years.61.7 years.
In 2009, life expectancy in the U.S. In 2009, life expectancy in the U.S. reached 78.1 years. reached 78.1 years.
Sources: National Center for Health Statistics, National Vital Statistics Reports, vol. 54, no. 19, June 28, 2006.U.S. Census Bureau, International Database.

18
In many countries, people have come to believe that they could – were entitled to – retire in their fifties.
R f liti ll i ibl
In many countries, people have come to believe that they could – were entitled to – retire in their fifties.
R f liti ll i ibl
Restoring Economic GrowthRestoring Economic Growth
Reform can seem politically impossible.
The U.S. has an opportunity to fix its entitlements dilemma before it reaches an economic tipping point.
Reform can seem politically impossible.
The U.S. has an opportunity to fix its entitlements dilemma before it reaches an economic tipping point.
9595
8585
Longer Life Expectancy; Longer RetirementsFrance
Longer Life Expectancy; Longer RetirementsFrance
Life Expectancy at age 65Life Expectancy at age 65
WomenWomenMenMen
28.628.6 32.932.9
19701970 19801980 19901990 20002000 20102010 20202020 20302030 20402040 20502050
7575
6565
5555
Retirement AgeRetirement Age
14.414.4 18.318.322.022.0 26.526.5
26.226.2 30.830.8
Source: OECD Ageing and Employment Policies, France 2005
Redefining Retirement in the U.S.Redefining Retirement in the U.S. Nationwide Protests in FranceNationwide Protests in France
“Retired at last!”“Retired at last!”
Toward a New American CenturyToward a New American Century•• HousingHousing
•• EducationEducation
•• ImmigrationImmigration
•• EntitlementsEntitlements
•• EnergyEnergy
•• Health / Medical ResearchHealth / Medical Research
What we pay vs. the true cost

19
• Uncertainty faced by investors and producers because of price volatility.
• Uncertainty faced by investors and producers because of price volatility.
Energy ChallengesEnergy Challenges
• The rise in atmospheric greenhouse gases.
• Loss of energy technology leadership.
• The potential for political instability in oil-exporting nations.
• The rise in atmospheric greenhouse gases.
• Loss of energy technology leadership.
• The potential for political instability in oil-exporting nations.
2.5
3.0
70
90
2000 $/barrel 2000 $/gallon
Price Volatility Increases Alternative-Fuel Investment Risk
Price Volatility Increases Alternative-Fuel Investment Risk
Retail GasRetail Gas
1.0
1.5
2.0
10
30
50
1975 1980 1985 1990 1995 2000 2005
Source: Richard Newell, Resources for the Future
Crude OilCrude Oil
“This difficult effort will be “This difficult effort will be the ‘moral equivalent of war’ the ‘moral equivalent of war’
President Jimmy Carter on the energy crisisPresident Jimmy Carter on the energy crisisand proposed energy legislationand proposed energy legislation
---- except that we will be except that we will be uniting our efforts to build uniting our efforts to build and not destroy.”and not destroy.”
40.5%
43.6%Reagan
Carter
36.1%
37.1%Ford
Nixon
Percentage Percentage of Oil from of Oil from F ig F ig
65.5%
66.2%Obama
Bush
47.2%
49.8%Clinton
Bush
gForeign Foreign SourcesSources
Toward a New American CenturyToward a New American Century•• HousingHousing
•• EducationEducation
•• ImmigrationImmigration
•• EntitlementsEntitlements
•• EnergyEnergy
•• Health / Medical ResearchHealth / Medical Research

20
Half of all economic growth in the last two centuries can be traced to medical research advances.
Half of all economic growth in the last two centuries can be traced to medical research advances.to medical research advances.to medical research advances.
Company Value ComparisonU.S. $ billions
Company Value ComparisonU.S. $ billions
Average: Consumer $131.6 19.2(P&G Estée Lauder Coca Cola Pepsi Kraft)
Average: Consumer $131.6 19.2(P&G Estée Lauder Coca Cola Pepsi Kraft)
EnterpriseValue
EnterpriseValue
Est.P/E Ratio
Est.P/E Ratio
(P&G, Estée Lauder, Coca Cola, Pepsi, Kraft)
Average: Pharma $105.3 11.2(Pfizer, J&J, Roche, Norvartis, Merck, GSK, SanofiAventis,Abbott Labs, AstraZeneca, Amgen, BMS and Eli Lilly)
(P&G, Estée Lauder, Coca Cola, Pepsi, Kraft)
Average: Pharma $105.3 11.2(Pfizer, J&J, Roche, Norvartis, Merck, GSK, SanofiAventis,Abbott Labs, AstraZeneca, Amgen, BMS and Eli Lilly)
Source: Bloomberg 1/26/2011
• Invention of the wheel
• Development of agriculture
• Invention of the wheel
• Development of agriculture
Some Great Achievements in HistorySome Great Achievements in History
• The printing press
• Copernican revolution
• Industrial and technology revolutions
• Extension of life expectancy
• The printing press
• Copernican revolution
• Industrial and technology revolutions
• Extension of life expectancy
67Years
55
+18+18
+18+18+36+36
Worldwide Life Expectancy GrowthWorldwide Life Expectancy Growth
18201820 19001900 19501950 20102010
26Years
31Years
49Years
Source: United Nations Development Program
+5+5
Half of all economic growth in the last two centuries can be traced to medical research advances.
Half of all economic growth in the last two centuries can be traced to medical research advances.to medical research advances.to medical research advances.
Company Value ComparisonCompany Value Comparison
Average: Consumer 20.8(P&G, Estée Lauder, Coca Cola, Pepsi, Kraft)
Average: Consumer 20.8(P&G, Estée Lauder, Coca Cola, Pepsi, Kraft)
Est. P/E RatioEst. P/E Ratio
(P&G, Estée Lauder, Coca Cola, Pepsi, Kraft)
Average: Pharma 12.8(Pfizer, J&J, Roche, Norvartis, Merck, GSK, SanofiAventis, Medtronic
Abbott Labs, AstraZeneca, Teva, Amgen, BMS and Eli Lilly, UnitedHealth)
(P&G, Estée Lauder, Coca Cola, Pepsi, Kraft)
Average: Pharma 12.8(Pfizer, J&J, Roche, Norvartis, Merck, GSK, SanofiAventis, Medtronic
Abbott Labs, AstraZeneca, Teva, Amgen, BMS and Eli Lilly, UnitedHealth)
Source: Bloomberg 3/4/2011

21
Top Causes of DeathTop Causes of Death
1. Pneumonia/flu2. Tuberculosis1. Pneumonia/flu2. Tuberculosis
1. Heart disease2. Cancer1. Heart disease2. Cancer
19071907 20102010
Source: AARP Bulletin / June 2007
3. Heart disease4. Diarrhea5. Stroke
3. Heart disease4. Diarrhea5. Stroke
3. Stroke4. Respiratory disease5. Accidents
3. Stroke4. Respiratory disease5. Accidents
Since 1900, childhood death rates from pneumonia Since 1900, childhood death rates from pneumonia and influenza have fallen 93 percent.and influenza have fallen 93 percent.
Three Solutionsto Healthcare Challenges
Three Solutionsto Healthcare Challenges
• Prevention• Prevention
• Cost reduction
• Research leading to cures
• Cost reduction
• Research leading to cures
Lifestyle Makes a DifferenceLifestyle Makes a Difference
30% is spent on hereditary diseases30% is spent on hereditary diseases
70% of health-care spending –about $2.5 trillion – is spent on lifestyle-related diseases.
70% of health-care spending –about $2.5 trillion – is spent on lifestyle-related diseases.
U.S. Economy$14.14 trillionU.S. Economy$14.14 trillion
Sources: CIA Handbook / Centers for Medicare and Medicaid Services (2009)
hereditary diseases.hereditary diseases.
Only in AmericaOnly in America Only in AmericaOnly in America
22
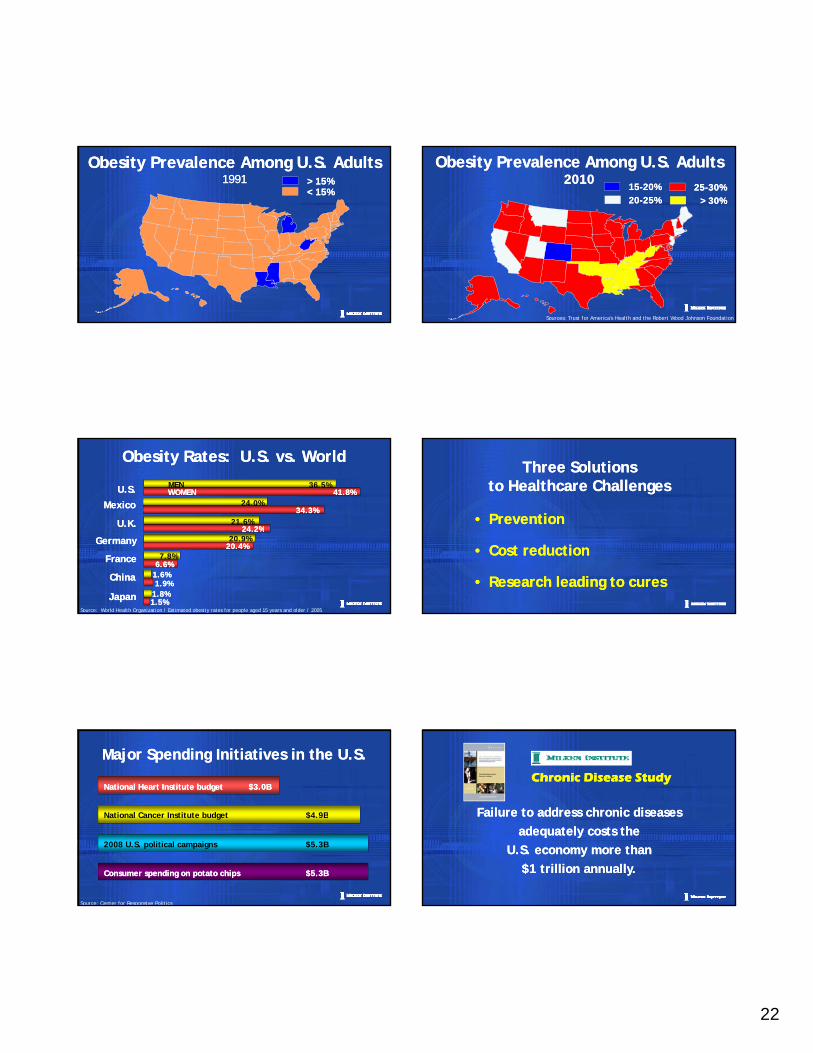
Obesity Prevalence Among U.S. Adults 1991
Obesity Prevalence Among U.S. Adults 1991 > 15%> 15%
< 15%< 15%
Obesity Prevalence Among U.S. Adults 2010
Obesity Prevalence Among U.S. Adults 2010
25-30%25-30%> 30%> 30%
15-20%15-20%20-25%20-25%
Sources: Trust for America's Health and the Robert Wood Johnson Foundation
Obesity Rates: U.S. vs. WorldObesity Rates: U.S. vs. World
20022005
24 2%24 2%
41.8%41.8%
21.6%
36.5%
U.K.U.K.
U.S.U.S. MENWOMENWOMEN
34.3%34.3%24.0%MexicoMexico
Source: World Health Organization / Estimated obesity rates for people aged 15 years and older / 2005 1.5%1.5%
1.9%1.9%
6.6%6.6%
20.4%20.4%
24.2%24.2%
1.8%1.8%
1.6%1.6%
7.8%
20.9%
JapanJapan
ChinaChina
FranceFrance
GermanyGermany
U.K.U.K.
Three Solutionsto Healthcare Challenges
Three Solutionsto Healthcare Challenges
• Prevention• Prevention
• Cost reduction
• Research leading to cures
• Cost reduction
• Research leading to cures
Major Spending Initiatives in the U.S.Major Spending Initiatives in the U.S.
National Cancer Institute budget $4.9B
National Heart Institute budget $3.0BNational Heart Institute budget $3.0B
Source: Center for Responsive Politics
2008 U.S. political campaigns $5.3B
National Cancer Institute budget $4.9B
Consumer spending on potato chips $5.3BConsumer spending on potato chips $5.3B
Failure to address chronic diseases Failure to address chronic diseases
Chronic Disease StudyChronic Disease Study
adequately costs the U.S. economy more than
$1 trillion annually.
adequately costs the U.S. economy more than
$1 trillion annually.

23
Finally, do we have the will to …Finally, do we have the will to …
• Transcend partisan politics?
• Support teachers, but demand accountability?
• Transcend partisan politics?
• Support teachers, but demand accountability?
• Unshackle small- and mid-size businesses?
• Designate medical research funds to young investigators?
• Live … both governments and households … within our means?
• Unshackle small- and mid-size businesses?
• Designate medical research funds to young investigators?
• Live … both governments and households … within our means?
“Never doubt that a small group of thoughtful, committed citizens can change the world: indeed,
“Never doubt that a small group of thoughtful, committed citizens can change the world: indeed, it’s the only thing that does.”
-Margaret Mead
it’s the only thing that does.”
-Margaret Mead
Addressing the Issues(Non-Profit Organizations)
Addressing the Issues(Non-Profit Organizations)
Milken Family Foundation (1982)• Education reform/teacher recognition/medical research
The Milken Institute (1991)• Economics/public-policy research and conferences
Prostate Cancer Foundation (1993)• World’s leading philanthropic source of support for research
FasterCures (2003)• Removing barriers to progress on all life-threatening diseases
Melanoma Research Alliance (2007)• Advancing research on the most-deadly skin cancer
More than 2,500 educators nationwideMore than 2,500 educators nationwide
M lti l thM lti l th• Multiple career paths
• Ongoing applied professional growth
• Instructionally focused accountability
• Performance-based compensation
• Multiple career paths
• Ongoing applied professional growth
• Instructionally focused accountability
• Performance-based compensation
“Far and away the best prize that life offers is the chance to work hard at work worth doing.”
“Far and away the best prize that life offers is the chance to work hard at work worth doing.” wo t do g.
-Theodore Roosevelt
wo t do g.
-Theodore Roosevelt

24
Citadel Investment GroupCitadel Investment Group
A New Global Perspective: Yesterday, Today and Tomorrow
A New Global Perspective: Yesterday, Today and Tomorrow
ChicagoMarch 1, 2011
Michael MilkenChairman, The Milken Institute
ChicagoMarch 1, 2011
Michael MilkenChairman, The Milken Institute