a new approach to measurement system assessment · pdf filea new approach to measurement...
TRANSCRIPT

A New Approach to Measurement System Assessment
Dr. Victor E. Kane
Dr. Lewis VanBrackle
Kennesaw State University
Department of Mathematics and Statistics
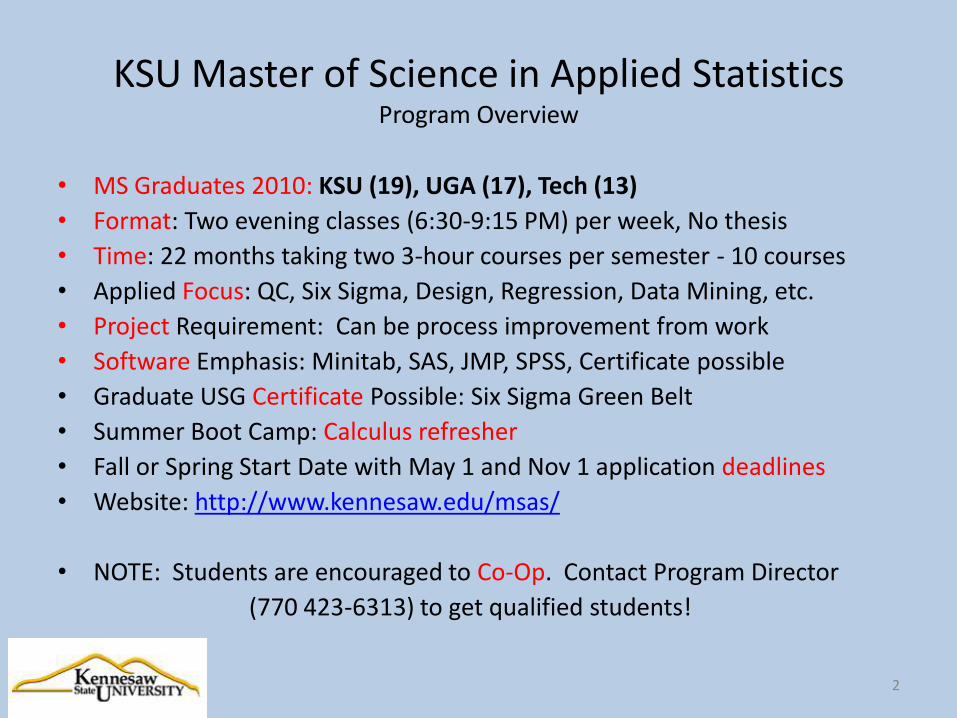
KSU Master of Science in Applied StatisticsProgram Overview
• MS Graduates 2010: KSU (19), UGA (17), Tech (13)
• Format: Two evening classes (6:30-9:15 PM) per week, No thesis
• Time: 22 months taking two 3-hour courses per semester - 10 courses
• Applied Focus: QC, Six Sigma, Design, Regression, Data Mining, etc.
• Project Requirement: Can be process improvement from work
• Software Emphasis: Minitab, SAS, JMP, SPSS, Certificate possible
• Graduate USG Certificate Possible: Six Sigma Green Belt
• Summer Boot Camp: Calculus refresher
• Fall or Spring Start Date with May 1 and Nov 1 application deadlines
• Website: http://www.kennesaw.edu/msas/
• NOTE: Students are encouraged to Co-Op. Contact Program Director
(770 423-6313) to get qualified students!
2

Audience Participation
1)How many have performed a traditional AIAG GRR study?
2)How many have had improvement projects benefit from an MSA study?
3)How many spent money to improve gaging?
4)How many MSA studies assessed accuracy as well as repeatability and reproducibility?
5)How many MSA studies estimated random bias?
3

Introduction to “Little Birdie”
4
Do you want to eat the cake with 395 calories? You say you’re
trying to lose a few pounds???

Little Birdie Propertiesa.k.a. “Our Conscience”
5
• Unforgiving• Has an attitude• Disruptive• Sometimes makes sense• Won’t go away to the cage• Opposite gender
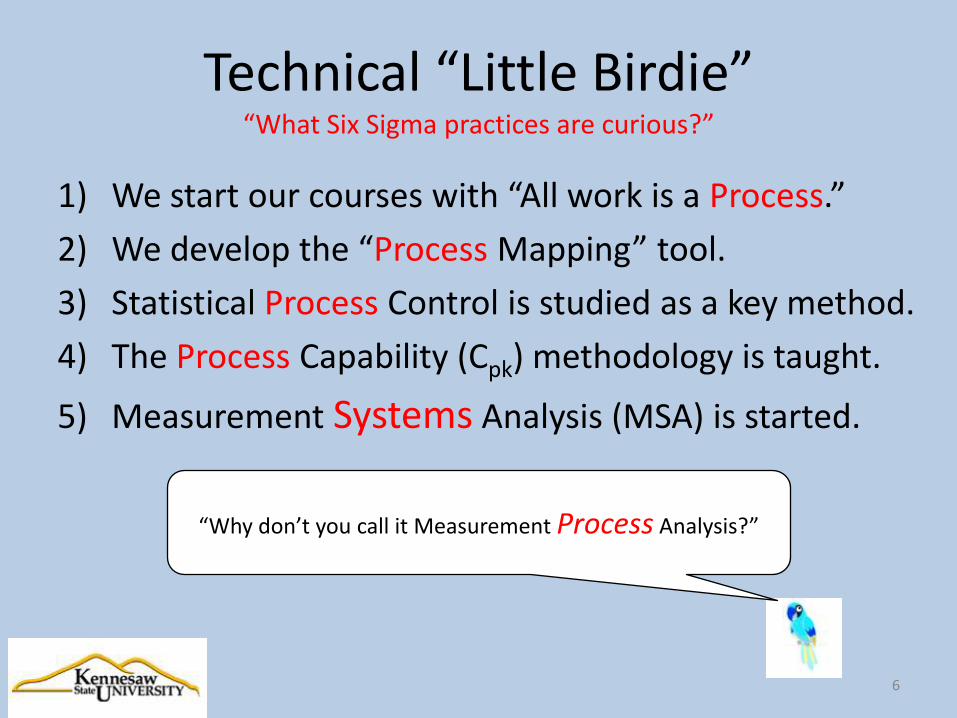
Technical “Little Birdie”“What Six Sigma practices are curious?”
1) We start our courses with “All work is a Process.”
2) We develop the “Process Mapping” tool.
3) Statistical Process Control is studied as a key method.
4) The Process Capability (Cpk) methodology is taught.
5) Measurement Systems Analysis (MSA) is started.
6
“Why don’t you call it Measurement Process Analysis?”

MSA Introduction: Target Charts
7
High
High
Low
Low
Accuracy
Precision
Montgomery “Statistical Quality Control” p. 372

MSA Terminology
• Repeatability : Precision, want <30% of Tolerance
• Reproducibility : Appraiser differences
• Bias: Measured Value – True Value, want 5% of Tolerance
• Approach: Gage Repeatability & Reproducibility (GRR) Study
o ANOVA Method
o Range Method
8
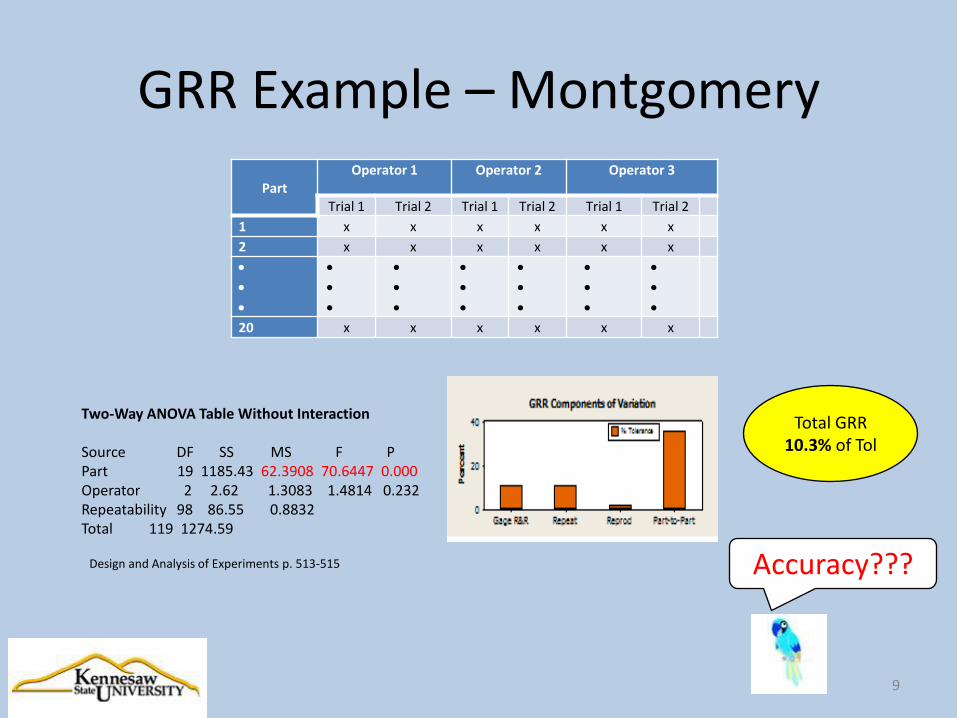
GRR Example – Montgomery
PartOperator 1 Operator 2 Operator 3
Trial 1 Trial 2 Trial 1 Trial 2 Trial 1 Trial 2
1 x x x x x x
2 x x x x x x
20 x x x x x x
9
Two-Way ANOVA Table Without Interaction
Source DF SS MS F PPart 19 1185.43 62.3908 70.6447 0.000Operator 2 2.62 1.3083 1.4814 0.232Repeatability 98 86.55 0.8832Total 119 1274.59
Design and Analysis of Experiments p. 513-515
Total GRR 10.3% of Tol
Accuracy???

Traditional Assessment of AccuracySecond Study Required!!!!!
1) Measure Gage Masters – Use Reference Standard to measure gage masters.
2) Measure Standard Parts – Produce special parts that are “perfect” and measure with Reference Gage and Production Gage.
3) Measure Random Parts – Use Reference Gage to measure random parts. Test bias:
bias (β) = Gage value - Reference value
H0: β = 0
HA: β ≠ 0
10
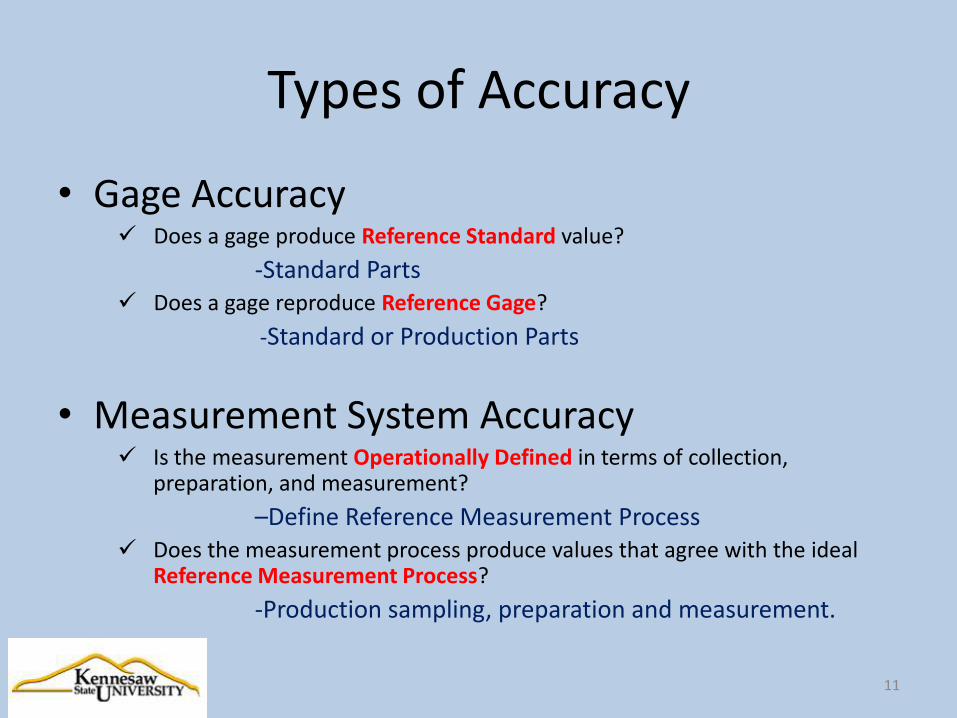
Types of Accuracy
• Gage Accuracy Does a gage produce Reference Standard value?
-Standard Parts Does a gage reproduce Reference Gage?
-Standard or Production Parts
• Measurement System Accuracy Is the measurement Operationally Defined in terms of collection,
preparation, and measurement?
–Define Reference Measurement Process Does the measurement process produce values that agree with the ideal
Reference Measurement Process?
-Production sampling, preparation and measurement.
11

MSA Accuracy ExamplesWhere might accuracy be a concern?
1) Within-Sample Variation
What is the diameter of a hole?
What is the diameter of a hole?
12
Measurement• Minimum Diameter• Average Diameter• Maximum Diameter
Product Application• Pin placed in hole• Air/Liquid flow through hole• Pre-taped hole

MSA Accuracy ExamplesWhere might accuracy be a concern?
2) Sample Condition
Can part condition influence measurements?
Can patient condition influence measurements?
13
One of the most frustrating things about checking your BLOOD PRESSURE is that it can vary greatly not only from day to day, but from moment to moment….. Lower or high blood pressure readings also occur due to the position of your body, your hormone level, and your overall health. … You can monitor your blood pressure if you remember that variance is possible. Medical website.

MSA Accuracy ExamplesWhere might accuracy be a concern?
3) Production vs. Ideal Gaging
Production gaging requires speed, accuracy and repeatability.
14
Column Gage or CMM

MSA Accuracy ExamplesWhere might accuracy be a concern?
4) Nondestructive vs. Destructive Testing
Does a nondestructive test accurately represent a nonproduction destructive test?
15
Airplane Wing Destructive Test

MSA Accuracy ExamplesWhere might accuracy be a concern?
5) Production Appraiser vs. Expert(s)
Do measurements made by production appraisers accurately represent those of highly trained experts?
16
Individual Evaluations vs. Evaluation by Expert(s)

Requirements to Assess Accuracy
17
Measurement SystemAccuracy is important.
How do we do it???

Requirements to Assess Accuracy
1) Operational Definition of Feature Measurement – What is customer-defined measurement intent addressing:
a. Sample Collection
b. Sample Storage
c. Sample Preparation
d. External Feature Requirements (e.g., datum's)
e. Within-Sample Feature Variation
The above are part of a Gaging SOP.
18

Requirements to Assess Accuracy
2) Reference Gage and Method – What is the Gage Reference Standard which establishes the “gold standard” measured value? How should the measurement gage be used to obtain the Operationally Defined measurement?
a. What is the reference-measuring device?
b. How should the gage being assessed be operated to obtain values like the reference standard?
c. Complete the Gaging SOP with these answers.
19
With the Gaging SOP ,it is possible to measure each sample (x) and determine the true reference standard
value (c), which is assumed a constant.

Establishing An Accuracy Standard
20

Gage Accuracy, Repeatability and Reproducibility Model (GARR)
Data Layout
Replace each measured value x with the bias value:
b = x - c
21
PartOperator 1 Operator 2 Operator 3
Trial 1 Trial 2 Trial 1 Trial 2 Trial 1 Trial 2 Reference (c1)
1 x x x x x x c1
2 x x x x x x c2
20 x x x x x x c20

GARR Parameters
22

Types of Bias
• Constant Bias (β)
• Random Bias (σB2)
• What Causes Random Bias?o Within-Sample Variation
o Varying External Samples Variation (datum)
o Variation in Sample Preparation
o Appraiser Measurement Procedure Variation
23
AIAG(p.159): “Within-part variation, such as taper or out-of-round, can cause the measurement system evaluation to provide misleading results. This is because unaccounted
within-part variation affects the estimate of repeatability, reproducibility, or both.”
Why should I care???

Random Bias Example
• Problem: Evaluate MSA variation for a common bathroom scale used in the production weighing of people in the room tonight.
(NOT ACTUALLY!!)
• Production Situation: The measurement SOP requires a measurement to be made tonight.
• Twenty (20) volunteers are selected to span a low-to-high range of weights.
24

RANDOM Bias Example (cont’d)
25
Production Gage Reference
Standard
Gaging SOP requires special sample preparation.
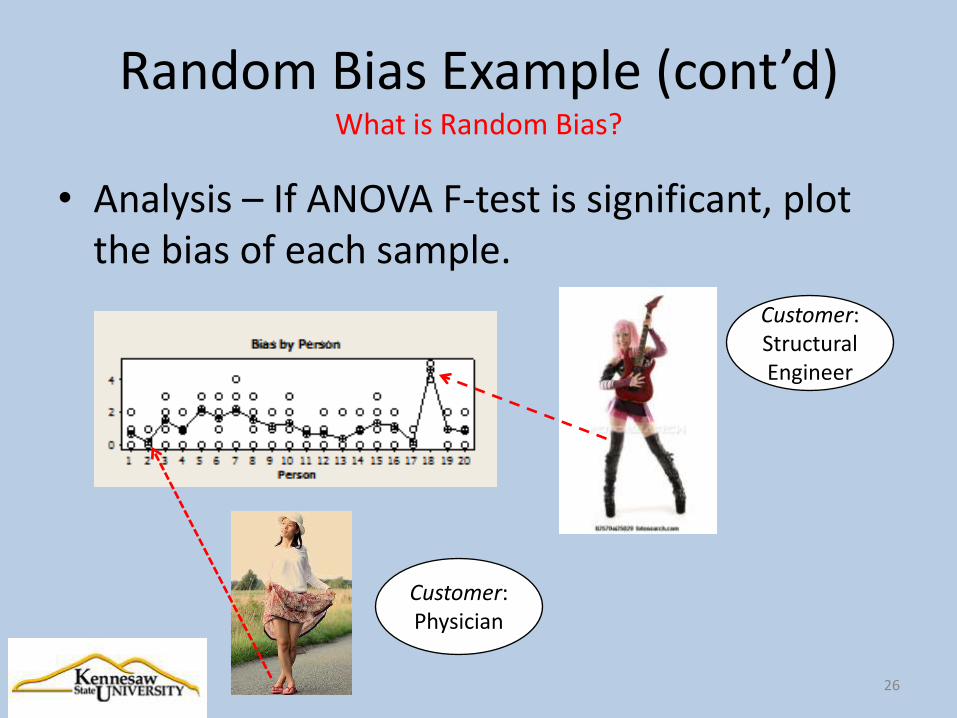
Random Bias Example (cont’d)What is Random Bias?
• Analysis – If ANOVA F-test is significant, plot the bias of each sample.
26
Customer: Structural Engineer
Customer: Physician
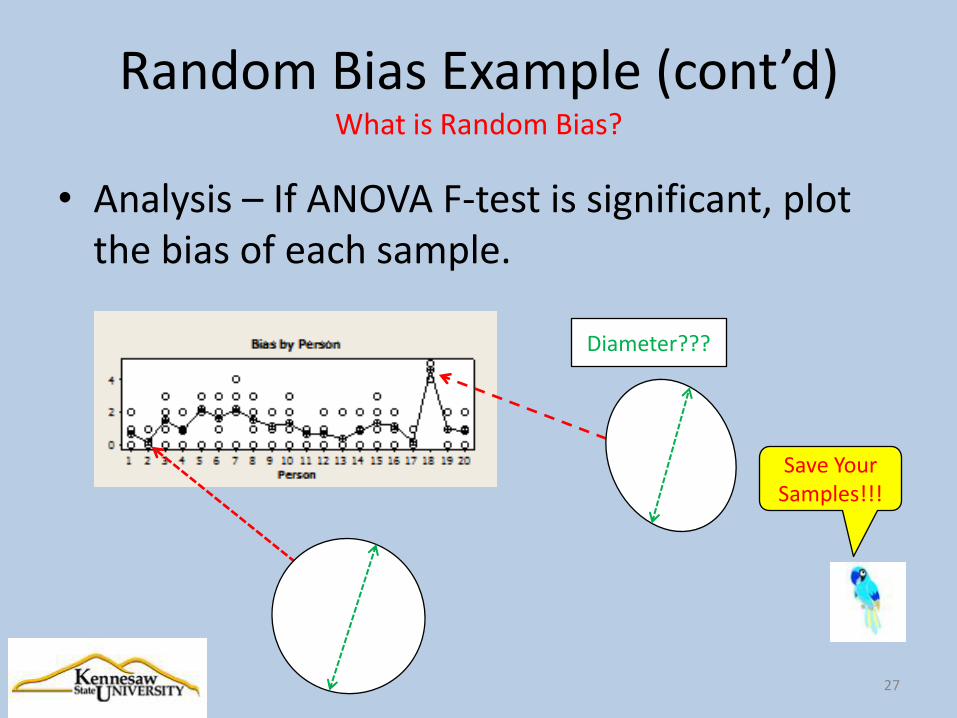
Random Bias Example (cont’d)What is Random Bias?
• Analysis – If ANOVA F-test is significant, plot the bias of each sample.
27
Diameter???
Save Your Samples!!!
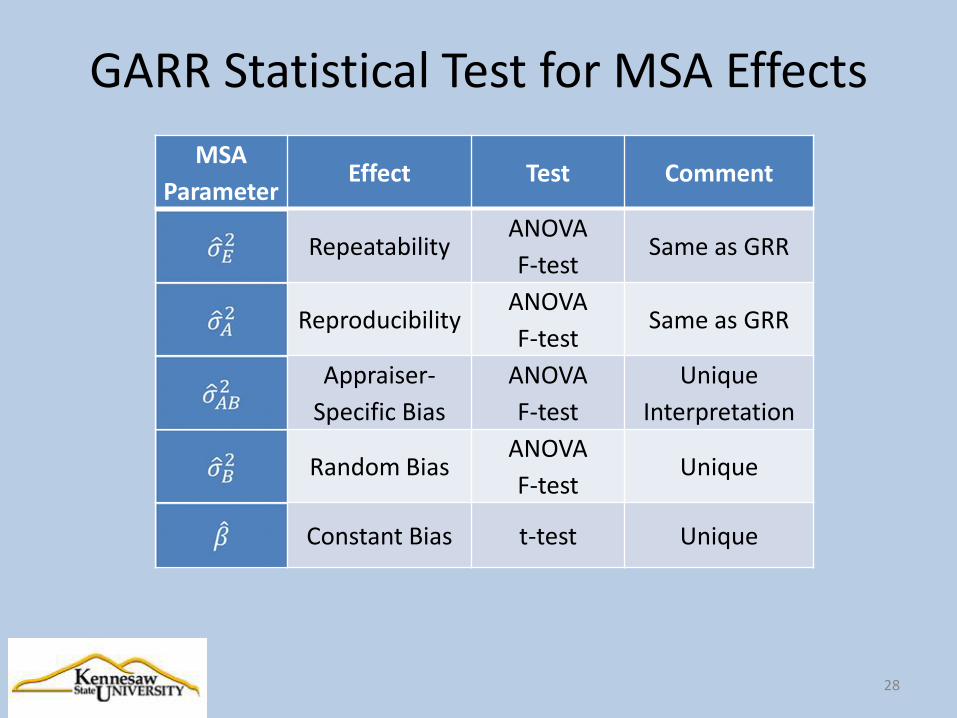
GARR Statistical Test for MSA Effects
28
MSA
ParameterEffect Test Comment
RepeatabilityANOVA
F-testSame as GRR
ReproducibilityANOVA
F-testSame as GRR
Appraiser-
Specific Bias
ANOVA
F-test
Unique
Interpretation
Random BiasANOVA
F-testUnique
Constant Bias t-test Unique

GARR Example – Montgomery (cont’d)Now the 20 Reference Standard ci are determined.
29
Study Var %ToleranceSource StdDev (SD) (6 * SD) (SV/Toler)Total Gage R&R 0.94541 5.67244 10.31Repeatability 0.93977 5.63861 10.25Reproducibility 0.10310 0.61859 1.12
Operator 0.10310 0.61859 1.12Accuracy 0.53018 3.18111 5.78
Total Variation 1.08392 6.50354 11.82
X
MSA = [Repeatability + Reproducibility + Accuracy]/Tol= [ 5.64 + 0.62 + 3.18 ]/Tol= 17.2% vs. GRR of 10.3%
Old Part-to-Part Line
Same as GRR

GARR Example - Diagnostics
• ConclusionsRepeatability (10%) & Reproducibility (1%) are not a major concern (like GRR).
Random bias (5%) is significant. Repeatability may be improved by looking for differences in parts 17 and 18.
There is a significant negative constant bias (2%) impacting all measurements. This bias does not change with size.
30
Look for High Bias Parts Look for Bias Patterns by Size

GARR Example - Summary
31
Opportunity: What is the impact of Random Bias on Repeatability??

Advantages of Using GARR
1) A well thought out, customer focused Operational Definition of the measured feature will likely improve all measurements using a Gaging SOP.
2) All GRR estimates are maintained.
3) Statistical tests for significant random and constant bias complete the MSA assessment. NO second study of accuracy is needed.
4) A total assessment of MSA variation is obtained.
5) Costs may be reduced through better focused problem solving in addressing significant R&R variation.
32
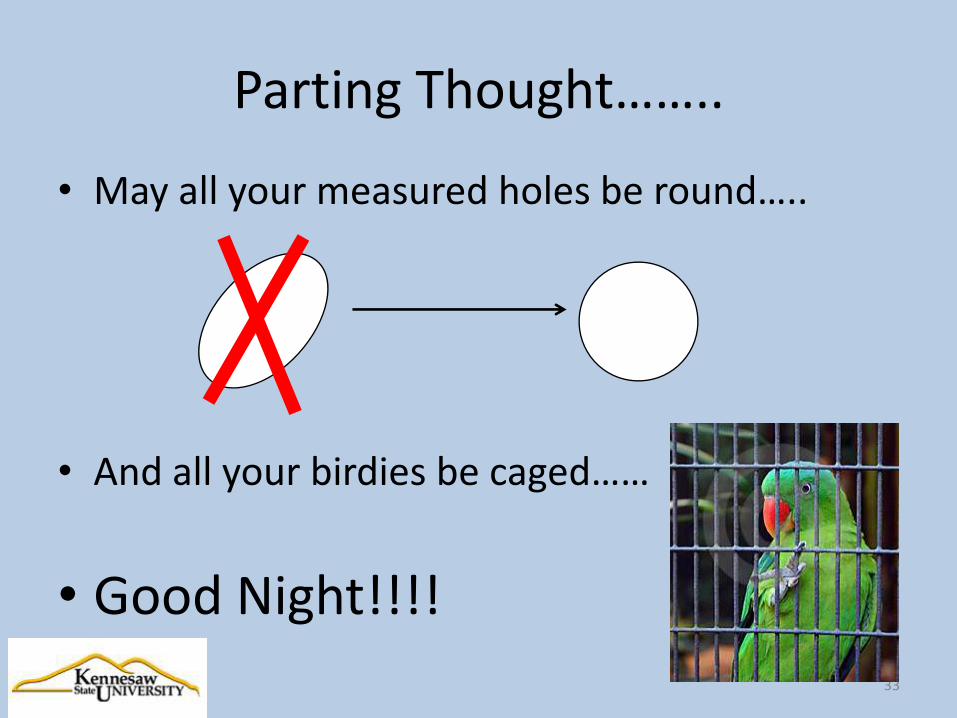
Parting Thought……..
• May all your measured holes be round…..
• And all your birdies be caged……
• Good Night!!!!
33