a mutual fund is a trust that pools the savings of a number … · web viewbirla sun life mutual...
TRANSCRIPT

Chapter 1
INTRODUCTION

INTRODUCTION
A Mutual Fund is a trust that pools the savings of a number of investors who
share a common financial goal. Anybody with an investible surplus of as little as a few
hundred rupees can invest in Mutual Funds. These investors buy units of a particular
Mutual Fund scheme that has a defined investment objective and strategy. The money
thus collected is then invested by the fund manager in different types of securities. These
could range from shares to debentures to money market instruments, depending upon the
scheme’s stated objectives. The income earned through these investments and the capital
appreciation realized by the scheme are shared by its unit holder in proportion to the
number of units owned by them. Thus a Mutual Fund is the most suitable investment for
the common man as it offers an opportunity to invest in a diversified, professionally
managed basket of securities at a relatively low cost.
One of the best investment vehicles that pools huge quantum of money
from small investors to create wider portfolio is mutual fund. Mutual fund is considered
to be the investment avenue for risk aviators managed by technically compliant managers
to fetch the best returns with in the spectrum of assured minimized risk. But the recent
trends of Indian capital markets witnessed that investors in mutual funds were also
compelled to book losses. Considerable number of open ended funds have fetched the
rate of returns less than that of fixed deposits schemes of the banks in the past two
financial years that is between
Mutual Fund Operation Flow Chart:
2

Organization of a Mutual Fund
There are many entities involved and the diagram below illustrates the organizational set up of a mutual fund:
WORKING OF MUTUAL FUNDS
3

Regulatory Authorities:
Mutual funds are considered as one of the best available investments as compare to others they are very cost efficient and also easy to invest in, thus by pooling money together in a mutual fund, investors can purchase stocks or bonds with much lower trading costs than if they tried to do it on their own. But the biggest advantage to mutual funds is diversification, by minimizing risk & maximizing returns.
4

NEED OF THE STUDY
1. Mutual funds are one of the most important financial service vehicles for
investments. Over the past 46 years. The Indian mutual fund industry had witnessed
impressive growth in Assets Under Management (AUM).
2. In India, the Asset Management Companies market their investment products
largely through AMFI Certified Agents, service centers and company’s web portals.
3. Investors require certain types of information for making conscientious and
informed decisions for their financial security.
4. The study aims at identifying the information needs of retail investors for making
informed decisions with regard to investment in mutualfund products and its implications
for online marketing of mutual fund products in India.
5. The information displayed at the websites is comprehensive but there is no
standard format in which the information is provided. An average investor would not
have skills and time collate and compare the required information among different funds.
5

Importance of the studyWealth creation over the years has changed its avenues and area of interest for the investors in India. The prototype investment where the post offices and typically the scheduled banks through savings and fixed deposits have changed and with the awareness of finance, mutual fund has became an excellent route to create wealth for the public at large.“Mutual fund is a pool of money is invested in accordance with the common objective stated before the investment to the investors”.Here is the concept of mutual fund which is a suitable for the common man as it offers an opportunity to invest and diversified, professionally managed basket of securities comparatively at low cost. The investors pool there money to the fund manager and the fund manager invest the money in the securities and after generating returns passed back to the investors.The mutual fund has a structure which is regulated by SEBI and the Association of mutual funds of India (AMFI) plays an advisory role for the mutual fun
6

Objectives of the study Understanding the functional nittigrity of mutual funds in India.
Comparative analysis of open ended funds at the selected company.
Comparison of sectorial funds.
ADD MORE OBJECTIVES
Research methodology
Primary data: As far as my study is concern I collected the theoretical data from the AMFI INDIA Online site, Mutual fund Wikipedia. And SBI Mutual funds and HDFC Mutual funds.
Secondary data: As far as my study is concern I depended on secondary source for the collection of data. For the data analysis I downloaded the trend values from AMFI INDIA and the calculation part will based on the following formula the formula is as fallows.
The holding period returns of the selected funds shall be calculated using the following formulae:
= ( Closing NAV of the quarter - opening NAV of the quarter ) *100
7

Closing NAV of the quarter
Scope of the studyMutual funds have grown enormously over the years. In the first age of mutual funds, when the investment management companies started to offer mutual funds, choices were few. Even though people invested their money in mutual funds as these funds offered them diversified investment option for the first time. By investing in these funds they were able to diversify their investment in common stocks, preferred stocks, bond and other financial securities. At the same time also enjoyed the advantage of liquidity.
Limitations of the project:
1) It ignores transaction costs.
2) It considers only holding period returns and not the risk factors.
3) It confines to a single asset management company.
4) Tax rates are ignored while calculating holding period returns.
8

CHAPTER –II
Review of literature
TYPESOF MUTUALFUND SCHEMES
There are a wide variety of Mutual Fund schemes that cater to your needs, whatever your age, financial position, risk tolerance and return expectations. Whether as the foundation of your investment programmer or as a supplement, Mutual Fund schemes can help you meet your financial goals?
By structure
9
Open-Ended Schemes
These do not have a fixed maturity. You deal with the Mutual Fund for your investments and redemptions. The key feature is liquidity. You can conveniently buy and sell your units at Net Asset Value (NAV) related prices, at any point of time.
Close –Ended Schemes
Schemes that have a stipulated maturity period (ranging from 2 to 15 years) are called close ended schemes. You can invest in the scheme at the time of the initial issue and thereafter you can buy or sell the units of the scheme on the stock exchanges where they are listed. The market price at the stock exchange could vary from the scheme’s NAV on account of demand and supply situation, unit holders’ expectations and other market factors. One of the characteristics of the close-ended schemes is that they are generally traded at a discount to NAV; but closer to maturity, the discount narrows. Some close-ended schemes give you an additional option of selling your units to the Mutual Fund through periodic repurchase at NAV related prices. SEBI Regulations ensure that at least one of the two exit routes are provided to the investor under the close ended schemes.
Interval Schemes
These combine the features of open-ended and close-ended schemes. They may be traded on the stock exchange or may be open for sale or redemption during predetermined intervals at NAV related prices
By Investment Objective
Why do Mutual Funds come out with different schemes?
A Mutual Fund may not, through just one portfolio, be able to meet the investment objectives of all their Unit holders. Some Unit holders may want to invest in risk-bearing securities such as equity and some others may want to invest in safer securities such as bonds or government securities. Hence, the Mutual Fund comes out with different schemes, each with a different investment objective.
Growth Schemes
Growth Schemes are also known as equity schemes. The aim of these schemes is to provide capital appreciation over medium to long term. These schemes normally invest a major part of their fund in equities and are willing to bear short-term decline in value for possible future appreciation.
10

Income Schemes
Income Schemes are also known as debt schemes. The aim of these schemes is to provide regular and steady income to investors. These schemes generally invest in fixed income securities such as bonds and corporate debentures. Capital appreciation in such schemes may be limited.
Balanced SchemesBalanced Schemes aim to provide both growth and income by periodically distributing a part of the income and capital gains they earn. These schemes invest in both shares and fixed income securities, in the proportion indicated in their offer documents (normally 50:50).
Money Market SchemesMoney Market Schemes aim to provide easy liquidity, preservation of capital and moderate income. These schemes generally invest in safer, short-term instruments, such as treasury bills, certificates of deposit, commercial paper and inter-bank call money.
OTHER SCHEMES
Tax Saving Schemes :
Tax-saving schemes offer tax rebates to the investors under tax laws prescribed from time to time. Under Sec.88 of the Income Tax Act, contributions made to any Equity Linked Savings Scheme (ELSS) are eligible for rebate
Index Schemes :Index schemes attempt to replicate the performance of a particular index such as the BSE Sensex or the NSE 50. The portfolio of these schemes will consist of only those stocks that constitute the index. The percentage of each stock to the total holding will be identical to the stocks index weight age. And hence, the returns from such schemes would be more or less equivalent to those of the Index.
11

Sector Specific Schemes :These are the funds/schemes which invest in the securities of only those sectors or industries as specified in the offer documents. e.g. Pharmaceuticals, Software, Fast Moving Consumer Goods (FMCG), Petroleum stocks, etc. The returns in these funds are dependent on the performance of the respective sectors/industries. While these funds may give higher returns, they are more risky compared to diversified funds. Investors need to keep a watch on the performance of those sectors/industries and must exit at an appropriate time.
TYPES OF RETURNS
What are the types of returns one can expect from a Mutual Fund?
Mutual Funds give returns in two ways - Capital Appreciation or Dividend Distribution.
Capital Appreciation :
An increase in the value of the units of the fund is known as capital appreciation. As the value of individual securities in the fund increases, the fund's unit price increases. An investor can book a profit by selling the units at prices higher than the price at which he bought the units.
Dividend Distribution :
The profit earned by the fund is distributed among unit holders in the form of dividends. Dividend distribution again is of two types. It can either be re-invested in the fund or can be on paid to the investor.
There are three ways, where the total returns provided by mutual funds can be enjoyed by investors :
Income is earned from dividends on stocks and interest on bonds. A fund pays out nearly all income it receives over the year to fund owners in the form of a distribution.
If the fund sells securities that have increased in price, the fund has a capital gain. Most funds also pass on these gains to investors in a distribution.
If fund holdings increase in price but are not sold by the fund manager, the fund's shares increase in price. You can then sell your mutual fund shares for a profit. Funds
12
will also usually give you a choice either to receive a check for distributions or to reinvest the earnings and get more shares
BY NATURE Equity fund :
These funds invest a maximum part of their corpus into equities holdings. The structure of the fund may vary different for different schemes and the fund manager’s outlook on different stocks. The Equity Funds are sub-classified depending upon their investment objective, as follows:
o Diversified Equity Funds o Mid-Cap Funds o Sector Specific Funds o Tax Savings Funds (ELSS)
Equity investments are meant for a longer time horizon, thus Equity funds rank high on the risk-return matrix.
Debt funds : The objective of these Funds is to invest in debt papers. Government authorities, private companies, banks and financial institutions are some of the major issuers of debt papers. By investing in debt instruments, these funds ensure low risk and provide stable income to the investors. Debt funds are further classified as
Gilt Funds: Invest their corpus in securities issued by Government, popularly known as Government of India debt papers. These Funds carry zero Default risk but are associated with Interest Rate risk. These schemes are safer as they invest in papers backed by Government
Income Funds: Invest a major portion into various debt instruments such as bonds, corporate debentures and Government securities.
MIPs: Invests maximum of their total corpus in debt instruments while they take minimum exposure in equities. It gets benefit of both equity and debt market. These scheme ranks slightly high on the risk-return matrix when compared with other debt schemes.
Short Term Plans (STPs): Meant for investment horizon for three to six months. These funds primarily invest in short term papers like Certificate of Deposits
13
(CDs) and Commercial Papers (CPs). Some portion of the corpus is also invested in corporate debentures.
Liquid Funds: Also known as Money Market Schemes, These funds provides easy liquidity and preservation of capital. These schemes invest in short-term instruments like Treasury Bills, inter-bank call money market, CPs and CDs. These funds are meant for short-term cash management of corporate houses and are meant for an investment horizon of 1day to 3 months. These schemes rank low on risk-return matrix and are considered to be the safest amongst all categories of mutual funds.
Balanced funds :As the name suggest they, are a mix of both equity and debt funds. They invest in both equities and fixed income securities, which are in line with pre-defined investment objective of the scheme. These schemes aim to provide investors with the best of both the worlds. Equity part provides growth and the debt part provides stability in returns.
ADVANTAGES OF MUTUAL FUNDS
The advantages of investing in a Mutual Fund are: Professional Management Diversification Convenient Administration Return Potential Low Costs Liquidity Transparency Flexibility Choice of schemes Tax benefits Well regulated
Advantages of Investing Mutual Funds :
Professional Management –
14

The basic advantage of funds is that, they are professional managed, by well qualified professional. Investors purchase funds because they do not have the time or the expertise to manage their own portfolio. A mutual fund is considered to be relatively less expensive way to make and monitor their investments.
Diversification –
purchasing units in a mutual fund instead of buying individual stocks or bonds, the investors risk is spread out and minimized up to certain extent. The idea behind diversification is to invest in a large number of assets so that a loss in any particular investment is minimized by gains in others.
Economies of Scale –
Mutual fund buy and sell large amounts of securities at a time, thus help to reducing transaction costs, and help to bring down the average cost of the unit for their investors.
Liquidity –
Just like an individual stock, mutual fund also allows investors to liquidate their holdings as and when they want.
Simplicity –
Investments in mutual fund are considered to be easy, compare to other available instruments in the market, and the minimum investment is small. Most AMC also have automatic purchase plans whereby as little as Rs. 2000, where SIP start with just Rs.50 per month basis.
Disadvantages of Investing Mutual Funds :
Professional Management –
Some funds doesn’t perform in neither the market, as their management is not dynamic enough to explore the available opportunity in the market, thus many investors debate over whether or not the so-called professionals are any better than mutual fund or investor him self, for picking up stocks.
Costs –
The biggest source of AMC income, is generally from the entry & exit load which they charge from an investors, at the time of purchase. The mutual fund industries are thus charging extra cost under layers of jargon.
15

Dilution –
Because funds have small holdings across different companies, high returns from a few investments often don't make much difference on the overall return. Dilution is also the result of a successful fund getting too big. When money pours into funds that have had strong success, the manager often has trouble finding a good investment for all the new money.
Taxes –
When making decisions about your money, fund managers don't consider your personal tax situation. For example, when a fund manager sells a security, a capital-gain tax is triggered, which affects how profitable the individual is from the sale. It might have been more advantageous for the individual to defer the capital gains liability. this project is therefore constructed to investigate the performance of open ended funds in the said time period to analyse whether open ended funds are lucrative for mid term investment or not in this persuit the following preliminary objectives are proposed to be tested.
COMPARISION OF OTHER AVENUES WITH MUTUAL FUNDS The mutual fund sector operates under stricter regulations as compared to most other investment avenues. Apart from offering investors tax efficiency and legal comfort, how do mutual funds compare with other products?
Company fixed deposits versus mutual funds
Fixed deposits are unsecured borrowings by the company accepting the deposit. Credit rating of the fixed deposit program is an indication of the inherent default risk in the investment. The money of investors in a mutual fund scheme are invested by the AMC in specific investments under that scheme. These investments are held and managed in-trust for the benefit of the scheme’s investors. On the other hand, there is no such direct correlation between a company’s fixed deposit mobilization, and the avenues where it deploys these resources. There can be no certainity of yield, unless a named guarantor assures a return or, to a lesser extent, if the investment is in a serial gilt scheme. On the other hand, the return under a fixed deposit is certain, subject only to the default risk of the borrower. The basic value at which fixed deposits are encashable is not subject to market risk. However, the value at which units of a scheme are redeemed entirely depends on the market. If securities have gained in value during the period, then the investor can even
16

earn a return that is higher than what anticipated when invested. Conversely, could also end up with a loss. Early encashment of fixed deposits is always subject to a penalty charged by the company that accepted the fixed deposit. Mutual fund schemes also have the option of charging a penalty on “early” redemption of units (by way of an “exit load”).
BANK FIXED DEPOSITS VERSUS MUTUAL FUNDS.
Bank fixed deposits are similar to company fixed deposits. The major difference is that banks are more stringently regulated than are companies. They even operate under stricter requirements regarding statutory liquidity ratio (SLR) and cash reserve ratio(CRR) mandated by RBI. While the above are causes for comfort, bank deposits too are subject to default risk. However, given the political and economic impact of bank defaults, the government as well as reserve bank of India (RBI) tries to ensure that banks do not fail. Further bank deposits up to 1,00,000. is for all the deposits in all the branches of a bank, held by the depositor in the same capacity and right.
BONDS AND DEBENTURES VERSES MUTUAL FUNDS.As in the case of fixed deposits, credit rating of a bond or debenture is an indication of the inherent default risk in the investment. However, unlike fixed deposits, bonds and debentures are transferable securities. While an investor may have an early encashment option from the issuer (for instance through a “put” option), liquidity is generally through a listing in the market. Implications of this are: the value that the investor would realize in an early exit is subject to market risk. The investor could have a capital gain or a capital loss. This aspect is similar to a mutual fund scheme.A hypothecation or mortgage of identified fixed and / or current assets could back debt securities, e.g. secured bonds or debentures. In such case, if there is a default, the identified assets become available for meeting redemption requirements.An unsecured bond or debenture is for all practical purposes like a fixed deposit, as far as access to assets is concerned.A custodian for the benefit of investors in the scheme holds the investments of a mutual fund scheme.
EQUITY VERSUS M UTUAL FUNDS. Investment in both equity and mutual funds are subject to market risk. Investment in an open-ended mutual fund eliminates this direct risk of not being able to sell the investment in the market. An indirect risk remains, because the scheme has to realize its investments
17

to pay investors. The AMC is however in a better position to handle the situation. Further, on account of various SEBI regulations, such liquid securities are likely to be only a part of the scheme’s portfolio.Another benefit of equity mutual fund schemes is that they give investors the benefit of portfolio diversification through a small investment.
Risk and return grid1. Safety of principal2. Return3. Liquidity
ANKS
FIXED DEPOSITS
BONDS AND DEBENTURES
EQUITY MARKET
MUTUAL FUNDS
RETURNS Low Low to moderate
Low to moderate
Moderate to high
Better
ADMINISTRATIVE EXPENSES
High Moderate to high
Moderate to high
Low to moderate Low
RISK Low Low to moderate
Low to moderate
High Moderate
INVESTMENT OPTION
Less Few Few Many More
NETWORK High penetration
Low penetration
Low penetration
Low but improving fast
Low but improving
LIQUIDITY At a cost
Low Low to moderate
Moderate to high
Better
QUALITY OF ASSETS
Not transparent
Not transparent
Not transparent
transparent
Transparent
GUARANTEE Max rs.1lac
18

CHARECTERISTICS OF MUTUAL FUNDS:
The following are the characteristics of mutual funds:A mutual fund actually belongs to the investors who have pooled their funds. The ownership of the mutual fund is in the hands of the investors.
A mutual fund is managed by investment professionals and other service providers, who earn a fee for their services from the fund.The pool of funds is invested in a portfolio of marketable investments. The value of the portfolio is updated every day.The investor’s share in the fund is denominated by “units”. The value of the units changes with changes in the portfolio’s value, every day. The value of one unit of investment is called as net asset value.
RISKS ASSOSIATED WITH MUTUAL FUND INVESTMENT:
At the cornerstone of investing is the basic principle that the greater the risk you take, the greater the potential reward. Typically, risk is defined as short-term price volatility. But on a long-term basis, risk is the possibility that your accumulated real capital will be insufficient to meet your financial goals. And if you want to reach your financial goals, you must start with an honest appraisal of your own personal comfort zone with regard to risk. Individual tolerance for risk varies, creating a distinct “investment personality” for each investor. Some investors can accept short-term volatility with ease, others with near panic. So whether you consider your investment to be conservative, moderate or aggressive, you need to focus on how comfortable or uncomfortable you will be as the value of your investment moves up or down.
Primary objectives : It is the preliminary frame work of the project attempting to analyze the prose and cons of open ended mutual funds. Therefore chapter 1 is exclusively allocated to pursue objective 1 on theoretical basis.Secondary objectives: This objective is pertaining to the performance of open ended funds and comparins the same with that of another company therefore the following steps are proposed.
1. Quarterly NAV’s of the selected open ended funds of the reliance shall be obtained & find out the holding period returns.
2. The holding period returns of the selected funds shall be calculated using the following formulae:
= ( Closing NAV of the quarter - opening NAV of the quarter ) *100 closing NAV of the quarter
19
3. The NAV’S and holding period returns calculated in above steps for sbi growth fund and sbi magnum monthly income plan fund shall be compare with that of similar funds of another AMC.
4. Based on the comparisons made in above step preliminary interpretation shall be made on the performance of open ended funds at sbi.
It is the core of the project which attempts to analyse the performance of sectoral investments. Sectoral investments represent both systematic and un systematic risk factors between which a fund manager is suppose to bring the leverage. Therefore this objective shall be tested in the following steps:
1) 4 mutual funds of open ended category shall be selected from 4 different sectors.
2) Holding period returns for all the 4 funds shall be calculated on quarterly basis for 3 years.
3) A single graph shall be plotted with the residual values of step 2 to analyse the performance of sectoral funds i.e., the graph shall reveal which sector is more locrative for both investors and fund managers
Risks
Managed risk
Diversification
SIP
Types of risks
20

market
inflation
credit
interest rate
employees
Types of risks: All investments involve some form of risk. Even an insured bank account is subjected to the possibility that inflation will rise faster than your earnings, leaving you with less real purchasing power than when you started (rs.1000 gets you less than it got your father when he was your age). Consider types of risk and evaluate them against potential rewards when you select an investment.
Market risk:At times the prices or yields of all the securities in a particular market rise or fall due to broad outside influences. When this happens, the stock prices of both an outstanding, highly profitable company and a fledging corporation may be affected. This change in \\\price is due to “market risk”.
Inflation risk:Sometimes referred to as “loss of purchasing power”. Whenever inflation sprints forward faster than the earnings on your investment, you run the risk that you’ll actually be able to buy less, not more. Inflation risk also occurs when prices rise faster than your returns.
Exchange rate
Investment
Government policies
21

Credit risk:In short, how stable is the company or entity to which you lend your money when you invest. How certain are you that it will be able to pay the intrest you are promised, or repay your principal when investment matures.
Interest risk:Changing interest rates affect both equities and bonds in many ways. Investors are remained that “predicting” which way rates will go is rarely successful. A diversified portfolio can help in offsetting these changes.
Effect of key professional and inability to adapt:An industrie’s key asset is often the personnel who run the business i.e., intellectual properties or the key employees of the respective companies. Given the ever-changing complexion of few industries and the high obsolescence levels, availability of qualified, trained and motivated personnel is very critical for the success of industries in few sectors. It is, therefore, necessary to attract key personnel and also to retain them to meet the changing environment and challenges the sector offers.Failure or inability to attract /retain such qualified key personnel may impact the prospects of the companies in the particular sector in which the fund invests.
Exchange risk:A number of companies generate revenues in foreign currencies and may have investments or expenses also denominated in foreign currencies. Changes in exchange rates may, therefore, have a positive or negative impact on companies which in turn would have an effect on the investment of the fund.
Investment risk:The sector fund schemes, investments will be predominantly in equities of selected companies in the particular sectors. Accordingly, the NAV of the schemes are linked to the equity performance of such companies and may be more volatile than a more diversified portfolio of equities.
Changes in government policies:Changes in government policy especially in regard to the tax benefits may impact the business prospects of the companies leading to an impact on the investments made by the fund.
22
CHAPTER-III
23

Industry Profile and Company Profile
History of the Indian Mutual Fund Industry
The mutual fund industry in India started in 1963 with the formation of Unit Trust of India, at the initiative of the Government of India and Reserve Bank of India. The history of mutual funds in India can be broadly divided into four distinct phases
24

First Phase – 1964-87:
Unit Trust of India (UTI) was established on 1963 by an Act of Parliament. It was set up by the Reserve Bank of India and functioned under the Regulatory and administrative control of the Reserve Bank of India. In 1978.
Second Phase – 1987-1993 (Entry of Public Sector Funds):
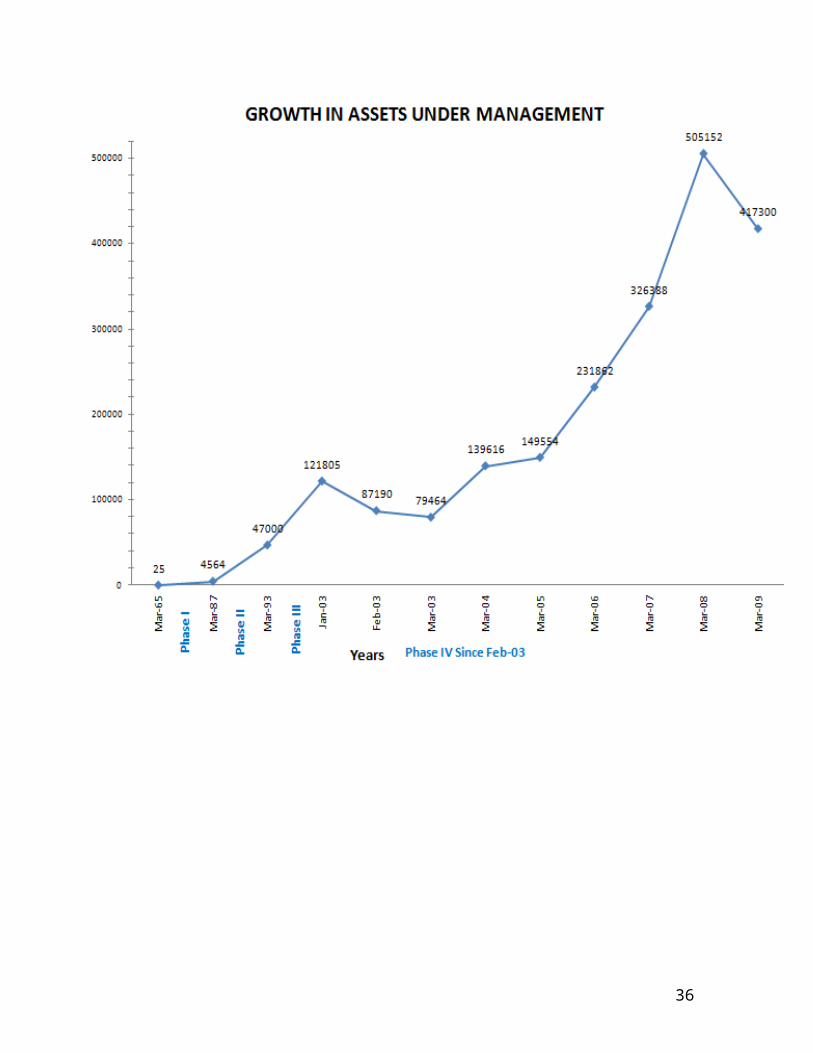
1987 marked the entry of non- UTI, public sector mutual funds set up by public sector banks and Life Insurance Corporation of India (LIC) and General Insurance Corporation of India (GIC). SBI Mutual Fund was the first non- UTI Mutual Fund established in June 1987 followed by Canbank Mutual Fund (Dec 87), Punjab National Bank Mutual Fund (Aug 89), Indian Bank Mutual Fund (Nov 89), Bank of India (Jun 90), Bank of Baroda Mutual Fund (Oct 92). LIC established its mutual fund in June 1989 while GIC had set up its mutual fund in December 1990At the end of 1993, the mutual fund industry had assets under management of Rs.47,004 crores.Third Phase – 1993-2003 (Entry of Private Sector Funds):
With the entry of private sector funds in 1993, a new era started in the Indian mutual fund industry, giving the Indian investors a wider choice of fund families. Also, 1993 was the year in which the first Mutual Fund Regulations came into being, under which all mutual funds, except UTI were to be registered and governed. The erstwhile Kothari Pioneer (now merged with Franklin Templeton) was the first private sector mutual fund registered in July 1993.
The 1993 SEBI (Mutual Fund) Regulations were substituted by a more comprehensive and revised Mutual Fund Regulations in 1996. The industry now functions under the SEBI (Mutual Fund) Regulations 1996.
The number of mutual fund houses went on increasing, with many foreign mutual funds setting up funds in India and also the industry has witnessed several mergers and acquisitions. As at the end of January 2003, there were 33 mutual funds with total assets of Rs. 1,21,805 crores. The Unit Trust of India with Rs.44,541 crores of assets under management was way ahead of other mutual funds
Fourth Phase – since February 2003:
In February 2003, following the repeal of the Unit Trust of India Act 1963 UTI was bifurcated into two separate entities. One is the Specified Undertaking of the Unit Trust of India with assets under management of Rs.29,835 crores as at the end of January 2003, representing broadly, the assets of US 64 scheme, assured return and certain other
25

schemes. The Specified Undertaking of Unit Trust of India, functioning under an administrator and under the rules framed by Government of India and does not come under the purview of the Mutual Fund Regulations.
The second is the UTI Mutual Fund, sponsored by SBI, PNB, BOB and LIC. It is registered with SEBI and functions under the Mutual Fund Regulations. With the bifurcation of the erstwhile UTI which had in March 2000 more than Rs.76,000 crores of assets under management and with the setting up of a UTI Mutual Fund, conforming to the SEBI Mutual Fund Regulations, and with recent mergers taking place among different private sector funds, the mutual fund industry has entered its current phase of consolidation and growth.
The graph indicates the growth of assets over the years
26

27

Company profile
28

INTRODUCTION OF SBI MUTUAL FUNDS.
SBI Funds management pvt.ltd. is one of the leading fund houses in the country with an investor base of over 4.6 million and over 25yerars of rich experience in fund management consistently delivering value to it investors. SBI Funds management pvt.ltd is a joint venture between ‘The State Bank of India’ one of India’s largest banking enterprises, and Societe Generale Asset Management AMUNDI (France), one of the world’s leading fund management companies that manages over US$500 Billion world wide.
Today the fund manages over Rs.28500 crores of assets and has a diverse profile of investors actively parking their investments across 36 active schemes. In 25 years of operation, the fund has launched 38 schemes and successfully redeemed 15 of them, and in the process, has rewarded our investors with consistent returns. Schemes of the mutual funds have time after time outperformed benchmark indices, honored us with 15 awards of performance and have emerged as the preferred investment for millions of investors. The trust reposed on us by over 4.6 million investors is a genuine tribute to our expertise in fund management.
SBI Funds management Pvt. Ltd. Serves its vast family of investors through a network of over 130 points of acceptance, 28 investor service centers, 46 investor service desks and 56 District organizer. SBI Mutual is the first bank sponsored fund to launch an offshore fund Resurgent India opportunities fund
Growth through innovation and stable investment policies is the SBI MF credo.
Vision
“To be the most preferred and the largest fund house for all asset classes, with a consistent track record of excellent returns and best standards in customer service, product innovation, technology and HR practices.
29

COMPETITORS OF SBI MUTUAL FUND:
Some of the main competitors of SBI Mutual Fund in Dehradoon are as Follows:s
i. HDFC Mutual Fundii. ICICI Mutual Fundiii. Reliance Mutual Fundiv. UTI Mutual Fundv. Birla Sun Life Mutual Fundvi. Kotak Mutual Fundvii. Sundaram Mutual Fundviii. LIC Mutual Fundix. Principal x. Franklin Templeton
AWARDS AND ACHIEVEMENTS:SBI Mutual Fund (SBIMF) has been the proud recipient of the ICRA Online Award-8 times, ICRA Mutual Funds 2012, ICRA Mutual funds 5 star Award 2010, ICRA Mutual Funds Awards 2010 For Magnum Global Fund, ICRA Mutual Funds Awards2009 For magnum Tax Gain Scheme 1993, The Lipper India Fund Awards 2009 Outlook Money NDTV Profit Awards 2008, The Lipper India Fund Award 2008 for Magnum Balanced Funs, ICRA Mutual Fund Awards 2008, Outlook Money NDTV Profit Awards 2007,CNBC Awaaz Consumer Awards 2007, the Lipper India Fund Awards 2007,CNBC TV18-CRISIL Mutual Fund Awards 2007, ICRA Mutual Fund Awards 2007.
30

CHAPTER-IV
DATA ANALYSIS&
INTERPRETATION.
31

Data analysis
1. Is the objective of comparing SBI Magnum equity growth fund with that of HDFC growth fund
the details about those funds are as follows:
SBI Magnum Equity Growth FundInvestment objective:To provide the investor long-term capital appreciation by investing in high growth
Companies along with the liquidity of an open-ended scheme through investments
primarily in equities and the balance in debt and money market instruments
Fund Data:
Structure . . . . . …………..Open-ended Equity Growth Scheme
Date of allotment . . . . . . . January /01/1991
Inception Date . . . . . . . . .. January /01/1991
Corpus: 491.37 crores . . . . (30/04/2012)
Minimum Investment. …….. Retail Plan- Rs 1,000 and in multiples of Re 1 thereafter
Fund Manager . . . . . . ……… Mr.R.Srinivasan
Entry Load* . . . . . . . . . . ……Retail Plan: Nil
Institutional Plan: Nil
Exit Load (w.e.f 30/apr/2012). . Retail Plan & Institutional Plan
• 1% if redeemed or switched out on or before
Completion of 1 year from the date of allotment of units.
32

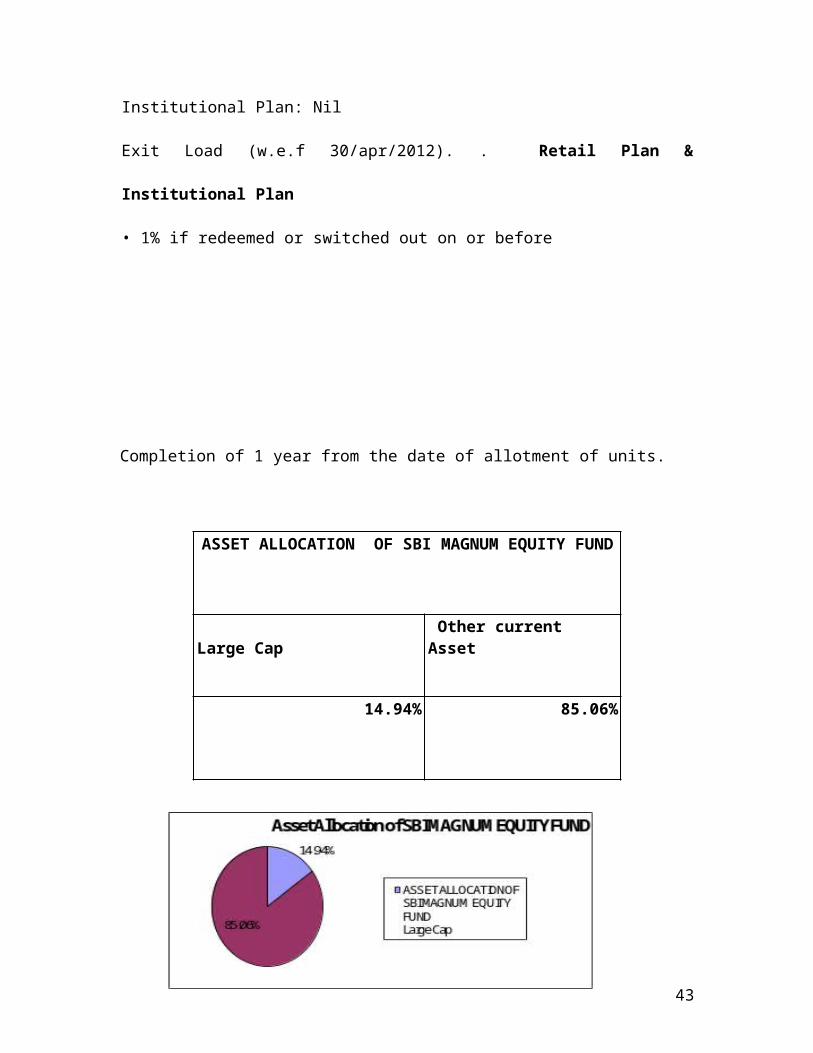
ASSET ALLOCATION OF SBI MAGNUM EQUITY FUND
Large Cap Other current Asset
14.94% 85.06%
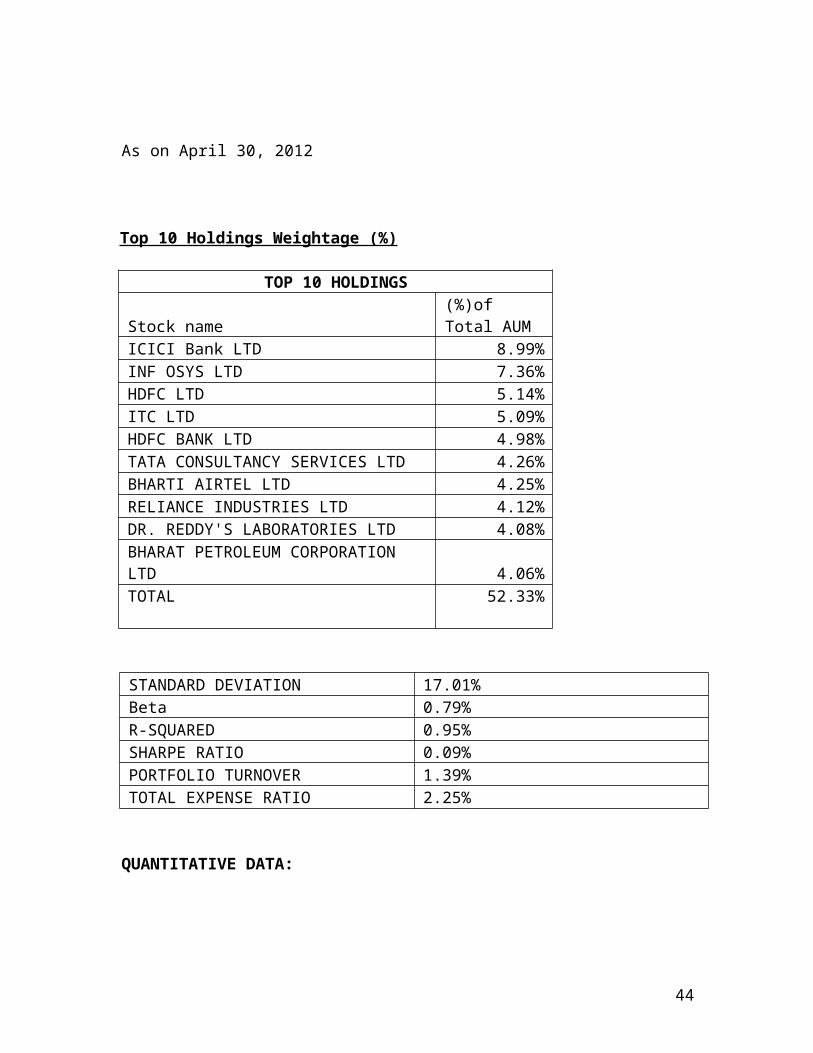
As on April 30, 2012
Top 10 Holdings Weightage (%)
TOP 10 HOLDINGS
Stock name(%)of Total AUM
ICICI Bank LTD 8.99%INF OSYS LTD 7.36%HDFC LTD 5.14%ITC LTD 5.09%HDFC BANK LTD 4.98%TATA CONSULTANCY SERVICES LTD 4.26%BHARTI AIRTEL LTD 4.25%RELIANCE INDUSTRIES LTD 4.12%DR. REDDY'S LABORATORIES LTD 4.08%BHARAT PETROLEUM CORPORATION LTD 4.06%
33

TOTAL 52.33%
STANDARD DEVIATION 17.01%Beta 0.79%R-SQUARED 0.95%SHARPE RATIO 0.09%PORTFOLIO TURNOVER 1.39%TOTAL EXPENSE RATIO 2.25%
QUANTITATIVE DATA:
Note: The above measures have been calculated by taking rolling return for A3 year
period from 01-04-2009 to 30-04-2012.
2. HDFC Equity
Growth Fund Investment objective:“To achieve capital appreciation.”
Fund Data:
Structure . . . . . …………..Open-ended Equity Growth Scheme
Date of allotment . . . . . . . January /01/1995
Inception Date . . . . . . . . .. January /01/1995
Corpus: 126,195.48crores . . . . (30/04/2012)
Minimum Investment. …….. Retail Plan- Rs 5,000 and in multiples of Re 1 thereafter
Fund Manager . . . . . . ………. Prashant Jain
Entry Load* . . . . . . . . . . ……Retail Plan: Nil
Institutional Plan: Nil
Exit Load (w.e.f 30/apr/2012). . Retail Plan & Institutional Plan
34

• 1% if redeemed or switched out on or before
Completion of 1 year from the date of allotment of units.
ASSET ALLOCATION OF HDFC EQUITY FUNDTOP 10
INDUSTRYEQUITY RELATED HOLIDING
COMOTHER CURRENT
ASSETS54.85% 52.68% 2.17%
Asset Allocation of HDFC Equity Fund
54.85%52.68%
2.17%
ASSET ALLOCATION OFHDFC EQUITY FUND TOP 10INDUSTRY
ASSET ALLOCATION OFHDFC EQUITY FUND EQUITYRELATED HOLIDING COM
ASSET ALLOCATION OFHDFC EQUITY FUND OTHERCURRENT ASSETS
TOP 10 HOLDING WEIGHT AGE (%)
TOP 10 HOLDINGS
Stock Name (%)of Total AUM
INF OSYS LTD 8.09%
ICICI BANK LTD 6.38%
RELIANCE INDUSTRIES LTD 6.05%
ITC LTD 5.80%
BHARAT PETROLEUM CORPORATION LTD 5.79%
SBI BANK OF INDIA 5.47%
DIVI'S LABORATORIES LTD 5.17%
HOUSING DEVELOPMENT FINANCE CORPORATION LTD 4.60%
SOLAR INDUSTRIES INDIA LTD 4.32%
BHARTI AIRTEL LTD. 3.18%
TOTAL 54.85%
35
QUANTITATIVE DATA
STANDARD DEVIATION 6.80%Beta 0.9180%Sharpe Ratio 0.15%
Comparison of SBI Equity fund with HDFC Equity fund:
Quarter SBI Equity Trend values %
HDFC Equity Trend values %
1st Quarter 26.18278 29.14246
2nd Quarter 1.393233 9.544404
3rd Quarter 6.457766 7.248906
4th Quarter 8.166295 7.990201
5th Quarter 4.632929 7.373956
6th Quarter 8.176915 11.60227
7th Quarter -10.9773 -12.1041
8th Quarter 5.003411 5.954668
9th Quarter -0.78576 -1.9898
10th Quarter -3.65591 -8.71176
11th Quarter -0.87741 -1.68605
12th Quarter 3.776683 3.2973943
TOTAL 47.493632 75.0860693Averages 3.957802667 6.257172441
36

-15
-10
-5
0
5
10
15
20
25
30
35
1 2 3 4 5 6 7 8 9 10 11 12
SBI equity magnum fund trendvalues.
HDFC Equity fund trend values.
Interpretation:
Growth funds does not generate periodical income in the form of dividend rather the
income fetched to fund is reinvested in the market to augment it’s net asset value in long
run . 36 months is naturally a long term investment interval for the retail investors in all
the spectrums of financial markets and so is the case with growth funds as well. the
negative returns generated by HDFC Equity and SBI MAGNUM Equity growth funds in
7th, 9th,10th,&11th. Quarters implies absolute correlation with the markets however
such negative returns need not be considered by the long term investor as he estimates
The returns of 1st quarter and the 12th quarter and conglomerates holding period returns.
Rather an investor can take long position in growth oriented funds during their negative
returns as they should be set off against the positive returns at the end. It can be observed
from the above data that HDFC has generated total holding period returns of 75.08 %
which is no way comparable with nominal returns of 47.49 % generated by SBIMF EF.
Even the average quarterly returns of HDFC growth fund are far a head than that of
SBIMF i.e., @ 6.2% it can be further interpreted that the total holding period returns of
sbi mf in the selected time period of 3 years are less than the risk free returns generated
by any debt instrument at 47.49 % . Hence it is decided to advocate that SBIMF fund
37

managers should adopt more aggressive strategy with respect to selection of underlying
shares, taking appropriate positions and maintaining proper liquidity position to ensure
the redemption as growth oriented funds falls in the ambit of open ended category.
3. Is the objective of comparing SBI Magnum Balanced Trend fund with that of HDFC Balanced Trend fund the details about those funds are as follows:
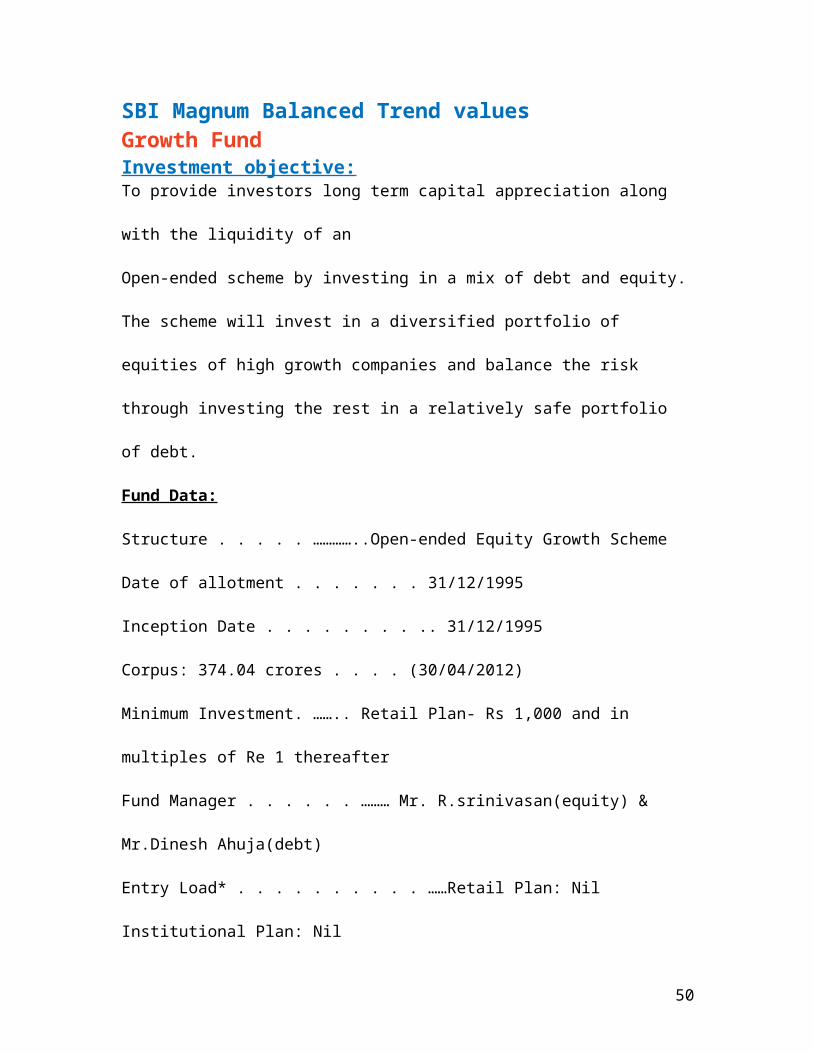
SBI Magnum Balanced Trend values Growth FundInvestment objective:To provide investors long term capital appreciation along with the liquidity of an
Open-ended scheme by investing in a mix of debt and equity. The scheme will invest in a
diversified portfolio of equities of high growth companies and balance the risk through
investing the rest in a relatively safe portfolio of debt.
Fund Data:
Structure . . . . . …………..Open-ended Equity Growth Scheme
Date of allotment . . . . . . . 31/12/1995
Inception Date . . . . . . . . .. 31/12/1995
Corpus: 374.04 crores . . . . (30/04/2012)
Minimum Investment. …….. Retail Plan- Rs 1,000 and in multiples of Re 1 thereafter
Fund Manager . . . . . . ……… Mr. R.srinivasan(equity) & Mr.Dinesh Ahuja(debt)
Entry Load* . . . . . . . . . . ……Retail Plan: Nil
Institutional Plan: Nil
Exit Load (w.e.f 30/apr/2012). . Retail Plan & Institutional Plan
• 1% if redeemed or switched out on or before
38
Completion of 1 year from the date of allotment of units.
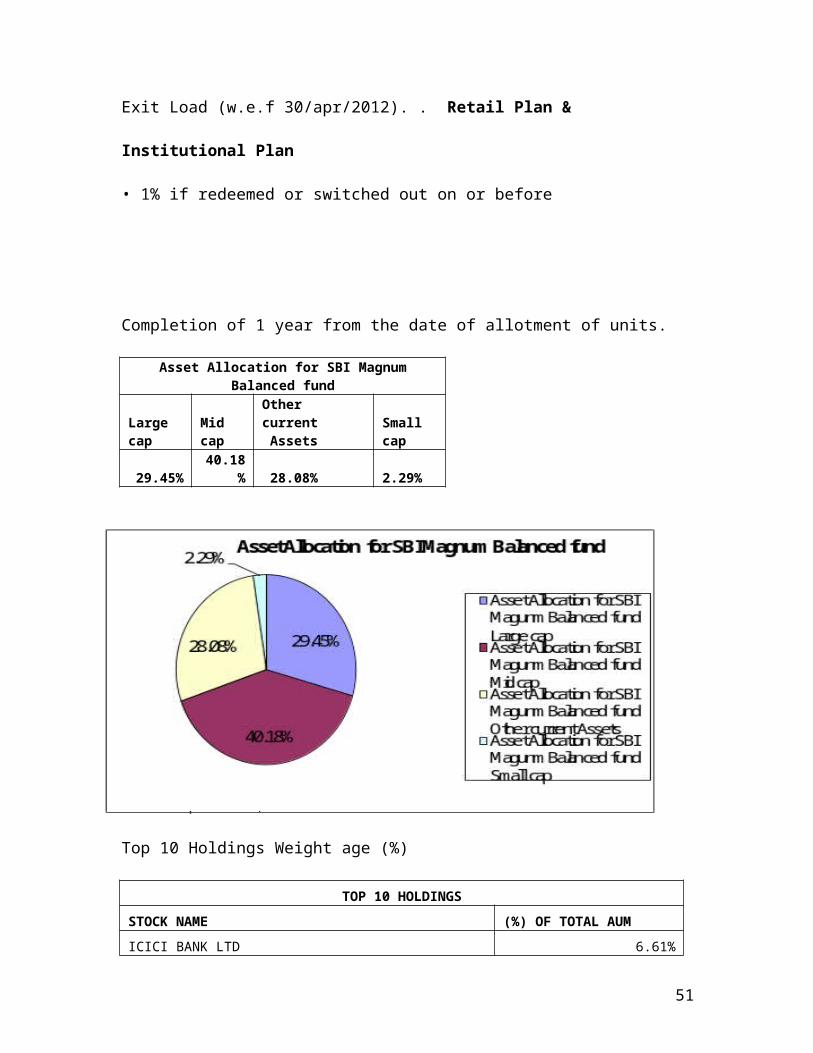
Asset Allocation for SBI Magnum Balanced fundLarge cap
Mid cap
Other current Assets
Small cap
29.45% 40.18% 28.08% 2.29%
As on April 30, 2012
Top 10 Holdings Weight age (%)
TOP 10 HOLDINGS
STOCK NAME (%) OF TOTAL AUM
ICICI BANK LTD 6.61%
HDFC BANK LTD 5.54%
MUTHOOT FINANCE TLD 4.76%
DB CROP LTD 4.22%
BAJAJ HOLDINGS & INVESTMENT LTD 3.80%
TORRENT PHARMACEUTICALS LTD 3.61%
CHOLAMANDALAM INVT&FIN .SER.LTD 3.31%
STATE BANK OF INDIA 3.18%
HCL TECHNOLOGIES LTD 2.97%
WABCO INDIAN LTD 2.91%
TOTAL 40.91%
39

QUANTITATIVE DATA
STANDARD DEVIATION 13.83%Beta 0.96%R-SQUARED 0.92%SHARPE RATIO 0.23%PORTFOLIO TURNOVER 1.07%TOTAL EXPENSE RATIO 2.32%Note: The above measures have been calculated by taking rolling return for A3 year period from 01-04-2009 to 30-04-2012
.4. HDFC Balanced fund
Growth FundInvestment objective:
The primary objective of the Scheme is to generate capital appreciation along with
current income from a combined portfolio of equity and equity related and debt and
money market instruments.
Fund Data:
Structure . . . . . …………..Open-ended Equity Growth Scheme
Date of allotment . . . . . . . April/02/2007
Inception Date . . . . . . . . .. April/02/2007
Corpus: 55,493.35crores . . . . (30/04/2012)
Minimum Investment. …….. Retail Plan- Rs 5,000 and in multiples of Re 1 thereafter
Fund Manager . . . . . . ………. Chirag setalved
Entry Load* . . . . . . . . . . ……Retail Plan: Nil
Institutional Plan: Nil
Exit Load (w.e.f 30/apr/2012). . Retail Plan & Institutional Plan
40

• 1% if redeemed or switched out on or before
Completion of 1 year from the date of allotment of units.
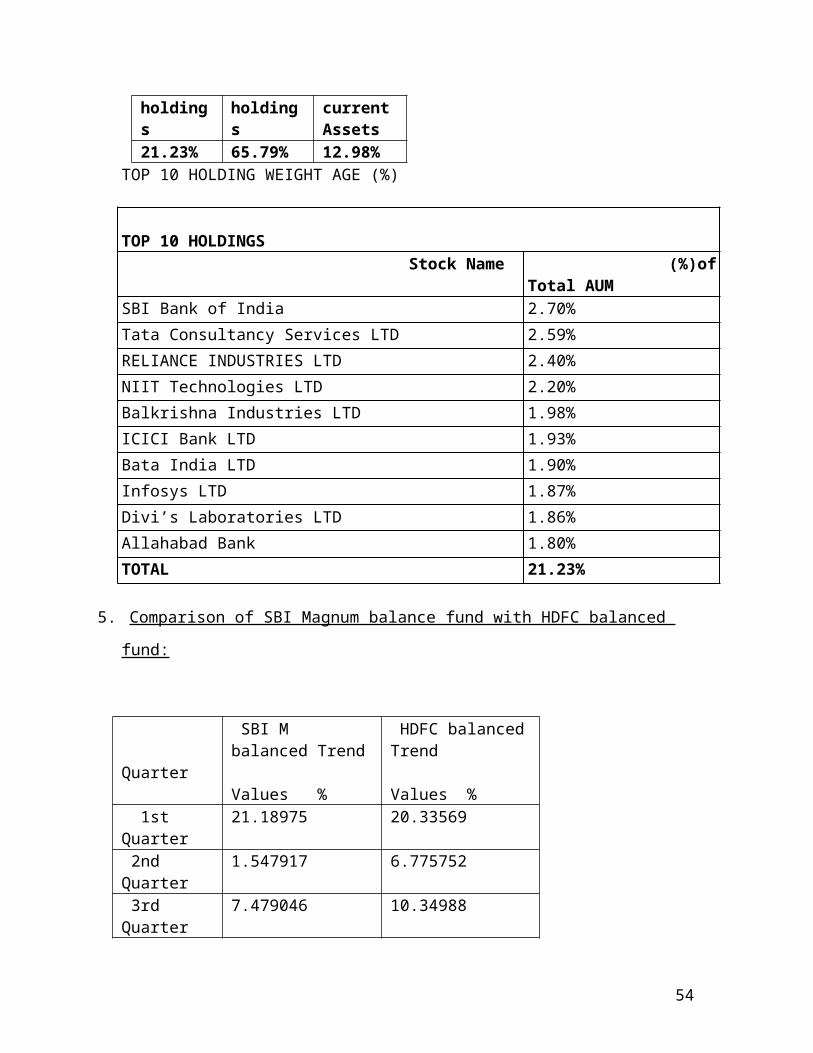
HDFC Balanced fund asset allocation
Top 10 holdings
Total holdings
Other current Assets
21.23% 65.79% 12.98%TOP 10 HOLDING WEIGHT AGE (%)
TOP 10 HOLDINGS Stock Name (%)of Total AUMSBI Bank of India 2.70%
Tata Consultancy Services LTD 2.59%
RELIANCE INDUSTRIES LTD 2.40%
NIIT Technologies LTD 2.20%
Balkrishna Industries LTD 1.98%
ICICI Bank LTD 1.93%
Bata India LTD 1.90%
Infosys LTD 1.87%
Divi’s Laboratories LTD 1.86%
Allahabad Bank 1.80%
TOTAL 21.23%
5. Comparison of SBI Magnum balance fund with HDFC balanced fund:
Quarter SBI M balanced Trend Values %
HDFC balanced Trend Values %
1st Quarter 21.18975 20.33569
2nd Quarter 1.547917 6.775752 3rd Quarter 7.479046 10.34988 4th Quarter 5.107418 5.858778 5th Quarter 2.212037 7.185249 6th Quarter 6.223375 8.929604
41

7th Quarter -9.57361 -8.99953
8th Quarter 3.076923 7.38593
9th Quarter -2.3582 3.405898 10th Quarter
-5.77377 -3.57283
11th Quarter
-1.97846 -1.59752
12th Quarter 4.647268 5.516398TOTAL 31.799694 61.573299Average 2.6499745 5.13110825
-15
-10
-5
0
5
10
15
20
25
1 2 3 4 5 6 7 8 9 10 11 12
SBI Magnum balancedfund
HDFC balanced fund
Interpretation:
Here we discus about the schemes are SBI MBF and HDFC BF in this the both funds are
performed the good returns to the customer but some quarters both funds are given
negative returns those quarters are 7th,10th and as well as in the 9th quarter the SBIMF are
given heavy negative returns to customer the will more impact very much.
The total quarters returns are as fallows sbi mf was secured their 12 quarters
returns 31.79% and HDFC are secured the 12 quarters returns are 61.57 and The
42
schemes are generating their returns as quarter’s wise the quarter’s total and the average
returns are like sbi mf 2.6% and hdfc are 5.13%
6. Is the objective of comparing SBI Magnum Monthly income Plan with that of HDFC
Monthly income Plan the details about those funds are as follows:
SBI Magnum Monthly Income Plan Growth FundInvestment objective:To provide regular income, liquidity and attractive returns to the investors through an actively managed portfolio of debt,Equity and money market instruments.Fund Data:
Structure . . . . . …………..Open-ended Equity Growth Scheme
Date of allotment . . . . . . . 31/05/2012
Inception Date . . . . . . . . .. 31/05/2012
Corpus: 246.63 crores . . . . (30/04/2012)
Minimum Investment. …….. Retail Plan- Rs 10,000 and in multiples of Re 1 thereafter
Fund Manager . . . . . . ……… Mr.Ruchit Mehta(equity) & Mr.Dinesh Ahuja(debt)
Entry Load* . . . . . . . . . . ……Retail Plan: Nil
Institutional Plan: Nil
Exit Load (w.e.f 30/apr/2012). . Retail Plan & Institutional Plan
• 1% if redeemed or switched out on or before
Completion of 1 year from the date of allotment of units.
Asset Allocation
43
Equity Debt AA+
70.47% 12.93% 4.87%
Top 10 Holdings Weight age (%)
TOP 10 HOLDINGS
STOCK NAME (%) OF TOTAL AUM
ORIENTAL BANK OF COMMERCE 11.36%
GOVERNMENT OF INDIA 10.21%
POWER FINANCE CORPORATION LTD 10.18%
44

TATA CAPITAL FINANCIAL SERVICES LTD 9.95%
NATIONAL HOUSING BANK 9.75%
NATIONAL BK FOR AGRI&RURAL DEVPT 4.99%
RURAL ELECTRIFICATION CORP LTD 4.98%
HDFC LTD 4.96%
LIC HOUSING FINANCELTD 4.95%
TATA MOTORSLTD 3.85%
TOTAL 75.18%
QUANTITATIVE DATA
MODIFIED DURATION 2.07%
AVERAGE MATURITY 2.73YEARS
TOTAL EXPENSE RATIO 2.03%
Note: The above measures have been calculated by taking rolling return for A3 year
period from 01-04-2009 to 30-04-2012.
7. HDFC MF MIP
Growth FundInvestment objective:The primary objective of Scheme is to generate regular returns through investment
primarily in Debt and Money Market Instruments. The secondary objective of the
Scheme is to generate long-term capital appreciation by investing a portion of the
Scheme’s assets in equity and equity related instruments.
45

Fund Data:
Structure . . . . . …………..Open-ended Equity Growth Scheme
Date of allotment . . . . . . . 26/12/2003
Inception Date . . . . . . . . .. 26/12/2003
Corpus: 26,253.30crores . . . . (30/04/2012)
Minimum Investment. …….. Retail Plan- Rs 25,000 and in multiples of Re 1 thereafter
Fund Manager . . . . . . ………. PRASHANT JAIN (Equites) & SHOBHIT
MEHROTRA (DEBT)
Entry Load* . . . . . . . . . . ……Retail Plan: Nil
Institutional Plan: Nil
Exit Load (w.e.f 30/apr/2012). . Retail Plan & Institutional Plan
• 1% if redeemed or switched out on or before
Completion of 1 year from the date of allotment of units.
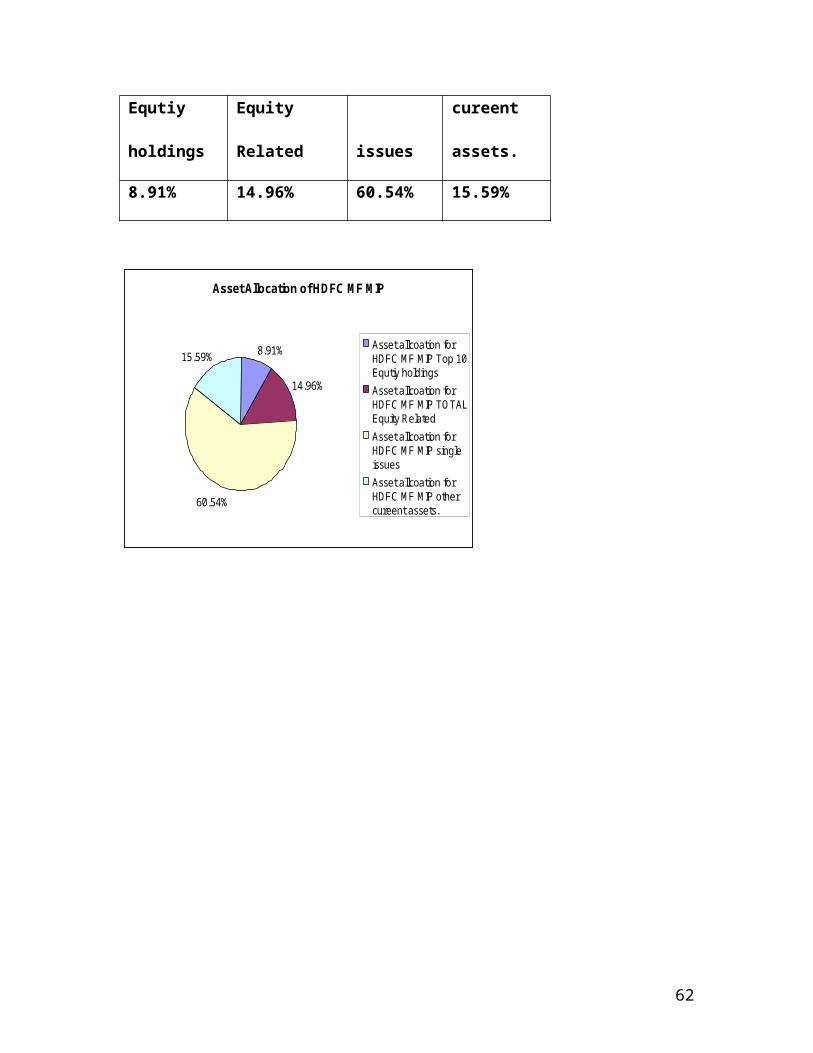
Asset allocation for HDFC MF MIP
Top 10
Equtiy
holdings
TOTAL
Equity Related
single
issues
Other
cureent
assets.
46

8.91% 14.96% 60.54% 15.59%
Asset Allocation of HDFC MF MIP
8.91%
14.96%
60.54%
15.59%Asset allcoation forHDFC MF MIP Top 10Equtiy holdingsAsset allcoation forHDFC MF MIP TOTALEquity RelatedAsset allcoation forHDFC MF MIP singleissuesAsset allcoation forHDFC MF MIP othercureent assets.
TOP 10 HOLDING WEIGHT AGE (%)
TOP 10 HOLDINGS
47

STOCK NAME(%) OF TOTAL AUM
BHARAT PETROLEUM CORPORATION LTD 1.52%
OIL&NATURAL DAS CORPORATION LTD 1.10%
CIPLA LTD 1.08%
SOLAR INDUSTRIES INDIA LTD 0.89%
NHPC LTD 0.80%
BANK OF BARODA 0.75%PROCTER & GAMBLE HYGINE AND HEALTH CARE LTD 0.75%
FEDERAL BANK LTD 0.73%
SJVN LTD 0.65%
NTPC LTD. 0.64%
TOTAL 8.91%
Comparison of SBI Magnum Monthly income plan with HDFC MF Monthly income
8. plan:
Quarter SBI M MIP Trend Values %
HDFC MF MIP Trend Values %
1st Quarter 3.316686525 6.738921537
2nd Quarter 0.483648 1.922449476
3rd Quarter 2.161939 2.720006982
4th Quarter 3.076062 2.086646074
5th Quarter 2.346816 1.597769717
6th Quarter 2.081602476 2.042193994
48

7th Quarter 0.712109644 -1.42470598
8th Quarter 1.757898262 2.411003142
9th Quarter 1.36225367 1.876418721
10th Quarter 0.878630909 0.229679869
11th Quarter 1.639520315 1.587301587
12th Quarter 2.353828112 2.035485461
TOTAL 22.165594913 23.8213937311
Average 1.847132909416667 1.985116144258333
-2
-1
0
1
2
3
4
5
6
7
8
1 2 3 4 5 6 7 8 9 10 11 12
SBI MAGNUM MONTHLYINCOMEPLAN
HDFC MF MONTHLY INCOMEPLAN
Interpretation:
Monthly income plans are supposed to fetch constant income to the investor’s which
would be in par with the risk free returns generated by the guilt edge instruments. It can
be observed from annual interest rates of scheduled banks that monthly income of 1 %
49
and above on the capital employed are risk free from any investment avenues like
recurring deposits.
Therefore mutual funds having considerable risk factors are supposed to generate the
monthly income quite larger than that of 1 %. It is estimated from the selected two funds
viz., HDFC monthly income fund and SBIMF monthly income plan that on an average
they have generated 1.9% and 1.8 % respectively. However in the 7 th quarters HDFC
MIP fund have fetched negative returns to the investors distributing no periodical
income. Even in the 7th quarter when its counterpart SBI has generated 0.71% of income.
Therefore it can interpreted on preliminary grounds that the performance levels of
SBIMF are more lucrative in long run which is also implied by the total returns of
23.82% which is 1.66 % higher than that of SBIMF.
It can be advocated that any monthly income plan generates discrete periodical returns
hence they can not be considered as constant income generators in any portfolio. But
they certainly bring the trade of between moderate risk & returns.
9. Is the objective of comparing SBI Sectoral funds are SBI Infrastructure fund, SBI MSFU
IT Fund,SBIMSFU-FMCG Fund and SBIMSFU-Pharma funds are as follows:
SBI Magnum Infrastructure
Growth Fund
Investment objective:
To provide investors with opportunities for long-term growth in capital through an
active management of investments in a diversified basket of equity stocks of
companies directly or indirectly involved in the infrastructure growth in the Indian
economy and in debt & money market instruments.
50
Fund Data:
Structure . . . . . …………..Open-ended Equity Growth Scheme
Date of allotment . . . . . . . 06/07/2007
Inception Date . . . . . . . . .. 06/07/2007
Corpus: 720.24 crores . . . . (30/04/2012)
Minimum Investment. …….. Retail Plan- Rs 5,000 and in multiples of Re 1 thereafter
Fund Manager . . . . . . ……… Mr.AjitDange
Entry Load* . . . . . . . . . . ……Retail Plan: Nil
Institutional Plan: Nil
Exit Load (w.e.f 30/apr/2012). . Retail Plan & Institutional Plan
• 1% if redeemed or switched out on or before
Completion of 1 year from the date of allotment of units.
Asset Allocation Infrastructure Fund
Large cap
Mid
cap Small cap
Other Current
Asset
72.73% 11.94% 10.01% 5.32%
51

Asset Allocation Infrastructure Fund
72.73%
11.94%
10.01%
5.32%Asset AllocationInfrastructure FundLarge cap
Asset AllocationInfrastructure FundMid capAsset AllocationInfrastructure FundSmall cap
Asset AllocationInfrastructure FundOther Current Asset
Top 10 HoldingsWeight age (%)
TOP 10 HOLDINGS
STOCK NAME
(%) OF TOTAL
AUM
OIL&NATURAL GAS CORPORATION LTD 7.40%
HDFC BANK LIMITED 7.38%
POWER GRID CORPORATION LTD 6.62%
COAL INDIA LTD 5.22%
52

INFRASTRUCTURE DEVELOPMENT FINANCE 5.06%
BHARTI AIRTEL LTD 4.90%
GAMMON INFRASTRUCTURE PROJECTS LTD 4.84%
POWER FINANCE CORPORATION LTD 4.83%
RELIANCE INDUSTRIES LTD 4.58%
GUJARAT STATE PETRONET LTD 3.91%
TOTAL 54.74%
QUANTITATIVE DATA
Standard Deviation 17.8% Beta 0.82% R-Squared 0.88% Sharpe Ratio -0.85% Portfolio turnover 2.09% Total Expense Ratio 2.20%
Note: The above measures have been calculated by taking rolling return for A3 year
period from 01-04-2009 to 30-04-2012
10. SBI Magnum IT Fund
Growth Fund
Investment objective:
To provide the investors maximum growth opportunity through equity investments in
stocks of growth oriented sectors of the economy. There are five sub-funds dedicated to
53
specific investment themes viz. Information Technology, Pharmaceuticals, FMCG,
Contrarian (investment in stocks currently out of favour) and Emerging Businesses.
Fund Data:
Structure . . . . . …………..Open-ended Equity Growth Scheme
Date of allotment . . . . . . . 14/07/1999
Inception Date . . . . . . . . .. 14/07/1999
Corpus: 42.30 crores . . . . (30/04/2012)
Minimum Investment. …….. Retail Plan- Rs 2,000 and in multiples of Re 1 thereafter
Fund Manager . . . . . . ……… Mr. Anup Upadhyay
Entry Load* . . . . . . . . . . ……Retail Plan: Nil
Institutional Plan: Nil
Exit Load (w.e.f 30/apr/2012). . Retail Plan & Institutional Plan
• 1% if redeemed or switched out on or before
Completion of 1 year from the date of allotment of units.
Asset Allocation
Large
cap
Mid
cap Other Current Assets
86.81% 10.67% 2.52%
54

Asset Allocation of SBI IT FUND
86.81%
10.67% 2.52%
Asset Allocation Largecap
Asset Allocation Midcap
Asset Allocation OtherCurrent Assets
Top 08 Holdings Weight age (%)
TOP 08 HOLDINGS
STOCK NAME
(%) OF TOTAL
AUM
INFOSYS LTD 7.40%
TATA CONSULTANCY SERIVES LTD 7.38%
HCL TECHNOLOGIES LTD 6.62%
HEXAWARE TECHNOLOGIES 5.22%
WIPRO LTD 5.06%
REDING TON (INDIA) LTD 4.90%
ORACLE FINANCIAL SERVIES
SOFTWARE 4.84%
SATYAM COMPUTER SERVIES LTD 4.83%
TOTAL 46.25%
55

QUANTITATIVE DATA
Standard Deviation 21.77%
Beta 0.87%
R-Squared 0.92%
Sharpe Ratio 0.66%
Portfolio turnover 0.57%
Total Expense Ratio 2.50%
Note: The above measures have been calculated by taking rolling return for A3 year
period from 01-04-2009 to 30-04-2012.
11. SBI Magnum SFU-FMCG FUND
Growth Fund
Investment objective:
To provide the investors maximum growth opportunity through equity investments in
stocks of growth oriented sectors of the economy. There are five sub-funds dedicated to
specific investment themes viz. Information Technology, Pharmaceuticals, FMCG,
Contrarian (investment in stocks currently out of favour) and Emerging Businesses.
Fund Data:
Structure . . . . . …………..Open-ended Equity Growth Scheme
Date of allotment . . . . . . . 14/07/1999
Inception Date . . . . . . . . ..14/07/1999
56

Corpus: 66.75 crores . . . . (30/04/2012)
Minimum Investment. …….. Retail Plan- Rs 2,000 and in multiples of Re 1 thereafter
Fund Manager . . . . . . ……… Mr. Saurabh Pant
Entry Load* . . . . . . . . . . ……Retail Plan: Nil
Institutional Plan: Nil
Exit Load (w.e.f 30/apr/2012). . Retail Plan & Institutional Plan
• 1% if redeemed or switched out on or before
Completion of 1 year from the date of allotment of units.
Asset Allocation for SBIMSFU-FMCGF
Large cap Mid cap Small cap Other Current Asset
78.30% 15.05% 6.30% 0.35%
Asset Allocation for SBIMSFU-FMCGF
78.30%
15.05%
6.30%
0.35%Asset Allocation forSBIMSFU-FMCGF Large cap
Asset Allocation forSBIMSFU-FMCGF Mid cap
Asset Allocation forSBIMSFU-FMCGF Small cap
Asset Allocation forSBIMSFU-FMCGF OtherCurrent Asset
Top 10 Holdings Weight age (%)
TOP 10 HOLDINGS
STOCK NAME(%) OF TOTAL AUM
ITC LTD 44.01%HINDUSTAN UNILEVER LTD 10.66%
57

GLAXOSMITHKLINE CONS.HEALTHCARE LTD 8.51%EMAMILTD 7.81%DABUR INDIA LTD 6.75%AGRO TECH FOODS LTD 5.14%MARICO LTD 4.97%TITAN INDUSTRIES LTD 3.41%RADICO KHAITAN LTD 2.72%UNITED SPIRITS LTD 1.99%TOTAL 95.97%
QUANTITATIVE DATA
Standard Deviation 16.04%
Beta 0.68%
R-Squared 0.72%
Sharpe Ratio 1.66%
Portfolio turnover 1.17%
Total Expense Ratio 2.50%
Note: The above measures have been calculated by taking rolling return for A3 year
period from 01-04-2009 to 30-04-2012
12. SBI Magnum Pharma fund
Growth Fund
Investment objective:
To provide the investors maximum growth opportunity through equity investments in
stocks of growth oriented sectors of the economy. There are five sub-funds dedicated to
specific investment themes viz. Information Technology, Pharmaceuticals, FMCG,
Contrarian (investment in stocks currently out of favour) and Emerging Businesses.
Fund Data:
Structure . . . . . …………..Open-ended Equity Growth Scheme
58

Date of allotment . . . . . . . 14/07/1999
Inception Date . . . . . . . . .. 14/07/1999
Corpus: 41.05 crores . . . . (30/04/2012)
Minimum Investment. …….. Retail Plan- Rs 2,000 and in multiples of Re 1 thereafter
Fund Manager . . . . . . ……… Mr. Tanmaya Desai
Entry Load* . . . . . . . . . . ……Retail Plan: Nil
Institutional Plan: Nil
Exit Load (w.e.f 30/apr/2012). . Retail Plan & Institutional Plan
• 1% if redeemed or switched out on or before
Completion of 1 year from the date of allotment of units.
Asset Allocation of SBI SFU-PHARMA FUNDSLarge Cap
Mid Cap
Small Cap Other Current Assets
63.34% 31.44% 2.73% 2.49%
Top 10 Holdings Weight age (%) Z
Asset Allocation of SBISFU-Pharma Fund
63.34%
31.44%
2.73%
2.49% Asset Allocation of SBISFU-PHARMA FUNDSLarge Cap
Asset Allocation of SBISFU-PHARMA FUNDSMid Cap Asset Allocation of SBISFU-PHARMA FUNDSSmall Cap
Asset Allocation of SBISFU-PHARMA FUNDSOther Current Assets
59
TOP 10 HOLDINGS
STOCK NAME(%) OF TOTAL AUM
DR.REDDY'S LABORATORIES LTD 13.94%DIVIS LABORATORY LTD 11.02%CIPLA LTD 10.94%LUPIN LTD 10.29%CADILA HEALTHCARE LTD 9.12%IPCA LABORATORIES LTD 8.03%SUN PHARMACEUTICAL INDUSTRIES LTD 8.02%TORRENT PHARMACEUTICALS LTD 6.33%WYETH LTD 6.23%STRIDES ARCOLAB LTD 3.23%TOTAL 87.15%
QUANTITATIVE DATA
Standard Deviation 15.54%
Beta 0.83%
R-Squared 0.85%
Sharpe Ratio 0.93%
Portfolio turnover 0.44%
Total Expense Ratio 2.50%
Note: The above measures have been calculated by taking rolling return for A3 year
period from 01-04-2009 to 30-04-2012.
Comparison of SBI Sectoral funds SBI-IF,SBI-MSFU-IT,SBIMFU- FMCG
SBIMSFU-PHARMA FUDND
Quarter SBI INFRASTRUCTURE FUND
SBI MSFUIT FUND
SBIMSFU-FMCG FUND
SBIMSFU-PHARMA FUND
1st Quarter 25.72S34 2.9893 19.5219 29.6813
2nd Quarter 0.8385 9.5495 6.8730 11.2523
60

3rd Quarter 5.9595 17.8075 9.0510 7.4556
4th Quarter 4.4019 4.1257 11.5169 9.9636
5th Quarter 0.2887 3.6896 17.0136 3.8767
6th Quarter 5.8348 6.9603 7.0036 9.6434
7th Quarter -22.1621 2.1729 -10.8117 -3.0998
8th Quarter 2.9723 -1.7974 12.3091 4.0843
9th Quarter -4.7032 -2.3349 7.7293 4.6904
10th Quarter -7.9613 -1.5837 1.3621 -5.6435
111th Quarter -4.6835 -0.5966 -1.6235 2.7003
TOTAL -0.0504 67.9167 97.1690 81.5722
AVERAGE -0.0042 5.6597 8.0974 6.7976
61
Interpretation:
In this objects main view is to know the intra comparison of SBI Mutual Funds in that I
selected some sectors those are as follows Infrastructure Fund, SBIMSFU IT Fund, SBI
MSFU- FMCG Fund, and SBIMSFU-Pharma Fund.
In these funds are all well preformed until 6th Quarter and after the 6th quarter
7th,8th,9th,10th,11th,&12th Quarters are given negative returns in this quarters loosed their
returns based on the market position and fund managers are didn’t taken a right decision
on time it will effected to the investor’s profit.
62

CHAPTER-V
FINDINGSSUGGESTIONS
&CONCLUSIONS
63

FINDINGS
1. Most of the people do not know what mutual funds are in the society
2. (Poor awareness).
3. Mutual fund advisors are very much less when it is compared with insurance
advisors.
4. It can be concluded that higher rate of redemption at inflated NAV reduces the
funds net worth in long run.
5. Systematic investment plans (SIP’s) will bring down the price of unit values by
averaging the high and low unit prices.
6. Mutual funds does not give any assured returns which will be a hurdle point for
the investor and raises doubt to the investor to whether invest or not….?
64

Suggestions
1. It is decided to advocate that sbi fund managers should adopt more aggressive strategy
with respect to selection of underlying shares, taking appropriate positions and
maintaining proper liquidity position to ensure the redemption as growth oriented
funds falls in the ambit of open ended category.
2. In order to set off the negative returns with that of positive returns an investor has to
take the long position.
3. If an investor wants to buy the units at the most minimum price he has to go through
with Systematic investment plan.
4. Mutual fund can become a more powerful investment option if it obtains the option of
daily or monthly investment by which it can reach to the lower (or) medium kind of
investors viz., tailors, fruit sellers, vegetable sellers.
5. If mutual fund can reach to the more larger number of public it can fuel for the
development of that particular asset management company.
6. The most vital problem spotted is of ignorance. Investors should be made aware
of the benefits. Nobody will invest until and unless he is fully convinced. Investors
should be made to realize that ignorance is no longer bills and what they are losing by
not investing
7. Mutual Funds offer a lot of benefit which no other single option could offer.
8. Mutual Fund Company needs to give the training of the Individual Financial Advisors
about the Fund/Scheme and its objective, because they are the main source to
influence the investors.
65

Conclusions
1. It is found from the analysis that HDFC has generated total holding period returns of
75.086% which is no way comparable with nominal returns of 47.49 % generated by
SBI MF.
2. The average quarterly returns of HDFC growth fund are far a head than that of SBIMF
i.e., @ 3.97 % it can be further interpreted that the total holding period returns of SBI
MF in the selected time period of 3 years are less than the risk free returns generated
by any debt instrument at 47.49%.
3. HDFC monthly income fund and SBI MF monthly income plan that on an average
they
have generated 1.98% and 1.84% respectively.
4. HDFC Monthly income plan has exhibited negative performance in the 7th quarter
i.e., (1-10-10to 31-1-11) when its counterpart HDFC has generated 0.67% of
income.
5. The performance levels of HDFC are more lucrative in long run which is also implied
by the total returns of 23.82 % which is 1.66 % higher than that of reliance. In
monthly income plan’s.
6. This study has made an attempt to understand the financial behavior of Mutual Fund
Investors in connection with the preferences of Brand (AMC), Products, Channels
etc.
7. I observed that many of people have fear of Mutual Fund. They think their money will
not be secure in Mutual Fund.
66
BIBLIOGRAPHY
67

Bibliography:
1. DOWEN, R. (1997-2008, july). Department of finance, northern illinois university,
dekalb,illinois,usa
2. GHANAIAN. (2006-2010). Inversting mutual funds in ghana: it's risk, return and perfor-
mance.
3. L.BRYANT, L. (2012, october). Down but not mutual fund manager turn over with in
fund families.
4. LEORA KLAPPER, V. S. (2009). Lhe development of mutual funds around the world.
5. MODULE, J. &. (1999-2008). Market timing ability of indian mutual funds.
6. STAMBAUGH, L. P. (2010, september). Investing in equity mutual funds
WEBSITES:www.amfiindia.acomwww.sebi.comwww.sbimf.comwww.Hdfcmutualfund.comwww.google.comwww.nseindia.com
68