a multivariate comparison of allometric growth patterns
TRANSCRIPT

Society of Systematic Biologists
A Multivariate Comparison of Allometric Growth PatternsAuthor(s): Christian Peter Klingenberg and Rainer FroeseSource: Systematic Zoology, Vol. 40, No. 4 (Dec., 1991), pp. 410-419Published by: Taylor & Francis, Ltd. for the Society of Systematic BiologistsStable URL: http://www.jstor.org/stable/2992236 .
Accessed: 03/09/2013 07:09
Your use of the JSTOR archive indicates your acceptance of the Terms & Conditions of Use, available at .http://www.jstor.org/page/info/about/policies/terms.jsp
.JSTOR is a not-for-profit service that helps scholars, researchers, and students discover, use, and build upon a wide range ofcontent in a trusted digital archive. We use information technology and tools to increase productivity and facilitate new formsof scholarship. For more information about JSTOR, please contact [email protected].
.
Taylor & Francis, Ltd. and Society of Systematic Biologists are collaborating with JSTOR to digitize, preserveand extend access to Systematic Zoology.
http://www.jstor.org
This content downloaded from 205.133.226.104 on Tue, 3 Sep 2013 07:09:29 AMAll use subject to JSTOR Terms and Conditions
Syst. Zool. 40(4):410-419, 1991
A MULTIVARIATE COMPARISON OF ALLOMETRIC GROWTH PATTERNS
CHRISTIAN PETER KLINGENBERG' AND RAINER FROESE2
Department of Fishery Biology, Institut fur Meereskunde an der Universitdt Kiel, Diisternbrooker Weg 20, D - 2300 Kiel 1, Federal Republic of Germany
Abstract.-Multivariate methods for "size correction," such as shearing or multiple-group principal component analysis, assume that the groups under consideration share a common allometric growth pattern. However, this assumption has rarely been tested empirically. A variety of patterns of allometric growth in larvae of 17 species of marine fishes is revealed by principal component analysis. The bootstrap technique is used to assess statistical accuracy, and the hy- pothesis of one common growth pattern is clearly rejected. Even taxonomically related species are not always similar in their growth patterns. This indicates that techniques for "size correction" should not be applied without testing the assumption of a common growth pattern. To summarize the variation in allometric patterns, a recent approach, principal points, is used to find a small number of "typical" patterns. Flury (1990, Biometrika 77:33-41) defined the k principal points of a multivariate random vector X as those points that minimize the expected Euclidean distance of X from the nearest principal point. For our data set, four typical allometric patterns are thus characterized by means of principal points. Some common features of allometric patterns are possibly of functional importance, but combinations of different allometric patterns and initial morphologies can lead to a variety of body forms in fish larvae. [Allometric growth; morpho- metrics; principal component analysis; size correction; principal points; bootstrap.]
Morphometric studies commonly char- acterize multivariate patterns of allometric growth as the first principal components of within-group covariance matrices (Joli- coeur, 1963). Comparisons of allometric patterns often reveal fairly close similari- ties between groups of animals, such as different geographical populations (e.g., Gibson et al., 1984; Voss et al., 1990) or ecological variants (e.g., Meyer, 1990) of one species or several related species (e.g., Boitard et al., 1982; Shea, 1985; Creighton and Strauss, 1986; Klingenberg and Zim- mermann, in press).
A number of procedures for separating variability in "size" (ontogenetic stage) within groups from variation between groups have been devised. These proce- dures are based on the assumption that the groups under consideration share a com- mon growth pattern, and most of these methods use the pooled within-group co- variance matrix to estimate this common
1 Present address: Department of Entomology, Uni- versity of Alberta, Edmonton, Alberta T6G 2E3, Can- ada.
2Present address: ICLARM, MC P.O. Box 1501, Makati, Metro Manila, Philippines.
pattern. Two of the most frequently uti- lized methods are multiple-group princi- pal component analysis (Pimentel, 1979; Thorpe, 1983) and "shearing" (Humphries et al., 1981; Bookstein et al., 1985; Rohlf and Bookstein, 1987). The use of the pooled within-group covariance matrix was criti- cized by Airoldi and Flury (1988) because it implies the assumption that all within- group covariance matrices are identical. Common principal component analysis has been proposed by Airoldi and Flury (1988) as a statistical model to characterize a com- mon growth pattern under less stringent assumptions.
With real data, however, comparisons of several taxa can also reveal significant dif- ferences in growth patterns, as well as gen- eral similarities. Therefore, the methods for "size correction" may not always be ap- propriate. Here we illustrate this point for fish larvae, but we consider it to be of im- portance for comparative studies of grow- ing organisms in general.
Profiles of allometric coefficients in lar- vae of several fish species studied by Fui- man (1983) display the same general pat- tern, but there is also some variation between different species and growth stan-
410
This content downloaded from 205.133.226.104 on Tue, 3 Sep 2013 07:09:29 AMAll use subject to JSTOR Terms and Conditions

1991 COMPARISON OF ALLOMETRIC PATTERNS 411
TABLE 1. Species considered in this study, sample sizes, and ranges of standard length (in millimeters). Species marked with (G) belong to the order Anacanthini (Gadiformes), and species marked with (P) to the Heterosomata (Pleuronectiformes).
No. Speciesa Sample size Range of STANDARD
1 Clupea harengus 50 6.8-19.4 2 Argentina sphyraena 48 4.9-18.5 3 Benthosema glaciale 52 4.0-8.1 4 Merluccius merluccius (G) 45 3.1-7.2 5 Gadiculus argenteus (G) 52 2.5-7.3 6 Merlangius merlangus (G) 52 2.3-8.0 7 Micromesistius poutassou (G) 30 3.5-9.6 8 Pollachius pollachius (G) 51 3.1-11.7 9 Trisopterus sp. (G) 51 4.5-11.9
10 Molva molva (G) 38 3.2-6.7 11 Scomber scombrus 45 2.9-9.2 12 Callionymus sp. 69 1.9-4.2 13 Triglidae, indet. 37 4.2-15.2 14 Lepidorhombus boscii (P) 41 3.5-8.0 15 Lepidorhombus whiffiagonis (P) 43 3.5-12.7 16 Glyptocephalus cynoglossus (P) 28 3.3-12.5 17 Microchirus variegatus (P) 31 2.3-7.0
a Names and classification according to Hureau and Monod (1973).
zas. Bivariate plots and multivariate allo- metric coefficients given by Strauss and Fuiman (1985) show some striking dis- crepancies in growth patterns between species of one family (Cottidae). Given the extreme changes in both size and shape undergone by many fish species during early ontogeny, and the diversity of body forms they thus achieve, it seems unlikely that there should be a common growth pat- tern, even within groups of closely related species. Many fish species exhibit simple allometric growth during the postlarval period from the absorption of the yolk sac to the onset of metamorphosis, and thus can be characterized by their allometric growth patterns. This approach is not ap- propriate, however, if there are several dis- tinct growth stanzas, and it is essential to examine the growth trajectory of each spe- cies before analysis.
Patterns of allometric growth in several traits often have been compared by graphic methods (e.g., Fuiman, 1983). Alternative- ly, allometric patterns, as they are revealed by the vectors of first principal component coefficients (Jolicoeur, 1963), can be treated as multivariate observations characteriz- ing the species from which they were de- rived. The distribution of the patterns of allometric growth can then be visualized
in the space spanned by the allometric co- efficients of the original traits. A number of questions arise in this context, some of which we will consider briefly. Are allo- metric patterns continuously distributed in this coefficient space, or are there dis- crete "clusters" of patterns displayed by many species, and "gaps" between them, i.e., theoretical patterns that are not real- ized at all? Is there a connection between similarity in growth patterns and taxo- nomic relatedness of the respective spe- cies? What are the functional and ecolog- ical implications of allometric patterns?
In this paper, we characterize 17 taxa of marine fishes by the multivariate allome- tric patterns (i.e., the vectors of first prin- cipal component coefficients) of their lar- vae. The variation in growth patterns is then summarized in fewer dimensions by principal component analysis, and a small number of "typical" patterns is character- ized by principal points (Flury, 1990).
MATERIALS AND METHODS
Most of the fish larvae used in the pres- ent study (Table 1) were collected in the Celtic Sea in April 1986 during a cruise of the research vessel Poseidon (for details of methods and location, see R6pke [1989]), and a smaller part of the material was ob-
This content downloaded from 205.133.226.104 on Tue, 3 Sep 2013 07:09:29 AMAll use subject to JSTOR Terms and Conditions

412 SYSTEMATIC ZOOLOGY VOL. 40
tained from collections of fish larvae at the Institut fur Meereskunde, Kiel. All the lar- vae were stored in buffered 4% formalde- hyde solution in fresh water. Although three of the taxa could not be identified to the species level, we will refer to them as species in this paper. Because the samples of these three taxa were fairly uniform morphometrically, each of them probably does represent a single species. The only taxon with two distinct growth stanzas was Callionymus sp., where a clear change of the growth pattern occurs at a standard length of about 4.5 mm, coinciding with the dif- ferentiation of the preopercular spines (Russell, 1976); the specimens of the sec- ond stanza were excluded from analysis, reducing the sample size for this taxon from 84 to 69. As far as possible, we will refer to the species by their generic names, with- out implying, however, that our results ex- tend to species other than those considered here.
Ten variables were measured in each lar- va: standard length (STANDARD; length from the tip of the snout to the end of the urostyle), prepectoral length (PREPEC; length from the tip of the snout to the bases of the pectoral fins), body width at the pec- torals (PECWID; width of the body above the bases of the pectoral fins), body width at anus (ANALWID; width of the body above the anus), preanal length (PRE- ANAL; length from the tip of the snout to the anus), preorbital length (PREORB; length from the tip of the snout to the anterior margin of the eyes), diameter of the eye (DIAMEYE; measured in dorso- ventral direction), depth of the head (HEADDEP; measured at the center of the eyes), body depth at the pectorals (DEPTH- PEC; depth of the body at the bases of the pectoral fins, without dorsal fin margin), and depth of the body immediately behind the anus (DEPTHANU; depth of the body without marginal fins). All measurements were taken by the same person (R.F.) using a video system (for further details, see Froese [1990]).
The data were transformed to natural logarithms before analysis. To estimate patterns of multivariate growth allometry,
principal component analyses were carried out separately for each species using co- variance matrices (Jolicoeur, 1963). Angles between principal components (PCs) were computed as the arccosine of the inner product of the respective PCs (Pimentel, 1979). The bootstrap method (Efron and Tibshirani, 1986) was applied to determine standard errors for the coefficients of the first PCs and the percentages of total vari- ance explained by the first PCs, with 1,000 bootstrap iterations for each species.
To display the variation among multi- variate allometric patterns in fewer di- mensions, a principal component analysis was performed on the covariance matrix of the allometric patterns, i.e., using the vec- tors of first PC coefficients of the 17 species as "observations." The resulting principal components are orthogonal axes of maxi- mal variation in allometric patterns among species. However, these components can- not be interpreted in the usual way, and they will only be used to display the vari- ation graphically. Confidence ellipses for the allometric patterns of all species were calculated using the bootstrap estimates from the previous step (for a discussion on the use of confidence ellipses, see Owen and Chmielewski [1985]).
To reduce the number of allometric pat- terns to be compared, we used a novel ap- proach, principal points (Flury, 1990). Principal points summarize the variation of allometric patterns in a small number of "typical" patterns drawn from the the- oretical distribution of allometric patterns in fish larvae, i.e., hypothetical observa- tions that together should be representa- tive of the underlying distribution. The k principal points of a p-variate random vec- tor X are defined as those points that min- imize the expected Euclidean distance of X from the nearest principal point (Flury, 1990). If k = 1, the only principal point is the mean vector of X, and, if k = N in a sample of N observations, each observation is a principal point. Flury (in press) defined the sample mean squared deviation (SMSD), the average squared Euclidean distance between each observation of the sample and the nearest principal point, as
This content downloaded from 205.133.226.104 on Tue, 3 Sep 2013 07:09:29 AMAll use subject to JSTOR Terms and Conditions

1991 COMPARISON OF ALLOMETRIC PATTERNS 413
a measure of performance for principal points. If k = 1, the SMSD will equal the total variance in the sample (multiplied by (N - 1)/N, because N - 1 is used as the denominator in the computation of vari- ances), and if k = N, the SMSD will be zero because every observation is also a prin- cipal point. Between these two extremes, the SMSD falls steeply at the beginning and more slowly as k increases (see ex- amples in Flury [1990, in press]).
When no assumptions about the proba- bility distribution of the observations in a sample are made, the k-means clustering algorithm (e.g., Hartigan and Wong, 1979) can be used to estimate the principal points for a given k (Flury, in press). This algo- rithm finds k subsets of observations that minimize the sum of squared distances of the points from the nearest group centroid. Thereby, the cluster centroids are esti- mates of the principal points. The algo- rithm requires initial guesses on the group centroids (seeds), which are generally cho- sen from the sample of observations. De- pending on the choice of the set of seeds, the algorithm will converge on a local min- imum of the within-group sum of squares, which need not be the global minimum of all possible partitions (Hartigan and Wong, 1979; Flury, in press), and therefore the group centroids will not always be valid estimates of the k principal points. We es- timated principal points of the 17 allo- metric patterns for k varying from 1 to 17. The FORTRAN program to estimate prin- cipal points used the subroutine KMEAN from the IMSL/STAT program library, which is an implementation of the k-means clustering algorithm of Hartigan and Wong (1979). All possible sets of k points were used as seeds for the k-means clustering algorithm, and the solution with the small- est SMSD was taken as the estimate for the principal points.
Statistical accuracy of principal point es- timates was assessed in either of two ways, corresponding to two different sources of statistical error. First, principal point esti- mates depend on the set of species under consideration; the associated sampling variability was evaluated by a point-dele-
tion procedure, i.e., successively omitting the allometric pattern of each species from the analysis and estimating the principal points using the remaining 16 patterns. Second, the sampling error of the estimates of allometric patterns is another source of error for the principal point estimates of any given set of species; thus, principal points were computed for 100 sets of boot- strap estimates of the allometric patterns of all 17 species. In both kinds of analysis it was not always possible to allocate the principal points of resampled data sets un- ambiguously to the estimates derived from the original data, and we will therefore only display the results graphically, with- out giving statistics such as standard errors or confidence intervals.
RESULTS
The first principal components (PCs) ex- plain the largest part of total variance in all 17 species (Table 2). The estimates of the PCs are fairly stable, as can be seen from the relatively small standard errors of the PC coefficients. There is consider- able variation among species, as can be seen from the angles between allometric vec- tors, which range from 3.4? to 230.
Most PC coefficients clearly differ from 0.316 (=1IVii0), the theoretical value for isometry (Jolicoeur, 1963). Standard length exhibits negative allometric growth in all species except Glyptocephalus, where it is very close to isometry. Negative allometry or isometry is also seen for preanal length. The allometric coefficients of prepectoral length and of the pectoral and anal body widths vary considerably among species. A consistent pattern can be seen in head traits, where the PC coefficients indicate positive allometry for preorbital length and clearly negative allometry for eye diameter in all 17 species. Head depth displays neg- ative allometry, except for Benthosema and the two species of Lepidorhombus, where it grows isometrically. These three species, Callionymus, and Microchirus show positive allometry of body depth at the pectorals, whereas Glyptocephalus and the Triglidae exhibit isometry and all other species show clearly negative allometric growth in that
This content downloaded from 205.133.226.104 on Tue, 3 Sep 2013 07:09:29 AMAll use subject to JSTOR Terms and Conditions

414 SYSTEMATIC ZOOLOGY VOL. 40
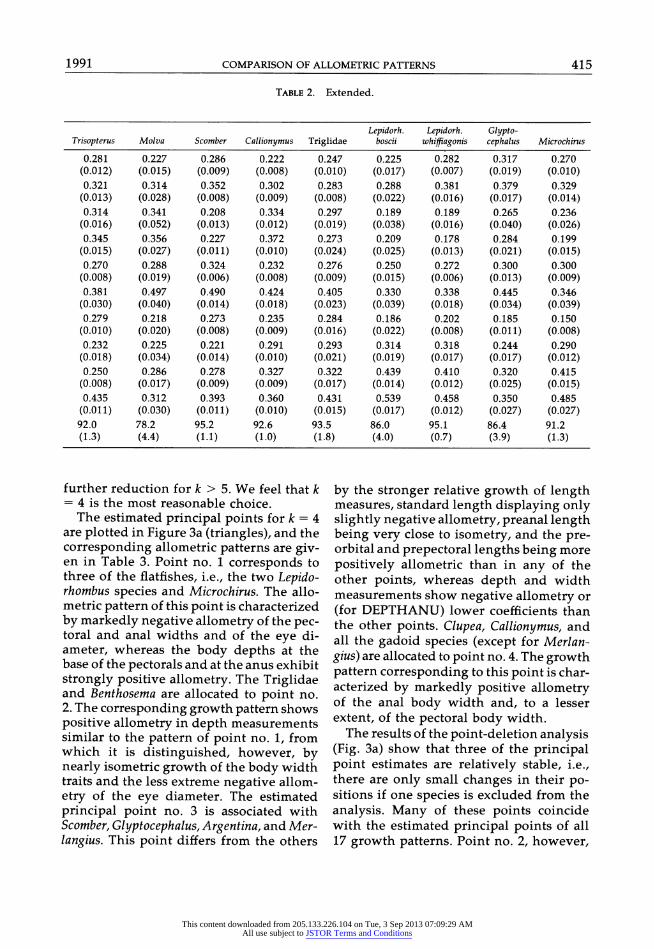
TABLE 2. Allometric patterns of fish larvae. First principal component coefficients, percentages of total variance explained, and corresponding standard errors (in parentheses).
Micro- Variable Clupea Argentina Benthosema Merluccius Gadiculus Merlangius mesistius Pollachius
STANDARD 0.262 0.305 0.237 0.241 0.262 0.256 0.261 0.253 (0.008) (0.009) (0.012) (0.012) (0.010) (0.010) (0.009) (0.005)
PREPEC 0.280 0.335 0.303 0.301 0.289 0.368 0.350 0.332 (0.011) (0.011) (0.012) (0.017) (0.011) (0.012) (0.010) (0.005)
PECWID 0.315 0.264 0.351 0.337 0.357 0.250 0.299 0.309 (0.026) (0.020) (0.017) (0.024) (0.013) (0.021) (0.011) (0.008)
ANALWID 0.364 0.323 0.268 0.370 0.378 0.313 0.357 0.364 (0.025) (0.019) (0.021) (0.019) (0.017) (0.018) (0.015) (0.009)
PREANAL 0.258 0.317 0.320 0.287 0.259 0.334 0.272 0.239 (0.008) (0.016) (0.012) (0.011) (0.006) (0.008) (0.007) (0.016)
PREORB 0.436 0.445 0.329 0.395 0.386 0.397 0.332 0.373 (0.027) (0.024) (0.025) (0.026) (0.025) (0.031) (0.036) (0.017)
DIAMEYE 0.237 0.241 0.225 0.219 0.252 0.272 0.295 0.276 (0.012) (0.011) (0.013) (0.011) (0.008) (0.012) (0.009) (0.006)
HEADDEP 0.233 0.244 0.312 0.257 0.266 0.262 0.297 0.264 (0.012) (0.012) (0.014) (0.014) (0.016) (0.021) (0.017) (0.008)
DEPTHPEC 0.283 0.291 0.387 0.295 0.284 0.277 0.264 0.279 (0.013) (0.013) (0.017) (0.017) (0.009) (0.016) (0.009) (0.006)
DEPTHANU 0.417 0.346 0.387 0.402 0.383 0.388 0.404 0.422 (0.031) (0.026) (0.013) (0.019) (0.014) (0.023) (0.012) (0.008)
% variance 86.9 91.1 88.5 89.6 92.9 90.2 94.9 97.3 (2.2) (1.2) (1.9) (1.9) (1.7) (1.7) (1.2) (0.5)
character. The allometric coefficients for tail depth near the anus clearly exceed the iso- metric value in all species except Molva molva.
To display the variation among allome- tric patterns, the vectors of first PC coef- ficients were used as observations for an- other principal component analysis. However, because the number of obser- vations (N = 17 species) is small, the PCs are very unstable and will only be used as a projection of the 10-dimensional space onto a 2-dimensional subspace summariz- ing the maximal proportion of total vari- ance among allometric patterns. The first PC explains 55% of total variance and the second PC 20%. In Figure 1, the PC scores of the allometric patterns of the 17 species are shown together with the 68% confi- dence ellipses derived from the bootstrap estimates of the patterns (for comparison: the axes of confidence ellipses at the 95% probability level would be about twice as long as those at the 68% level). The two Lepidorhombus species (nos. 14, 15) and Mi- crochirus (no. 17) are distinct from all other
species. A fairly tight cluster is formed by the growth patterns of five gadoid species (nos. 4, 5, 7-9), Callionymus (no. 12), and Clupea (no. 1). The allometric patterns of the remaining species are more widely spaced, but there are no really distinct "gaps" between these species.
Principal points were estimated for k varying from 1 to 17, to assess the optimal number of principal points. The k-means algorithm converged on more than one set of points for several values of k (for k = 4, 3 sets; k = 5, 10 sets; k = 6, 17 sets; k = 7, 19 sets; k = 8, 21 sets; k = 13, 3 sets; k = 14, 2 sets; k = 16, 2 sets). The solution with the smallest SMSD was used as the estimate of the principal points in these instances. Figure 2 shows that the decrease of the resulting values of the SMSD is very steep initially, but rapidly decelerates with in- creasing k. The curve is fairly smooth, mak- ing it difficult to find a cut-off point using objective criteria. However, there is a sub- stantial reduction in the SMSD between k = 2 and k = 3, and there is no important
This content downloaded from 205.133.226.104 on Tue, 3 Sep 2013 07:09:29 AMAll use subject to JSTOR Terms and Conditions
1991 COMPARISON OF ALLOMETRIC PATTERNS 415
TABLE 2. Extended.
Lepidorh. Lepidorh. Glypto- Trisopterus Molva Scomber Callionymus Triglidae boscii whiffiagonis cephalus Microchirus
0.281 0.227 0.286 0.222 0.247 0.225 0.282 0.317 0.270 (0.012) (0.015) (0.009) (0.008) (0.010) (0.017) (0.007) (0.019) (0.010) 0.321 0.314 0.352 0.302 0.283 0.288 0.381 0.379 0.329
(0.013) (0.028) (0.008) (0.009) (0.008) (0.022) (0.016) (0.017) (0.014) 0.314 0.341 0.208 0.334 0.297 0.189 0.189 0.265 0.236
(0.016) (0.052) (0.013) (0.012) (0.019) (0.038) (0.016) (0.040) (0.026) 0.345 0.356 0.227 0.372 0.273 0.209 0.178 0.284 0.199
(0.015) (0.027) (0.011) (0.010) (0.024) (0.025) (0.013) (0.021) (0.015) 0.270 0.288 0.324 0.232 0.276 0.250 0.272 0.300 0.300
(0.008) (0.019) (0.006) (0.008) (0.009) (0.015) (0.006) (0.013) (0.009) 0.381 0.497 0.490 0.424 0.405 0.330 0.338 0.445 0.346
(0.030) (0.040) (0.014) (0.018) (0.023) (0.039) (0.018) (0.034) (0.039) 0.279 0.218 0.273 0.235 0.284 0.186 0.202 0.185 0.150
(0.010) (0.020) (0.008) (0.009) (0.016) (0.022) (0.008) (0.011) (0.008) 0.232 0.225 0.221 0.291 0.293 0.314 0.318 0.244 0.290 (0.018) (0.034) (0.014) (0.010) (0.021) (0.019) (0.017) (0.017) (0.012) 0.250 0.286 0.278 0.327 0.322 0.439 0.410 0.320 0.415
(0.008) (0.017) (0.009) (0.009) (0.017) (0.014) (0.012) (0.025) (0.015) 0.435 0.312 0.393 0.360 0.431 0.539 0.458 0.350 0.485
(0.011) (0.030) (0.011) (0.010) (0.015) (0.017) (0.012) (0.027) (0.027) 92.0 78.2 95.2 92.6 93.5 86.0 95.1 86.4 91.2 (1.3) (4.4) (1.1) (1.0) (1.8) (4.0) (0.7) (3.9) (1.3)
further reduction for k > 5. We feel that k = 4 is the most reasonable choice.
The estimated principal points for k = 4 are plotted in Figure 3a (triangles), and the corresponding allometric patterns are giv- en in Table 3. Point no. 1 corresponds to three of the flatfishes, i.e., the two Lepido- rhombus species and Microchirus. The allo- metric pattern of this point is characterized by markedly negative allometry of the pec- toral and anal widths and of the eye di- ameter, whereas the body depths at the base of the pectorals and at the anus exhibit strongly positive allometry. The Triglidae and Benthosema are allocated to point no. 2. The corresponding growth pattern shows positive allometry in depth measurements similar to the pattern of point no. 1, from which it is distinguished, however, by nearly isometric growth of the body width traits and the less extreme negative allom- etry of the eye diameter. The estimated principal point no. 3 is associated with Scomber, Glyptocephalus, Argentina, and Mer- langius. This point differs from the others
by the stronger relative growth of length measures, standard length displaying only slightly negative allometry, preanal length being very close to isometry, and the pre- orbital and prepectoral lengths being more positively allometric than in any of the other points, whereas depth and width measurements show negative allometry or (for DEPTHANU) lower coefficients than the other points. Clupea, Callionymus, and all the gadoid species (except for Merlan- gius) are allocated to point no. 4. The growth pattern corresponding to this point is char- acterized by markedly positive allometry of the anal body width and, to a lesser extent, of the pectoral body width.
The results of the point-deletion analysis (Fig. 3a) show that three of the principal point estimates are relatively stable, i.e., there are only small changes in their po- sitions if one species is excluded from the analysis. Many of these points coincide with the estimated principal points of all 17 growth patterns. Point no. 2, however,
This content downloaded from 205.133.226.104 on Tue, 3 Sep 2013 07:09:29 AMAll use subject to JSTOR Terms and Conditions

416 SYSTEMATIC ZOOLOGY VOL. 40
11.
0 15.~~~~~~~~~~~~~~6 0 0-
@17
*14 3*
Pc1 FIGURE 1. Principal component analysis of multivariate allometric patterns in larvae of 17 fish species. PC
scores of the allometric patterns of each species and 68% confidence ellipses derived from the respective bootstrap estimates are plotted. The species are numbered as in Table 1.
SMSD
0.02t
0.01-
5 10 15 k FIGURE 2. Sample mean squared deviations (SMSD)
for k ranging from 1 to 17. Triangles give the SMSD values for all sets of points where the k-means al- gorithm converged. The line joins the lowest SMSD values (corresponding to the principal points) for ev- ery k. See text for further explanation.
shifts far toward point no. 4 when Bentho- sema is omitted (Fig. 3a, arrow), and Molva may be allocated to either point no. 3 or no. 4, depending on the species excluded.
The principal points estimated from sets of bootstrap estimates of allometric pat- terns (Fig. 3b) form distinct "clouds" sur- rounding the original principal point nos. 1, 3, and 4, indicating that these points are fairly well defined. The "cloud" around point no. 2, however, is not as well delim- ited as those of the other principal points, and is somewhat difficult to separate from the "cloud" of point no. 4. A few of the principal point estimates are interspersed, without clear relation to one of the four main clouds, corresponding to combina- tions of extreme bootstrap estimates of the allometric patterns.
This content downloaded from 205.133.226.104 on Tue, 3 Sep 2013 07:09:29 AMAll use subject to JSTOR Terms and Conditions

1991 COMPARISON OF ALLOMETRIC PATTERNS 417
3
] . ~~~~2A oe." 4
PC1 N
X-I. XaX pci N x p. a
FIrURE 3. Plots of the principal component scores of allometric patterns (dots; as in Fig. 1) and the es- timated principal points (triangles) for k = 4. (a) Point- deletion analysis for principal points. Squares rep- resent principal points computed with one allometric pattern excluded from the analysis. The arrow indi- cates the position of principal point no. 2 when Ben- thosema is omitted. Principal points are numbered as in the text and in Table 3. (b) Principal points (marked with x) for 100 sets of bootstrap estimates of allo- metric patterns of the 17 species.
DISCUSSION
Principal component analyses revealed a considerable amount of variation among patterns of allometric growth in larvae of 17 fish species. There is a broad overlap in the bootstrap estimates of some allometric patterns, but there are also clear "gaps" (see Fig. 1). The hypothesis of an allometric pattern common to all 17 species must therefore be rejected. However, the num- ber of species in the present study is in-
TABLE 3. Allometric patterns of estimated princi- pal points for k = 4.
Principal point no.
Variable 1 2 3 4
STANDARD 0.259 0.242 0.291 0.251 PREPEC 0.333 0.293 0.358 0.311 PECWID 0.204 0.324 0.247 0.326 ANALWID 0.195 0.271 0.287 0.363 PREANAL 0.274 0.298 0.319 0.263 PREORB 0.338 0.367 0.444 0.403 DIAMEYE 0.179 0.254 0.243 0.251 HEADDEP 0.307 0.302 0.243 0.258 DEPTHPEC 0.421 0.354 0.291 0.284 DEPTHANU 0.494 0.409 0.369 0.392
sufficient for generalizations on the distri- bution of growth patterns in fish larvae, and it is impossible to decide whether the gaps between different patterns are due to the existence of distinct types of multivar- iate growth, or whether they result from poor sampling of growth patterns contin- uously distributed in the space of allo- metric coefficients.
Taxonomic relations between the species are not directly reflected by the similarity of the respective allometric patterns. The fairly dense cluster formed by five of the seven species from the order Anacanthini also contains Clupea and Callionymus, which are not closely related to that order. On the other hand, two of the six species of Gad- idae (Molva and Merlangius) have growth patterns distinct from the other four. Three flatfish species (the two Lepidorhombus spe- cies and Microchirus) form a group that is clearly separated from all other species, in- cluding the fourth flatfish considered here (Glyptocephalus). This reflects the diversity of larval forms within the order Hetero- somata: the Scophthalmidae (including Lepidorhombus) and Soleidae (including Mi- crochirus) having deep-bodied larvae, and the Pleuronectidae (including Glyptocepha- lus) having elongate larvae (Ahlstrom et al., 1984). The angle between the allome- tric vectors of the two Lepidorhombus spe- cies is 8.3?. The difference in the allometric patterns between these two congeneric species is considerable, compared to the variation of patterns of different genera
This content downloaded from 205.133.226.104 on Tue, 3 Sep 2013 07:09:29 AMAll use subject to JSTOR Terms and Conditions

418 SYSTEMATIC ZOOLOGY VOL. 40
within the Gadidae. Therefore, even close- ly related species need not be very similar in their patterns of allometric growth. However, other studies found a closer cor- respondence: e.g., Boitard et al. (1982) in a complex of four isopod species and their hybrids, and Klingenberg and Zimmer- mann (in press) in nine species of two gen- era of waterstriders.
Because allometric patterns can differ significantly even between closely related species, techniques for "size correction," which all require a pattern of growth com- mon to the groups under consideration (Rohlf and Bookstein, 1987; Airoldi and Flury, 1988), should not be applied without prior examination of the variation within groups. The underlying model that the taxa under consideration share a common growth pattern should be tested explicitly whenever possible. A specific test is avail- able for common principal component analysis (Flury, 1988). The bootstrap tech- nique may be helpful when parametric tests are not applicable because their assump- tions (e.g., multivariate normal distribu- tion) are not fulfilled. The hypothetical common pattern is then compared with the bootstrap estimates of the allometric pat- tern for each species. The "gaps" between patterns in Figure 1 show that no growth pattern is common to all 17 species in the present data set.
If one is interested exclusively in the separation of the species under consider- ation, errors caused by violating the as- sumption of equal allometric patterns need not altogether invalidate the results of the analysis. However, it must be kept in mind that "size correction" in these cases will not yield patterns of variation among groups independent of the variation with- in groups ("size"). A simple graphic meth- od to avoid these problems is the "tomo- graphic presentation" of Boitard et al. (1982), which uses a principal component analysis of the pooled samples. The scores of the second and subsequent principal components are plotted separately for sev- eral levels of first principal component scores. Because the first principal compo- nent of the pooled samples is often highly
correlated with first within-group princi- pal components, this method allows com- parison of the variation among groups at different levels of "size" without making any assumptions about the patterns of al- lometric growth of the groups under con- sideration.
To facilitate comparison of growth pat- terns in the absence of an allometric pat- tern common to all the species under con- sideration, one can look for a small number, k, of "typical" patterns that optimally char- acterize the observed distribution. Princi- pal points (Flury, 1990) give such patterns for any distribution with finite variances. In our example, we can reduce the points to be compared to four principal points instead of the allometric patterns of all 17 species. All four estimated principal points of our data set have several features in com- mon. The eye diameter exhibits clearly negative allometry. Standard length and preanal length show negative allometry or isometry, whereas body depth behind the anus exhibits strongly positive allometry. Therefore, the body, and especially its pos- terior part, becomes relatively shorter and stouter with increasing size of the larva. This is probably related to the change in swimming style during larval growth, as- sociated with increasing importance of the tail region for locomotion (e.g., Webb and Weihs, 1986). Preorbital length shows pos- itive allometry for all four points, reflect- ing the elongation of the anterior part of the head, which results in enlargement of the mouth, allowing the larvae to feed on larger food items.
The width and depth measures contrib- ute most of the variation between esti- mated principal points. Point no. 1 is char- acterized by negative allometry of body widths and positive allometry of body depths, corresponding to the lateral com- pression typical of the adult body form of these three flatfishes. On the other hand, species with very diverse larval and adult body forms are allocated to the other prin- cipal points, especially to point no. 3. Therefore, variation in allometric growth patterns among species is only partly con- sistent with variation in body forms of lar-
This content downloaded from 205.133.226.104 on Tue, 3 Sep 2013 07:09:29 AMAll use subject to JSTOR Terms and Conditions

1991 COMPARISON OF ALLOMETRIC PATTERNS 419
vae (Froese, 1990) or adults, and various combinations of initial body forms and growth patterns can achieve a diversity of juvenile and adult forms. Strauss and Fui- man (1985) found that the interspecific morphometric differences in larvae closely correspond to those in adults of five species of Cottidae. This result is not confirmed in the present study for a more diverse spec- trum of species.
ACKNOWLEDGMENTS
We thank Andreas Ropke for supplying fish larvae; Bernhard Flury for providing a copy of a manuscript before publication, and for critical comments on a draft of the present paper; Matthias Seaman for cor- recting the English; and David Hillis and two anon- ymous reviewers for helpful suggestions. This work was supported in part by German Academic Exchange Service grant 313/024/007/0 to C.P.K.
REFERENCES
AHLSTROM, E. H., K. AMAoKA, D. A. HENSLEY, H. G. MOSER, AND B. Y. SUMIDA. 1984. Pleuronecti- formes: Development. Pages 640-670 in Ontogeny and systematics of fishes (H. G. Moser, ed.). Am. Soc. Ichthyol. Herpetol. Spec. Publ. 1.
AIROLDI, J.-P., AND B. K. FLURY. 1988. An application of common principal component analysis to cranial morphometry of Microtus californicus and M. och- rogaster (Mammalia, Rodentia). J. Zool. (Lond.) 216: 21-36.
BOITARD, M., J. LEFEBVRE, AND M. SOLIGNAC. 1982. Analyse en composantes principales de la variabi- lite de taille, de croissance et de conformation des esp&ces du complexe Jaera albifrons (Crustaces Iso- podes). Cah. Biol. Mar. 23:115-142.
BooKSTIN, F. L., B. CHERNOFF, R. L. ELDER, J. M. HUMPHRIES, G. R. SMITH, AND R. E. STRAUSS. 1985. Morphometrics in evolutionary biology. Acad. Nat. Sci. Phila. Spec. Publ. 15.
CREIGHTON, G. K., AND R. E. STRAUSS. 1986. Com- parative patterns of growth and development in cricetine rodents and the evolution of ontogeny. Evolution 40:94-106.
EFRON, B., AND R. TIBSHIRANI. 1986. Bootstrap meth- ods for standard errors, confidence intervals, and other measures of statistical accuracy. Stat. Sci. 1: 54-77.
FLURY, B. 1988. Common principal components and related multivariate models. John Wiley and Sons, New York.
FLURY, B. 1990. Principal points. Biometrika 77:33- 41.
FLURY, B. In press. Estimation of principal points. Appl. Stat.
FROESE, R. 1990. Moderne Methoden zur Bestim- mung von Fischlarven. Ph.D. Thesis, Univ. Ham- burg, Hamburg.
FUIMAN, L. A. 1983. Growth gradients in fish larvae. J. Fish Biol. 23:117-123.
GIBSON, A. R., A. J. BAKER, AND A. MOEED. 1984. Mor- phometric variation in introduced populations of the common myna (Acridotheres tristis): An appli- cation of the jackknife to principal component anal- ysis. Syst. Zool. 33:408-421.
HARTIGAN, J. A., AND M. A. WONG. 1979. Algorithm AS 136: A K-means clustering algorithm. Appl. Stat. 28:100-108.
HUMPHRIES, J. M., F. L. BOOKSTEIN, B. CHERNOFF, G. R. SMITH, R. L. ELDER, AND S. G. Poss. 1981. Multi- variate discrimination by shape in relation to size. Syst. Zool. 30:291-308.
HUREAU, J. C., AND T. MONOD (eds.). 1973. Check- list of the fishes of the north-eastern Atlantic and of the Mediterranean. UNESCO, Paris.
JOLICOEUR, P. 1963. The multivariate generalization of the allometry equation. Biometrics 19:497-499.
KLINGENBERG, C. P., AND M. ZIMMERMAN. In press. Static, ontogenetic, and evolutionary allometry: A multivariate comparison in nine species of water- striders. Am. Nat.
MEYER, A. 1990. Morphometrics and allometry in the trophically polymorphic cichlid fish, Cichlasto- ma citrinellum: Alternative adaptations and onto- genetic changes in shape. J. Zool. (Lond.) 221:237- 260.
OWEN, J. G., AND M. A. CHMIELEWSKI. 1985. On ca- nonical variates analysis and the construction of confidence ellipses in systematic studies. Syst. Zool. 34:366-374.
PIMENTEL, R. A. 1979. Morphometrics: The multi- variate analysis of biological data. Kendall!/Hunt Publishing Co., Dubuque, Iowa.
ROHLF, F. J., AND F. L. BOOKSTEIN. 1987. A comment on shearing as a method for "size correction." Syst. Zool. 36:356-367.
R6PKE, A. 1989. Small-scale vertical distribution of ichthyoplankton in the Celtic Sea in April 1986. Meeresforschung 32:192-203.
RUSSELL, F. S. 1976. The eggs and planktonic stages of British marine fishes. Academic Press, London.
SHEA, B. T. 1985. Bivariate and multivariate growth allometry: Statistical and biological considerations. J. Zool. (Lond.) 206:367-390.
STRAUSS, R. E., AND L. A. FUIMAN. 1985. Quantitative comparisons of body form and allometry in larval and adult Pacific sculpins (Teleostei: Cottidae). Can. J. Zool. 63:1582-1589.
THORPE, R. S. 1983. A review of the numerical meth- ods for recognising and analysing racial differen- tiation. Pages 404-423 in Numerical taxonomy (J. Felsenstein, ed.). Springer-Verlag, Berlin.
Voss, R. S., L. F. MARCUS, AND P. EscALANTE P. 1990. Morphological evolution in muroid rodents I. Con- servative patterns of craniometric covariance and their ontogenetic basis in the Neotropical genus Zygodontomys. Evolution 44:1568-1587.
WEBB, P. W., AND D. WEIHS. 1986. Functional loco- motor morphology of early life history stages of fishes. Trans. Am. Fish. Soc. 115:115-127.
Received 24 August 1990; accepted 30 June 1991
This content downloaded from 205.133.226.104 on Tue, 3 Sep 2013 07:09:29 AMAll use subject to JSTOR Terms and Conditions