a measurement strategy for green economy in korea ppt measurement strategy for... · a measurement...
TRANSCRIPT

59th World Statistics Congress,Hong Kong,STS085 28August2013 1
A Measurement Strategyfor Green Economyy
in Korea
Kyung Sam Min
Statistical Research InstituteStatistics Korea
Expert Group Meeting on Strategies for Improving Environment Statistics
in Asia and the Pacific
2 – 4 December 2013, Bangkok, Thailand
Contents
1. Background
2. Framework of Green Growth Indicators
3. Framework of Green Life-style Indicators
4. Development Strategy of SEEA-CF
5. Compilation of Green Industry Statisticsp y
Expert Group Meeting on Strategies for Improving Environment Statistics 2-4 December 20132
6. Use of Indicators and Statistics in Policy
59th World Statistics Congress,Hong Kong,STS085 28August2013 2
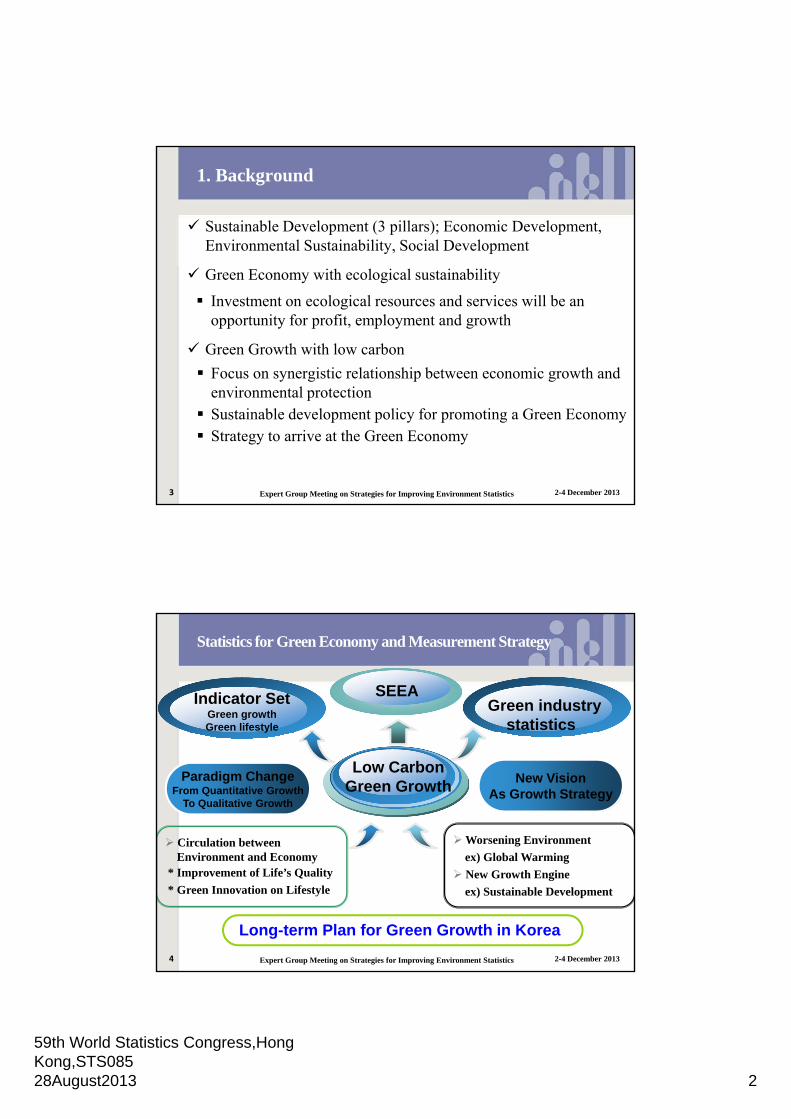
1. Background
Sustainable Development (3 pillars); Economic Development, Environmental Sustainability, Social Development
Green Economy with ecological sustainability
Investment on ecological resources and services will be an opportunity for profit, employment and growth
Green Growth with low carbon
Focus on synergistic relationship between economic growth and environmental protection Sustainable development policy for promoting a Green Economy Strategy to arrive at the Green Economy
3 Expert Group Meeting on Strategies for Improving Environment Statistics 2-4 December 2013
Statistics for Green Economy and Measurement Strategy
SEEAIndicator SetGreen growthGreen lifestyle
Green industrystatistics
Circulation between Worsening Environment
Paradigm ChangeFrom Quantitative Growth
To Qualitative Growth
New VisionAs Growth Strategy
y
Low Carbon Green Growth
4
Environment and Economy* Improvement of Life’s Quality
* Green Innovation on Lifestyle
Long-term Plan for Green Growth in Korea
ex) Global Warming
New Growth Engine
ex) Sustainable Development
Expert Group Meeting on Strategies for Improving Environment Statistics 2-4 December 2013
59th World Statistics Congress,Hong Kong,STS085 28August2013 3
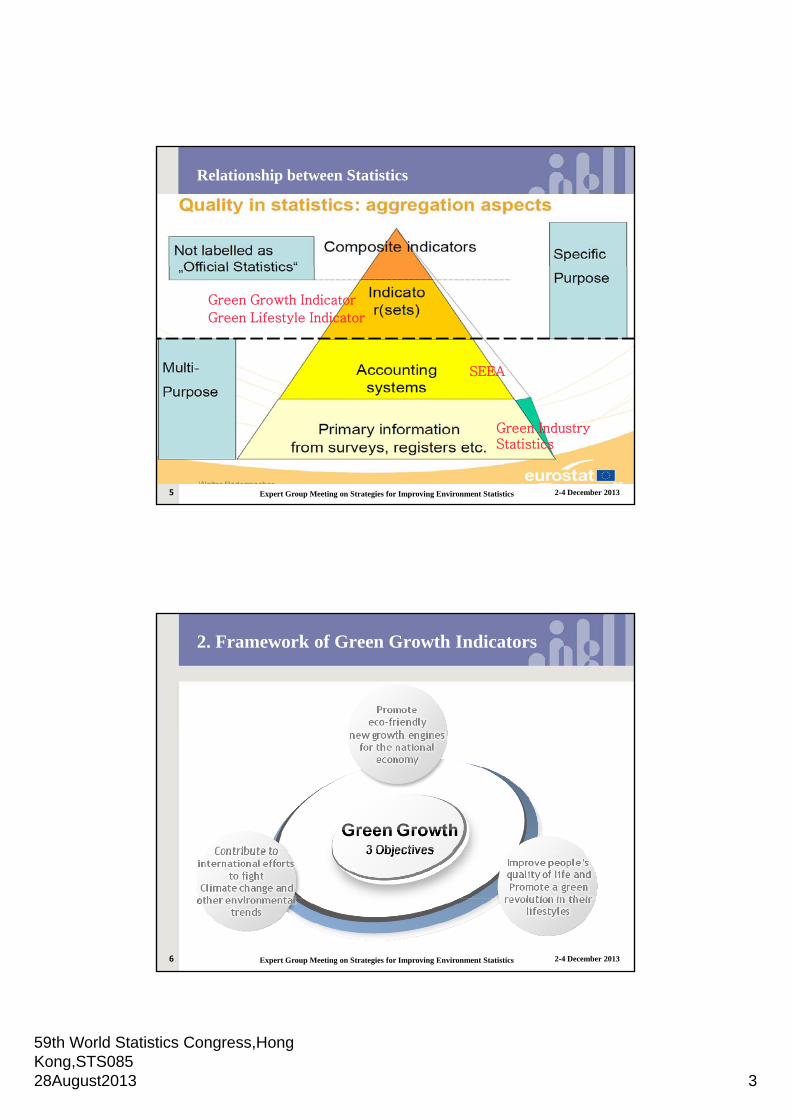
Relationship between Statistics
Green Growth Indicator
Green Lifestyle Indicator
SEEA
5
Green Industry Statistics
Expert Group Meeting on Strategies for Improving Environment Statistics 2-4 December 2013
2. Framework of Green Growth Indicators
6 Expert Group Meeting on Strategies for Improving Environment Statistics 2-4 December 2013

59th World Statistics Congress,Hong Kong,STS085 28August2013 4
Development Process for Indicator Set
Definition FrameworkDesign
Indicator Selection
Indicator Metadata
UtilizationPlan
MetadataInformation
* Definition
* Related Polices
* P li T t
Determine concepts of green growth(or life-style)
Scope
Reviewtheoretical backgroundof indicators
* Green Growth
PotentialIndicator Set
Select Tentative Indicators
Indicator Analysis
* Comparisonswith Targets
Calculate
7
* Policy Targetsof Indicators
No Data → Should be
compiled
Definition Policies (Laws)
* Indicators inInternationalOrganization
(for comparison)
* Experts’ Insights
* PolicyRelevance
* Data Reliability
CalculateIndex for Status
* Standardizationof Indicators
Expert Group Meeting on Strategies for Improving Environment Statistics 2-4 December 2013
Framework of GGIs in Korea
A framework of GGIs is based on the policy structure and targets which were derived from 5-Year Action Plan*(2009) as Green Growth’s National StrategyStrategy.
* This Action Plan consists of 3 strategies and 10 policy directions
30 Core indicators were selected by criteria of indicator selection
(ex: policy relevance**, analytical soundness, data availability).** Some indicators were selected because the policy relevance is high.
GGIs ha e also 3 categories and 10 gro ps of indicators
8
GGIs have also 3 categories and 10 groups of indicators.
Each indicator is calculated from nation-wide economic, social and environmental statistics.
Expert Group Meeting on Strategies for Improving Environment Statistics 2-4 December 2013
59th World Statistics Congress,Hong Kong,STS085 28August2013 5
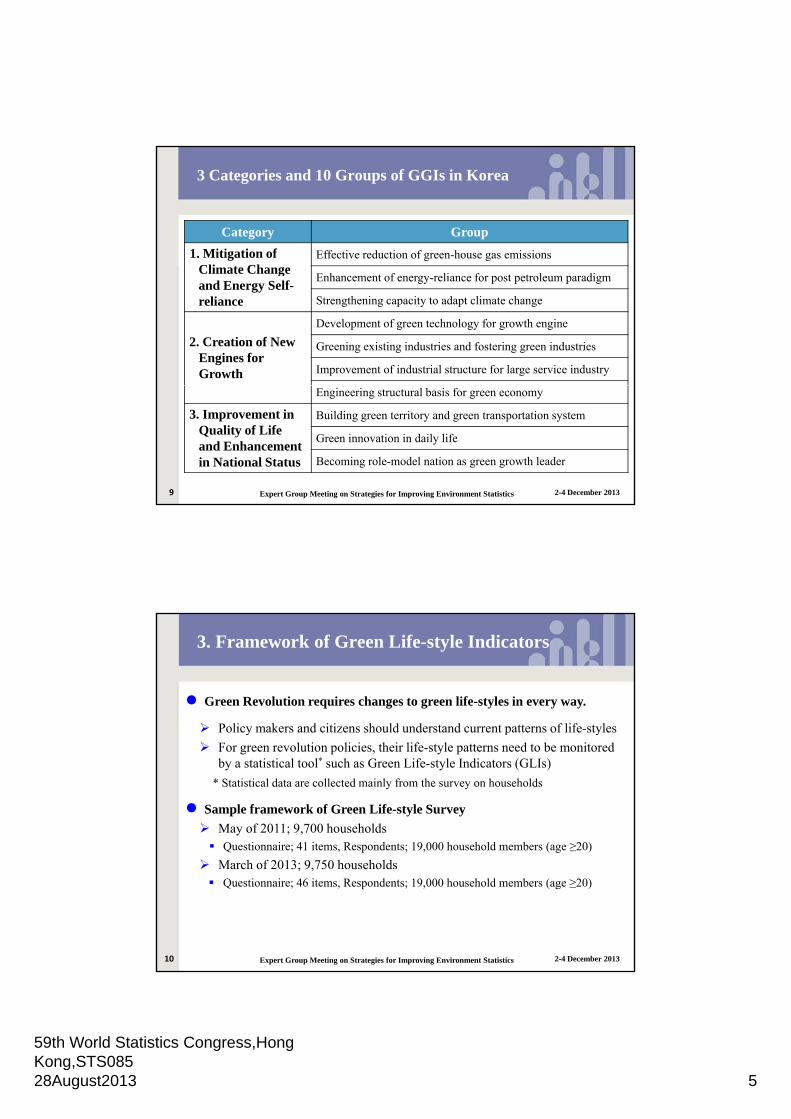
3 Categories and 10 Groups of GGIs in Korea
Category Group
1. Mitigation of Cli t Ch
Effective reduction of green-house gas emissionsClimate Change and Energy Self-reliance
Enhancement of energy-reliance for post petroleum paradigm
Strengthening capacity to adapt climate change
2. Creation of New Engines for Growth
Development of green technology for growth engine
Greening existing industries and fostering green industries
Improvement of industrial structure for large service industry
9
Engineering structural basis for green economy
3. Improvement in Quality of Life and Enhancement in National Status
Building green territory and green transportation system
Green innovation in daily life
Becoming role-model nation as green growth leader
Expert Group Meeting on Strategies for Improving Environment Statistics 2-4 December 2013
3. Framework of Green Life-style Indicators
Green Revolution requires changes to green life-styles in every way.
Policy makers and citizens should understand current patterns of life-styles Policy makers and citizens should understand current patterns of life styles
For green revolution policies, their life-style patterns need to be monitored by a statistical tool* such as Green Life-style Indicators (GLIs)
* Statistical data are collected mainly from the survey on households
Sample framework of Green Life-style Survey
May of 2011; 9,700 households Questionnaire; 41 items, Respondents; 19,000 household members (age ≥20)
10
Q ; , p ; , ( g )
March of 2013; 9,750 households Questionnaire; 46 items, Respondents; 19,000 household members (age ≥20)
Expert Group Meeting on Strategies for Improving Environment Statistics 2-4 December 2013
59th World Statistics Congress,Hong Kong,STS085 28August2013 6
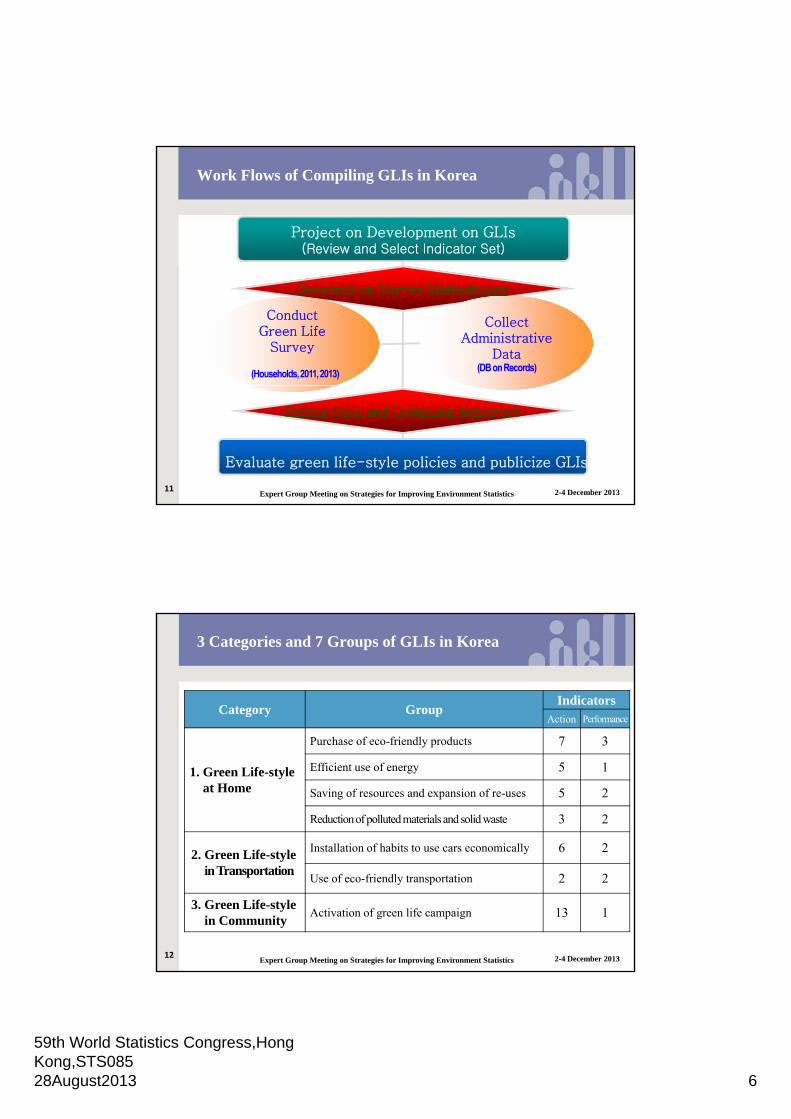
Work Flows of Compiling GLIs in Korea
Project on Development on GLIs(Review and Select Indicator Set)
Research on Survey Methodology
ConductGreen Life
Survey
(Households, 2011, 2013)
CollectAdministrative
Data(DB on Records)
11
Evaluate green life-style policies and publicize GLIs
Editing Data and Compiling Indicators
Expert Group Meeting on Strategies for Improving Environment Statistics 2-4 December 2013
3 Categories and 7 Groups of GLIs in Korea
Category GroupIndicators
Action Performance
1. Green Life-styleat Home
Purchase of eco-friendly products 7 3
Efficient use of energy 5 1
Saving of resources and expansion of re-uses 5 2
Reduction of polluted materials and solid waste 3 2
2 G Lif t l Installation of habits to use cars economically 6 2
12
2. Green Life-stylein Transportation
y 6
Use of eco-friendly transportation 2 2
3. Green Life-stylein Community
Activation of green life campaign 13 1
Expert Group Meeting on Strategies for Improving Environment Statistics 2-4 December 2013

59th World Statistics Congress,Hong Kong,STS085 28August2013 7
4. Development Strategy for SEEA-CF
Current Activities on SEEA-CF; two accounts / statistics
Environmental Protection and Expenditure Accounts (EPEA)
Has been compiled since 2006
Ministry of Environment and Korea Environment Institute
3 main tables and 1 appended table
EPER (Environmental Protection and Expenditure Revenues)
Statistics on Environmental Goods and Services Sector / Industry (EGSS)
Environment Industry Survey has been conducted since 2005
13
Ministry of Environment and Korea Environment Corporation
Sample Size (2011); about 34,000 establishments
Coverage; Pollution Management Group (production of equipment and specific materials, construction and installation, provision services), Resource Management Group (water supply, recycled materials)
Expert Group Meeting on Strategies for Improving Environment Statistics 2-4 December 2013
Future Activities and Research Agenda
Future Activities
Implementation of SEEA-CF; long-term schedule for SEEA development d i 2014 2022 (d f i i l di i d i l )during 2014-2022 (draft principal directions and potential targets)
Statistical Infrastructure will be reviewed
Cooperation Network and Technical Advisory Group (TAG) will be built
Research Agenda
Pilot compilation of EW-MFA (Economy-Wide Material Flow Accounts)
Study on methodology of Air Emission Accounts (AEA)
14
Study o et odo ogy o ss o ccou ts ( )
12 materials; 6 greenhouse gases (CO2, N2O, CH4, HFCs, SF6), 6 non-greenhouse gases (CO, NOx, SOx, NH3, VOC, PM10)
Two accounts will be reviewed in 2014 to be approved as official statistic.
Expert Group Meeting on Strategies for Improving Environment Statistics 2-4 December 2013
59th World Statistics Congress,Hong Kong,STS085 28August2013 8
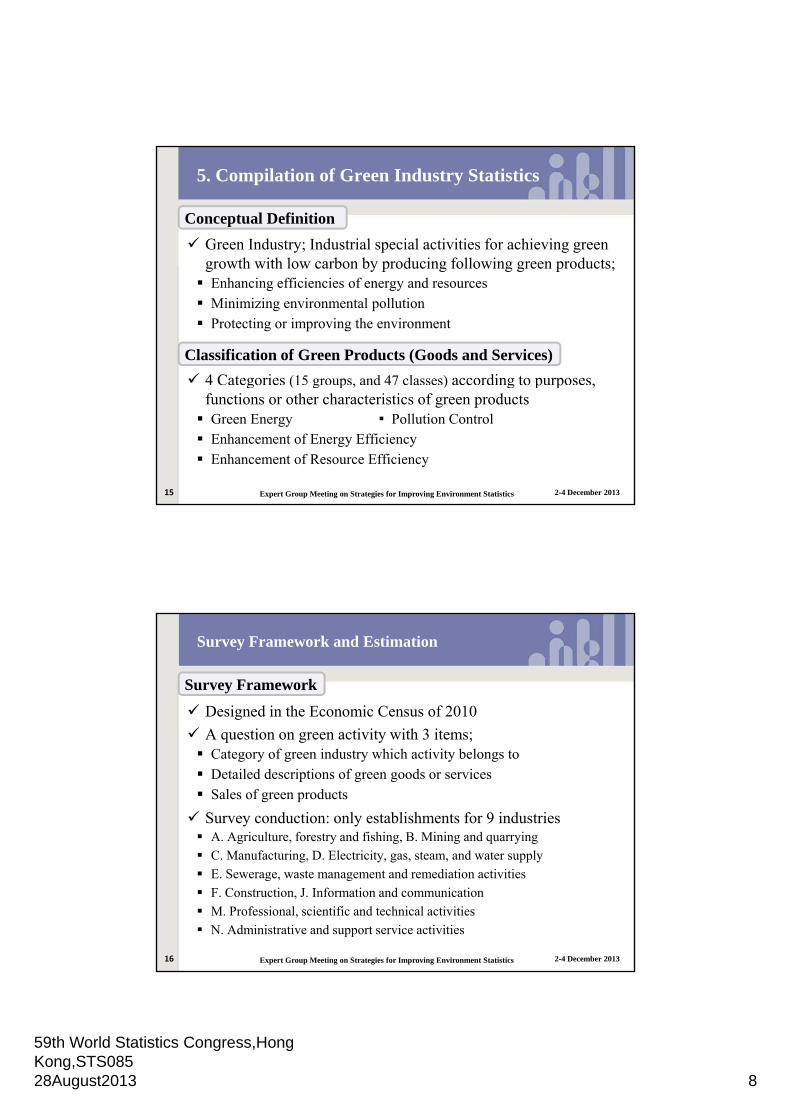
5. Compilation of Green Industry Statistics
Green Industry; Industrial special activities for achieving green growth with low carbon by producing following green products;
Conceptual Definition
growth with low carbon by producing following green products; Enhancing efficiencies of energy and resources Minimizing environmental pollution Protecting or improving the environment
4 Categories (15 groups, and 47 classes) according to purposes,
Classification of Green Products (Goods and Services)
15
g ( g p , ) g p p ,functions or other characteristics of green products Green Energy ▪ Pollution Control Enhancement of Energy Efficiency Enhancement of Resource Efficiency
Expert Group Meeting on Strategies for Improving Environment Statistics 2-4 December 2013
Survey Framework and Estimation
Designed in the Economic Census of 2010
A question on green activity with 3 items;
Survey Framework
A question on green activity with 3 items; Category of green industry which activity belongs to Detailed descriptions of green goods or services Sales of green products
Survey conduction: only establishments for 9 industries A. Agriculture, forestry and fishing, B. Mining and quarrying
C M f t i D El t i it t d t l C. Manufacturing, D. Electricity, gas, steam, and water supply
E. Sewerage, waste management and remediation activities
F. Construction, J. Information and communication
M. Professional, scientific and technical activities
N. Administrative and support service activities
16 Expert Group Meeting on Strategies for Improving Environment Statistics 2-4 December 2013

59th World Statistics Congress,Hong Kong,STS085 28August2013 9
Survey Framework and Estimation
Data; Conducting additional survey in Economic Census of 2010
Editing process
Data Collection
Editing process External information from registered data which were obtained from industry
associations and government organizations
Lists of establishments with a green certificate by “Green Technology Certification” Act and “Eco-Energy Efficiency Certification” Regulation
Estimation
17
Green production as sales of green products Calculated directly with data on sales at establishment unit Summed up to industry level, and recounted by category and group of
green products
Expert Group Meeting on Strategies for Improving Environment Statistics 2-4 December 2013
Industry (ISIC Rev. 4)Category of green products
Sub-total Green energy
Pollutioncontrol
Energy efficiency
Resource efficiency
Sales totaled in 9 industries (Billion Won) 92,501 19,943 21,557 28,167 22,834
i i d i & C f i 41 397 8 504 7 033 17 501 8 360
Sales and Its Share of Green Product(Unit: Billion Won, %)
B. Mining and quarrying & C. Manufacturing 41,397 8,504 7,033 17,501 8,360
D. Electricity, gas, steam, and water supply 11,133 7,101 10 4,022 -E. Sewerage, waste management and
remediation activities 12,259 23 6,874 - 5,362
F. Construction 15,408 2,442 4,946 302 7,718
M. Professional, scientificand technical activities 10,987 1,854 2,573 6,085 476
Other Industries (A, N, J) 1,316 18 121 257 919
Shares by category in 9 industries (%) 100.0 21.6 23.3 30.5 24.7
B. Mining and quarrying & C. Manufacturing 100.0 20.5 17.0 42.3 20.2
D. Electricity, gas, steam, and water supply 100.0 63.8 0.1 36.1 -E. Sewerage, waste management and
remediation activities 100.0 0.2 56.1 - 43.7
F. Construction 100.0 15.9 32.1 2.0 50.1
M. Professional, scientificand technical activities 100.0 16.9 23.4 55.4 4.3
Other Industries (A, N, J) 100.0 1.4 9.2 19.6 69.918
Expert Group Meeting on Strategies for Improving Environment Statistics 2-4 December 2013

59th World Statistics Congress,Hong Kong,STS085 28August2013 10
6. Use of Indicators and Statistics in Policy
No data(Not collected)Database
GGIs, GLIs, SEEA, GG statisticsare open to public
Identify missing dataand improve statistics
Policy Evaluation
( )
CrediblePolicy
Database
Make credible policies andrevise them for better outcome
Evaluate performanceof policies with targets
Indicators / Statisticsfor Green growth
19
ComparisonCheck
Progress
Compare Indicators in Koreawith those in other countries Check progress of policies and
provide revision directions
Expert Group Meeting on Strategies for Improving Environment Statistics 2-4 December 2013
Website on Indicators for Green Growth Policies
Database on Indicator Sets of Green Growth, Green Life-style, Sustainable Development, etc. http://green.kostat.go.kr
Green Growth Indicators (GGIs); 3 Categories (30)
Green Life-style Indicators (GLIs);
Awareness and Action (41)
Performance (13)
20
( )
Sustainable Development Indicators; 3 Categories (77)
Environment Performance Index (22)
Expert Group Meeting on Strategies for Improving Environment Statistics 2-4 December 2013

59th World Statistics Congress,Hong Kong,STS085 28August2013 11
Main Screen of Website
21 Expert Group Meeting on Strategies for Improving Environment Statistics 2-4 December 2013
Check Green Life-style personally
Green Purchase, Green Home, Green Transportation, Green Workplace
22
22/20
Expert Group Meeting on Strategies for Improving Environment Statistics 2-4 December 2013

59th World Statistics Congress,Hong Kong,STS085 28August2013 12
Check Level of Green Awareness and Action
Calculate scores of personal habits and compared them with household averages
23
23/20Thank youExpert Group Meeting on Strategies for Improving Environment Statistics 2-4 December 2013
Thank you for your attention!
Kyung Sam MinStatistical Research Institute