a literature review concerning integrated natural...
TRANSCRIPT
A Literature Review concerning Integrated Natural Resource Management
Draft 1.0
Jeremy Cain Institute of Hydrology
1. AN INTRODUCTION TO INTEGRATED NATURAL RESOURCE MANAGEMENT .••••..... 1
1.1 WHATISINRM? ............................................................................................................................ 2 1.2 THE NECESSITY FOR INRM .............................................................................................................. 3 1.3 BASIC APPROACHES ......................................................................................................................... 3 1.4 THE LAND-USE AND LAND-COVER CHANGE (LUCC) APPROACH .................................................. .4
2. MODELLING AS A TOOL IN INRM ••••••••••••••••••••••••••••••••••.•••••.•.•••..•••••••••••••••••••••••••••••••••••••••••••••• 8
2.1 WHY IS THERE A NEED ? .................................................................................................................. 8 2.2 MODEL FUNCTIONS .......................................................................................................................... 9
2.2.1 Data collection ......................................................................................................................... 9 2.2.2 Understanding inter-disciplinary links ............................................................................. ..... 10 2.2.3 Communicating understanding .............................................................................................. 10 2.2.4 Monitoring predictions .......................................................................................................... 1 I
2.3 MODEL DESIGN .............................................................................................................................. 11 2.3.1 Model scale ................................................................. ........................................................... 1 I 2.3.2 Decision Support or Expert System ? ..................................................................................... 13 2.3.3 Modular frameworks .............................................................................................................. 13 2.3.4 Design for the user ................................................................................................................. 13 2.3.5 Model architecture ................................................................................................................. 15
3. A REVIEW OF INTEGRATED MODELS .................................................................................... 17
3.1 AQUA (HOEKSTRA, 1995) ............................................................................................................ 17 3.1.1 General Overview .................................................................................................................. 17 3.1.2 The Simulation Model: The Pressure Submodel.. ................................................................. 18 3.1.3 The Simulation Model: The Water System Submodel ........................................................... 18 3.1.4 The Simulation Model: The Impact Submodel ...................................................................... 20 3.1.5 The Simulation Model: The Response Submodel .................................................................. 21 3.1.6 The Framework of Indices ..................................................................................................... 21
3.2 THE NERC/ ESRC LAND USE MODELLING PROGRAMME (NELUP) ............................................. 22
3.2. I General Overview .................................................................................................................. 22 3.2.2 Economic Modelling ............................................................................................................. 23 3.2.3 Ecological Modelling .................................................. ........................................................... 24 3.2.4 Hydrological Modelling ......................................................................................................... 25
3.3 CATCHMENT RESOURCE ASSESSMENT MODEL (CRAM) ............................................................... 25 3.4 A MULTISECTOR MODEL FOR LAND CONVERSION ......................................................................... 26 3.5 AUTOMATED LAND EVALUATION SYSTEM (ALES) ....................................................................... 27
3.6 A FRAMEWORK FOR WATERSHED ANALYSIS ................................................................................. 28 3.7 COMPUTER MODELS IN INTEGRATED PEST MANAGEMENT ............................................................ 29
3.8 STATE-WIDE RESOURCE INFORMATION AND ACCOUNTING SYSTEM (SRIAS) ............................... 29
1. An Introduction to Integrated Natural Resource
Management
1.1 What is INRM ?
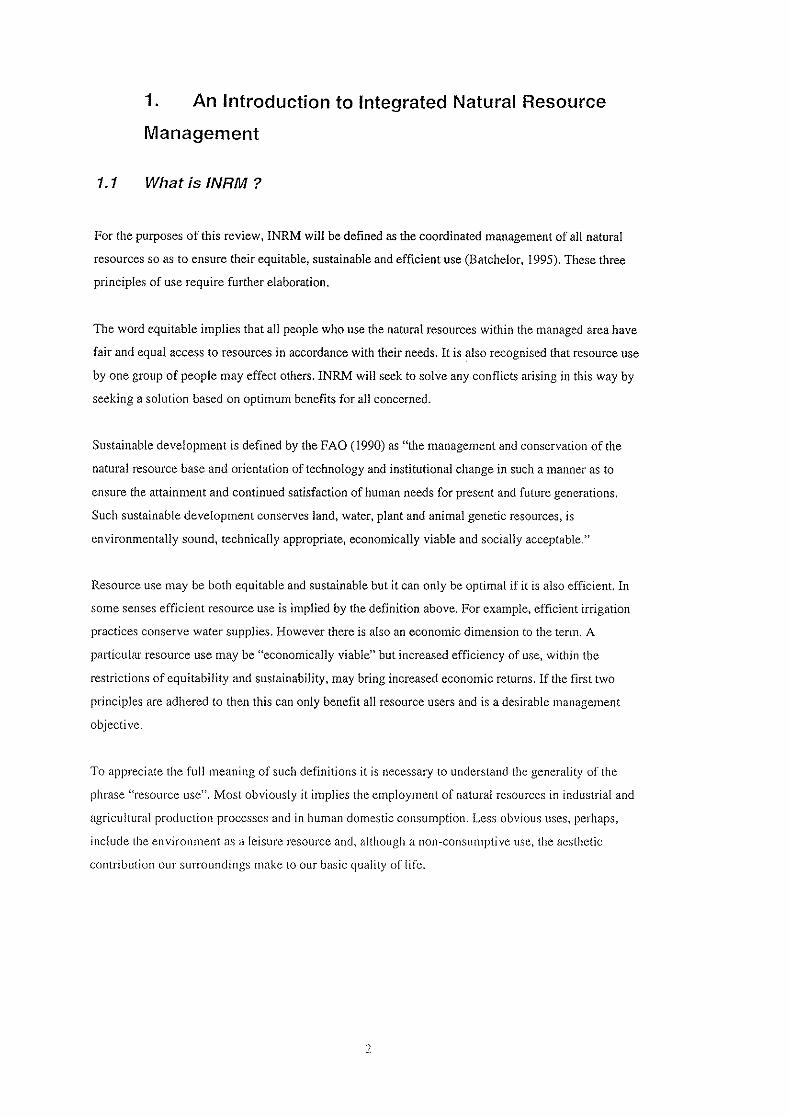
For the purposes of this review, INRM will be defined as the coordinated management of all natural
resources so as to ensure their equitable, sustainable and efficient use (Batchelor, 1995). These three
principles of use require further elaboration.
The word equitable implies that all people who llse the natural resources within the managed area have
fair and equal access to resources in accordance with their needs. It is ~lso recognised that resource use
by one group of people may effect others. INRM will seek to solve any conflicts arising in this way by
seeking a solution based on optimum benefits for all concerned.
Sustainable development is defined by the FAO (1990) as "the management and conservation of the
natural resource base and orientation of technology and institutional change in such a manner as to
ensure the attainment and continued satisfaction of human needs for present and future generations.
Such sustainable development conserves land, water, plant and animal genetic resources, is
environmentally sound, technically appropriate, economically viable and socially acceptable."
Resource use may be both equitable and sustainable but it can only be optimal if it is also efficient. In
some senses efficient resource use is implied by the definition above. For example, efficient irrigation
practices conserve water supplies. However there is also an economic dimension to the term. A
particular resource use may be "economically viable" but increased efficiency of use, within the
restrictions of equitability and sustainability. may bring increased economic returns. If the first two
principles are adhered to then this can only benefit all resource users and is a desirable management
objective.
To appreciate the full meaning of such definitions it is necessary to understand the generality of the
phrase "resource use". Most obviously it implies the employment of natural resources in industrial and
agricultural production processes and in human domestic consumption. Less obvious uses, perhaps,
include the environment as a leisure resource and, although a non-consumptive use, the aesthetic
contribution our surroundings make to our basic quality or life.
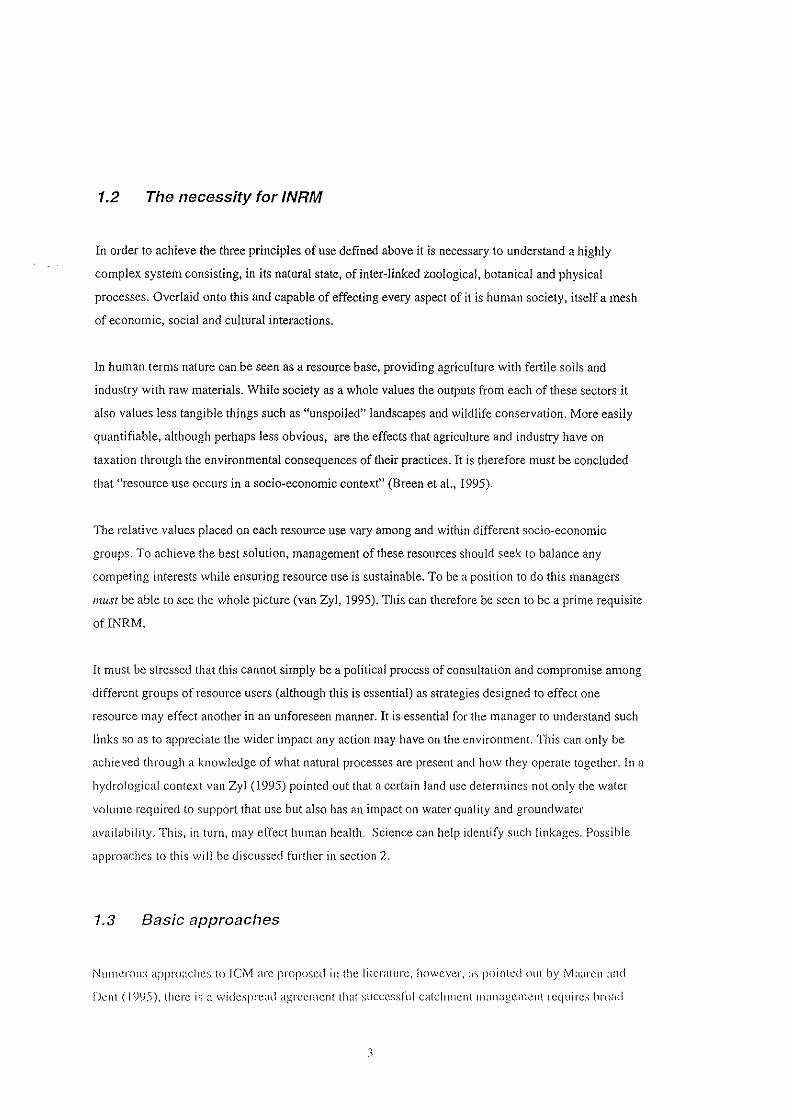
1.2 The necessity for INRM
In order to achieve the three principles of use defined above it is necessary to understand a highly
complex system consisting, in its natural state, of inter-linked zoological, botanical and physical
processes. Overlaid onto this and capable of effecting every aspect of it is human society, itself a mesh
of economic, social and cultural interactions.
In human terms nature can be seen as a resource base, providing agriculture with fertile soils and
industry with raw materials. While society as a whole values the outputs from each of these sectors it
also values less tangible things such as "unspoiled" landscapes and wildlife conservation. More easily
quantifiable, although perhaps less obvious, are the effects that agriculture and industry have on
taxation through the environmental consequences of their practices. It is therefore must be concluded
that "resource use occurs in a socio-economic context" (Breen et al., 1995).
The relative values placed on each resource use vary among and within different socio-economic
groups. To achieve the best solution, management of these resources should seek to balance any
competing interests while ensuring resource use is sustainable. To be a position to do this managers
must be able to see the whole picture (van Zyl, 1995). This can therefore be seen to be a prime requisite
ofINRM.
It must be stressed that this cannot simply be a political process of consultation and compromise among
different groups of resource users (although this is essential) as strategies designed to effect one
resource may effect another in an unforeseen manner. It is essential for the manager to understand such
links so as to appreciate the wider impact any action may have on the environment. This can only be
achieved through a knowledge of what natural processes are present and how they operate together. In a
hydrological context van Zyl (1995) pointed out that a certain land llse determines not only the water
volume required to support that use but also has an impact on water quality and ground water
availability. This, in turn, may effect human health. Science can help identify such linkages. Possible
approaches to this will be discussed further in section 2.
1.3 Basic approaches
NUlll(jrous appro:tches to ICM arc proposed in the literature, however, as pointed out by Maarcll <llld
D<:llt ( I <)<) 5), there is ;1 wide:.;pre;!d agreement that sllccessful catch 111(j1l[ Illilll<lgCI1lCllt rcCju i res hroad
participation by all "stakeholders". Lindskog and Tengberg (1994) argued that "to design sustainable
strategies of land management, it is essential to determine the symptoms and the causes of land
degradation, both through scientific methods and from the perspective ofthc inhabitants of the area",
The utility of this approach was recognised and adopted by the NRA which insisted on developing a
planning process that provided an opportunity for wide consultation with all who those with an interest
in the aquatic environment (Chandler, 1994). Blaclanore (1995), describing the Murray-Darling Basin
Commission's Natural Resource Management Strategy, acknowledged that successful long term change
requires significant community involvement and that this involvement is vital if sustainable resource
management is to be achieved. Such community involvement is best obtained through liaison with local
institutions and community leaders.
rCM can therefore begin to be seen as a holistic process rather than a set of isolated management
decisions and it is clear that this process must be cyclic. Various authors have presented conceptual
models of this process (van Zyl, 1995, Breen et aI., 1995, Slinger and Breen, 1995) but all contained
the same basic elements. The state of the system to be managed must first be understood as must the
impacts upon it. Proposals can then be formulated for its management which are then assessed in socio
economic, ecological and hydrological terms. Consultation with the communities living in the
catchment is essential for proper assessment. Once this has been done, accepted proposals can be
implemented and the impacts of the proposal on state of the system assessed. At this point the cycle
begins again.
Another fundamental requirement for successful reM is the establishment of effective institutions to
facilitate the whole rCM process. Blackmore (1995) argued that at a political and bureaucratic level a
critical ingredient for success is the creation of a management structure enabling matters of common
interest to be discussed, resolved and implemented and that this usually involves several existing
organisations coming together. He pointed out that this does not necessarily happen easily but
suggested that "there is no more powerful stimulus than the distribution of wealth to focus political,
bureaucratic and community minds on issues". This highlights the necessity of identifying the links
between economics and environmental processes. However, the institutions must not only be
established, they must also bc effective. Mitchell and Hollick (1993) described how attempts at
integrated catchment management in Western Australia encountered difficulties due to the roles of the
different institutions involved in the planning process not being clearly defined.
1.4 The Land-Use and Land-Cover Change (LUCC) approach
Established in 1993, LUCC is a corc project of the International Cjeosphcrc-Biospherc Programme
(IUH\,) anti the Human Dimcnsions of Global Environmcntal Changc Programme (I-ID]». 11 sl~cks to he
;\ truly intcr-disciplinary rcsc;\rch pl"Ogr(l\ll!\1c with tile general goal or improving tile h;lS\C
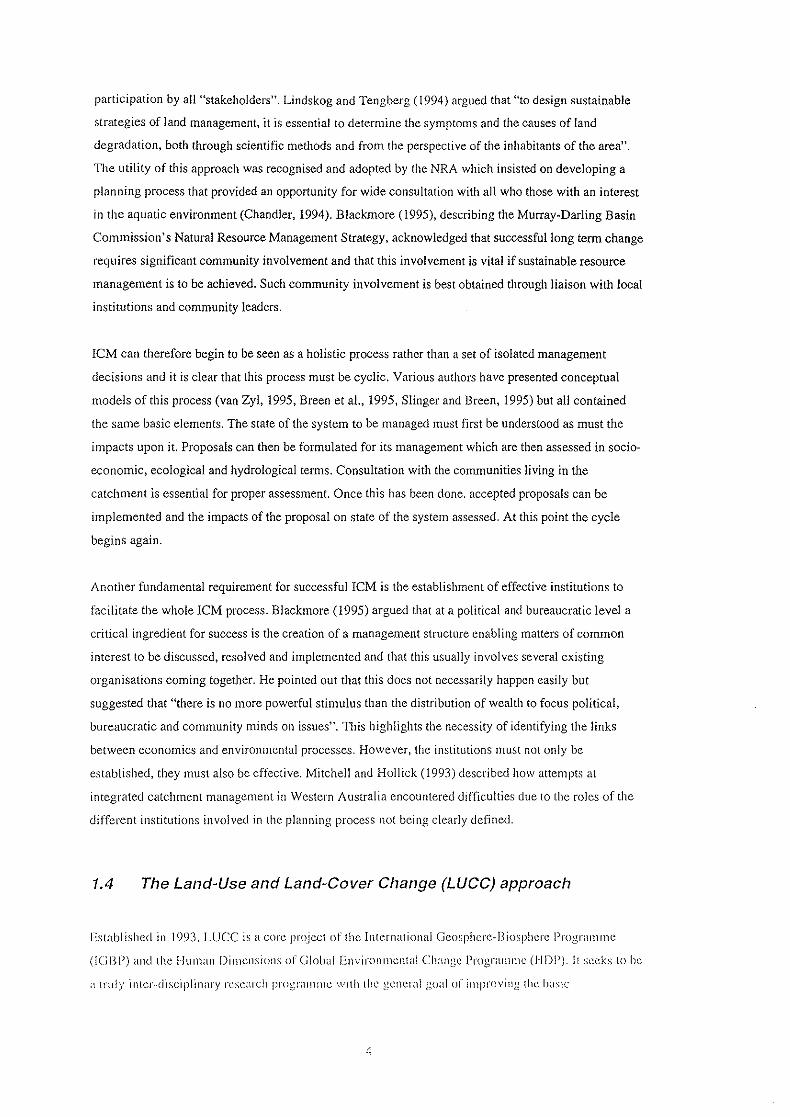
understanding of the dynamics of land~use and !and-cover change with a focus on improving the ability
to model and predict such change (Turner et aI., 1995). Figure I. I below, illustrates the dynamics as the
project perceives them.
The project has developed a far-sighted research structure which seeks to encompass all the challenges
that will need to be met if the goal is to be achieved. It recognizes that contributions from a large
number of disciplines will be required across a large number of subject areas and that these
contributions must be well integrated. In order to achieve this, three inter-linked research foci have been
formulated in conjunction with two integrating activities.
Socio-economic context , ............. ~ ~ - .. - .. - - --- . ----'
Figure 1.1 : LUCC Dynamics
Each research focus concentrates on a particular modelling approach. The authors recognize the
deficiencies inherent in each of these approaches but assert that through integration each approach will
complcmcnt the other.
5
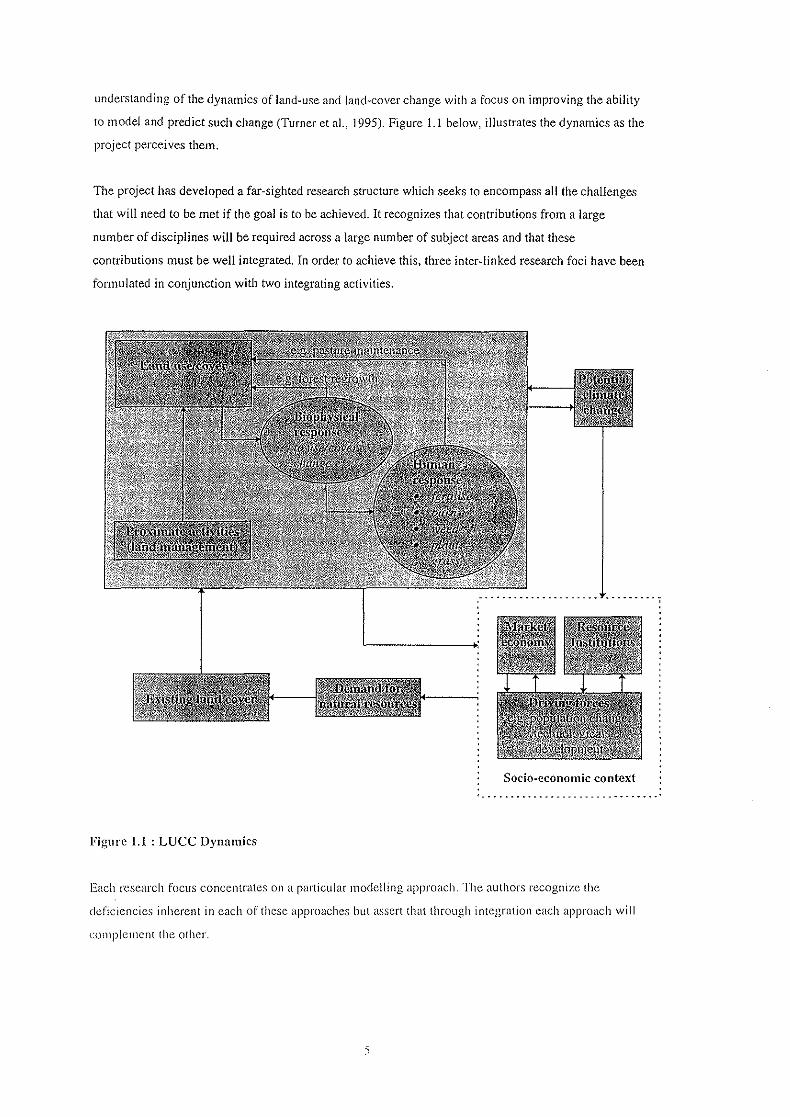
Focus [uses a comparative case study approach to study the relationship between land cover and land
use. It seeks to do this by developing a causal understanding of the dynamics active in the system under
study through observation and measurement. Micro and ll1eso~scale models can then be developed to
represent the dynamics active at this scale. For these to be successful they must explicitly account (or
the local scale dri\'ing forces. These driving forces arc divided into three dimensions as shown in figure
1.2 below.
BIOPHYS1CAL DRIVERS
figure 1.2 : Three dimensions of the driving forces of LUCC
/\lthough there will be a multitude of driving forces operating at a range of scales it is argued that the
behaviour of many natural systems can be explained by only a few of these operating at characteristic
temporal and spatial scales. This is called the extended keystone hypothesis (Hailing, 1992). These
keystone processes can be identified through the models developed from the case studies. As these
studies will have been carried out at a range of scales, the scale independence of the processes
identified can be assessed.
Focus 2 uses direct empirical observations from remote sensing instruments, national censuses, Iand
cover inventories and field based measurements to calibrate empirical, spatially detailed models of land
cover change. Such data, if available in sufficient temporal and spatial resolution, can be used to
identify spatial patterns of land cover change. This data is seen to be primarily of use to physical
scientists in estimating such things as the global carbon budget. In this case, up to dale and spatially
detailed information is considered to be essential. Using such detailed land-cover maps, point models
(of the carbon cycle, Cor example) can be extrapolated using correlations identified between cover type
and process function.
It can be seen that this modelling approach, although providing insights into which variables are
important in certain processes (through correlation studies, as described above), gives no information
about the underlying driving processes. It is essential, therefore, that such an approach is used in
conjunction with the case study approach discussed above.
Focus 3 attempts to develop integrated regional and global models. The authors assert that model
systems must be developed that are sufficiently disaggregated to describe economic systems which
operate mainly at provincial or national scales yet can be aggregated to the global scale. They must be
able to simulate the interrelated driving forces of land-use/cover change (see figure 1.2) and the
biophysical feedbacks which are important at such scales. They must be designed to account for the
major directions in land-use/cover change which appear likely over the next few decades and yet be
flexible enough to account for the surprises that will surely occur.
Further issues concerning socio-economic driving forces must be considered when designing these
models. Technological change has a large effect on land-use and therefore land cover. Studies have
shown that such technological change is induced within the system and as such these dynamics can be
incorporated into any model of that system. A model must also be able to account for the effects of
policy strategies currently being pursued (purification technology, emission control, infrastructure
investment and land reclamation, for example) and to be able to deal with the uncertainties inherent in
the human reaction to these policies.
Integrating activity I concerns data and classification. The authors argue that to facilitate integrated
research it is essential to define a standardised classification. In order to cover the varied needs of all
the disciplines involved this classification would need to cover at least three descriptive dimensions.
These dimensions are as follows:
• descriptors concerning manipulation of land characteristics (based on geographical units)
• descriptors concerning the purposes o/particular land use (based on socio·economic
units)
• descriptors concerning the underLying biophysical and socio"economic conditions.
Appropriate descriptors should be chosen so that the requirements of each of the research foci are met.
Once slIch a classification has been defined, data collection can be geared towards placing each area of
i!lterest within the classification structure at a variety of scales. This will enforce a consideration of the
overlaps between the different disciplines and so facilitate understanding of the linking processes.
Integrating activity 2 concentrates on the linkages between the temporal and spatial scales at which land
use/cover change processes operate. This will be discussed further in section 2.3.1.
7
2. Modelling as a tool in INRM
2.1 Why is there a need?
As discussed in section 1.2, for INRM to be successful it is essential that the links which exist between
the socia-economic and environmental processes operating in a catchment are understood. At present,
this understanding is incomplete. Slinger and Breen (1995) argued that one of the main inadequacies in
existing environmental management procedures is the prediction of the environmental consequences
arising from specific management actions. These actions have both bio-physical and soda-economic
implications. Clearly the development and use of cross-disciplinary, inter-linked predictive models,
with their potential to simulate these complex systems, can help overcome this inadequacy. This can be
highlighted as a primary requirement in the full development of INRM as a practical methodology.
Recognising this, Plant (1993) stressed the utility of computer models in coming to grips with the
unique complexity and uncertainty of environmental systems in particular. As a further function, he also
proposed that such models, when part of an Expert or Decision Support System (see section 2.3.2
below) can aid in the transfer of knowledge about the management opportunities raised by rapidly
advancing technology. He argued that the efficient transfer of this information is essential if worsening
environmental problems are to be overcome.
The literature highlights, however, that this is only one example where a model can be used to provide
more than just predictions of how a system behaves. If designed carefully it can also aid in :
• rationalising, directing and integrating data collection
• providing an understanding of how the separate components of a socio-economic, ecological and
hydrological system interact
• communicating that understanding to a wide range of user
• monitoring the accuracy of its own predictions
Hendcrson-Scllers (! 99la), in discussing environmental decision support, also supported this view of
multi-purpose models. He stated that modelling studies should not only be used as a means of
understanding the processes of the system but also as a planning and management too!' He argued that
when applied in this way models might sacrifice scientific detail in the short term so as to gain the
immediate advantages arising from their use as an cnginecring too! cap<lble of' solving real problems.
!n agreement with the authors quo/cd above. Hcndcrson-Sc!lcrs also recognised the unique potentia! or Illodels to provide insight.'> into the complexities or natura! systems. !-le described situations in semi-arid
countries where even small changes in urban drainage patterns, agricultural land use or meteorology can
produce ecological changes in water which render it less potable or unsuitable for irrigation. He
asserted that integrated modelling was the best way to understand and manage such complicated
systems. In particular, he argued that the large database, which is a vital component of such a system
(see section 2.3.3 below), provides the user with access to a larger range of case studies than those
encountered within their own experience. This enables any decision to be based on a broader
foundation.
It should be noted that numerous models already exist which are successful in describing the behaviour
of a number of environmental systems from different disciplinary perspectives. In isolation, however,
these models are not adequate to realise the full potential of lNRM and methods of linking them within
an integrated framework must be found. Only in this way will modelling be able to satisfy the needs
identified above. This will be discussed further in the next section.
2.2 Model functions
2.2.1 Data collection
Burton (1995) recognised that model structure must be determined by the data available to that model.
Due to the relative scarcity of detailed environmental data over a wide area, models must be able to
cope with information collected at different times using a variety of methods, at different locations and
at various scales (both temporal and spatial). Data may not always be quantitative and qualitative
assessments by experienced experts may also be useful (and often may be the only thing available)
"common sense and expertise are more solid assets in an environment where information is very
limited".
Montgomery et al. (1995) identified one of the reasons for unsuccessful land management systems in
the past as haphazard collection of data without a clear set of questions or hypotheses. Collection,
collation and integration of this data is therefore a challenge in itself, although preliminary modelling
can help in identifying which data are most important and at what scales they are required. As part of
this process different disciplines must come together to identify the type and scale of data which will
satisfy the requirements of the whole project and true integration can be achieved to the benefit of all.
Data classification is a potentially useful way to guide and optimise the collection of data. This has
already been discussed in the context of LUCC (sec sectjon lA and Turner et al. 1995).
')
2.2.2 Understanding inter-disciplinary links
Burton (1995) indicated that a crucial factor in integrated modeling is the establishment of the links
between the ecosystem components and how change effects these components as a whole rather than
individually, Traditionally, modelling studies have concentrated on the interactions within these
components. The major challenge now is to extend these models so as to incorporate the interactions
between the components. However these components must be implemented in a flexible way so that
they can be updated as understanding of the processes is improved (Montgomery et at., 1995).
It is recognised that this understanding will be improved through the development and validation of
integrated models themselves. Some model parameters will show greater sensitivity than others and
may highlight the most important processes in reality. These processes can be studied further and
consequently understanding will be improved. Alternatively prototype model validation may indicate
that a vital cross-disciplinary process has been overlooked. Comparing model output to real data will
reveal the nature of this process and allow it to be included in subsequent models.
2.2.3 Communicating understanding
It has already been argued tl13t for reM to be successful discussion amongst the stakeholders in the
catchment is essential. Maaren and Dent (1995) asserted that the quality of such negotiations depends
not only on the quality of the information available but on the understanding that all parties have
concerning the implications of that information. A well designed model will aim to achieve this
objective of understanding for users with a wide range of expertise. The transparency and utility of the
software systems is essential to the credibility of any meaningful discussion process. The authors view
an rCM model as a "living repository of knowledge" concerning the catchment which is readily
accessible to everyone involved.
van Zyl (1995) supported this approach, maintaining that any data gathering exercise should seek to
provide educational, training and communication material so as to enable effective participatory
management. A well designed model using available catchment data will do this. As part of this, the
model should be able to identify problems and needs as well as providing solutions and serve as a
reference framework for all decision making.
In addition to the practical motivations presented above, Breen et a1. (1995) pointed out that where
public funds are Llsed to support research programmes there is an implicit social contract for that
research to inform public policy. Where it does not, it becomes discredited and loses public support.
It can he concluded that it is not sllfficient for a Illodel to act only as it highly specialised 1001 for use hy
ex pens but Ihat it must also be able to cOlllmunicate the understanding it can provide to a wide range or
III
user. It can and should be the means by which an understanding of the processes active within a
catchment can be reached from the data collected and it is essential that this understanding is achieved
to an appropriate degree by all the stakeholders in the catchment.
2.2.4 Monitoring predictions
Breen et al. (1995) argued that it is not sufficient to simply employ predictive models due to their
inherent inaccuracies and the potentially high consequences of inaccurate predictions. They proposed
that it is necessary to continuously monitor indicators of the system response to management policies in
order to provide a "safety net" for the predictive approach. Modelling could be used to identify which
of the wide range of potential indicators could be best used to monitor system performance and thereby
rationalise expensive data collection. Montgomery et at. (1995) reinforced this point. They contended
that, as we cannot hope to understand the full detail of the system interactions, it is essential to
supplement data collection for modelling with monitoring of the outputs derived from that data so as to
check whether management objectives are being achieved.
2.3 Model design
2.3.1 Model scale
Montgomery et at. (1995) asserted that, as integrated modelling involves the consideration of multi
disciplinary processes, analysis should be organised around socially, economically, ecologically and
hydrologically relevant units. The scale of these units will rarely coincide and therefore the model must
be able to deal with data collected and processes operating at a wide range of scales. This is essential if
the model is to encompass the full range of spatial and temporal variation inherent to human and
environmental dynamics. The authors went on to argue that the catchment is the scale at which
individual projects can be practically implemented and at which results can be easily aggregated to
provide information over a larger area. Analysis at this scale can therefore provide the fundamental unit
within a planning hierarchy which must be applicable at a wide range of scales.
The LUCC science plan (Turner et al., 1995) indicated that while research shows that there are strong
correlations between popUlation, affluence and technology (the "PAT variables") and environmental
change at continental scales at more local scales institutions, policy and other social variables arc more
important. It is necessary, therefore, that a cross-scalar model can deal appropriately with each type of
data given the relevant scale. The authors recognised that, in general. individual models are only valid
at the scale for which they were developed and that, as a consequence, careful atlcJllioJ\ mllst be g.ivcll
to consideration of sllch factors.
11
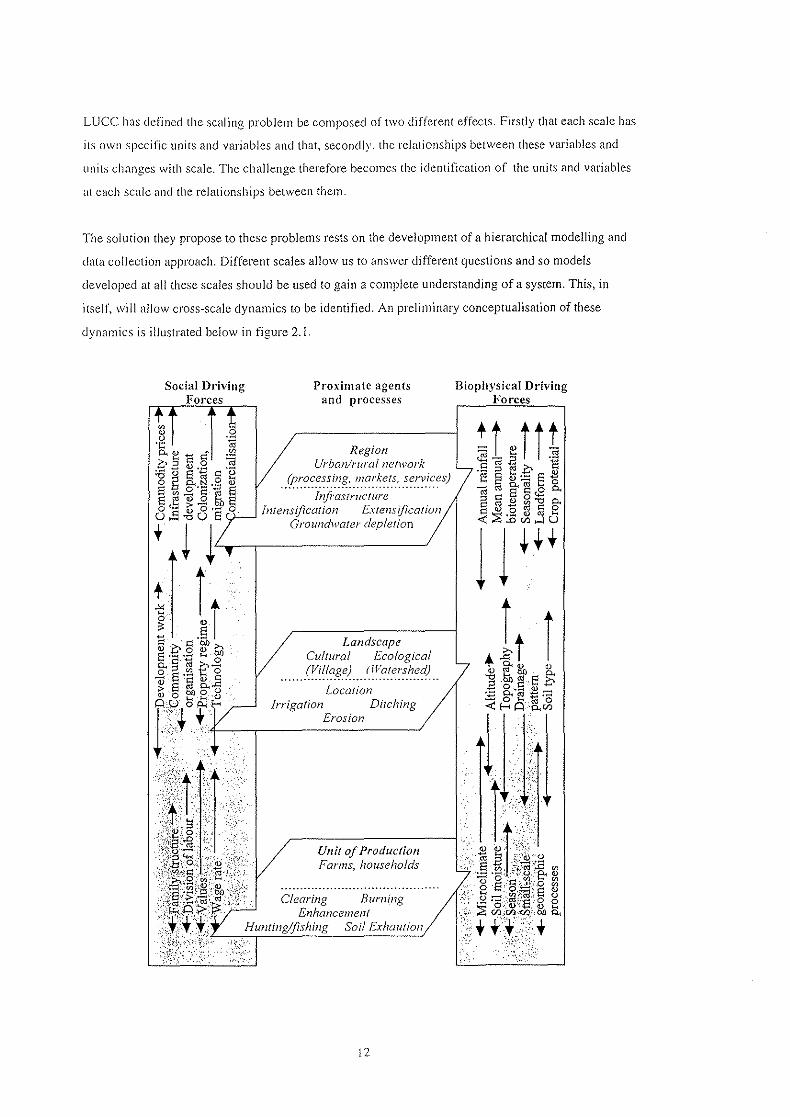
LUCC has defined the scaling problem be composed of two different effects. Firstly that each scale has
its own specific units and variables and that, secondly. the relationships between these variables and
units changes with scale. The challenge therefore becomes the identification of the units and variables
at each scale and the relationships between them.
The solution they propose to these problems rests on the development of a hierarchical modelling and
data collection approach. Different scales allow us to answer different questions and so models
developed at all these scales should be used to gain a complete understanding of a system. This, in
itself, will allow cross-scale dynamics to be identified. An preliminary conceptualisation of these
dynamics is illustrated below in figure 2.1.
;~~~~l
Proximate agents and processes
Landscape Cultural Ecological (ViI/age) IlValershed) ..........................................
Unit of Production Farms, households
Clearing Burning ~; .. ~~~,)-q,.:?;~~-. . Enhancement :.::;;J/T."Y.( HUnling/fishing Soil Exhaution ~WL -' ,¥;~,." :;:~r/.~·:·) ':,'<
12
Biophysical Ddving Forces
Figure 2.1 : MultiMscale driving forces in land use/cover change
2.3.2 Decision Support or Expert System?
The above arguments strongly suggest that an integrated model which is to be used as a primary tool in
an ICM process should be designed and implemented as either a decision support system (DSS) or as
an expert system (ES). It is important to be aware of the difference between these two approaches.
Stock et aI. (1991) provide a useful definition. A DSS provides the user with information so that he or
she is better able to make their own judgments. An ES, on the other hand, is designed to provide the
user with advice as though from a human expert. When using an ES, the user is not expected to make
judgments for themselves.
Having made this distinction, a choice regarding the approach followed must be based on both the
application and the use. Breen et aI. (1995) suggested that if research is to contribute usefully to
sustainable catchment management the it should aim to promote the process by which decisions are
made rathcr than promote a particular decision. This clearly indicates the use of a DSS as opposed to an
ES, however the authors appeared to see their end user as a skilled professional. An ES may be more
appropriate to the lay user, while a variety of users may warrant both approaches.
2.3.3 Modular frameworks
An approach to designing models to analyse this wide array of data is suggested by Slinger and Breen
(1995). A range of simulation models may be linked together in a formalised framework and
implemented according to the available data. Where detailed data sets are available, more complex
models can be used while when data are scarce simpler models may suffice. This concept of a modular
structure can be extended so that models are also implemented within the framework as appropriate to
the output required by the user. As with the input data, when only simple outputs are required simple
models may be used. A further benefit of this approach is the flexibility it provides to the more
specialist user who may have a preference for one model over another. This flexibility will encourage
the model to be more widely used- an important factor which will be discussed further in the next
section. Practical methods of implementing such a framework are discussed in section in section 2.3.5.
2.3.4 Design for the user
Stock et al. (J 99 J) asserted that for any computer system designed to support human performance the
clTectiveness of such a system can ollly be judged by considering both tile computer Hnd human
componcnts or that system. It is obvious tl1at the easiest way to provide the user with what he or she
requires, so ensuring system effectiveness, is to ask them. Tile approach adopted by Slinger and Breen
(1005) to this involved extensive consultation with ,Ill those whom they hoped would usc the systcm.
I 1

In agrrement with this, Masser (1994), researching the use of decision support systems within the
Malaysian government, concluded that the effectiveness of such systems is typically measured by the
extent to which they deliver the right information to the right people at the right time. A minimum
condition to achieve this is that the overall information management strategy must be based on user
needs.
Following this principle, Stock et al. (1991) designed a system to support management afforest
ecosystems by first determining what the silviculturists (the user, in this case) wanted the system to do
for them. They argued that it is essential to do this at the beginning so that the whole of the design
process can subsequently be influenced by this. The system designer must consider the users' ability,
understanding of the task, objectives, attitudes and emotions. Their research with the silviculturists
raised a number of interesting points. A common complaint was that currently available systems were
neither sufficiently user friendly nor adaptable to local conditions and user needs, and could not be used
in an integrated manner. Stock et al. (1991) concluded that, for this class of user, the system should be
fully transparent so that the user can see how the conclusions presented by the model have been
reached.
Plant (1993) presented results of a similar survey carried out amongst users of a model based Expert
System (see below). The most important features of the system identified by the users were user
friendliness and ease of data entry
Henderson-Sellers (1991 b) discussed the difficulties of validating environmental models. One of the
main problems is that the modeller may have very different criteria for the success of the model than the
user may have. This is explained to arise from different perceptions about the intended use of the
model. All models perform less well in some areas than in others, however, if the model is optimised by
the modeller to perform best in an area which is not of great importance to the user then the model will
not be achieving its full potential. It seems, again, that discussion and development with users is the
best way to avoid such problems.
A further point is raised by Chapman et al. (1995) whose experience of developing an integrated model
highlights potential problems which can be avoided through user consultation. Considerable resourceS
had been invested in producing a hydrological model component which subsequently had to be rejected
by the funding agency because of doubts about the acceptability of a new model to the conservative
minded water resource community. They concluded that specialists like to use the models they know
and trUSt.
2.3.5 Model architecture
Henderson-Sellers (1991a) provided a good overview of the standard architecture of a Decision
Support System. In general terms, DSSs "require the synergism of numerical models (usually simulation
models) with large databases, front-ended by a man-machine dialogue component". 111ey usually
consist of three modules: a database management system (DBMS), a model base management system
(MBMS) and a dialogue generation and management software module (DGMS).
The DBMS maintains the link between the user and the data stored within a database. It provides a
transparent interface between the logical data structure required by the user and physical data structure
maintained by the computer operating system. The MBMS plays a similar role as the DBMS and is able
to cross-reference and link models within the rnodelbase. The modelbase contains a variety of
numerical models each of which may be suitable to a particular study depending on the scale and
quantity of data available within the database (a further deciding factor regarding model use may be
user preference).
The DGMS can help select the most appropriate model by comparing the available data and the outputs
required by the user with a set of stored model characteristics. These characteristics may include model
name, purpose, limitations, data requirements, extent of validation and available documentation among
others. The DGMS should also be able to provide an environment in which the user is comfortable
working. Inputs should be requested and entered in a variety of ways (and should be error checked on
entry) and results presented in a number of formats. These features should not be viewed as just "added
extras". Without an appropriate and readily understandable interface, end users who may initially be
unfamiliar with DSS methodologies will be unwilling to take up the new technology and no benefit will
accrue from its development.
lankowski (1992) focused on the use of the MBMS to store, invoke and link a range of numerical
models in order to solve complex environmental problems. The concept of model integration and
reusability can enable the most appropriate numerical algorithms and techniques to be applied to a
particular problem helping the user to arrive at the optimum solution through new types of analysis.
Such a system would consist of three architectural elements. The algorithms or model components
("atomic models") would be stored within a modelbase as building blocks. Integrated model derivation
is then supported by a knowledge base which organises and classifies these components so that the most
appropriate ones can be easily selected for combination into a larger derived model. This derived model
can then be run via the third element- the simulation engine.
Plant (1993) described the standard architecture of Expert Systems as applied to agriculture and
biological resource management. In many ways this is similar to that of a DSS, comprising a knowledge
base and all inference engine supported by an appropriate user interfac<:. Th\: !llO.'>! il11portant feature of
15
this configuration is the separation of the inference mechanism from the domain-specific knowledge
which is accepted as a defining characteristic of an Expert System.
Most commonly, the knowledge base consists of a series of production rules- if the antecedents Al and
A2 are present then the consequents Cl and C2 arise. The inference engine can then link these rules by
developing chains of logical reasoning until the goal is arrived at, the consequents of the first rule
become the antecedents of the second rule in the chain and so on. The descriptive nature of the rules
enables intuitive information based on expert experience to be incorporated and can readily cope with
the uncertainty inherent in the complex systems being dealt with. Not only can the user see the goal
obtained by the system (the expert's judgment) but can follow the path of logical reasoning, enabling
them to apply their own experience effectively.
Plant (1993) provided a number of examples of the practical use of Expert Systems in agriculture and,
in particular, how these can be supported by the use of numerical models. Where the consequents do
not automatically arise from the antecedents in a particular rule such models can provide this link. For
example, an application deciding the most appropriate pesticide to use in particular situation might use
a model to ascertain the consequences of using each of the treatments. An Expert System can then be
used to determine the most suitable chemical to use based on the balance between the adverse
environmental effects and the pesticide's ability to provide control as predicted by the model.
Maaren and Dent (1995) argued the need for architectural standards to be used in computer system
development so as to avoid unnecessary dissipation of scientific energies. They reported that a number
of major environmental bodies in USA are collaborating and have produced the Watershed Data
Management System in an attempt to define some standards. These standards are now being adopted in
South Africa.
1(,
3. A Review of Integrated Models
3.1 AQUA (Hoekstra, 1995)
3.1.1 General Overview
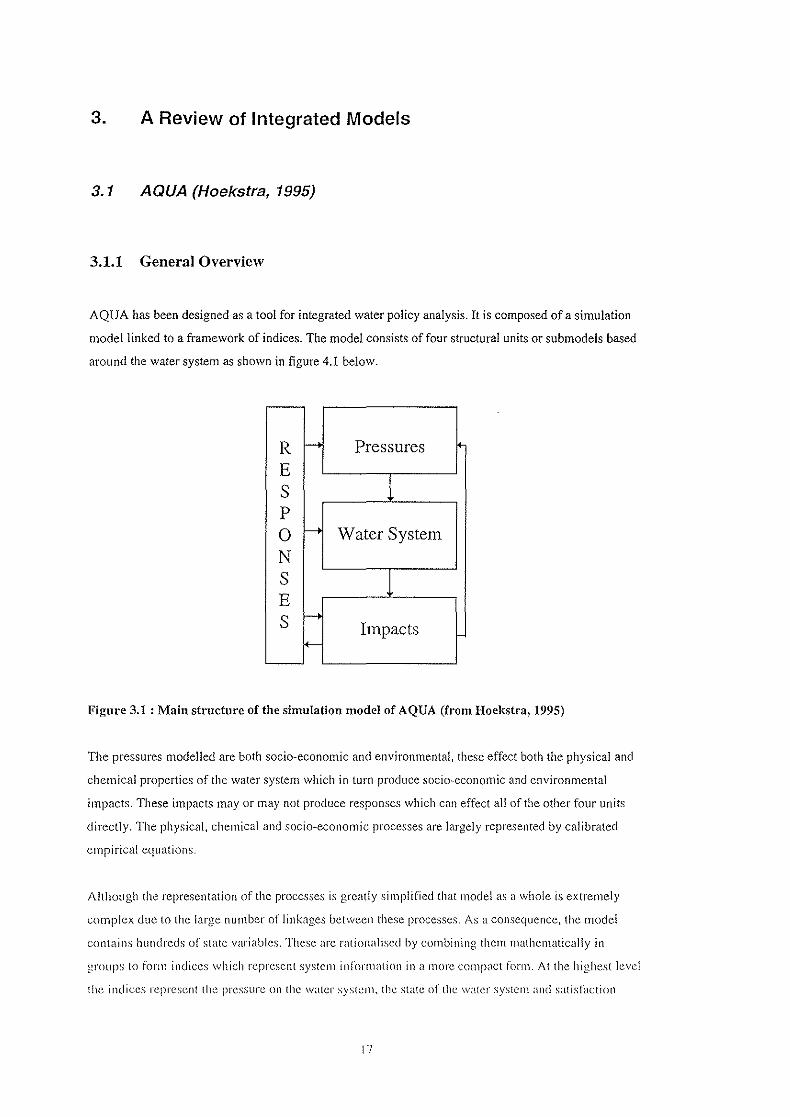
AQUA has been designed as a tool for integrated water policy analysis. It is composed of a simulation
model linked to a framework of indices. The model consists of four structural units or submodels based
around the water system as shown in figure 4.1 below.
R I-> Pressures E S 1 P 0 f---> Water System N S J E S eo->
Impacts <-
Figure 3.1 : Main structure of the simulation model of AQUA (from Hoekstra, 1995)
The pressures modelled are both socio~economic and environmental, these effect both the physical and
chemical properties of the water system which in turn produce socio~economic and environmental
impacts. These impacts mayor may not produce responses which can effect all of the other four units
directly. The physical, chemical and socio-economic processes are largely represented by calibrated
empirical equations.
Although the representation of the processes is greatly simplified that mode! as a whole is extremely
complex due to the large number of linkages between these processes. As a consequence, the mode!
contains hundreds or state variables. These arc rationalised by combining them mathematically in
groups to form indices which represent system information in a more comp<lct rorm. At the highest level
{he indices represent the pressure 011 the water SYS!CJll, the state of thc water system and satisfaction
17
with the functioning of the water system. This last includes such things as satisfaction with the levels of
domestic and agricultural water supply.
3.1.2 The Simulation Model; The Pressure Submodel
The pressure submodel can be subdivided into environmental pressures and socio~economic pressures.
The environmental pressures accounted for comprise land cover changes, soil degradation, temperature
changes and changes in concentrations of certain substances in both surface and ground water. They are
not computed within the submodel but are fed into it either from other models external to the AQUA
framework or from existing datasets.
The socio-economic factors are, however, computed witllin the submodel itself. Total water demand is
calculated as the sum of domestic, ilTigation, livestock and industrial demands. These components are
effected by investment in education and technology, water price, gross national product and industrial
output, among other things and are modelled by simple empirical equations. Elasticity in economic
growth and prices are considered and through selection of different parameters varying technological
development paths can be simulated. Actual supply may be lower than demand in some or all of these
components due to water availability or allocation policy. Demand is therefore perceived as a potential
demand which is not necessarily fulfilled. Actual water supplies are calculated in the impact submode!.
Whether supply meets demand depends on the allocation mechanism simulated in the response
submode!.
The actual pressure on the water system results from the actual supply. The pressure submodel
differentiates between several different water sources which are used to meet that supply. These sources
are fresh surface and ground water, fossil ground water, rainwater harvesting and saline water. The
withdrawal of water stored in reservoirs is divided into that used for water supply and that used for
hydroelectric power generation. Water taken from any of these sources may be returned to the same or
another source through water recycling. This is simulated through the calculation of a water reuse
potentia! parameter. }=<'urthermore, return of domestic or industrial water to one of the sources may effect
the water quality and this is quantified through another model parameter, itself a simple function of
expenditure and treatment costs.
3.1.3 The Simulation Model: The Water System Submodel
At its largest scale of applicatioll, AQUA cOllsists of four spatial compartmcnts: the atmosphere, the
land, the ice caps and the ocealls. Within cach of these compartlllcnts arc one or more reservoirs. For
IX

example, within the land compartment lie reservoirs representing water in the following states: snow,
soil moisture, contained in terrestrial biota, stored as surface water and stored as both fresh and fossil
groundwater. When simulating land surface processes fourteen ecosystem types are accounted for
comprising seven land cover types, each lying in two climate zones.
The volume of water within each reservoir is calculated through simple mass balance equations
although it is assumed that the volume of water stored in the atmosphere is constant. In addition the
storage in the snow and glaciers reservoir is modelled as a function of temperature. A variety of
mechanisms are considered in the computation of the sea level including the global temperature
(effecting any possible thermal expansion), land cover changes, reservoir construction and groundwater
withdrawal.
The fluxes between the reservoirs (at least on land) are simulated on a monthly time step, considered
essential in order to calculate the minimum freshwater supply throughout the year. The magnitude of
the f1uxes within a time step is calculated by simple empirical equations. For example, land evaporation
is calculated using the Thornthwaite equations which are effectively a function of temperature only.
Even simpler, the rate of evaporation from the ocean is computed as the product of a calibrated
response parameter and a constant. The loss from the soil moisture store is a function of a soil water
holding capacity parameter (given for each land cover type) and the potential loss, which is the
difference between precipitation and potential evaporation above any soil moisture deficit. The actual
evaporation is then the difference between the rainfall and the change in soil moisture storage. Runoff is
empirically distributed between fractions which discharge to groundwater, run off the surface or occur
as baseflow and the river discharge is calculated from a mass balance of all these quantities.
19
Four broad classes of water quality are distinguished by AQUA. Class A is suitable for all functions, B
is suitable for humans but not for ecological development, C is unsuitable for both humans and aquatic
life while D is also unsuitable for agriculture and industry. Depending on the scale at which the model
is implemented, data on the average concentrations of relevant substances (such as nitrogen compounds
) are either imported from an external model or calculated within AQUA by a simplified surface water
quality model component. Groundwater quality is not considered. These average concentrations are
statistically distributed and the fractions of the total water stock falling into each of the water quality
classes is calculated. The thresholds between the classes are defined by maximum acceptable
concentrations.
3.1.4 The Simulation Model: The Impact Submodel
The impact submodel simulates the performance of the following socio~economic and ecological
"functions" of t.he water system:
I. Domestic water supply
2. Agricultural water supply
3. Industrial water supply
4. Hydroelectric generation
5. Flood protection
6. Natural water supply to terrestrial ecosystems
7. Protection of aquatic ecosystems
The first three functions are all calculated in a similar way. The supply is considered to be a function
only of the balance between cost and expenditure. The expenditure is determined in the response
sub model while the cost is calculated here as a function of the potential of the hydrological system to
supply water, the quality of that water and the total water use. These parameters are modified by a
calibrated constant dependent on the local costs in the are being modelled. The supply can then be
compared to the demand (as calculated in the pressure submodel) to provide data on which to base
policy decisions.
Hydroelectric generation is calculated as the potential for power generation modified by a factor
quantifying the degree to which this potential is achieved. The potential is again a balance between
costs and expenditure. The cost itself is computed as a function of the hydraulic characteristics of the
reservoir supplying the power station.
Five hydraulic, three dcmographic and four cconomic classes are applied to the worlds coastline ill
mlier 10 characlerise the impact of" coastal nooding in terms oj" people and capiwl. i\ crilical waler level
211
is defined as a function of expenditure on coastal defences and relevant natural factors. The probability
that the sea level will exceed this is then calculated as a function of this and other natural factors
modified by parameters specific to the hydraulic, demographic and economic classes. Based on this
probability and the elevation of the coastline the number of people and value of capital at risk can be
quantified.
The remaining two functions are computed directly from parameters such as evapotranspiration and
water quality output from the water systems submodel.
3.1.5 The Simulation Model: The Response Sub model
The response submodel simulates the societal response arising from the performance of the water
system. It distinguishes between an autonomous response and a policy response. The policy response is
modelled simply by setting the value of a number of variables within the submodel. If these are not set
then the default values are taken which model a purely autonomous response.
The policy variables have been selected following two criteria. Firstly they are taken from the variables
used in water policy analysis by the Unite Nations and then, secondly, only the variables which call be
directly related to the dynamics active in the other three submodels are selected.
The policy options fall into categories which can be defined as infrastructural, educational,
technological, financial, legislative and institutional. When the variables representing the options in
each of these categories are not set by the user the model performs simple empirical calculations to
estimate the autonomous response. For example, if the no specific policy concerning waste water
treatment is input then the model assumes that the autonomous response will be to maintain the existing
level of treatment and extend it in proportion to any rise in waste water discharge.
3.1.6 The Framework of Indices
Unsurprisingly, given the variety of processes which it seeks to simulate, the outputs from AQUA are
numerous. Certain quantities, termed indicators by Hoekstra, can be identified with these processes
which can quantify their performance and so provide the user with the information required. In order to
simplify analysis, indices arc derived by simple mathematical combinations of indicators relating to
p<lrticular areas of the system. These are then aggregated themselves to create a three tier hierarchical
structure. At the highest leve! there exists only three indices: thc Watcr System Pressure Index, the
Water System State Index and the Water System Functions Satisfaction Index.
21
The Water Systems Pressure Index incorporates information concerning the water demand as compared
to that available from the natural hydrological system, water supply and reuse efficiencies and on the
level of pollutant emission. The Water System State Index includes information on freshwater quantity
and quality as well as sea level rise. Water System Functions Satisfaction Index quantifies the
performance of all the water system functions listed in section 4.1.3. For example the domestic water
supply index is defined as the fraction of the population with adequate water supply and sanitation.
3.2 The NERC/ ESRC Land Use Modelling Programme (NELUP)
3.2.1 General Overview
O'Callaghan (1995) describes NELUP as a Decision Support System to aid in integrated land use
planning through the modelling of socio-economic mechanisms of land allocation which both constrain
and are constrained by the physical and ecological processes impinging upon them. A hierarchical
system framework is used to conceptualise the relationships between the entities and processes
recognised to be present in the system.
At the lowest level are the data describing the state of the system. The level above this comprises
physical models which link the physical entities described by the data in the level beneath. Level three
contains information concerning feedback control systems and their effects on the processes described
by the models beneath. The fourth level focuses on the behaviour of living organisms in response to the
environment (again as described by the levels beneath). The fifth level places individual humans within
the system while the sixth is that of social organisations- the level at which humans interact.
Land cover is recognised as the pervasive link between market and policy forces (operating at levels 5
and 6), the ecology (operating at level 4) and the hydrology (operating at levels 2 and 3) as summarised
by the land cover triangle (figure 3.1). These disciplines together embody the key dynamics in the
system which are relevant to environmental decision makers. NELUP therefore focuses on providing
algorithms which describe the dynamics active in the three disciplines and the interactions between
them. In this way all the information necessary for a decision based on the consideration of all
disciplines in appropriate measure can be derived.
The Illodel is primarily designed to run at the scale of a large catchment although the hydrological
mode! can provide information on it scale much smaller than this. However, so as to represent the
processes active at level 5, rcprescnl<ltivc f<lr!11 models can be nested within the regional economic
simulation (Oglclilorpc and O'Callaghan ,19(5).
Market and policy forces
Hydrology Ecology
Figure 3.1 : Land cover triangle
3.2.2 Economic Modelling
As Moxey et al. ( 1995) explain, the economic component of NELUP seeks to model how land use
changes as a response to the influence of changing market and policy conditions mediated through
individual land users. This is considered to be the [Ifst step in simulating the system, after this the
effccts of the predicted land use change on the ecology and hydrology can be quantified.
It is assumed that the land users will make decisions based on maximising profit within technological
constraints, however this decision can be influenced by a range of policy measures. To simulate these
measures within NELUP, prices, quotas and subsidies can be fixed on range of inputs and outputs
associated with the system.
A linear programming approach is used to model the socio-economic dynamics due to its flexibility and
ability to cope with minimum data from a variety of sources, The approach involves defining a set of
production activities in terms of input-output relationships, For example, in very simple terms a certain
yield of wheat can be related to a certain quantity of fertiliser. The set can then be searched to find a
combination of production activities which optimise an objective function (quantifying profit, for
example) within the identified constraints (imposed by, for example, government policy).
All farms are considered to act as a single "macro-farm". Although it is recognised that this may
overstate the nexibility and co-ordination of agricultural practice (in practice, most fanners will not
work for the common good but will act in their own interests) it is an accepted technique. Spatial
disaggregation is enabled by dividing the land within the macro-farm into categories distinguished by
different potential production activitics.
/\ !lumber of other assumptions <lrc madc. Prices arc assulllcd to be fixed outside or the system,
livestock illld kcd !Hlrcll:lsCS C,ln be Illadc outside. of the catchmcnt and ror,\)_!~: (r;lllskITe{i between land
2\
categories. In addition, agricultural technology is assumed to remain at a constant level and the benefits
gained from it are independent of the scale on which it is used. Importantly, the objective function is
chosen to be that as much land in the catchment as possible is returned to agricultural production and
forestry. This implies that each producer will aim to maximise their profits.
3.2.3 Ecological Modelling
Rushton et al. ([995) state that the aim of the ecological component of NELUP is to predict the
consequences of land use change on the distribution of the flora and fauna present in the river
catchment. It is assumed that ecological change results from agronomic land use change.
In order to overcome the problems presented by an enormous species range and differences in
behavioural response a non-process based modelling approach is applied to only a limited number of
species. For further simplification two scales are selected for examination. The larger scale simulates
change between species types while the smaller one looks at changes within species types. The species
considered are also split into two groups: species assumed to occur in only one habitat (plants and
insects, for example) and more mobile species with more complex habitat requirements, such as birds.
Three model types are applied depending on which scale and species group is being considered. The
first, a simple associative model, is applicable to less mobile species at the larger scale. The second, the
vegetation management model, deals specifically with plants at the smaller scale, while the third model
type is applied to the mobile species group.
The associative model predicts species distribution according to their known occurrence in certain
habitat types. A given land cover has a defined set of species communities present within it. Within
these communities are defined a distribution of species. These definitions are base, as much as possible
on published data.
The vegetation management model simulates the effects of grazing and fertiliser application on plant
composition. Permutations of environment and management conditions (particularly with reference to
the above) are known to produce certain plant compositions. Where these conditions are found within
the catchment it is assumed that that plant composition is present. Any changes in, for example, the land
management wi!! result in a consequent species composition change.
The models applied to the higher species follow similar methodologies but due to the more complex
behavioural patterns exhibited by such species they require more complex analysis. Habitat variables
associated with certain species arc identified using i\ G1S i\lld the probability of a species occurring
within a particular habitat is computed as a function of the degree to which the associated habitat
variables are present.
3.2.4 Hydrological Modelling
Adams et al. (1995) outline the aims of the hydrological modelling component as being to predict the
hydrological response of a river basin to proposed changes in land management. It can be seen once
again, therefore, that land use provides the link between the separate system components. A two track
approach is taken in doing this. A complex, physically based and distributed model, SHETRAN, is able
to simulate the changes in water yield, sediment load and contamination to a high spatial and temporal
resolution. However this approach requires a significant quantity of data and computational resources.
Moreover, simulations at this level of complexity may not always be required or appropriate. In such
circumstances a simpler model, ARNO, can be implemented. If this indicates effects which require
further investigation then SHETRAN can be run off line to provide more detail. Both models will be
described below.
SHETRAN models the catchment across a lkm resolution grid each cell of which is linked by a stream
network to its neighbours. Lateral flow is modelled for both a surface and sub-surface processes, in both
the saturated and unsaturated zones. Physically based equations are used to model the balances of
water, sediment and contaminant at each point in the catchment and, when these equations are
combined and solved, the spatial and temporal variation of the balances can be resolved. Effective
parameters are used to represent the sub~grid variation in the physical and chemical variables which
effect the processes being modelled.
ARNO, on the other hand, uses a lumped modelling approach. The model is applied to sub-basins
within the catchment at a much larger scale than the lkm grid used by SHETRAN. The sub~basins are
connected by a channel network which describes the primary river system and by explicitly defined
surface water, unsaturated and saturated zone flow paths. Within each sub~basin the water balance is
solved analytically and accounts for interception loss, plant and soil evaporation, storage, drainage and
runoff.
3.3 Catchment Resource Assessment Model (CRAM)
Chnpman et al. (1995) designed CRAM around three groups of componcn(s~ a user interface group, a
ll10del group and a database group. The 11lodel group comprises five 11lodcls- a rUlloff ll1odel, a rcserV(llr
111Odcl, an cconolllic model, all environmental impaclllloclel and a social impact Illodel.
Generally, the models are fairly simple and highly parameterised. For example, the economic model
calculates a profit or loss by comparing the value of the land product to the costs. Production per unit
land area is fixed for each land use and varies linearly with water availability. The total of the land use
is then calculated by multiplying by a fixed price. There are fixed costs and variable costs proportional
to the amount of product generated ~ pumping incurs a variable cost, for example, dependent not only
on the volume pumped but on the distance and head it is pumped over. All these costs are set as
constants within the model.
The environmental and social impact models derive an impact index from a weighted sum of values
representing the state of ecosystem and society components under particular land uses. Among other
things, these are weighted by the sensitivity of each component to different land uses.
3.4 A Multisector Model for Land Conversion
Yin et al. (1995) present a goal programming model designed to study the interrelations between
biophysical, social and economic factors. It does not, however, attempt to model the interaction of the
actual processes but uses constants derived from measured data to quantify the effects of land
conversion from one use to another.
The mathematical approach used is similar to that employed by the economic component of NELUP.
An objective function is defined to be the minimisation of the differences between target levels set by
policy decisions and the actual levels predicted by the model. For example, if the target level is to
produce 1000 tonnes of wheat, the model will attempt to allocate enough land so that the actual yield is
as close to this as possible. This would be straightforward except that the land required may need to be
allocated to another resource so as to achieve another target. For example, a high value may be placed
on the preservation of habitats for water fowl. This can be quantified by associating a certain habitat
value with a fixed land area. The total value desired then becomes a policy decision.
Such target levels form a set of constraints on the achievement of the objective function. The target
levels are numerical goals representing the optimisation of resource production and economic return,
minimisation of soil erosion and maintenance of forest cover and waterfowl habitat. As (in almost all
cases) it will not be possible to achieve al! the targets, the achievement of each goal must be ranked
according to importance. The model will then seek to be as close as possible to the most important goal
while not straying to far from the targets set for the others.
Values are calculated simply by multiplying the area of land under a particular use by a constant
representing a value per unit land area. This value may represent soil loss or timber production, for
example. The constants are derived from measured data.
3.5 Automated Land Evaluation System (ALES)
Rossiter (1990) describes ALES as "a microcomputer realisation of the FAO's framework for land
evaluation (FAO, 1976), suitably enhanced with a definite method of economic analysis". It provides a
framework within which the expert knowledge of an individual user can be implemented in a structured
way to produce land use classifications and linked economic returns. The end product is an expert
system which can be used by non-expert land managers. However the construction is also an end in
itself as it imposes a logic on the expert which aids in the understanding of the environmental system
being modelled.
The system is composed of a knowledge base, a database, a processing module and a user interface.
The knowledge base is central to the ability of the system to consider the interaction of biophysical
processes with more abstract dynamics. It is a structured representation of all the facts and inferences
that a real expert would consider when making a decision. For example, if it is desired to include the
effect of land drainage on harvest date and consequent market price then this interaction must be
represented in the knowledge base. The system would seek to model such an interaction by following a
decision tree constructed a priori by the expert building the system. To continue the example, the actual
effects on harvest date of installing land drainage must be identified by the expert from an external data
source while building the system. To construct a decision tree this effect must be quantified for a range
relevant parameters such as soil type, topography and climate.
This is the essential difference between this type of system and an approach based on process
model!ing. With the approach used by ALES, it is assumed that the expert knows what the effect of a
particular management practice will be and can identify the interactions which produced that effect. The
expert can then include these interactions in the knowledge base as a decision tree. The strength of
ALES lies in the structure it imposes, forcing the expert to consider which processes and interactions
need to be included.
The ecollomic component seeks to calculate the gross margin resultant from the proposed use of a
particular land type by comparing predicted costs with predicted returns. The predicted costs can be
fixed or can vary and arc dependent on land type and management practice. If more abstract costs, such
as environmental degradation, can be quantified then they can be included here. The predicted returns
:Irc h:lsed on crop yield hut may, again, include more abstract faciors.
27
Once a model has been constructed and the necessary data collected then it can be run across
homogeneous land mapping units to produce evaluation matrices. The physical suitability evaluation
matrix allocates each land mapping unit a physical suitability class for each land use. A second matrix
provides the gross margin calculated for each mapping unit under each land use and a third specifies the
crop yield.
Iohnson et al. (1994) integrate ALES within a methodology aimed at providing a complete system of
resource management assessment. ALES is supplemented by simulation models which predict crop
yields under given management regimes and whose output provides the basis for the decision trees built
within ALES. In addition, a risk analysis of the economic returns generated by ALES is performed,
dependent on biophysical and economic variables already calculated. The authors conclude that the
ALES structure provides a useful way of integrating biophysical and economic data over a range of
scales.
3.6 A Framework for Watershed Analysis
Montgomery et al. (1995) do not outline a working model but construct a framework for "ecosystem
management" which raises a number of interesting points. Firstly their motivation for doing this
provides a useful goal for any system development to aim at :
"Implementing ecosystern management requires aframeworkfor gathering and
interpreting environmental information at a resolution, scope and scale necessary for
addressing the tradeof!s between economic and ecological considerations inherent to
making land management decisions."
Although this does not explicitly mention hydrology, it is recognised later in the paper that hydrological
processes have an important effect on "ecological considerations".
The framework can be understood as a number of questions concerning the historical and current state
of the catchment and its desirable future condition. Linked to each of these questions is an analysis
component which comprises the actions required to answer that question. The framework includes such
questions as "how does this landscape work?" and "what has its history been'?" and seeks 10 integrate
field analysis, historical analysis and numerical models describing the most important processes.
Importance is placed on understanding what has happened in the past as a way or inferring the cause or
current conditions. Such knowledge also provides a baseline from which lO measure ecosystem stress
which can be expected to increase as the environmcnt is incrcasingly altered from the regime under
which tile ecosystem evolved.
2X
The results from this analysis are then combined to classify the catchment into areas subject to similar
ecological and economic interactions. Such a synthesis can be used to highlight the conflicts arising
between the considerations pertaining to each of these disciplines and plans can then be formulated to
resolve these conflicts.
3.7 Computer Models in Integrated Pest Management
Berry (1995) presents Hopper, a system designed to support real-time tactical decisions concerning
grasshopper management at a local scale. Although not specifically aimed at natural resource
management it provides a useful illustration of how a number of methodologies can be inter-linked to
produce a system which truly responds to user requirements.
Hopper integrates and expert system with two simulation models and a linear programming model. The
expert systems makes decisions regarding control measures depending on variables such as weather
conditions and environmental concerns. The simulation models predict grasshopper populations and
rangeiand forage production. The recommendations of the expert system are then used, together with
the output from the simulation models, as variables in a linear programming model which determines a
cost-benefit ratio for the control measure proposed. The inputs and parameters used in the system can
be easily changed to reflect any scenario the user may wish to investigate.
3.8 State-Wide Resource Information and Accounting System (SRlAS)
Mallawaarachchi et al. (1996) discuss the use of GIS capabilities in integrating data and mathematical
programming model analyses. They have applied this methodology to produce the SRIAS system,
designed to provide strategic answers to natural resource and economic policy questions.
"Best available" data sets, both physical and economic in nature, were collected and input to the GIS.
These included data on land tenure, vegetation, geology, soils, topology, population and the current
state of land degradation. The analysis then proceeds through a number of stages. In the first instance,
agricultural production data is combined with soil and landscape data to produce a latld~use map. This
is done through the use of a linear programming (LP) technique which compensates for the li1l1ited data
available at differing scales. The soil erosion hazard is then estimated llsing the Universal Soil Loss
L:quatio!l and this data is {h~l1 used in conjunction with another L,p model to predict thc net loss 10 the
farmcr of the estimated soil loss. The authors are currently working on lIsing this economic v,\lUG to
estimate the wider illlplicatiol1s or land degr:\(lation. h)r example, people extcrn;d to {he f,tr111 who
!lo!"llwlly Held v,due to <12'.ricultur:d products will also experience a loss of incol11<:.
29

The capability of the GIS to analyse and aggregate spatial data makes it a useful tool in dealing with the
problems arising from data which are only available at different scales as such data can be linked by
common spatial attributes. The authors stress that this is only one application of the technique. They
argue that the combination of GIS and modelling methodologies can enhance ecological and
hydrogeological models to simulate the agro-ecological consequences of, for example, a change in
irrigation policy on river salinity.
311
Batchelor, C.H. 1995. Water resources management and agricultural production in the central Asian
republics. Report on an Agro-Hydrological consultancy to sub-project 7 of the WARMAP project,
June 1995. Institute of Hydrology, Oxfordshire.
Berry, lS. 1995. Computer models in integrated pest management: a case study of the grasshopper
integrated pest management project. J. Agricultural Entomology, 12(4): 229-240.
Blackmore, DJ. 1995. Murray- Darling basin commission: a case study in integrated catchment
management. Water Science and Technology, 32 (5-6): 15-25.
Breen, C.M., Biggs, H., Dent, M.C., Gorgens, A., O'Keefe, J. and Rogers, K.H. 1995. Designing a
research programme to promote river basin management. Water Science and Technology, 32(5-6): 103-
109.
Burton, J. A framework for integrated river basin management. Water Science and Technology, 32 (5-
6): 139-144.
Chandler, 1. 1994. Integrated catchment management planning. J. I'WEM t 8: 93-96.
Chapman, R.A., Manders, P.T., Schoies, RJ. and Bosch, lM. 1995. Who should get the water "
Decision support for water resource management. Water Science and Technology, 32 (5-6): 37-43.
Food and Agriculture Organization of the United Nations 1976. A framework for land evaluation, Soils
Bulletin 32. FAO, Rome.
Food and Agriculture Organization of the United Nations 1990. GET OFF CHARLES!!'!"!!!
Henderson-Sellers, B. 1991 a. Decision support systems for stored water quality: 1. The environmental
decision support system. Environment International, 17: 595-599.
Benderson-Sellers, B. 1991b. Decision support systems for stored water quality: 2. An example
application. Environment International, 17: 601-613.
Hoekstra, A.Y. 1995. AQUA- a framework for integrated water policy analysis. Global dynamics and
sustainable developmenL programllle, GL,OBO report series no. 6. RIVM report no. 461502006, July
1~95.
Holling, C.S. 11.)73. Cross-scale morphology, geometry and dynamics of ecosystems. Ecological
ivl()Il()~raphs, ()2: !~t..j7-:)()2.
Jankowski, P. An architecture for a modelling support system for simulation of environmental
processes. Computers and Geosciences, 18: 1075-1093.
10hnson, A.K.L, Cramb, R.A. and McAlpine, 1.R. 1994. Integration of biophysical and economic data
using an expert system: results from a case study in northern Australia. Soil Use and Management, 10:
181-188.
Mallawaarachchi, T., Walker, P.A., Young, M.D., Smythe, R.E. and Lynch, H.S. 1996. GIS-based
integrated modelling systems for natural resource management. Agricultural Systems, 50: 169-189.
Maaren, H. and Dent, M. 1995. Broadening participation in integrated catchment management for
sustainable water resources development. Water Science and Technology, 32 (5-6): 161-167.
Masser, I. 1994. The use of monitoring systems: an evaluation of the SETIA project monitoring system.
Environment and Planning B: Planning and Design, 21: 429-440.
Mitchell, B. and Hollick, M. 1993. Integrated catchment management in Western Australia: Transition
from concept to implementation. Environmenlal Management, 17 (6): 735-743.
Montgomery, D.R., Grant, E.G. and Sullivan, K. 1995. Watershed analysis as a framework for
implementing ecosystem management. Water Resources Bulletin, 31(3): 369-386.
Moxcy, A.P., White, B. and O'Callaghan, 1. R. 1995. The economic component of NELUP. lournalof
Environment Planning and Management, 38 (l): 21-33.
0' CaIJaghan, 1.R. 1995. NELUP: An Introduction. Journal of Environment Planning and Management,
38 (I): 5·20.
Ogletilorpe, D.R. and O'Callaghan, J.R. 1995. Farm-level economic modelling within a river catchment
decision support syslem. Journal of Environlllent Planning and Management, 38 (I): 93-106.
Planl, R.E. 1993. Expert systems in agriculture and resource management. Technological Forecasting
a"d Social Change. 43: 241·257.
Rossiter, D.G. 1<)00. ALES: a framework for land cvaluation using a microcomputer. Soil Usc and
iVL1nagc!llcnt. 6 (I): 7-20.
Rushton, S.P., Cherrill, A.J., Tucker, K. and O'Callaghan, J,R, 1995. The Ecological Modelling System
of NELUP. Journal of Environment Planning and Management, 38 (1): 35-52.
SIinger, lH. and Breen, C.M. 1995. Integrated research into estuarine management. Water Science and
Technology, 32 (5-6): 79-86.
Stock, M.W., Ameli, L.A., Gordon, S.E., and Kersey, E.A. 1991. A user-centered approach to design of
expert systems for silviculture. Resource Technology 90. Proc. 2nd int!. symposium on advanced
technology in natural resources management, Washington D.e. 1990, ASPRS.
Turner, B.L., Skole, D., Sanderson, S., Fischer, G., Frescoe, L. and Leemans, R. 1995. Land-use and
land-cover change (LUCC): Science/research plan. !GBP Report no. 35, HDP Report no, 7.
van Zyl, F.e. 1995. Integrated catchment management: is it wishful thinking or can it succeed? Water
Science and Technology, 32 (5-6): 27-35.
Yin, Y., Pierce, J.T. and Love, E. 1995. Designing a multisector model for land conversion study.
Journal of Environmental Management, 44: 249-266.