a laser pyrolysis/laser fluorescence technique for combustion chemical kinetics
TRANSCRIPT
Nineteenth Symposium (International) on Combustion/The Combustion Institute, 1982/pp. 107-115
A LASER PYROLYSIS/LASER FLUORESCENCE TECHNIQUE FOR COMBUSTION CHEMICAL KINETICS
PAUL W. FAIRCHILD, GREGORY P. SMITH, AND DAVID R. CROSLEY SRI International
Menlo Park, California 94025 USA
A new two-laser method for the real-time measurement of radical/molecule reaction rates at temperatures of 800-1400 K is described. A mixture of SF6, N~, HaO2, and H20 at 40 torr is irradiated by a pulsed infrared CO2 laser (1J/cmZ). Absorption by the SF6 and sub- sequent thermalizing collisions heat the mixture, and some of the H~O2 decomposes to OH. A pulsed dye laser, fired after a variable time delay, produces a laser-induced fluorescence signal in OH, which is used to determine its density and rotational temperature. After ex- pansion wave cooling, the heated region reaches a temperature, relatively uniform in both position and time, during which period bimolecular reaction rates can be measured. As an ,example, a rate constant of 1.3 • 0.4 • 10-~Zcm-3s-t for OH + c n 4 at 1030 K • 50 K was measured. Details of the heating dynamics and considerations important for kinetics mea- surements are discussed.
I. Introduction
To fully characterize a combustion process, one must incorporate both the basic gas dynamics and chemical reactions which occur. The necessary chemical input is a set of several unambiguous, specific ("microscopic"), high temperature rate con- stants, generally including product identification. Except for some low activation energy reactions, extrapolation of room-temperature data has often been found inadequate for this purpose; each of the chief methods used directly at high temperatures (flames themselves, shock tubes, and heated flow reactors) has its limitations. We describe and illus- trate here a new method, which uses a pulsed CO~ laser to heat the sample. It overcomes some of these limitations, and holds high promise as an ad- dition to the tools available for the measurement of high temperature reaction rates of importance in combustion chemistry.
This laser pyrolysis method, which has been used previously to study unimolecular reactions, t is here extended to real-time measurements of bimolecular radical-molecule reaction rates using laser-induced fluorescence (LIF) to detect the radicals. Because many of the small radicals (OH, NH, CN, C~, etc.) present as intermediates in combustion chemistry can be detected by LIF, 2 a large number of im- portant reactions in the 800-1400 K range are ame- nable to measurement using this laser pyrolysis/ laser fluorescence (LP/LF) method.
The unimolecular rate studies 1'3 were performed at lower temperature, with post-reaction product analysis, and competitive kinetics, to determine ac-
tivation energies. For the real-time bimolecular rate measurements at higher temperature, it is critical to understand quantitatively the physical processes producing the spatial/temporal profiles of the gas and radical densities and the temperature. In the following, we present a simplified theoretical de- scription of the operative phenomena and experi- mental data providing a semi-quantitative verifica- tion. This is then used to analyze the OH + CH 4 reaction rate, measured as an illustration, and to assess the possibilities and limitations of the LP/ LF method.
II. The LP/LF Method
The basic experiment, illustrated in Fig. 1, pro- ceeds as follows. A mixture of infrared absorber (SF6), bath gas (N 2 or CO2), radical precursor (H2Oz), and reactant (CHa) is irradiated by a pulsed CO2 laser. The SF 6 absorbs the infrared lager energy. During and shortly after the ~1 Ixsec pulse, this energy is collisionally transferred to the other mol- ecules and decomposition of the radical precursor begins. For a typical initial pressure of 40 torr (at 300 K) thermalization should occur in a few micro- seconds. The heated volume, now at higher pres- sure, expands against the surrounding 300 K gas, slightly compressing it. An expansion wave propa- gates inward to the center and then outward, pro- ducing a moderate two stage cooling of the initially heated region. Once this expansion is finished, the density, pressure, and temperature of the initially heated gas remain steady for a relatively long pe-
107
108 REACTION MECHANISMS AND MODELING I
riod. Further cooling occurs slowly (~1 K/Ixsee) by thermal conductivity across the interface be- tween the initially heated/unheated regions. These processes will be discussed in more detail in Sec- tion IV.
High activation energy unimolecular reactions occur during the short, initial, hottest period; low activation energy bimolecular reactions occur pre- dominantly during the longer steady period. The temperature attained is controlled by the laser flu- ence and SF6 pressure, although an optically thick cell must be avoided to prevent axial temperature inhomogeneities.
A pulsed dye laser, tuned to a radical (OH) ab- sorption line, is then fired after a variable time delay following the CO 2 laser pulse. The amount of resulting fluorescence detected is proportional to the number density of OH in the particular ab- sorbing rotational-vibrational level. By probing at least two such levels, both the temperature and total relative OH density can be determined. The radical density declines with time upon the addi- tion of a small known amount of reacting gas (CH4), yielding a radical reaction rate at the temperature prevailing during the slow cooling. The reactant pressure is chosen for pseudo-first-order conditions for convenience.
The basic laser pyrolysis technique was pi- oneered by Shaub and Bauer, 4 although most of their work utilized a c w COz laser. Our group 1'3'5 and several others 6 have been using the pulsed method to study unimolecular decompositions, and we have successfully determined activation energies with this method for a z o compounds 1 and organo- metallics, z Details of the comparative kinetics methods used and some earlier descriptive diag- nostics for the unimoleeular ease can be found in Refs. 1 and 3. In related work, violent heating by a CO2 laser has been used to initiate explosions, but without controlled and detailed kinetic inves- tigation.
Although the present work represents the first coupling of LIF with laser pyrolysis, LIF has pre- viously been combined with laser generation of radicals. An excimer laser has been used to pro- duce a variety of radicals in room temperature s and heated systems; 9 multiphoton dissociation by a fo- cussed CO 2 laser has also been exploited. 1~ In- frared fluorescence following excimer-laser-initiated radical chains has also been studied in detail under room temperature conditions. 11
HI. Experimental Details
The gas cell consists of a 12.5 em interior di- ameter aluminum cylinder, with 5 cm KC1 windows for the infrared laser radiation, and perpendicular
suprasil windows for the fluorescence excitation and observation (Fig. 1). The cell width is 1.0 cm between the salt windows, but widens to 5 cm at the outer 3 cm of the cell. This and the large cell volume damp any reflected compression waves and prevent reheating effects. 3 The windows are glued to the inside of removable aluminum plates. Flows of SF6, N~, and CH 4 are regulated and measured by calibrated Matheson flowmeters. Before enter- ing the cell the mixed gases pass through a buffer containing 80% H202 at 0 ~ C, which produces a vapor phase 1~ of 1/3 HzOz and 2/3 H20. A throt- tle valve and mechanical pump regulate the pres- sure (measured by a Wallace and Tiernan gauge at the exit port) independently of the flow. Under typical operating eonditions the entire gas volume was replaced every third laser shot, and mixing of the heated gas with the 200-fold excess of sur- rounding cold gas effectively dilutes any reaction- generated impurities between shots.
The TEA COz laser (Lumonies K-9215 with curved rear reflector and 40% output coupler) pro- vides 1J/era z in pulses of - 1 Ixsee duration at 10.6 ~m every 1.6 see. The central 1.0 em diameter area of the beam is directed through the cell, and reflected backward through nearly the same vol- ume, to insure even heating along the axis, and then into a power meter. This permits absorptions up to 50% without the temperature inhomogenei- ties associated with optical thickness. The fre- quency doubled output of a 10 Hz Quantel YAG- pumped dye laser ( -1 mJ pulse energy) is used to excite various rotational lines of the (1,0) band of OH(A - X) at 285 nm. The u v beam diameter, and thus the spatial resolution, was 2 mm. Fluores- cence along the center 2 mm of the dye laser path was focused (1:1) either through a broadband filter (h = 310 nm, Ah = 25 nm) or through a mono- chromator (set at k = 309 nm, Ak = 2 nm) onto a photomultiplier. Most of the fluorescence occurs in the (0,0) band, due to energy transfer; the total fluorescence distribution and thus the fluorescence detection efficiency lz for our setup, was measured to be independent of the level initially excited. Window fluorescence posed a problem for the broadband detection, and may necessitate the use of improved window materials or light baffles. The signal is processed by a boxcar integrator, triggered at the repetition rate of the CO 2 laser, and record- ed on a strip chart recorder. The dye and CO 2 laser power levels are monitored.
The delay between COz and dye laser pulses is controlled by two variable delay generators trig- gered by the YAG flashlamp firing. One opens the YAG Q-switch at 200 I~s (a delay up to 700 txs is available, at some cost in dye laser power). The second is fed to a TFL counting circuit which se- lects every eighth or sixteenth pulse to trigger a pulse generator which fires the CO 2 laser.
LASER PYROLYSIS tLASER FLUORESCENCE TECHNIQUE 109
I E'eo ro~ I ,M Tube
u
Fie. 1. Schematic diagram of the experiment. The time delay At is actually controlled by an external circuit which fires the COz and YAG laser sequen- tially. The filter between the cell and photomulti- plier is an interference filter or a monochromator.
pansion wave then proceeds outward until it meets the contact surface, where it is partially reflected and refracted.
The thermodynamic and flow properties may be computed from standard gas dynamics equations. 15 These include the relationship between P and T, and the conservation of the quantity ~/+ ( , / - 1)u/ 2 across an expansion wave (T is the heat capacity ratio Cp/C~). Also needed are expressions for the pressure, density, and flow velocity ratios across a shock wave. It was found most convenient to ex- press the known pressure ratio
P 4 _ T 4 _ [2~hM~ ~/_!1 - 1 ]
+ [ 1 _ , 4 - 1 a, M ~ - I ] e ' / ' - l _ _
~/1 + 1 a 4 M 1
and solve iteratively for M, in terms of which the quantities uJal, PJPD P~/P1 and a3/al, can he
IV. Temporal and Spatial Profiles
A, Computational
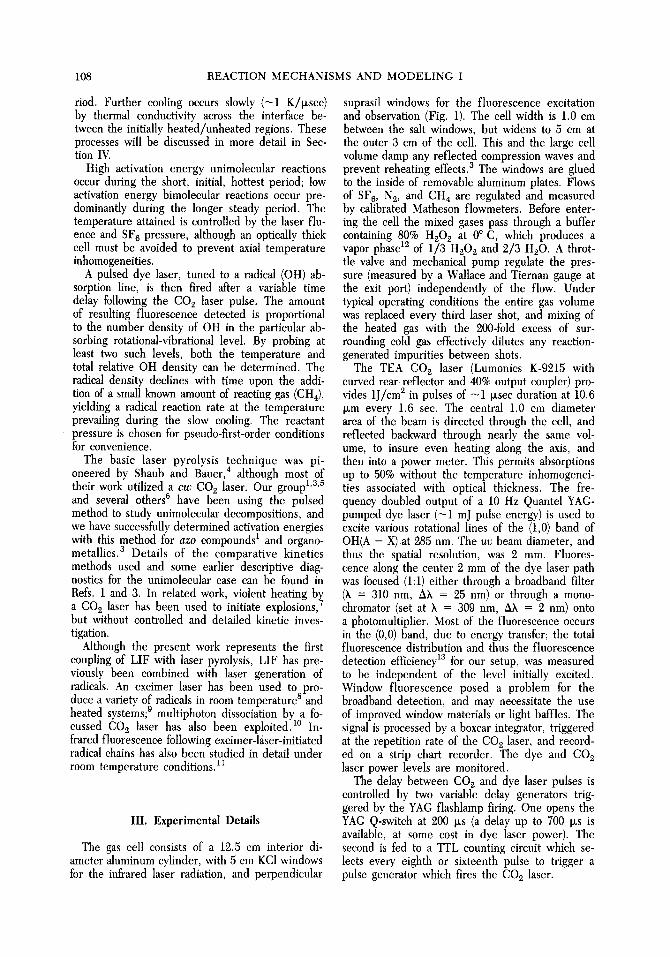
The symmetry in our experiment is cylindrical, dictated by the CO z laser beam shape, and a proper quantitative description of the heating/cooling pro- cess and pressure waves must incorporate that ge- ometry. It is nonetheless instructive to consider the much simpler picture 14 of fully one-dimensional, linear flow illustrated as an x-t plot in Fig. 2.
The CO 2 laser pulse heats the system (by as- sumption, instantaneously and uniformly) out to a radius r, producing an initial temperature T 4 known from the amount of absorbed energy. The pressure P4 may be calculated since the density in the heated region is unchanged. A shock wave propagates out- ward into the unheated gas, with a speed charac- terized by the Mach number M. Simultaneously, an expansion wave proceeds inward toward the center of the cell, reducing the pressure of the heated gas and thus cooling it adiabatically. The leading edge of this wave travels faster than the trailing edge because the speed of sound a 4 > a 3. The contact surface between the initially heated and unheated gas, across which there is no mixing, must travel outward due to this expansion. Both the pressure and fluid velocity must be constant across this surface, and the gas in region 2 is com- pressed relative to the undisturbed gas beyond the shock wave.
The inward expansion fan meets at the center its counterpart from the opposite side of the cell, shown in Fig. 2 as a reflection at x = 0. Because the gas in region 5 is homogeneous across the cen- ter, it must have a bulk velocity u 5 = 0. The ex-
4-6" - 5 ~ ~ 2
0
0 0.5 1.0 1.5
X, cm
FIG. 2. x-t diagram of the waves presen t in the heating process, as visualized for a one-dimensional system. The CO~ laser heats the system out to 0.5 cm (region 4) and a shock wave (heavy line) prop- agates into the initially unheated gas. An expansion wave propagates toward the center, reflects there and proceeds outward. The contact surface (dashed lines) separating the initially heated and unheated regions moves outward with time. The expansion waves continue to reflect and refract off the contact surface and at the center; by the time region 5 is attained conditions in the initially heated region are close to their steady values. The time scale was calculated for a mixture of 10 torr SF6 + 30 tort N2 heated to T4 = 1300 K.
110 REACTION MECHANISMS AND MODELING I
readily calculated. Because the remaining regions are each separated by expansion waves, their prop- erties can be obtained from these values using the relationships noted above. P
The cylindrical geometry complicates matters considerably, requiring numerical computation of the gas properties pertinent to our actual experi- ment. For this we have used a PUFF code 16 at SRI. This is a general program for the calculation of one-dimensional stress waves for a variety of media and initiation mechanisms, and has under- gone development over a number of years at SRI and elsewhere. For the current purpose we rely on p its predictions for our system without verification beyond that described in the next section. We es- timate that this may result in an uncertainty of ~10% in the reactant densities needed for the rate constant determinations.
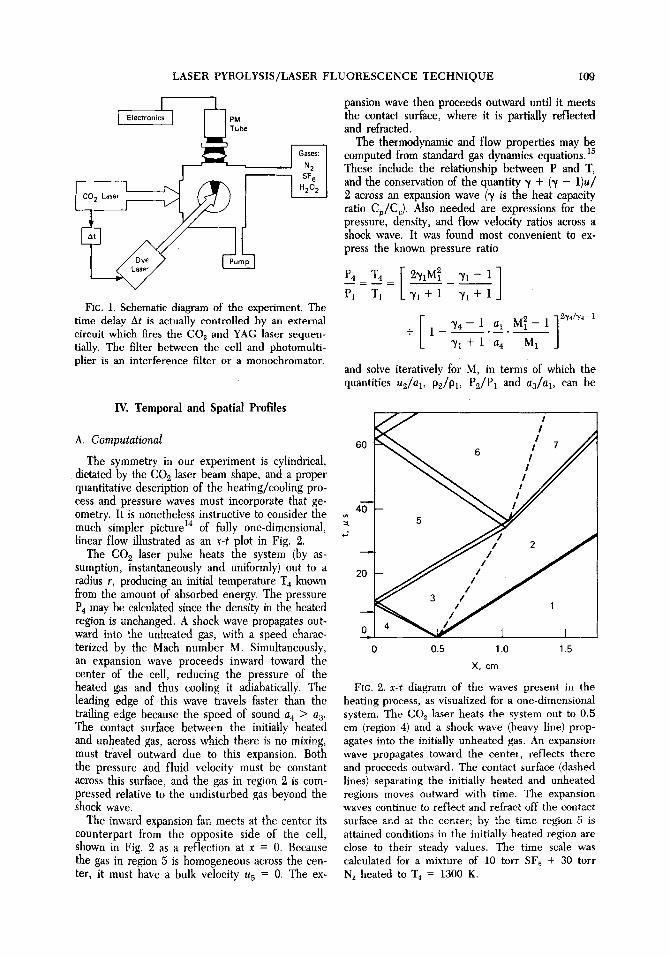
The computed results, in the form of density and temperature profiles across the cell at various times, are shown in Fig. 3 for a 1:3 mixture of SF 6 and N~ at 40 torr total pressure, heated from 300 to 1500 K. There are significant differences compared P to the linear case, including time-dependent oscil- lations of p and T near the center, as can be seen for t = 42.2 Ixsec. This results from the increased strength of a wave as its surface area decreases. Midway out in the heated region, p and T remain fairly steady over a long time; this is thus the re- gion of choice for Chemical kinetics measurements. Some minor fluctuations do continue, caused by weak acoustic waves reflected between the contact surface and the center.
B. Experimental
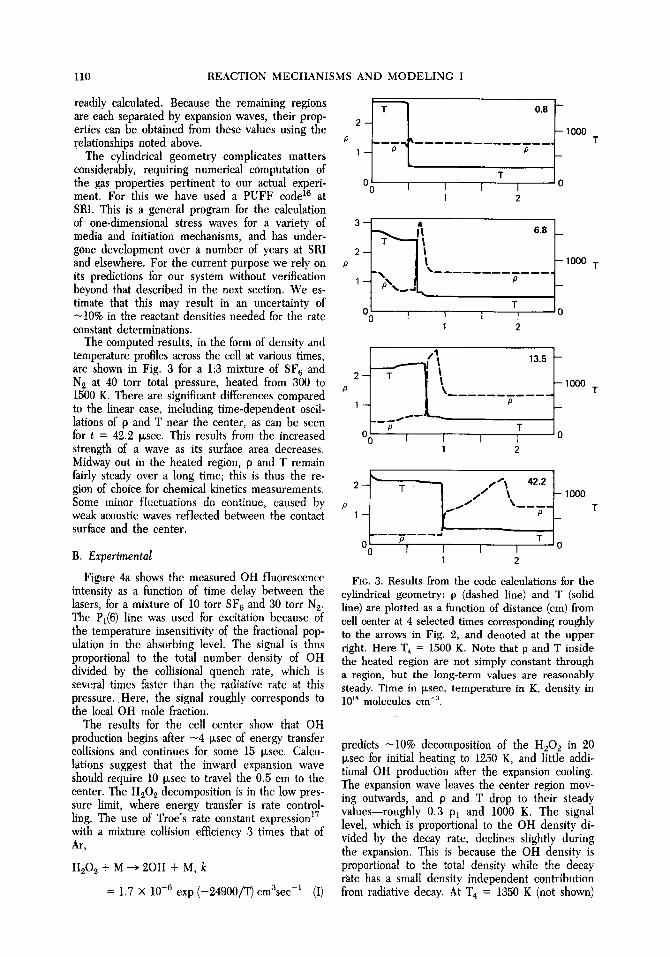
Figure 4a shows the measured OH fluorescence intensity as a function of time delay between the lasers, for a mixture of 10 torr SF 6 and 30 torr N 2. The P1(6) line was used for excitation because of the temperature insensitivity of the fractional pop- ulation in the absorbing level. The signal is thus proportional to the total number density of OH divided by the collisional quench rate, which is several times faster than the radiative rate at this pressure. Here, the signal roughly corresponds to the local OH mole fraction.
The results for the cell center show that OH production begins after - 4 Ixsec of energy transfer collisions and continues for some 15 I~sec. Calcu- lations suggest that the inward expansion wave should require 10 I~sec to travel the 0.5 cm to the center. The H202 decomposition is in the low pres- sure limit, where energy transfer is rate control- ling. The use of Troe's rate constant expression 17 with a mixture collision efficiency 3 times that of At,
H 2 0 2 + M ~ 2 O H + M,k
= 1.7 • 10 -6 exp (-24900/T)cm3sec -1 (I)
1
0 ~ T r T
2
0.8
1000
I | 6 . 8 _
2 1000 T
1
T 0 ~ 0 l l ~ I
I 2
2-
I
/t 13.5 f ooo
L x , . . . . p
I I I 1 2
....1" \ - - -T '~_
p ~ T I0
T
2j 1
0
T
I I I I 1 2
FIG. 3. Results from the code calculations for the cylindrical geometry: p (dashed line) and T (solid line) are plotted as a function of distance (cm) from cell center at 4 selected times corresponding roughly to the arrows in Fig. 2, and denoted at the upper right. Here T4 = 1500 K. Note that p and T inside the heated region are not simply constant through a region, but the long-term values are reasonably steady. Time in Ixsec, temperature in K, density in 10 Is molecules cm -3.
predicts -10% decomposition of the H202 in 20 txsec for initial heating to 1250 K, and little addi- tional OH production after the expansion cooling. The expansion wave leaves the center region mov- ing outwards, and p and T drop to their steady values--roughly 0.3 Pl and 1000 K. The signal level, which is proportional to the OH density di- vided by the decay rate, declines slightly during the expansion. This is because the OH density is proportional to the total density while the decay rate has a small density independent contribution from radiative decay. At T 4 = 1350 K (not shown)
LASER PYROLYSIS/LASER FLUORESCENCE TECHNIQUE 111
18 .~
~ 6
z - 4
z i 160 -0.5 0,5 1.0 1.5
POSiTiON, cm
2
0 0
O O
I I I I I 40 80 120
T~ME, us
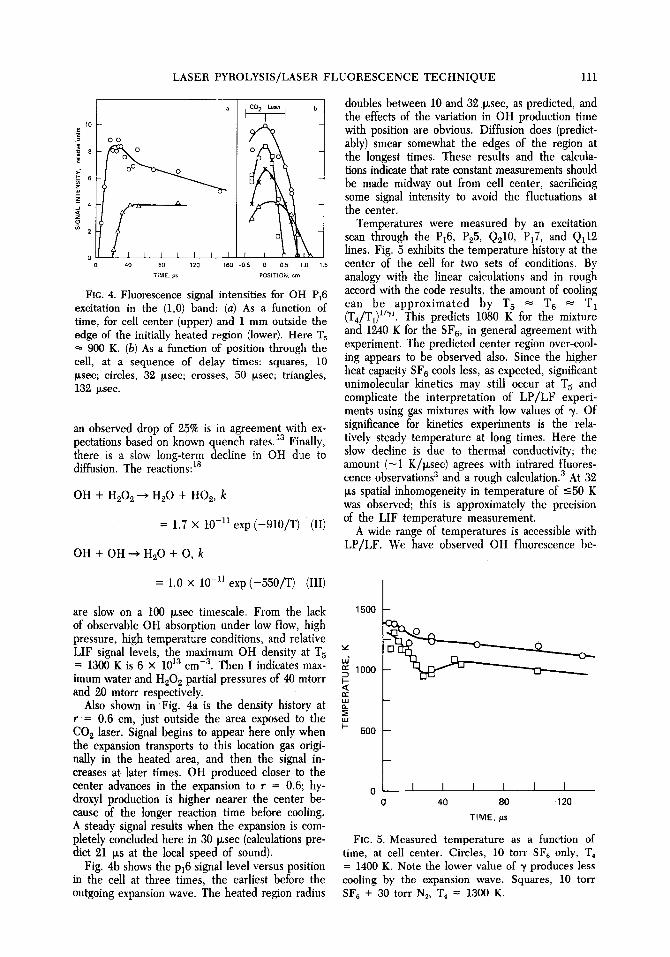
FIG. 4. Fluorescence signal intensities for OH P~6 excitation in the (1,0) band: (a) As a function of time, for cell center (upper) and 1 mm outside the edge of the initially heated region (lower). Here T 5 ~- 900 K. (b) As a function of position through the cell, at a sequence of delay times: squares, 10 I~see; circles, 32 Ixsec; crosses, 50 p~sec; triangles, 132 Ixsec.
an observed drop of 25% is in agreement with ex- pectations based on known quench rates. 1~ Finally, there is a slow long-term decline in OH due to diffusion. The reactions: is
OH + HgOg ~ HgO + HOg, k
= 1.7 x 10 -11 exp (-910/T) (II)
OH + O H ~ HgO + O, k
doubles between 10 and 32 Ixsec, as predicted, and the effects of the variation in OH production time with position are obvious. Diffusion does (predict- ably) smear somewhat the edges of the region at the longest times. These results and the calcula- tions indicate that rate constant measurements should be made midway out from cell center, sacrificing some signal intensity to avoid the fluctuations at the center.
Temperatures were measured by an excitation scan through the P16, Pg5, Qgl0, Px 7, and Ql12 lines. Fig. 5 exhibits the temperature history at the center of the cell for two sets of conditions. By analogy with the linear calculations and in rough accord with the code results, the amount of cooling can be approximated by T 5 = T 6 = T 1 (T4/T1) 1/~. This predicts 1080 K for the mixture and 1240 K for the SF 6, in general agreement with experiment. The predicted center region over-cool- ing appears to be observed also. Since the higher heat capacity SF 6 cools lessi as expected, significant unimolecular kinetics may still occur at T 5 and complicate the interpretation of LP/LF experi- ments using gas mixtures with low values of ~. Of significance for kinetics experiments is the rela- tively steady temperature at long times. Here the slow decline is due to thermal conductivity; the amount ( -1 K/Ixsec) agrees with infrared fluores- cence observations 3 and a rough calculation. 3 At 32 IXS spatial inhomogeneity in temperature of -<50 K was observed; this is approximately the precision of the LIF temperature measurement.
A wide range of temperatures is accessible with LP/LF. We have observed OH fluorescence be-
= 1.0 • 10 -11 exp (-550/T) (III)
are slow on a 100 I~sec timescale. From the lack of observable OH absorption under low flow, high pressure, high temperature conditions, and relative LIF signal levels, the maximum OH density at T 5 = 1300 K is 6 x 10¹³ em -3. Then I indicates max- imum water and HgO z partial pressures of 40 mtorr and 20 mtorr respectively.
Also shown in Fig. 4a is the density history at r = 0.6 cm, just outside the area exposed to the COg laser. Signal begins to appear here only when the expansion transports to this location gas origi- nally in the heated area, and then the signal in- creases at later times. OH produced closer to the center advances in the expansion to r = 0.6; hy- droxyl production is higher nearer the center be- cause of the longer reaction time before cooling. A steady signal results when the expansion is com- pletely concluded here in 30 Ixsec (calculations pre- dict 21 Ixs at the local speed of sound).
Fig. 4b shows the p16 signal level versus position in the cell at three times, the earliest before the outgoing expansion wave. The heated region radius
1500
1000
500
o I I I I I I 0 40 80 120
TIME, tas
FIC. 5. M e a s u r e d t e m p e r a t u r e as a f u n c t i o n o f
time, at cell center. Circles, 10 torr SF~ only, T~ = 1400 K. Note the lower value of ~t produces less cooling by the expansion wave. Squares, 10 torr SF6 + 30 torr N~, "1"4 = 1300 K.

112 REACTION MECHANISMS AND MODELING I
tween measured temperatures (T0) of 750 and 1400 K. Lower values are certainly possible but here not enough OH is produced below 750 to yield a mea- sureable signal. The temperature can be increased by higher CO z laser fluence or more SFo, although the latter has limits since increased absorption is counterbalanced by an increased total heat capac- ity. A final kinetic complication, and temperature- limiting factor, is thermal SF~ decomposition 19 above T 4 = 1750 K (T 0 = 1400 K). Above this temper- ature enough of the SFr decomposes that the F concentration becomes larger than that of OH, complicating the chemistry. Complete decomposi- tion occurs above T 4 = 2000 K.
V. OH + CH 4 Reaction
The OH molecule is important in many aspects of combustion chemistry, and the OH + CH 4 re- action in particular is probably the key elementary step in the oxidation of methane. It has therefore received considerable attention, including one older 2~ and several recent zl-23 direct determinations of its rate at temperatures of interest in combustion. The measured rate constants over the range 300 to 1300 K fit well to Zel lner ' s expression z2'24 k = 10-17'5~l~Z13exp(-1233/T) cm 3 sec-1; this is nearly identical to Tully and Ravishankara's fit to their set of data (300-1000 K) considered alone. 23 The agreement with experiment is discussed in detail in these papers, zz-24 We thus consider this to be a rather well characterized reaction so that the present rate constant results form in large part a test of the LP/LF technique.
Since OH density undergoes a slow decline with time, the kinetic data is therefore reduced in the following way (see Fig. 6). The OH mole fraction X o is first measured as a function of time with no added CH 4. The reactant is then added and in its presence the OH mole fraction X is again mea- sured. The difference
d(lnX) d(lnXo) _ dln(X/Xo) dt dt dt
can be ascribed to the pseudo-first-order reaction rate k[CH4]. The lower part of Fig. 6 shows plots of -ln(X/Xo) vs time for three pressures of CH 4, all at 1030 K; from these are extracted values of k. The CH4 density, proportional to the total den- sity, is relatively constant over the timi~ period of these measurements. Its value is obtained using computed values of the density ratio PJP1 for the temperature measured during the reaction run, ap- proximately PJP1 = TJT1.
The results from the data exhibited in Fig. 6 yield a rate constant of 1.3 --- 0.4 • 10 -12 cm 3 sec -1. This may be compared to a value 2.06 •
1 - -
t~
~ o - - - - - o
o I I t I
:o x
-2
40 60 80 I00
TIME,/as
FIC. 6. Data pertinent to the measurement of the rate constant of the OH + CH4 reaction at "I"5 = 1035 K. Top: signal levels as a function of time, without (upper, Xo) and with (lower, X) CH4 at PI = 0.9 torr. Bottom: a plot of ln(X/Xo) vs time, for PI = 0.9 torr (crosses), 1.1 torr (circles), 1.5 torr (triangles). Each curve is adjusted by addition of a constant to place it neatly on the graph.
10 -12 calculated for 1030 K from Zellner's fit, and a value 2.00 • 10 -12 measured by Tully and Rav- ishankara at 1020 K. The difference can readily be attributed to uncertainties in the CH 4 pressure measurement and the calculation of the density drop after the expansions. Experiments are contin- uing over the entire attainable temperature range; for example, we have measured rate constants (units: 10 -12 cm 3 sec -1) of 4.3 --+ 1.0 at 1400 + 50 K and 1.25 -+ 0.45 at 830 --- 50 K. The error estimates, derived from decay rate and density uncertainties, are 20-40%. The nine determinations to date scat- ter uniformly about values computed with Zellner's expression: average deviation 3%, rms deviation 35%, The temperature dependence of our results yields an apparent activation energy [that is, -Rd(lnk)/d(1/T)] of 4.0 kcal near 1000 K com- pared to a value of 6.9 kcal derived from previous results. 23,24
A systematic study of this and other reactions is planned for the future. The present results none-
LASER PYROLYSIS/LASER FLUORESCENCE TECHNIQUE 113
theless do demonstrate that LP/LF can be used for the measurement of rates of chemical reactions in temperature ranges of importance in combustion.
VI. Conclusions and Projections
The LP/LF method overcomes several limita- tions of other techniques useful in high tempera- ture chemical kinetics. Its duty cycle is much higher than a shock tube, the materials and hot surface complications of flow systems are avoided, and the complex reaction networks present in flames are largely absent. Yet it clearly possesses some limi- tations of its own. Although the upper T 5 attainable approaches the 1/T range of flames, reaching higher values (as in shock tubes) appears problematical. Thermal decomposition of the infrared absorber, SF6, which adds the kinetic complication of F atom reactions, gives an effective upper limit of -1400 K. Care must be taken to avoid gas dynamics com- plications such as reflected shock waves. T can be measured in situ, but we must rely on the code calculation of P plus the measured T to obtain the reactant density; this could, however, be avoided by a direct PN2 measurement using Raman scatter- ing or a direct excited state decay time determi- nation for the OH, Gas composition and pressure conditions must be carefully chosen to avoid radi- cal-radical or radical-precursor reactions, although a wide enough range appears to be available to permit measurement of all but the slowest reac- tions.
Perhaps most important are the measured ran- dom 5% fluctuations, and longer term drift, in COz laser power, and the resulting shot-to-shot temper- ature ( -50 K) and density variations. Computer control and data sorting could improve this, but at present LP/LF appears poorly suited for accurate studies of the temperature dependence of rates of reactions with low activation energy. In addition, during the time period applicable to bimolecular rate measurements in each laser shot, minor 5% variations in density and temperature result from the continued reflections of weak acoustic waves (regions 6, 8, etc.).
Nonetheless, these initial results suggest several prospects for future experiments. Bimolecular, uni- molecular, and recombination reaction rates as well as diffusion and thermal conductivity rates at ele- vated temperatures can be measured for many rad- icals, including atoms detectable with two-photon LIF. z5 The key is finding clean, low activation en- ergy sources for the radicals, although photolysis by a third laser or injection from a discharge flow may be useful in addition to precursor pyrolysis, partic- ularly for measurements at lower temperatures. Energy transfer pathways in the excited state of OH ~6 and other radicals are important in the quan-
titative use of LIF as a flame diagnostic. 2A3 By scanning the monochromator (at higher resolution than used here) their pressure dependence could be measured for a variety of collision partners over a range of temperature. We are currently measur- ing fluorescence quenching rate constants for OH with several collision partners at high tempera- tures, also needed to analyze LIF flame measure- ments. Finally, one might add several radicals and/ or reactant molecules in varying concentrations, and directly study the time evolution of a sequence of reactions at high temperature following an ini- tiating laser pulse. Such a controlled and slowed- down version of the chemistry pertinent to an iso- lated region of a flame should be very useful in testing multi-reaction models of combustion chem- ical networks.
VII. Acknowledgments
We thank David M. Golden for many beneficial discussions, especially during the conception of the LP/LF method, and Lynn Seaman for running the computer calculations. This work was supported by the Division of Chemical Sciences of the Depart- ment of Energy, under Contact NO. DE-AC03- 81ER10906.
REFERENCES
1. D. F, MCMILLEN, K. E. LEWIS, G. E SMITH, AND D. M. GOLDEN, J. Phys. Chem., 86, 709 (1982).
2. D. R. CI~OSLEY, Ed., "Laser Probes of Com- bustion Chemistry," Amer. Chem. Soc. Sym- posium Series, Vol. 134, 1980.
3. G. P. SMITH AND R. M. LAINE, J. Phys. Chem. 85, 1620 (1981).
4. W. M. SHAUn AND S. H. BAUER, Int. J. Chem. Kin. 7, 509 (1975); W. M. SHAUB, Ph.D. The- sis, Cornell University, 1975.
5. K. E. LEWIS, D. F. MCMILLEN, AND D. M. GOLDEN, J. Phys. Chem. 84, 227 (1980),
6. C. STEEL, V. STAROV, R. LEO, P. JOHN, AND R. G. HARRISON, Chem. Phys. Lett. 62, 121 (1979); P. B. COMITA, M. R. BERMAN, C. B, MOORE, AND R. G. BERGMAN, J. Phys. Chem. 85, 3266 (1981).
7. R. A. HILL AND G. A. LAGUNA, Optics Comm. 32, 435 (1980).
8. V. M. DONNELLY, A. P. BARONAVSKI, AND J. R. MCDONALD, Chem. Phys. 43, 283 (1979).
9. L. PASTEar~ACK, A. P. BARONAVSKI, AND J. R. MCDONALD, J. Chem. Phys. 73, 3508 (1980).
10. H. RE1SLER, M. S. MANGm, AND C. WlTrm, J. Chem. Phys. 73, 2280 (1980).
11. D. J. NESBIrr AND S. R. LEONE, J. Chem. Phys. 75, 4949 (1981).
114 REACTION MECHANISMS AND MODELING I
12. C. W. RALEIGH, Hydrogen Peroxide Physical Properties, FMC Technical Bulletin 67, Prince- ton, 1969.
13. D. R. CROSLEY, Opt. Engr. 20, 511 (1981). 14. M. J. PECHERSKY, Laser Focus 17, No. 12, p.
61 (1981). 15. A. H. SHAPIRO, "The Dynamics and Thermo-
dynamics of Compressible Fluid Flow", Ronald Press, New York, 1953; I. I. GLASS, Univ. of Toronto Institute of Aerophysics Review No. 12, Toronto, 1958; E. L. RESLER, S.-C. LIN, AND A. KANTROWITZ, J. Appl. Phys. 23, 1390 (1952).
16. L. SEAMAN, " s a I PUFF 8 Computer Program for One-Dimensional Stress Wave Propaga- tion", Final Report, SRI Project 6802, Menlo Park, CA, August 1978.
17. H. HIIEWSKI AND J. TROE, Helv. Chim. Acta 55, 205 (1972); J. ]'ROE, J. Chem. Phys. 66, 4758 (1977).
18. R. F. HAMPSON, JR., AND D. GABVIN, NBS Spe-
cial Publication 513 (1978); NBS Technical Note 866 (1975).
19. J. L. LYMAN, J. Chem. Phys. 67, 1868 (1977). 20. G. DIXON-LEwis AND A. WILLIAMS, Eleventh
Symposium (International) on Combustion, p. 951 (The Combustion Institute, Pittsburgh, 1967).
21. R. ZELLNER AND W. STEINERT, Int. J. Chem. Kin. 8, 397 (1976).
22. J. ERNST H. GO. WACNER, AND R. ZELLNER, Ber. Bunsen. Phys. Chem. 82, 409 (1978).
23. F. P. TULLY AND A. R. RnVISHANKAaX, J. Phys. Chem. 84, 3126 (1980).
24. R. ZELLNER, J. Phys. Chem. 83, 18 (1979). 25. W. K. BISCHEL, B. E. PERRY, AND D. R. CROS-
LEY, Chem. Phys. Lett. 82, 85 (1981). 26. G. P. SMITH AND D. R. CROSLEY, Eighteenth
Symposium (International) on Combustion, p. 1511 (The Combustion Institute, Pittsburgh, 1981).
COMMENTS
A. R. Ravishankara, Georgia Institute of Tech- nology, USA. I have two questions:
1) You have measured the rotational temperature of OH. But do you know the vibrational temper- ature of the stable reactant you add?
2) In your heating method, the mixture is heated at first to a temperature well above the equilibrium temperature. Therefore, would you not have prob- lems with thermal decomposition of reactants, es- pecially when molecules more complicated than CH4 are used?
This again goes back to question 1. i.e.: has the vibrational temperature relaxed to the rotational and translational temperatures?
I would like to add that your experimental tech- nique seems to be an excellent method to obtain rate constant data in the temperature range of ~800 to 200 K. As you know, this regime needs to be investigated so as to bridge the shock tube and "low" temperature flash photolysis and flow tube data.
Author's Reply. We have no way to get at the temperature of the stable reactant directly. We could measure the OH vibrational temperature, but we haven't yet done so. The main evidence for vi- brational equilibration comes from the previous unimolecular reaction rate studies (Refs. 1 and 3). At the pressures we use we expect vibrational equi- libration to occur on a ~sec time scale whereas we
delay ~30 ~sec before beginning the reaction rate measurements.
Thermal decomposition of other reactants may limit the temperature ranges for some experiments, although the residence time at the higher temper- ature is short, only ~10 p~sec. This will pose a se- vere problem only when the reactant and radical precursor bond energies are similar so that one would only produce enough radical in the midst of some dissociated reactant. The use of a gas mixture with low ~ (such as pure SF6, coupled with lower laser energy to attain the same temperature) can limit the problem, because the expansion cooling is then less and we reach the same final tempera- ture with a lower initial temperature.
K. C. Smyth, National Bureau of Standards, USA. For studying the reactions of OH with other molecules, do the considerations of the position and time to probe the OH concentration differ from your measurements on methane?
Author's Reply. The position and time range for performing the OH kinetics measurements are de- termined by the shock/expansion wave behavior, as described in the paper from both computational and experimental standpoints. This behavior will not change significantly for other hydrocarbons, so long as they are kept at low mole fractions so that

LASER PYROLYSIS/LASER FLUORESCENCE T E C H N I Q U E 115
the heat capacity ratio ~/ is the same. Thus the measurement conditions will remain the same, and we need not reinvestigate the heating dynamics for each case.
laser beam intensity. How sensitive are your cal- culated temperatures and densities to deviations from this beam profile? Also, have you analyzed the CO2 laser beam after it exits from the cell in re- lation to the input beam to measure the profile of the energy absorbed in the cell?
Seiichiro Koda, University of Tokyo, Japan. What is the degree of agreement between the observed OH temperature and the calculated equil ibrium temperature based on laser fluence? Does it always agree well irrespective of laser fluence?
Author's Reply. For the two cases of Fig. 5, the agreement is within the -+50 K precision of the experimental temperature measurements. The com- puter code calculations were only carried out for a few sets of conditions, but interpolation between and extrapolation from them generally shows agree- ment with measured values. We vary the laser flu- ence as well as the SF~ concentration to attain the desired temperature; for example for the runs near 800 K we attenuate the laser.
M. R. Berman, Naval Research Laboratory, USA. In your modeling calculations, it appears that you have used a rectangular profile for the CO2
Author's Reply. We have done no calculations involving non-uniform temperature profiles, which we feel do not exist on the spatial scale of the measurements. The CO2 laser beam itself should be more or less rectangular as we send it through an aperture to cut off the edges (and about half the original energy). Single-shot burn paper spots reveal an even distribution across the 1 cm diam- eter beam through the cell used for heating. The probe laser itself is smaller, ~1 mm diameter. Spa- tial temperature and OH concentration variations, at this resolution, were smooth (within the preci- sion of the data) as a function of position and time, as in Figs. 4 and 5. Those results were averaged over a number of CO2 pulses but reveal neither recurrent hot spots nor large shot-to-shot excur- sions. Recent single-shot measurements of OH in- tensity, taken to obtain quenching rate constants for the AzE § state, confirm the constancy over a sequence of several shots although there exist longer- term (minutes) drifts in the CO2 fluence.