a kink that makes you sick: the incentive effect of sick ...ftp.iza.org/dp8205.pdf · a kink that...
TRANSCRIPT

DI
SC
US
SI
ON
P
AP
ER
S
ER
IE
S
Forschungsinstitut zur Zukunft der ArbeitInstitute for the Study of Labor
A Kink that Makes You Sick:The Incentive Effect of Sick Pay on Absence
IZA DP No. 8205
May 2014
Petri BöckermanOhto KanninenIlpo Suoniemi

A Kink that Makes You Sick: The Incentive Effect of Sick Pay
on Absence
Petri Böckerman Labour Institute for Economic Research
and IZA
Ohto Kanninen Labour Institute for Economic Research
Ilpo Suoniemi
Labour Institute for Economic Research
Discussion Paper No. 8205 May 2014
IZA
P.O. Box 7240 53072 Bonn
Germany
Phone: +49-228-3894-0 Fax: +49-228-3894-180
E-mail: [email protected]
Any opinions expressed here are those of the author(s) and not those of IZA. Research published in this series may include views on policy, but the institute itself takes no institutional policy positions. The IZA research network is committed to the IZA Guiding Principles of Research Integrity. The Institute for the Study of Labor (IZA) in Bonn is a local and virtual international research center and a place of communication between science, politics and business. IZA is an independent nonprofit organization supported by Deutsche Post Foundation. The center is associated with the University of Bonn and offers a stimulating research environment through its international network, workshops and conferences, data service, project support, research visits and doctoral program. IZA engages in (i) original and internationally competitive research in all fields of labor economics, (ii) development of policy concepts, and (iii) dissemination of research results and concepts to the interested public. IZA Discussion Papers often represent preliminary work and are circulated to encourage discussion. Citation of such a paper should account for its provisional character. A revised version may be available directly from the author.

IZA Discussion Paper No. 8205 May 2014
ABSTRACT
A Kink that Makes You Sick: The Incentive Effect of Sick Pay on Absence*
This paper examines the effect of the replacement rule of the Finnish sickness insurance system on the duration of sickness absence. A pre-determined, piecewise linear policy rule in which the replacement rate is determined by past earnings allows identification of the effect using a regression kink design. We find a substantial and robust behavioral response. The statistically significant point estimate of the elasticity of the duration of sickness absence with respect to the replacement rate is on the order of 1.4. JEL Classification: I13, I18, J22 Keywords: sick pay, labor supply, sickness absence, paid sick leave,
regression kink design Corresponding author: Petri Böckerman Labour Institute for Economic Research Pitkänsillanranta 3A 00530 Helsinki Finland E-mail: [email protected]
* We would like to thank the Social Insurance Institution of Finland (KELA) for financial support and access to their data. We are grateful to Olli Kangas and Ulla Hämäläinen and participants in seminars at HECER and the Labour Institute for Economic Research for comments. We are also grateful to Zhuan Pei for his help with the method. The data used in this study are confidential. To obtain access to the data, please contact the Social Insurance Institution of Finland (KELA), FI-00232, Finland. The computer programs to generate the results presented in the paper are available from Ohto Kanninen at the Labour Institute for Economic Research, Helsinki, Finland.

2
1. Introduction
Absenteeism is a cause of substantial loss of working time worldwide. In some OECD
countries nearly 10% of annual working days are lost because of sickness absence (DICE
Database, 2012).1 The costs are considerable for employers, co-workers, and health and
benefit systems. Sickness absence is also a source of major indirect costs, because it
increases the risk of withdrawing from the labor force. The protected individuals are
compensated for their earnings losses by a sickness insurance system. Among cash
benefits, sickness insurance is one of the most important social protection schemes in
Europe (Eurostat, 2011).
The key policy parameter of the sickness insurance system is the replacement rate, i.e.
the ratio of sickness insurance benefits to past earnings. The replacement rate directly
affects workers’ financial incentives to be absent from work. Generous sickness
insurance benefits may entail a moral hazard problem and thus have a negative effect on
labor supply at the intensive margin. An optimal sickness insurance system should
balance the moral hazard due to the reduced incentives of returning to work against the
risk-sharing benefits of more generous payments to the sick.2
In this paper we examine the effect of the replacement rate of the Finnish sickness
insurance on the duration of sickness absence.3 We use Regression Kink Design (RKD,
see Section 3) to identify the causal effect of the replacement rate. Unlike in most other
1 Treble and Barmby (2011) provide an overview. 2 Optimal social insurance policies have recently been surveyed by Chetty and Finkelstein (2012). 3 The European Survey on Working Conditions reveals a large cross-country variation in absenteeism. Given that Finland has the highest share of sickness absenteeism (Gimeno et al. 2004), it is of interest to analyse the determinants of absenteeism there. Sickness absence has also increased significantly in Finland during the past 15 years. The average number of sickness absence days per wage and salary earner was 10 in 2008, according to the Quality of Work Life Survey (Lehto and Sutela, 2009).

3
countries (Frick and Malo, 2008, p. 510-511), the compensation level of sickness
insurance in Finland is not a fixed fraction of past earnings, but it follows a piecewise
linear scheme. This allows us to use RKD, in which the identification of the effect is
based on a pre-determined, nonlinear policy rule (Card et al. 2012). Obtaining reliable
estimates for the effect of the replacement rate is particularly relevant from the policy
perspective, because the replacement rate is a parameter that can be easily manipulated
by policy makers. Our estimates are therefore useful for the design of a more cost-
effective sickness insurance system.
In our empirical analysis we find a substantial and robust behavioral effect. The
statistically significant point estimate of the elasticity of the duration of sickness absence
with respect to the replacement rate is 1.41, with a 95% confidence interval of 0.36 to
2.46.
Previous research has used policy reforms that provide exogenous variation in the
replacement rates to examine the effect of sick pay level on absence. Several studies
exploit legislative changes in the replacement rates and provide difference-in-difference
estimates for Sweden (Henrekson and Persson, 2004; Johansson and Palme, 2005;
Pettersson-Lidbom and Skogman Thoursie, 2013). There is also similar evidence for
other countries (Puhani and Sonderhof, 2010; De Paola et al. 2014; Ziebarth and
Karlsson, 2014; Fevang et al. 2014). In addition to studies that have exploited policy
reforms within countries, there is cross-country evidence on the positive effect of the
replacement rate of sickness insurance on absenteeism (Frick and Malo, 2008).

4
The elasticity of absence with respect to the replacement rate is positive, based on earlier
research. However, the quantitative size of the effect varies substantially from study to
study. Also, the comparison of the estimates is not straightforward, since the outcome
variables (duration of sickness absence or number of sickness absence days) are not
identical in all studies.4 Therefore, there remains substantial uncertainty about the exact
quantitative magnitude of this policy-relevant parameter.
Empirical studies based on policy reforms suffer from a number of caveats. Reforms are
aimed at specific groups, the causal impact takes time to take effect, agents anticipate the
upcoming reform,5 effects are confounded by simultaneous policy changes or other
shocks, etc. Thus, the causal interpretation for the difference-in-difference estimates
obtained using policy reforms is not straightforward (cf. Besley and Case, 2000;
Pettersson-Lidbom and Skogman Thoursie, 2013, p. 487). The method that we exploit
circumvents this problem by using a kink in the benefit rule that applies to all employed
persons.
The paper unfolds as follows. Section 2 provides an overview of the Finnish sickness
insurance system. Section 3 describes RKD. Section 4 introduces the data and the
estimation results are presented in Section 5. The last section concludes.
4 Ziebarth and Karlsson (2014) summarize the existing estimates by noting that the elasticity of sick days with respect to the benefit level is ~0.9. 5 De Paola et al. (2014, p. 349) highlight the fact that employees can adjust their sickness absence behavior in anticipation of the reform.

5
2. The Finnish sickness insurance system
Finland has a universal compulsory sickness insurance scheme that covers all (16-67
years old) permanent residents.6 The scheme guarantees compensation for the loss of
earnings owing to sickness and illness. Sickness allowances and reimbursements are
defined in the Health Insurance Act and Decree. Sickness insurance is financed by both
employers and employees. The state participates by financing the minimum allowance
that is paid to those with no earnings.
The Social Insurance Institution of Finland (KELA) pays out a Sickness Allowance (SA)
as compensation for the loss of earnings caused by an illness or injury.7 The SA includes
two provisions: a minimum sickness benefit and an earnings-related benefit. The
earnings-related benefit is relevant for most of employed and self-employed persons.
Before receiving the SA from KELA, the person must complete a waiting period. It
includes the day of onset of work incapacity and the following nine working days.8 The
incapacity for work must be certified by a doctor. The employee is entitled to normal
salary during the nine-day waiting period if the employment relationship has lasted at
least a month.9
After the nine-day waiting period the employee is eligible to receive an earnings-related
SA from KELA. The maximum period for SA is 300 working days (i.e. approximately a 6 This description of the system is based mainly on Toivonen (2012). Kangas et al. (2013) provide a historical account. Most countries have more fragmented sickness insurance schemes which complicate the analysis (cf. Gruber, 2000). 7 The total amount of SA paid was 834.2 million € in 2011 (KELA, 2013, p. 3). 8 The waiting period includes Saturdays, but not Sundays or public holidays. 9 The employer pays a full salary for at least the first nine days, depending on the collective labor agreement, if the employment has lasted at least a month. If the employment has lasted less than a month, the beneficiary receives 50% of the salary. KELA fully compensates employers for these payments.

6
full calendar year). All SA days within the last two years are counted towards this sum.
After the maximum has been reached, there is an assessment of eligibility for a disability
pension. The person is eligible to receive the SA again only after having worked for at
least a year.
The earnings-related SA has no ceiling. This feature distinguishes the Finnish scheme
from those of the other Nordic countries and most other European sickness insurance
systems. For annual earnings of up to 34,496 euros, the replacement rate was 70% in
2012, after which it gradually decreases.
For our purposes, the most important feature of the system is that the replacement rate of
the earnings-related SA follows a pre-determined, nonlinear policy rule. First, the SA is
determined by past taxable annual earnings. The relevant earnings are those earned two
calendar years before the claim for sickness insurance is made. For example, in 2012, the
SA was calculated on the basis of taxable earnings in 2010.10 Work-related expenses are
deducted from taxable earnings, and in addition a deduction is made to account for
pension and unemployment insurance contributions.
The fact that the SA is determined by past earnings is particularly useful for our
purposes, because applicants are arguably able to manipulate their current earnings. This
would invalidate the identification of the causal effect using RKD. But this is highly
unlikely regarding past earnings. Reassuringly, we are also able to check whether there is
any bunching of the data points towards the kinks in the benefit rule.
10 The amount of taxable earnings is based on the decision by the Finnish Tax Administration. An index is used to account for the rise in wage and salary earners’ earnings (80 percent weight) and the cost of living index (20 percent weight).

7
The second important feature of the system is that the replacement level follows a
piecewise linear policy rule in past earnings.11 The determination of SA for 2012 is
illustrated in Figure 1. There are four earnings brackets. The benefit formula for the
earnings-related SA exhibits one discontinuity and two kink points, which we define as
the lower and the upper kink point. The lower kink point allows one to use RKD to
identify the causal effect of the replacement rate. The discontinuity point cannot be
exploited, since the replacement rate of those who are below the threshold depends on the
length of the sickness absence.
Figure 1 here
3. Regression Kink Design
Card et al. (2012) propose a variant of the Regression Discontinuity Design (RDD)
which they call RKD.12 Their method uses a kink or kinks in a policy rule to identify the
causal effect of the policy rule on the outcome variable of interest. A valid RKD setting
requires the explanatory variable (in our case, the replacement level) to be a deterministic
and known function of an assignment variable (in our case, earnings from two years
prior). The function also has to have at least one kink point. This means that the function
has segments where it is (continuous and) differentiable, but in at least one point it is
non-differentiable having unequal left and right derivatives (Condition 1). The second
condition for a valid RKD setting is that the assignment variable allocates the
observations to the left and right segments of a kink point in a manner that is as good as
11 These kinks to the system were created in the early 1980s (see Kangas 2013, p. 283). 12 Card et al. (2012) apply their method to answer the question whether the level of unemployment benefits affects the length of unemployment in Austria.

8
random (Condition 2). Endogenous bunching of observations near kink points would
invalidate this smoothness condition.
In our setup, Condition 1 holds, since we know exactly how earnings from two years
prior determine the replacement level. We also have data on the relevant earnings and the
replacement level. Also, as Figure 1 shows, the relationship between the assignment
variable and the policy variable for the year 2012 is continuous for earnings above 1325
euros and has kinks at 34,496 and 53,072 euros. Other years in our data show a similar
pattern.
The random assignment of observations (Condition 2) is not directly verifiable in
empirical applications. But it seems plausible to expect that individuals would not
manipulate the benefit level by altering their earnings in order to be assigned to another
segment of the replacement function two years later. We can also ascertain that other
benefit rules, such as the earnings-related unemployment benefit, do not have kinks or
discontinuities at the same points as the sickness benefit and thus they do not affect the
randomness of the assignment. Furthermore, we can test for whether the distribution of
the control variables is smooth in relation to the kink point. If we find this not to be the
case, Condition 2 fails, which invalidates the design. This procedure is very similar to
what is usually done to validate RDD (for a review, see Imbens and Lemieux, 2008).
For a formal presentation of the model, let Si be sickness days in the year t, for individual
i∈{1,2,…,n}, Yi is earnings in the year t-2 and Bi is the sickness allowance, which follows
the deterministic assignment function 𝐵𝑖 = 𝑏(𝑌𝑖) with a kink at 𝑌𝑖 = 𝑦𝑘.The parameter of
interest is the change in the slope of the conditional expectation function 𝑚(𝑦) =

9
𝐸[𝑆𝑖|𝑌𝑖 = 𝑦], at 𝑦𝑘 divided by the change in the slope of the deterministic assignment
function 𝑏(𝑦) at 𝑦 = 𝑦𝑘 . With no loss of generality, the model of interest is assumed to
have a local representation in a small neighborhood of 𝑦 = 𝑦𝑘:
𝑆𝑖 = 𝜏𝑏(𝑦) + 𝑔(𝑦) + 𝜀𝑖,
where 𝑔 is a fixed function and 𝜀𝑖 is an error term.
Nielsen et al. (2010) show that 𝜏, the treatment effect on those assigned on the right
segment of the kink point, is identified around 𝑦𝑘. The identification requires that 𝑔(∙)
and 𝐸(𝜀𝑖|𝑌𝑖 = 𝑦𝑘) are smooth functions and Si has a kink at 𝑦𝑘, then
𝜏 =
𝐷+𝑚(𝑦𝑘) − 𝐷−𝑚(𝑦𝑘)𝐷+𝑏(𝑦𝑘) − 𝐷−𝑏(𝑦𝑘)
,
(1)
where 𝐷𝑗𝑚(𝑦𝑘) = lim𝑦→𝑦𝑘
𝑗
𝜕𝑚𝑖(𝑦)𝜕𝑦
,𝐷𝑗𝑏(𝑦𝑘) = lim𝑦→𝑦𝑘
𝑗
𝜕𝑏𝑖(𝑦)𝜕𝑦
, 𝑗 ∈{+,-}. Thus, 𝜏 is the change in
the slope of 𝐸(𝑆𝑖|𝑌𝑖 = 𝑦) divided by the change in the slope of the assignment function
𝑏(𝑦) at the kink point (𝑦 = 𝑦𝑘).
The numerator in equation (1) is estimated parametrically as 𝛽1 using the following local
power series expansion:
𝐸(𝑆𝑖|𝑌𝑖 = 𝑦) = 𝛼0 + �[𝛼𝑝(𝑦 − 𝑦𝑘)𝑝 + 𝛽𝑝𝐷𝑖(𝑦 − 𝑦𝑘)𝑝]
𝑃
𝑝=1
, (2)
where P is the chosen polynomial order of the estimated function and 𝐷𝑖 is the treatment
status, where 1 means treated and 0 means not treated (𝐷𝑖(𝑧) = 1, 𝑖𝑓 𝑧 > 0,𝐷𝑖(𝑧) =
0 otherwise). Note that |𝑦 − 𝑦𝑘| ≤ ℎ, where h is the bandwidth chosen for the
estimation.

10
The bandwidth selection is a trade-off between bias and precision. We follow Card et al.
(2012, pp. 32–33) and use the “rule-of-thumb” bandwidth, based on Fan and Gijbels
(1996, equation 3.20, p. 67):
ℎ = 𝐶𝑝 �𝜎�2(0)
[𝑚� (𝑝+1)(0)]2𝑓(0)�
12𝑝+3
𝑛−1
2𝑝+3,
where p is the order of the polynomial in the main specification, 𝜎�2(0) and 𝑚� (𝑝+1)(0)
are, respectively, the estimated error variance and (p+1)th order derivative of the
regression, using a wide-bandwidth polynomial regression of equation (2),13 C1 is 2.352
for the boundary case with a uniform kernel and 𝑓(0) is estimated from a global
polynomial fit to the histogram of earnings. We use the Akaike Information Criterion
(AIC)14 for model selection and report the results for multiple bandwidths in sensitivity
analysis.
The denominator in equation (1) is the change of the slope of the deterministic 𝐵(𝑦) at
the kink point. The treatment effect that we estimate is the average treatment effect on
the treated, 𝐸[𝑆1𝑖 − 𝑆0𝑖|𝐷𝑖 = 1]. In other words, it is the effect of the change in the
policy function at the kink point on those who are just above the kink point.
Card et al. (2012, pp. 10–12) distinguish between sharp and fuzzy RKD. A fuzzy design
arises when there is a significant difference between the theoretical and observed value of
the kink in the policy rule. The difference stems from e.g. measurement errors or the fact
that the kink in the policy rule is affected by some unobserved variables in addition to the
13 We use the data for a very wide window of 0.8 log earnings for this regression, which contains 85% of the total sample. This is done in order to keep the polynomial order within reasonable limits. The polynomial order is chosen to minimize Akaike Information Criterion. Also, the polynomial in this context
is allowed to be nonlinear only in the pth order. This is necessary in order for 𝑚�(𝑝+1)(0) to exist. 14 𝐴𝐼𝐶 = −𝑁𝑙𝑛(𝜎�2) + 2𝑝, where 𝜎�2 is the mean squared error, N is the sample size and p is the number of parameters.

11
primary assignment variable. In our setting, a likely source of error is the manner in
which variables are defined and classified in the original dataset (see Section 4 and
Figure A1).
For estimation of the expected change of the policy rule, we use a local regression as
above:
𝐸(𝐵𝑖|𝑌𝑖 = 𝑦) = 𝛿0 + �[𝛿𝑝(𝑦 − 𝑦𝑘)𝑝 + 𝛾𝑝𝐷𝑖(𝑦 − 𝑦𝑘)𝑝]
𝑃
𝑝=1
, (3)
where γ1 is the empirical counterpart of the policy rule. The elasticity of interest is
𝜏 = 𝛽1𝛾1
. To obtain the correct standard errors for τ, we use instrumental variable (IV)
regression, following Card et al. (2012, pp. 20–21). The instrument is the interaction term
of past earnings and an indicator of earnings above the lower kink point, 𝐷𝑖(𝑦 − 𝑦𝑘). The
instrumented variable is 𝐵𝑖, the received compensation.
4. Data
We use total data on Finnish sickness absence spells over the period 2004–2012. This
comprehensive register-based data originate from KELA and they are derived from the
database that is used to pay out the SA compensations. Therefore, some measurement
error might arise from the aggregation of variables when converting the original register
for research purposes.15 The administrative data cover both wage and salary earners and
self-employed persons. The data include the start and end dates for all sickness spells and
15 In particular, consecutive absence spells that start within 300 days are counted as a single spell if the diagnosis remains the same.

12
the total amount of SA paid for each person. Annual earnings are deflated to 2012 prices
by using the consumer price index.
Our data consist of absence spells that last for longer than the waiting period of nine full
working days. The distribution is right-skewed.16 Thus, longer sickness absences
contribute disproportionately to the total days lost and absence costs. The data enable us
to concentrate on those absences that are affected by the incentives of the sickness
insurance system.
The data record a person’s past taxable earnings that KELA obtains directly from the
Finnish tax authorities. KELA uses the same information to calculate the SA for
beneficiaries. The data also include useful background information such as a medical
diagnosis for the reason for sick leave, which can be used to test for validity of the RKD.
The initial diagnosis of individuals is documented according to the International
Classification of Diseases (ICD-10).17 We have also linked to the data the highest
completed education from the Register of Completed Education and Degrees, maintained
by Statistics Finland.
The estimations are restricted to those in the labor force who are eligible for sick pay and
who are between 16 and 70 years of age. The final sample used in the analysis includes
compensated absence spells which are above zero in duration and whose payment criteria
and initial diagnoses are known for employees with a single employer during their
16 The skewness of the distribution is 2.5 and 2.9 for the total sample and for the window of 0.0796 log earnings around the lower kink point, respectively. 17 ICD is the standard diagnostic tool for epidemiology, health management and clinical purposes. The classification is available at: http://www.who.int/classifications/icd/en/

13
sickness spell.18 The final sample around the lower kink point consists of 37,000–41,000
individuals, depending on the year. Descriptive statistics is reported in Table 1 (duration
of sickness absence and background characteristics for persons).19
Table 1 here
Figure 2 reveals that persons with low earnings have a longer duration of sickness
absence. This observation is consistent with the hypothesis that people with poorer health
have lower earnings, assuming that the duration of sickness absence is a valid proxy for
health.
Figure 2 also suggests that there are incentive effects present around the lower kink point.
We exploit the lower kink point to identify and estimate the effect of the replacement rule
for two reasons. First, the lower kink point is located in the part of the earnings
distribution which contains substantial mass to support the estimation of statistically
significant effects (Figure 3). The large sample size around this kink point shows as
smaller variability in the length of the sickness absence within the 200 euros bins.
Second, there is a large change in the benefit rule at the lower kink point (cf. Figure 1).20
Figures 2-3 here
18 A part-time sickness benefit was introduced in Finland at the beginning of 2007. We exclude its recipients from the sample. Only 0.5% of the sample has no known diagnosis. Also, the 146 observations with missing received compensation were excluded. We are able to identify entrepreneurs from 2006 onwards. We exclude the 2.3% of the original sample that entrepreneurs represent. In total, we exclude c. 3.0% of the original data to construct the final sample. 19 Table 1 shows a very low minimum value for sickness insurance compensation in euros. This is probably due to the fact that a small proportion of the insured are compensated according to an eligibility criterion other than prior earnings. Our results are robust to their exclusion from the sample. 20 The estimated effects are insignificant at the upper kink point and thus omitted (cf. Figure A4). The point of discontinuity at a very low level of earnings is of no use for our purposes, due to the small number of individuals at this part of the distribution. Also, the replacement rate of those individuals who are below the threshold is tied to the length of their sickness absence.

14
5. Results
Figure 4 shows the duration of sickness absence and annual earnings around the lower
kink point.21 The regression results are compiled in Table 2. The choice of bandwidth is a
compromise between precision and bias. The main specification uses the “rule-of-thumb”
bandwidth h, estimated to be c. 0.0796 log euros (see Fan and Gijbels, 1996, p. 67),
which fulfils two criteria. First, covariates are linear, whereas they show nonlinearity at
wider bandwidths (see Table A1) than 0.0796 log euros. Second, estimates are
sufficiently precise, whereas a narrower band would increase standard errors.
Precision in regression analysis increases with sample size and variance in the
explanatory variable. Both of these decrease as the bandwidth narrows. Note that the
bandwidth in our main specification is quite narrow in terms of monthly earnings (~460
euros in 2012).
Figure 4 and Table 2 here
Using a bandwidth of 0.0796 log euros for annual earnings, we find clear evidence for
the incentive effects. The estimated change of the slope at the lower kink point is -0.56.
The corresponding elasticity of the duration of sickness absence (𝜏) with respect to the
replacement rate is 1.41. The point estimate implies a high elasticity, but the estimator
also has a large confidence interval [0.36, 2.46]. The wider the bandwidth used, the lower
the point estimates get. This stems at least partly from the fact that a wider bandwidth
brings in more non-randomly assigned observations.
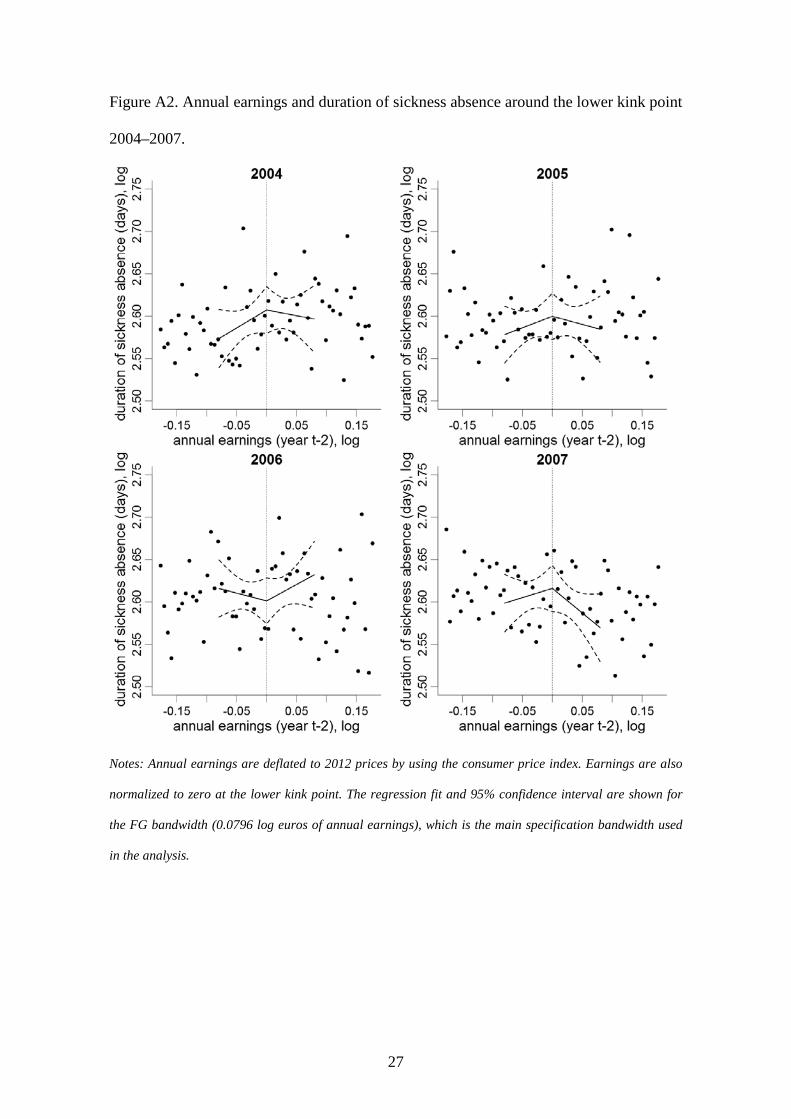
21 See Figures A2 and A3 for annual graphs.

15
The response we observe is affected by both the employer and employee incentives (cf.
Footnote 9). Using the duration of the benefit period paid out to the employer as the
response variable, the estimated response is well within the confidence interval of our
main specification. Employer incentives are aligned with those of the employees and also
appear to matter.
We confirm the result from the main specification using different sets of controls (see
Table 3). The results show a reassuring degree of robustness. Controlling for individual
characteristics and the initial diagnosis at the one-letter level (21 different values) gives
the same point estimate as the regression with no controls. Using an even more detailed
classification of diagnoses (205 different values) renders the point estimate insignificant
at the 5% level. The results are significant at the 5% level when the model is estimated
with the dependent variable in levels instead of in logarithms.22 The adjusted R2 of the
model increases from 0.0003 to 0.14 once all the controls are included.
Table 3 here
The slope below the kink point, however, ceases to be significant when controls are
included. This would imply that the positive slope found without controls appears to be
due to earnings-correlated systematic heterogeneity in the sample, which disappears once
the controls are included.
One of the best known stylized facts of the literature is that the prevalence of sickness
absence is much higher for women (Holmlund, 2004). The earlier literature has also
22 We also ran the regressions using both earnings and sickness duration in levels. The result regarding elasticity is virtually identical.

16
shown that the elasticity of the sickness absence days with respect to the replacement rate
may differ for women vs. men (cf. Johansson and Palme, 2005). Therefore, we run
separate regressions by sex, finding a significant estimate for males and an insignificant
one for females.23
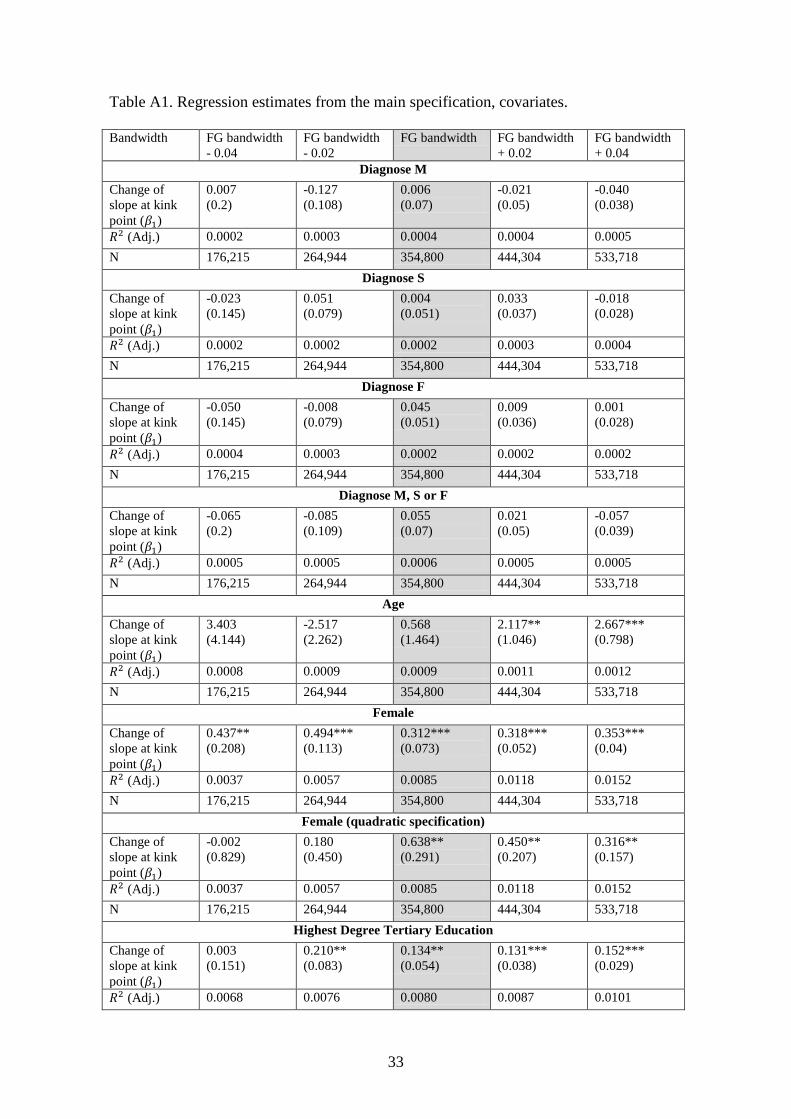
To detect whether there might be any bias induced by the size of the bandwidth or
possible non-randomness in the assignment, it is necessary to check for the linearity of
covariates at the kink point. The covariates are all linear, with the exception of the female
indicator (Table A1, Figure A5 and A6). The fact that the three most common one-letter
level diagnoses are linear is particularly important, since the diagnoses are directly linked
to the duration of sickness absence. This is evident in the R2 of the estimated regressions
with and without diagnoses (Table 3).
We also test and find no evidence of bunching (i.e. no jump) in the histogram of log
earnings around the lower kink point (see Figure A7 and Figure A8). This is done by
fitting a polynomial on 1200 bins in a window of 0.3 log earnings. Similarly, we find no
discontinuity in the derivative of the density around the lower kink point.24 Neither is
bunching found if the densities for males or females are considered separately. Therefore,
we consider that the nonlinearity of the female indicator at the kink point is of minor
concern for a causal interpretation of our response estimate.
Lastly, to check whether the result is a spurious one, we run 101 placebo regressions,
where the lower kink point is assumed to be off the correct location by -0.5 to 0.5 of log
23 Johansson and Palme (2005, p. 1886) also find that the incentive effect of sickness insurance is much stronger for males than for females. 24 We regress the density on the bin midpoints with a polynomial order of 10 allowing for a kink and a discontinuity in the first derivative, respectively. The polynomial order is determined by AIC.

17
earnings at intervals of 0.01 log earnings (see Figure A9). We use the same FG
bandwidth of the true (lower) kink point for all these regressions. Of the 94 regressions
not around the true kink point, ~7 (7.4%) show a significant estimated effect. Therefore,
one would not be likely to observe any apparent behavioral response with this
methodology without a genuine change in the policy rule.
The impact of a 5% increase in the replacement level for the year 2012 is a 0.06%
[0.02%, 0.11%] reduction in GDP. For this illustration, we approximate productivity per
working day by dividing annual earnings (in 2010) by 300 and adding 60% to account
for indirect labor costs. The crucial (and strong) assumption is that the estimated
elasticity is constant at 1.41 [0.36, 2.46] throughout the distributions of earnings and
sickness absence duration. We also assume that an increase of 5% is small enough for the
constancy of the elasticity.
6. Conclusions
Using total data on absence spells with a large sample size, we find a considerable
incentive effect of the sickness benefit rule at the intensive margin in a quasi-
experimental research setting. The point estimate of the elasticity of the duration of
sickness absence with respect to the replacement rate is 1.41 with a 95 percent
confidence interval from 0.36 to 2.46.
A large number of observations guarantee the robustness of our results even controlling
for sickness diagnoses. Exogeneity is ensured by the fact that the sickness benefit is

18
determined by earnings two years prior. A battery of linearity checks were run on a
number of variables which might influence our results at the kink point.
Our main contribution is to exploit a research design that delivers a result with strong
internal validity. However, the applicability of the results on the whole population is
debatable. But, since the estimates are obtained at the earnings level close to the median
earnings (within 1% in 2012), the response is likely to be similar for a large proportion of
the population. Previous literature has analysed reforms, which are usually targeted at a
subset of the population. The behavioral responses of the subset of the population might
differ from that of the total population, which reduces the external validity of these
research findings.
Our research provides a pioneering application of the regression kink design. The
research design builds on exogenous variation that can be exploited for coherent causal
inference in a manner that the regression discontinuity design rarely offers, since in our
case the eligible persons have significantly weaker incentives to optimize their behavior
with respect to the policy rule. However, to obtain statistically significant results, one has
to ensure sufficient sample sizes, since the changes in the policy rule and the responses
tend to be noisy and are affected by sample heterogeneity.
The result we find might prove to be interesting for policy makers who aim to improve
the cost effectiveness of the compulsory sickness insurance. Although the behavioral
effect is only observed around the kink point, one would expect the benefit system to
have strong behavioral effects elsewhere along the benefit rule as well.

19
Figure 1. Relationship between prior annual earnings and daily sickness allowance in
euros.
Notes: The vertical dashed lines represent the discontinuity point at 1325 euros and the lower and upper
kink points at 34,496 and 53,072 euros in 2012.

20
Table 1. Descriptive statistics.
Panel A: Total sample Panel B: Sample around the lower kink point
Mean SD Min Max Mean SD Min Max
Duration of sickness absence (days) 43.76 70.73 1 575 36.36 60.94 1 454
Duration of sickness absence (log-days) 2.76 1.47 0 6 2.62 1.42 0 6.12
Earnings 26364.68 16119.64 0 6120738 33120.44 1923.67 29095 37897
Log earnings 10.07 0.67 -3.00 15.63 10.41 0.06 10.28 10.54
Age 45.13 11.35 16 70 46.53 10.01 17 69
Female 0.59 0.49 0 1 0.48 0.5 0 1
Tertiary level education 0.14 0.34 0 1 0.16 0.36 0 1
Helsinki Metropolitan Area 0.17 0.37 0 1 0.19 0.39 0 1
Sickness allowance per day (euros) 54.3 23.19 0.01 4600.56 69.16 8.26 0.02 136.21
Panel C: Sample size by year
Year 2004 2005 2006 2007 2008 2009 2010 2011 2012 Total
Total sample 344,590 352,446 346,747 341,527 339,949 317,618 309,893 309,333 313,101 2,975,204
Sample around the lower kink point
39,887 41,275 41,380 40,617 40,693 38,368 37,875 37,068 37,652 354,815
Note: The sample around the lower kink point is defined within the FG bandwidth (0.0796 log euros of
annual earnings). The very low minimum value for sickness allowance is probably caused by the small
proportion of the insured that get compensated according to eligibility criteria other than prior earnings.
The diagnoses M, S and F represent respectively 34, 13 and 16 percent of the whole sample and 36, 14 and
14 percent of the sample around the threshold. Diagnosis M in ICD-10 refers to diseases of the
musculoskeletal system and connective tissue. Diagnosis S refers to injury, poisoning and certain other
consequences of external causes. Diagnosis F refers to mental and behavioral disorders.

21
Figure 2. Duration of sickness absence in 2012 and annual earnings.
Notes: The vertical dashed lines represent the discontinuity point at 1325 euros and the kink points at
34,496 and 53,072 euros in 2012. The dots represent the mean duration of sickness absence in bins of 200
euros. One bin between each discontinuity and the kink point has been extended such that the discontinuity
and the kink points are located at the bin cut-off points.

22
Figure 3. Kernel density estimate of the earnings distribution.
Notes: The vertical dashed lines represent the discontinuity point at 1325 euros and the kink points at
34,496 and 53,072 euros in 2012. The kernel is Gaussian and the bandwidth is set at 467 euros.

23
Figure 4. Duration of sickness absence and annual earnings 2002–2012 around the lower
kink point.
Notes: Annual earnings are deflated to 2012 prices by using the consumer price index. Earnings are in
logs and normalized to zero at the lower kink point. The dots represent the mean duration of sickness
absence in bins of 0.006 log euros. The regression fit and 95% confidence interval are shown for the FG
bandwidth (0.0796 log euros of annual earnings), which is the main specification bandwidth used in the
analysis (cf. Table 2).

24
Table 2. Regression estimates from the main specification.
Panel A: Dependent variable: duration of sickness absence (days)
Bandwidth
FG bandwidth - 0.04
FG bandwidth - 0.02
FG bandwidth FG bandwidth + 0.02
FG bandwidth + 0.04
Change of slope at kink point (𝛽1)
-0.129 (0.593)
-0.908*** (0.321)
-0.556*** (0.208)
-0.402*** (0.149)
-0.286*** (0.114)
Slope below kink point (𝛼1)
0.236 (0.325)
0.451*** (0.174)
0.240** (0.112)
0.238*** (0.079)
0.149*** (0.060)
Yearly fixed effects
Y Y Y Y Y
Polynomial order 1 1 1 1 1
𝑅2 (Adj.) 0.0003 0.0003 0.0003 0.0003 0.0002
N 176,215 264,944 354,800 444,304 533,718 Panel B: Elasticity of the duration of sickness absence with respect to replacement rate
Change in the replacement rate (𝛾1)
-0.346*** (0.061)
-0.377*** (0.033)
-0.394*** (0.021)
-0.390*** (0.015)
-0.402*** (0.012)
Elasticity (𝜏 = 𝛽1
𝛾1)
2.409
1.411
1.031
0.712
Panel C: Instrumental variable estimation of the elasticity of the duration of sickness absence with respect to
replacement rate
Estimated elasticity (𝜏)
0.373 (1.72)
2.408*** (0.886)
1.411*** (0.536)
1.033*** (0.386)
0.712** (0.285)
N 176,215 264,944 354,800 444,304 533,718
Notes: Heteroskedasticity-robust standard errors are reported in parentheses. Statistical significance: *
p<0.1; ** p<0.05; *** p<0.01. The estimated model is equation (2). The parameter p, which defines the
polynomial order, is chosen using the Akaike Information Criterion (AIC). The preferred polynomial order
is 1. The FG bandwidth referring to the “rule-of-thumb” bandwidth described in Fan and Gijbels (1996) is
estimated to be c. 0.0796. The 95% confidence interval for the IV estimated elasticity with a point estimate
of 1.41 is [0.36, 2.46]. The instrument is the interaction term of past earnings and an indicator of earnings
above the lower kink point. The F-statistic for a test of the hypothesis that the coefficient of the instrument
is zero in a regression of the received compensation on the instrument is considerably higher (346) than
the conventional threshold of 10 for a weak instrument. To obtain the F-statistic, we use the residualized
values, i.e. the residuals from a regression on the control variables, which are the yearly fixed effects and
past earnings.

25
Table 3. Regression estimates from the main specification, with controls.
Panel A: Dependent variable: duration of sickness absence (days)
Log-duration Duration in levels
Total sample Females only
Males only
Total sample
Change of slope at kink point (𝛽1)
-0.556*** (0.208)
-0.516** (0.206)
-0.502** (0.201)
-0.473** (0.199)
-0.302 (0.192)
-0.110 (0.293)
-0.779*** (0.294)
-19.626** (8.334)
Slope below kink point (𝛼1) 0.240** (0.112)
0.055 (0.111)
0.208* (0.108)
0.034 (0.107)
-0.051 (0.104)
0.077 (0.153)
0.059 (0.162)
-2.372 (4.496)
Yearly fixed effects Y Y Y Y Y Y Y Y
Individual characteristics Y Y Y Y
Initial diagnosis (at one-letter level)
Y Y
Initial diagnosis (at one-letter-one-number level)
Y Y
Polynomial order 1 1 1 1 1 1 1 1
𝑅2 (Adj.) 0.0003 0.0134 0.0661 0.0781 0.143 0.0001 0.0011 0.1249
N 354,800 354,800 354,800 354,800 354,800 170,869
183,931
354,800
Panel B: Instrumental variable estimation of the elasticity of the duration of sickness absence with respect to replacement rate
Estimated elasticity (τ) 1.411*** (0.536)
1.314** (0.533)
1.274** (0.517)
1.206** (0.516)
0.765 (0.491)
0.271 (0.724)
2.032** (0.79)
1.368** (0.589)
N 354,800 354,800 354,800 354,800 354,800 170,869 183,931 354,800
Notes: Heteroskedasticity-robust standard errors are reported in parentheses. Statistical significance: *
p<0.1; ** p<0.05; *** p<0.01. The estimated model is equation (2). The parameter p, which defines the
polynomial order, is chosen using the Akaike Information Criterion (AIC). The preferred polynomial order
in all regressions is 1. Individual characteristics are age, sex, the Helsinki Metropolitan Area indicator
and tertiary education indicator. Initial diagnosis is denoted at the one-letter and one-letter-one-number
level, following the International Statistical Classification of Diseases and Related Health Problems 10th
Revision (ICD-10). The data have 21 and 205 different values for this variable, respectively. The FG
bandwidth referring to the “rule-of-thumb” bandwidth described in Fan and Gijbels (1996) is estimated to
be c. 0.0796. The instrument is the interaction term of past earnings and an indicator of earnings above the
lower kink point. The lowest F-statistic for a test of the hypothesis that the coefficient of the instrument is
zero in a regression of the received compensation on the instrument is 344 in the second column regression
with individual characteristics as the control variables. Of the two regressions with a lower sample size the
lower F-statistic is 166 in the male population regression (cf. notes in Table 2).

26
Figure A1. Annual earnings and compensation level around the lower kink point in 2012.
Notes: Earnings are in logs and normalized to zero at the lower kink point. The large dots represent the
mean log compensation level in bins of 0.006 log euros. Each small dot represents one observation. The
vertical axis has been cut at 4.5 for clarity. The regression fit and 95% confidence interval are shown for
the FG bandwidth (0.0796 log euros of annual earnings), which is the main specification bandwidth used
in the analysis. The double line that starts right below the threshold stems from the fact that some of the
benefits in 2012 data follow 2011 replacement rates. This is one source of fuzziness in the data.
27
Figure A2. Annual earnings and duration of sickness absence around the lower kink point
2004–2007.
Notes: Annual earnings are deflated to 2012 prices by using the consumer price index. Earnings are also
normalized to zero at the lower kink point. The regression fit and 95% confidence interval are shown for
the FG bandwidth (0.0796 log euros of annual earnings), which is the main specification bandwidth used
in the analysis.

28
Figure A3. Annual earnings and duration of sickness absence around the lower kink point
2008–2012.

29
Notes: Annual earnings are deflated to 2012 prices by using the consumer price index. Earnings are also
normalized to zero at the lower kink point. The regression fit and 95% confidence interval are shown for
the FG bandwidth (0.0796 log euros of annual earnings), which is the main specification bandwidth used
in the analysis.

30
Figure A4. Duration of sickness absence and annual earnings 2002–2012 at the upper
kink point.
Notes: Annual earnings are deflated to 2012 prices by using the consumer price index. Earnings are in
logs and normalized to zero at the upper kink point. The regression fit and 95% confidence interval are
shown for the FG bandwidth (0.0796 log euros of annual earnings), which is the main specification
bandwidth used in the analysis.

31
Figure A5. Linearity of covariates: first diagnoses.
Notes: Annual earnings are deflated to 2012 prices by using the consumer price index. Earnings are in
logs and normalized to zero at the lower kink point. The regression fit and 95% confidence interval are
shown for the FG bandwidth (0.0796 log euros of annual earnings), which is the main specification
bandwidth used in the analysis. Diagnosis M in ICD-10 refers to diseases of the musculoskeletal system
and connective tissue. Diagnosis S refers to injury, poisoning and certain other consequences of external
causes. Diagnosis F refers to mental and behavioral disorders.

32
Figure A6. Linearity of covariates: age, sex (female indicator), having tertiary education
and living in the Helsinki Metropolitan Area.
Notes: Annual earnings are deflated to 2012 prices by using the consumer price index. Earnings are in
logs and normalized to zero at the lower kink point. The regression fit and 95% confidence interval are
shown for the FG bandwidth (0.0796 log euros of annual earnings), which is the main specification
bandwidth used in the analysis.
33
Table A1. Regression estimates from the main specification, covariates.
Bandwidth FG bandwidth - 0.04
FG bandwidth - 0.02
FG bandwidth FG bandwidth + 0.02
FG bandwidth + 0.04
Diagnose M Change of slope at kink point (𝛽1)
0.007 (0.2)
-0.127 (0.108)
0.006 (0.07)
-0.021 (0.05)
-0.040 (0.038)
𝑅2 (Adj.) 0.0002 0.0003 0.0004 0.0004 0.0005 N 176,215 264,944 354,800 444,304 533,718
Diagnose S Change of slope at kink point (𝛽1)
-0.023 (0.145)
0.051 (0.079)
0.004 (0.051)
0.033 (0.037)
-0.018 (0.028)
𝑅2 (Adj.) 0.0002 0.0002 0.0002 0.0003 0.0004 N 176,215 264,944 354,800 444,304 533,718
Diagnose F Change of slope at kink point (𝛽1)
-0.050 (0.145)
-0.008 (0.079)
0.045 (0.051)
0.009 (0.036)
0.001 (0.028)
𝑅2 (Adj.) 0.0004 0.0003 0.0002 0.0002 0.0002 N 176,215 264,944 354,800 444,304 533,718
Diagnose M, S or F Change of slope at kink point (𝛽1)
-0.065 (0.2)
-0.085 (0.109)
0.055 (0.07)
0.021 (0.05)
-0.057 (0.039)
𝑅2 (Adj.) 0.0005 0.0005 0.0006 0.0005 0.0005 N 176,215 264,944 354,800 444,304 533,718
Age Change of slope at kink point (𝛽1)
3.403 (4.144)
-2.517 (2.262)
0.568 (1.464)
2.117** (1.046)
2.667*** (0.798)
𝑅2 (Adj.) 0.0008 0.0009 0.0009 0.0011 0.0012 N 176,215 264,944 354,800 444,304 533,718
Female Change of slope at kink point (𝛽1)
0.437** (0.208)
0.494*** (0.113)
0.312*** (0.073)
0.318*** (0.052)
0.353*** (0.04)
𝑅2 (Adj.) 0.0037 0.0057 0.0085 0.0118 0.0152 N 176,215 264,944 354,800 444,304 533,718
Female (quadratic specification) Change of slope at kink point (𝛽1)
-0.002 (0.829)
0.180 (0.450)
0.638** (0.291)
0.450** (0.207)
0.316** (0.157)
𝑅2 (Adj.) 0.0037 0.0057 0.0085 0.0118 0.0152 N 176,215 264,944 354,800 444,304 533,718
Highest Degree Tertiary Education Change of slope at kink point (𝛽1)
0.003 (0.151)
0.210** (0.083)
0.134** (0.054)
0.131*** (0.038)
0.152*** (0.029)
𝑅2 (Adj.) 0.0068 0.0076 0.0080 0.0087 0.0101

34
N 176,215 264,944 354,800 444,304 533,718 Highest Degree Tertiary Education (quadratic specification)
Change of slope at kink point (𝛽1)
-0.156 (0.605)
-0.404 (0.329)
0.062 (0.212)
0.135 (0.151)
0.104 (0.115)
𝑅2 (Adj.) 0.0068 0.0076 0.0080 0.0087 0.0101 N 176,215 264,944 354,800 444,304 533,718
Lives in Helsinki Metropolitan Area Change of slope at kink point (𝛽1)
-0.083 (0.164)
0.0270 (0.089)
-0.051 (0.058)
0.001 (0.041)
0.031 (0.032)
𝑅2 (Adj.) 0.0001 0.0004 0.0005 0.0007 0.0010 N 176,215 264,944 354,800 444,304 533,718
Notes: Heteroskedasticity-robust standard errors are reported in parentheses. Statistical significance: *
p<0.1; ** p<0.05; *** p<0.01. The estimated model is equation (2). The parameter p, which defines the
polynomial order, is chosen using the Akaike Information Criterion (AIC). The preferred polynomial order
in all regressions is 1. Diagnosis M in ICD-10 refers to diseases of the musculoskeletal system and
connective tissue. Diagnosis S refers to injury, poisoning and certain other consequences of external
causes. Diagnosis F refers to mental and behavioral disorders. The FG bandwidth referring to the “rule-
of-thumb” bandwidth described in Fan and Gijbels (1996) is estimated to be c. 0.0796.

35
Figure A7. Density estimate for bunching at the lower kink point: a test for a jump.
Notes: The gray color depicts the histogram of log earnings of -0.3 to 0.3 around the lower kink point in
1200 bins. The lower kink point is normalized to be at 0 of log earnings. The solid line represents a
polynomial regression fit of the density on the midpoints of the bins. The polynomial order is 10 with a
(statistically insignificant) jump. The 95% confidence band is depicted in dashed lines.

36
Figure A8. Density estimate for bunching at the lower kink point: a test for a
nonlinearity.
Notes: The gray color depicts the histogram of log earnings of -0.3 to 0.3 around the lower kink point in
1200 bins. The lower kink point is normalized to be at 0 of log earnings. The solid line represents a
polynomial regression fit of the density on the midpoints of the bins. The polynomial order is 10 with a
(statistically insignificant) nonlinearity in the first order. The 95% confidence band is depicted in dashed
lines.

37
Figure A9. Placebo regressions.
Notes: The graph represents 101 estimates of the kink using the main specification (log sickness absence
duration on log earnings), where the lower kink point is assumed to be off the correct location by -0.5 to
0.5 of log earnings at intervals of 0.01 log earnings. The lower kink point is originally normalized to be at
0 of log earnings. The point estimates are depicted in dark gray and 95% confidence intervals in light
gray.

38
References
Besley, T. and Case, A. (2000). Unnatural experiments? Estimating the incidence of
endogenous policies. Economic Journal, 110, F672-F694.
Card, D., Lee, D., Pei, Z. and Weber, A. (2012). Nonlinear policy rules and the
identification and estimation of causal effects in a generalized regression kink design.
National Bureau of Economic Research, Working Paper No. 18564.
Chetty, R. and Finkelstein, A. (2012). Social insurance: Connecting theory to data.
NBER Working Paper No. 18433.
De Paola, M., Scoppa, V. and Pupo, V. (2014). Absenteeism in the Italian public
sector: The effects of changes in sick leave policy. Journal of Labor Economics, 32, 337–
360.
DICE Database (2012). Lost working time due to sickness, 2000-2009. Ifo Institute,
Munich, online available at http://www.cesifo-group.de/DICE/fb/3Sb8mxDdU
Eurostat (2011). The European System of integrated Social Protection Statistics
(ESSPROS). Methodologies and Working papers.
Fan, J. and Gijbels, I. (1996). Local Polynomial Modelling and Its Applications.
Chapman and Hall, London.

39
Fevang, E., Markussen S. and Røed, K. (2014). The sick pay trap. Journal of Labor
Economics, 32, 305–366.
Frick, B. and Malo, M.A. (2008). Labor market institutions and individual absenteeism in
the European Union: The relative importance of sickness benefit systems and
employment protection legislation. Industrial Relations, 47, 505–529.
Gimeno, D., Benavides, F.G., Benach, J. and Amick, III B.C. (2004). Distribution of
sickness absence in the European Union countries. Occupational and Environmental
Medicine, 61, 867–869.
Gruber, J. (2000). Disability insurance benefits and labor supply. Journal of Political
Economy, 108, 1162–1183.
Henrekson, M. and Persson, M. (2004). The effects on sick leave of changes in the
sickness insurance system. Journal of Labor Economics, 22, 87–113.
Holmlund, B. (2004). Sickness absence: An introduction. Swedish Economic Policy
Review, 11, 3–8.
Imbens, G. W. and Lemieux, T. (2008). Regression discontinuity designs: A guide to
practice. Journal of Econometrics, 142, 615–635.
Johansson, P. and Palme, M. (2005). Moral hazard and sickness insurance. Journal of
Public Economics, 89, 1879–1890.

40
Kangas, O., Niemelä, M. and Varjonen, S. (2013). Politics in the making of sickness
insurance in Finland. In Haggrén, H., Rainio-Niemi, J. and Vauhkonen, J. (Eds.): Multi-
layered Historicity of the Present: Approaches to Social Science History. University of
Helsinki, Helsinki, pp. 271–296.
KELA (2012). Statistical Yearbook of the Social Insurance Institution. Official Statistics
of Finland, Helsinki. Official Statistics of Finland.
KELA (2013). Pocket Statistics 2013. The Social Insurance Institution of Finland,
Helsinki.
Lehto, A-M and Sutela, H. (2009). Three Decades of Working Conditions. Findings of
Finnish Quality of Work Life Surveys 1977–2008. Statistics Finland, Helsinki.
Nielsen, H. S., Sørensen, T. and Taber, C. (2010). Estimating the Effect of Student Aid
on College Enrollment: Evidence from a Government Grant Policy Reform. American
Economic Journal: Economic Policy, 2, 185–215.
Pettersson-Lidbom, P. and Skogman Thoursie, P. (2013). Temporary disability insurance
and labor supply: Evidence from a natural experiment. Scandinavian Journal of
Economics, 115, 485–507.
Puhani, P.A. and Sonderhof, K. (2010). The effects of a sick pay reform on absence and
on health-related outcomes. Journal of Health Economics, 29, 285–302.

41
Treble, J. and Barmby, T. (2011). Worker Absenteeism and Sick Pay. Cambridge
University Press, Cambridge.
Toivonen, L. (2012). Statutory and occupational sickness benefits in Finland in 2011.
Kela Online Working Paper No. 34/2012.
Ziebarth, N.R. and Karlsson, M. (2014). The effects of expanding the generosity of the
statutory sickness insurance system. Journal of Applied Econometrics, 29, 208–230.