a journey into data science: earning the white coat · “a journey of a thousand miles begins with...
TRANSCRIPT

A JOURNEY INTO DATA SCIENCE:
EARNING THE WHITE COAT
Anthony DutraProject AccountantEMC Corporation

2015 EMC Proven Professional Knowledge Sharing 2
Table of Contents
The Journey Begins ................................................................................................................... 3
What is Data Science? ............................................................................................................... 4
Big Data and the Internet of Things ............................................................................................ 5
The Personas of a Data Scientist ............................................................................................... 7
The Nerd ................................................................................................................................ 7
The Artist ................................................................................................................................ 9
The Business Professional ....................................................................................................10
Roll Up Your Sleeves! ...............................................................................................................11
What is Hadoop? ...................................................................................................................11
What is R? .............................................................................................................................14
A Little Taste of R... ...............................................................................................................16
Resources for Future Data Scientists ........................................................................................18
How to Get Involved ..............................................................................................................18
Friendly Competition: Kaggle .................................................................................................18
Data Science Communities: Sharing is Caring ......................................................................19
Learn More ............................................................................................................................20
Learn via MOOC ...................................................................................................................20
Learning in Certifications from the Industry Frontrunners.......................................................21
Saved by the Bell - Formal Education ....................................................................................22
A Single Step... .........................................................................................................................23
Appendix ...................................................................................................................................24
Code for Sentiment Analysis17 ..................................................................................................26
Disclaimer: The views, processes or methodologies published in this article are those of the
author. They do not necessarily reflect EMC Corporation’s views, processes or methodologies.

2015 EMC Proven Professional Knowledge Sharing 3
The Journey Begins
“A journey of a thousand miles begins with a single step.”
Lao-tzu, The Way of Lao-tzu
Do you yearn to discover? Do you want to decipher intricacies within unstructured data?
Perhaps take seemingly disjointed files and construct a cohesive masterpiece? Challenge
complex hypotheses? Develop data-driven models? If you’ve answered yes to any of the above,
then becoming a Data Scientist may be the career track for you...but where does one begin?
In the initial phases of discovering Data Science, it’s natural to feel intimidated by the volume of
available information. This article will provide a baseline understanding of Data Science and the
concepts associated with it. It will challenge the claim that Data Science is a discipline only for
those with an advanced degree in mathematics or computer science. While it is crucial to have
such an educational background, it is more imperative to have a curiosity for the unknown world
of data, a passion for discovery, and a yearning to analyze to create significant solutions. This
article is written from the perspective of someone who has researched the topic of Data Science
for approximately two years and it’s time for that knowledge to be shared amongst all aspiring
Data Scientists, with the hopes of inspiring each one to embark on their journey to earning the
white coat.
My expedition into the world of Data Science began similarly to the approach many of us have
used when learning to swim. Initially, it all seems easy enough to grasp. Watch any Data
Scientist present their research, they do so in an amusing yet respectable manner; their white
coats illuminate in front of a crowd of inquisitive faces listening to the exhibition with intent. They
make it look so easy that we can’t help but want to plunge blindly into the depths of Data
Science. Not long after we realize that we’ve started treading water, at best. We are overcome
by the endless waves of available information on such a complex topic. What was once
fascination quickly becomes fright. The world of Data Science can be overwhelming, especially
if you’re like me, and should have initially approached the vast ocean of information by first
floating in the shallow end with water-wings on.
It’s time to start swimming in the world of Data Science. First, we will dive into the topic of Data
Science by describing what it is and how it is embodied by the framework of Big Data and the
Internet of Things (IoT). Next, we will introduce the three personas I like to apply for Data
Scientists: the Nerd, the Artist, and the Business Professional. We will explain two tools of the
trade, followed by a quick example of what the start of a Data Scientist project may look like.

2015 EMC Proven Professional Knowledge Sharing 4
Then, we will surf to online competitions and communities. Finally, we will be led ashore by
exploring some available educational avenues that provide structured learning in the world of
unstructured data. Together we will traverse the intricacies of Data Science and begin our path
to donning those white coats! Are you ready, future Data Scientists?
What is Data Science?
Data Science is a “buzzword” frequently used across various industries in a variety of contexts.
So what is it? Vasant Dhar (2013) in his abstract Data Science and Prediction defines Data
Science as “the extraction of knowledge from data1.” As vague as that notion may appear, it is
actually quite profound. It is a term used to describe the marriage of statistics, computer
science, art, and business all used to extract meaning and interpretation from data. A Data
Science project requires a lot of collecting and cleaning the data, as the vast majority of the data
is not readily available. This process requires tenacity since the data isn’t always available in the
proper format. A Data Scientist should develop an initial hypothesis that is inspired by a deep
understanding of statistics and knowledge of computer science principles. This hypothesis and
its validity tested via exploratory data analysis. Adapted from John Tukey (1977), exploratory
data analysis (EDA) is defined as an approach to analyzing data sets to summarize their main
characteristics, often with visual methods2. These methods are paired with business soft skills,
ranging from grasping the biases found in the data set to debugging code in a created model. In
Data Science, it is crucial to be able to form a final piece of communication amongst team
members and leadership in concise and understandable language. These presentations require
effective data visualizations so that the conclusion may enhance the decision making process of
an organization. The best illustration describing The Data Science Process is from Doing Data
Science: Straight Talk from the Frontline:

2015 EMC Proven Professional Knowledge Sharing 5
Figure 1: The Data Science Process3
The aim of all Data Science activities is to derive meaning from data and produce solutions that
can be used to influence decisions which create value. The discipline of Data Science spans
numerous domains including healthcare, biological and medical sciences, and social sciences.
Arguably, the largest domain impacted by the practice of Data Science is business. Virtually
every aspect of business is open to data collection and often even instrumented for data
collection: operations, manufacturing, supply-chain management, customer behavior, marketing
campaign performance, workflow procedures, and so on4. The study of Data Science has
changed the look, feel, and value of data, bringing to it new and exciting methods and concepts
never before applied on such a massive scale.
Big Data and the Internet of Things
We are now living in what I suggest to be the Information Ages’ “Wild West of Information
Discovery”. As we share more of our lives via social media and organizations generate more
information daily, a data overload begins to develop. According to a quote from IBM as
mentioned in a British Broadcasting Company (BBC) article in March 2014, over “...2.5 exabytes
- that's 2.5 billion gigabytes (GB) - of data was generated every day in 2012... About 75% of
data is unstructured, coming from sources such as text, voice, and video5.”

2015 EMC Proven Professional Knowledge Sharing 6
Big Data is a term for any “large” collection of data sets. These data sets are so enormous and
complex that they become difficult to process using traditional data processing applications. The
databases are, “denormalized”, meaning there are instances of redundancies in the data sets.
Industry analyst Doug Laney (2001) conceptualized the now conventional definition of Big Data
with the inception of the three V’s: Volume, Velocity, and Variety6:
Volume. Numerous factors contribute to the increase in data volume. These factors
range from transaction-based data to unstructured data. Storage costs are decreasing;
excessive data volume is now the new norm. The challenge now is to determine the
relevance of the data within large data volumes and how to use analytics to create value.
Velocity. Data is being uploaded, downloaded, and streamed at groundbreaking speed.
To maintain its value, this data must be processed in a timely manner or it will become
stale. Reacting quickly enough to deal with the always changing data is a challenge for
most organizations.
Variety. Information today looks very different than how it was presented in the past. We
can share videos and photos instantly, comment on a thought using social media, and
transfer funds in our bank accounts on our smartphones. So it’s no surprise that our data
today comes in all types of formats. Structured data resides in a fixed field within a
record or file. This includes data contained in relational databases and spreadsheets.
Semi-structured data does not conform to the formal structure of data models but
contains tags or other identifiers to separate semantic elements. Finally, there is
unstructured data which refers to information that either does not have a pre-
defined data model or is not organized in a pre-defined manner (i.e. text, HTML, etc.).
Organizations struggle with deriving value from each type of data.
Another cause of this data explosion can be attributed to the Internet of Things (IoT). As defined
by Techopedia, IoT is a computing concept that describes a future where everyday physical
objects will be connected to the Internet and be identifiable to other devices7. An object that can
represent itself digitally becomes something greater than the object by itself. It does so by using
emerging technologies such as near field communications, real-time localization, and
embedded sensors to convert –- as Tarry Singh (2014) stated in his article, Digital
Transformation –- “dumb things into smarter things8.” The item enveloped with IoT technologies
develops what can be referred to as a digital identity. The object no longer relates just to you,
but is now connected to surrounding objects and database data.

2015 EMC Proven Professional Knowledge Sharing 7
The challenges that arise from both Big Data and IoT are plentiful and the changing landscape
of how data is created through these methods leaves much to discover. Luckily, there are
individuals who are willing to resolve these challenges and are not intimidated by the necessary
work needed to decipher such intricacies. These individuals are the Data Scientists.
One may ask: Who are these information-savvy individuals? How can I emulate them? To
satisfy my own curiosity, in the learning process I developed the following personas that I
believe you may find helpful when thinking about Data Scientists:
The Personas of a Data Scientist
Data Scientists are unique individuals that push the boundary of machine and human learning in
an effort to discover what cannot be seen by others. A Data Scientist is a balanced role and
requires someone with the skills to organize, develop, create, and share their work amongst
their colleagues and upper management. This section is comprised of detailed explanations of
three personas that every Data Scientist possesses: the Nerd, the Artist, and the Business
Professional9 (Dutra 2015).
The Nerd
Figure 2: The Nerd9 (Dutra 2015)

2015 EMC Proven Professional Knowledge Sharing 8
The fundamental roots of Data Science today are composed of vastly more intricate educational
fields of study: mathematics, statistics, and computer science. A Data Scientist is skilled to
some degree (or at the very least has an interest) in these main educational areas. As well, a
Data Scientist should have some domain experience within their area of research. This
combination of educational and domain experience is what makes a Data Scientist a true
expert. Alongside this notion, it is important that a Data Scientist have experience and a
curiosity to solve problems in this format. Data Scientists train these models over several data
sets so that the results are as accurate as possible. If you want to be a Data Scientist, it’s
probably best to read further on the statistical fundamentals shown below, as they will be the
foundations of analysis when working on an issue or topic:
Linear/Logistical Regression
Naïve Bayes Classifiers
K-Means Clustering
Decision Trees
Autoregressive integrated moving average (ARIMA) modeling
Analysis of variance (ANOVA) modeling
There are also non-mathematical, more computer science-based principles on which a Data
Scientist bases model creation. Text mining is a good example of such a principle. Also referred
to as “text analytics”, text mining is a way to derive worth from unstructured, qualitative data. I’ll
show an example of this later in the article but for now it is central to understand that a Data
Scientist must be well versed in each discipline.
These fundamental mathematical, statistical, and computer science principles backed with a
solid understanding of scripting languages and a basic understanding of Big Data hardware
functions, are important aspects of a Data Scientists domain. Remember, these are areas of
knowledge that can be taught. It is crucial that an aspiring Data Scientist learn and practice
these fundamentals as a daily routine. It is closed-minded to think that only individuals that hold
a degree in mathematical or computer based backgrounds fit the bill. Data Scientists are curious
individuals who challenge the norm. There are other, more natural, aspects of a Data Scientist
that are crucial to the position.
These aspects are derived from a Data Scientists’ passion for finding and interpreting rich data
sources. Data Scientists must be able to manage large amounts of data despite hardware,

2015 EMC Proven Professional Knowledge Sharing 9
software, and bandwidth constraints, merge data sources, ensure consistency of datasets, and
build mathematical models using such data. They must be able to utilize tools and learn the
newest technologies as quickly as possible. For most, these tasks seem like a chore. For Data
Scientists, this is only a portion of the job. Aspiring Data Scientists must embody and share the
love of data analysis.
The Artist
Figure 3: The Artist9 (Dutra 2015)
It’s one skill to analyze the data; it’s another to create with it. Our world is more visual than ever,
we are constantly viewing videos and sharing images with one another. Each day there is a new
photo or video created in an attempt to make a point on a specific topic. If the piece fails to grab
the attention of its audience, the intended message is lost. To capture an audience, we must get
them to listen with their eyes. The creative element of a Data Scientist is arguably the most
important aspect of the role. It is not enough to be able to find patterns amongst the numbers, a
Data Scientist has to be able to paint the picture of the data and inspire change amongst their
peers and authority. A Data Scientist must be critical of their work and open to ideas and input
from their colleagues.

2015 EMC Proven Professional Knowledge Sharing 10
This artistic function of Data Science requires an individual with visualization skills, meaning
they, as the artist, have the ability to work the results of their findings into a comprehensive and
creative masterpiece utilizing visualization tools.
A Data Scientist is passionate about the business they are involved in. The expertise in their
respective domains gives an edge to the Data Scientist over the typical analyst, so it is crucial
that when creating these visualizations, the passion is demonstrated in their work.
The Business Professional
Figure 4: The Business Professional9 (Dutra 2015)
Even with the math skills of a thousand computational devices and the artistic skillset of Pablo
Picasso, at the end of the day, the Data Scientist is still all business. A Data Scientist must have
basic business soft skills to be successful. A Data Scientist must proactively look toward the
broader landscape of any problem, and be able to explain the value of their contributions to the
larger body of work. Of course, obstacles to this feat cannot be taken on alone. Therefore, a
Data Scientist usually works as part of a team, similar to other delivery (program management,
solutions specialists, etc.) roles whose members have complementary knowledge and skills.

2015 EMC Proven Professional Knowledge Sharing 11
Perhaps the most critical aspect of a Data Scientist’s job is presenting and communicating not
only the resulting insights of the data to colleagues, specialists, and upper management on their
team, but the value. Story-telling skills are immensely important to explaining the value of a
long, resource-intensive project.
Final Thought on the Three Personas
The Nerd. The Artist. The Business Professional9 (Dutra 2015). In my findings, these three
personas comprise the essence of each Data Scientist. All of these can be developed in each
individual striving to don the white coat. A Data Scientist is an intense discipline, blending
copious skill sets into one role.
Roll Up Your Sleeves!
There is no better time than the present. Whether you are twenty years old or wish you could be
twenty years old again, why not take charge of your career passion today? In the world of Data
Science, you can only learn by rolling up your sleeves and taking action! It is important for
someone who is new to the world of Data Science to learn and play at the same time and now is
the time to do it. There are two frequently used tools in a Data Scientist’s toolkit: Hadoop and R.
The section below will provide an introduction to Hadoop and provide a short history of its
creation and its structure. This is by far one of the more complex tools, but it is an enabler of
exponential value to organizations. Following Hadoop, I will introduce R, an open-source tool
utilized by many in the Data Science community, in part since it’s known for its ease of use. This
will be a great tool for you to start engaging with (almost) right away. Finally, there will be an
introduction to some of the more well-known communities that you should engage in to further
your knowledge before deciding whether to pay for lessons in the discipline of Data Science.
What is Hadoop?
Hadoop is an open-source Apache Foundation project (originally started in 2002 under the
name Apache Nutch) created by Doug Cutting, the creator of another Apache project named
Apache Lucene (a high-performance, full-featured text search engine library written entirely in
Java. It is a technology suitable for nearly any application that requires full-text search,
especially cross-platform10). Hadoop’s original purpose was to build a web search engine from
scratch; however, once Doug Cutting and his team realized their architecture would not scale to
fit the needs of the Internet, the project shifted gears. Once Google released their version of
Google’s distributed file system (GFS) in 2003, Cutting and his team set to work on creating an
open source implementation of GFS. Jeffery Dean and Sanjay Ghemawat (2004) explain that

2015 EMC Proven Professional Knowledge Sharing 12
Google published the white paper that introduced MapReduce to the world11. Following that
release in early 2005, the developers had a working MapReduce implementation in Nutch. As
described by Tom White (2011) in Hadoop: The Definitive Guide, by the middle of 2005, Nutch
algorithms had been ported to run using MapReduce and NDFS12. Here we see the structural
foundation and development of Hadoop.
The challenges that Big Data creates have become a harsh reality for organizations of all sizes.
Companies utilize traditional data stores and warehouses that serve their business needs. The
traditional tools of data stores and warehouses include massive scale-up servers, Relational
Database Management Systems (RBDMS), and traditional Extract, Transform, and Load (ETL)
tools. These technologies have an original design, built-in operational systems that rely on
structured data, a type of data that conforms to a highly constrained and strict format. The
physical limitations (i.e. server process power, lack of fault tolerance, etc.) of such systems are
minute in comparison to the rate of data growth for an organization and as the volume of the
data increases, so do the costs to maintain and scale-up. When correctly set up, Hadoop
contributes massive benefits by providing the business with opportunities to analyze and
correlate data across structured and unstructured data sources.
Inherent in the Hadoop platform design is the ability to consume, store, and process large data
sets with no constraints on the shape or format of the data. The Hadoop Distributed File System
(HDFS - the changed name of the aforementioned NFS) can be best explained by an adaptation
of the process from EMC Corporation, in which Hadoop takes a large data set, breaks it up into
manageable buckets, and distributes it across a cluster of nodes13. The newly bucketed data is
distributed and then processed with Hadoop’s MapReduce engine. Hadoop is built for easy
access to and storing of very large files with streaming data access patterns running on clusters
and can process enormous volumes of data rapidly due to its distributed nature of compute and
storage. Built from commodity hardware, Hadoop is prone to frequent failures and does not
work well with multiple small files, so it is important to remember that Hadoop is a tool that
works best with the properties of Big Data.

2015 EMC Proven Professional Knowledge Sharing 13
Hadoop has two components; Hadoop Distributed File System (HDFS) and MapReduce.
Hadoop Distributed File System (HDFS)
Figure 5: What is Hadoop? (Adapted from EMC2
Corporation13
)
Hadoop stores data types through HDFS and does so by utilizing three major components that
are also referenced by Tom White (2011), EMC2 Corporation, as well as others:
1. Clients A client can access HDFS multiple ways: application program interface
(API), command line interface (CLI), or other paths that exposes Hadoop’s API,
libraries, or protocols.
2. Namenode The brains of the whole HDFS operation, the Namenode manages the
file system namespace. It maintains the file system tree and the metadata for all the
files and directories in the tree. This information is stored persistently on the local
disk in two files: the namespace image and the edit log. Since it’s running the show,
the Namenode is considered a single point of failure (SPOF), so the vast majority of
the money spent in hardware will go to maintaining this piece of HDFS as well as
failsafe technologies.
3. Datanodes These are the worker nodes of the file system. They store and retrieve
blocks when requested by a client or by a Namenode. Each Datanode is assigned to
a specific Namenode. The Datanodes periodically sends a “heartbeat” to the
Namenode. This report provides the Namenode with lists of blocks that are available
for storage.

2015 EMC Proven Professional Knowledge Sharing 14
MapReduce
Hadoop processes data via the MapReduce function, which can be best explained by an
adaptation of the process from EMC2 Corporation. MapReduce is written using the Java
programming language and is a Java Virtual Machine (JVM) running on the Datanode servers13.
The MapReduce function starts by calling upon an API which then calls for a MapReduce job to
run. MapReduce is a two-step process that can be simply defined as: Map and Reduce. The
Map step takes the data input by the client and divides it into smaller sub-jobs called key/value
pairs. At the time of input, Hadoop supplies the key, which is unique to every record. The Map
function then distributes these pairs to the Datanodes. The Datanodes then process these even
smaller pairs and pass that result to their respective Namenode. The main idea of the Map
function is to divide the input into keys and values in such a way that the values, when put
together for the same key, start to make sense. The Reduce step collects the sorted value pairs
of all the sub-jobs and combines them to form an output. This output is the result of the original
data set, neatly positioned into the defined characteristics of the client.
Below is a simple visualization of a MapReduce word count process14 (Dutra 2015):
Figure 6: The Dutra Simple MapReduce Word Count Process14
(Dutra 2015)
What is R?
R is both a language and a working environment for statistical computing and visualization
creation. Developed at Bell Laboratories, R has become the popular of the two implementation
languages created by John Chambers and colleagues15. The S language falls short in
comparison because R is easier to use, it’s an open-source software, and it utilizes well-
designed publication-quality plots that can be produced, including mathematical symbols and
Mapping Algorithm Reducer Algorithm
Inputto be or not to be
to, 1be, 1or, 1not, 1to, 1
be, 11
not, 1or, 1to, 1
1
Key and
values will
then sort
themselves
into
alphabetical
order
Resultbe, 2not, 1or, 1to, 2

2015 EMC Proven Professional Knowledge Sharing 15
formulations where needed. R can be run and compiled on a wide variety of UNIX platforms and
similar systems (including FreeBSD and Linux), Windows, and MacOS15.
R provides a wide variety of statistical and graphical techniques, each uniquely developed.
These techniques include but are not limited to:
Basic Statistical Testing
Linear and Nonlinear Modeling
Classification(s)
Time-Series Analysis
Clustering
Text Mining Social Media through APIs
Visualizations-Graphs, Maps, Wordclouds, etc.
All of these techniques can be addressed because they are integrated into this one suite of
software that is complemented by a wide array of benefits. R can efficiently store massive
amounts of data that is loaded into its environment, which can then be utilized by a built-in
operator for calculations on arrays or in particular matrices. In this simple and effective
programming language, R initially comes integrated with a small collection of intermediate
functionalities for data and graphical analysis, which can be extended further via packages15.
These are user-created software which can be easily downloaded into your R environment with
only a few lines of code and are available through the Comprehensive R Archive Network
(CRAN), a vast number of websites that cover a wide range of modern statistics. Each package
comes with its own LaTeX-like documentation, which is used to supply comprehensive
documentation, both online in a number of formats and in hardcopy15.
A great way to begin experimenting with R would be to download its developmental
environment, RStudio, a creative interface developed in 2008 by a group of professionals with
various educational backgrounds that came together and were inspired by the R tool16.

2015 EMC Proven Professional Knowledge Sharing 16
A Little Taste of R...
Now that we have the basic background of R, here is a quick and fun little project that you can
do once you’ve downloaded R and RStudio from their respective websites16.
This example is from a quick data visualization project17, created to see what Twitter users were
saying in regard to major events of that year. Roughly 1000 tweets were pulled from Twitter with
a designated hashtag via three R packages17. The most frequent words from those tweets were
taken and the results were utilized in the following actions:
1. Performed a sentiment analysis17 (also known as opinion mining) on the results and
created a histogram of both positive and negative sentiment
2. Using the list of words pulled by R, then built a wordcloud using a website Tagxedo©
Figure 7 showcases results from the Twitter hashtag: “#RIPRobinWilliams”.
Figure 7: #RIPRobinWilliams Raw Histogram from R15
A Data Scientist would ask: what story does this visualization tell? We can only assume that the
frequency of negative terms has a higher frequency which, in this case, would make sense.
There just are not enough details behind the data or the visualization to validate a hypothesis.
This is a (very) basic starting point for a Data Scientist who may be trying to study a specific
social media topic, discover patterns within the topic, or analyze a basic trend in a social media
(in this case TwitterTM) environment. A Data Scientist could continue the research by classifying
2015 EMC Proven Professional Knowledge Sharing 17
and plotting the distribution of the emotions and polarity of the results, compare those results to
Twitter hashtags, then evaluate. There are many project avenues that can branch from a small
set of data and a very quick visualization of that data. The challenge to you is to investigate this
topic further and see what projects you could create!
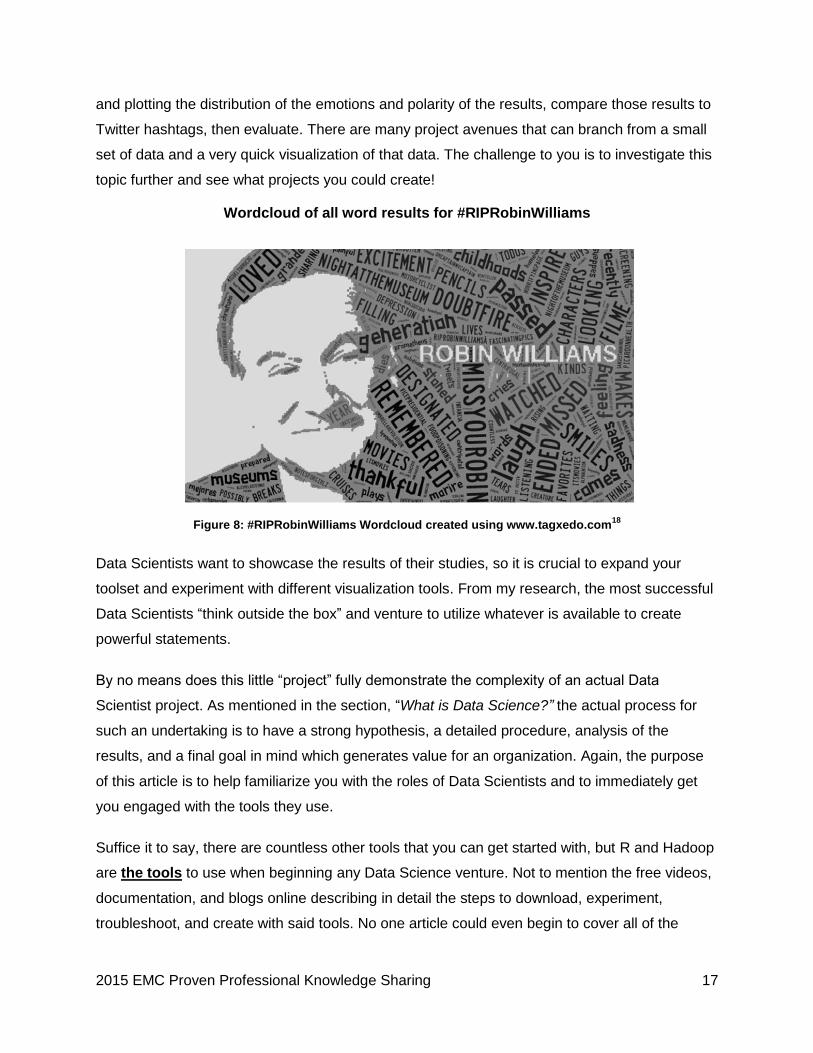
Wordcloud of all word results for #RIPRobinWilliams
Figure 8: #RIPRobinWilliams Wordcloud created using www.tagxedo.com18
Data Scientists want to showcase the results of their studies, so it is crucial to expand your
toolset and experiment with different visualization tools. From my research, the most successful
Data Scientists “think outside the box” and venture to utilize whatever is available to create
powerful statements.
By no means does this little “project” fully demonstrate the complexity of an actual Data
Scientist project. As mentioned in the section, “What is Data Science?” the actual process for
such an undertaking is to have a strong hypothesis, a detailed procedure, analysis of the
results, and a final goal in mind which generates value for an organization. Again, the purpose
of this article is to help familiarize you with the roles of Data Scientists and to immediately get
you engaged with the tools they use.
Suffice it to say, there are countless other tools that you can get started with, but R and Hadoop
are the tools to use when beginning any Data Science venture. Not to mention the free videos,
documentation, and blogs online describing in detail the steps to download, experiment,
troubleshoot, and create with said tools. No one article could even begin to cover all of the

2015 EMC Proven Professional Knowledge Sharing 18
intricacies, but introduction to these two common tools will help you better understand the kind
of tools Data Scientists work with in their day-to-day activities.
Resources for Future Data Scientists
How to Get Involved
Now do you think it’s time to get involved? Getting involved in the world of Data Science
provides you with the opportunity to improve your skills, as well as showcase your work. An
artist is only as good as the portfolio they present, and we both know part of being a Data
Scientist is being an artist. If you’re anything like me, at some point this all has become
overwhelming and perhaps a bit intimidating. The amount of expertise demonstrated by some of
the available content can make even the hardened Data Science expert think that they’re work
has been nothing but child’s play. It is important to remember your work is your own, and the
goal in all of your efforts is not to be the best, because in such a dynamic field of study, there is
no “best”, only ongoing opportunities to grow and improve! The purpose is to approach each
problem with passion and purpose and learn as much as possible along the way.
Friendly Competition: Kaggle
Kaggle is a website for Data Scientists and supports a broad forum where its members actively
engage in questions on machine learning methodologies and best practices. Kaggle is best
known for its competitions, which allows users to submit created models for hosted
competitions. Of course, no Data Scientist is especially good when flying solo, so Kaggle
encourages users to join together to tackle some of their competitions. There are many types of
competitions, ranging from those that have hefty cash prizes to beginner walkthroughs of tools
and techniques. As of the time of this article, there are currently over 240,000 players and
746,855 entries for its 17 active competitions19. This is a website built on discovery, creativity,
and community. While a little healthy competition is never a bad thing, do not let the
leaderboards discourage you from giving it your best.
Beyond its competitions, Kaggle offers a wide variety of tutorials, job postings and forums to
help aspiring Data Scientists get started right away. Its content is comprehensive and engaging,
so it is one of the better places to begin to get involved.

2015 EMC Proven Professional Knowledge Sharing 19
Data Science Communities: Sharing is Caring
Looking back at the meaning of Data Science from the section “What is Data Science?”, you
notice a missing key element...the human element. Through implementation of statistical and
computer science elements, Data Science is built on the foundation of discovery through
collaboration. There are some basic ways to get the conversations flowing: through following
many of the Data Science-related Social Media profiles and commenting on their content to
starting your own blog. As long as the content you share is rich and you stay engaged, there are
no limitations to what can be discovered.
Below are three points to be cautious of when searching for a website that is dedicated to the
discussion and collaboration of Data Science and its projects:
1. Membership Not all Data Science community websites allow any user to sign
up. It is important to thoroughly read what the community is about and follow the
process for becoming a member, as certain knowledge requirements may need
to be proven as necessary.
2. Content Verification Be vigilant of the content shared among these
communities and what you put your name on when posting. It is easy to mistake
collaboration for plagiarism. Many communities will combat this issue by
approving posts before they are published, so it is in your best interest to find an
online community with everyone’s best (and legal) interest in mind.
3. Community Support and Engagement The most effective Data Science
communities will share training content as new techniques and technologies
develop, schedule webinars with organizations whose core competency is Data
Science and a offer a mature community that will engage a user to better help
them learn and enhance their Data Science knowledge.
2015 EMC Proven Professional Knowledge Sharing 20
Learn More
You’ve done your research, explored the Data Scientist communities, and even strutted some of
your stuff over the inter-webs...but it’s just not enough. You want more. It may be time to go
back to school, but where? This section will explain three methods available to enhance your
Data Science knowledge in a more structured environment. First, it will explore the growing
market of Massive Open Online Courses (or MOOCs) and describe what to look for in one that
would be worth your time and money. Then, it will go over what to look for in industry-standard
certification courses. Finally, it will showcase opportunities offered by colleges/universities and
some tips on finding the one best suited for you.
Learn via MOOC
MOOCs have exploded onto the internet within the past five years. Coined in 2008 by Dave
Cormier of the University of Prince Edward Island20, a MOOC is any course of study made
available over the Internet – usually without charge – to a great number of people. These
courses can be a series of videos or weeks-long virtual classroom sessions. Examples of well-
known MOOC websites21 are Udemy, ALISON, and Coursera. The price of a MOOC ranges
from being completely free to about a thousand dollars (fairly cheap in comparison to other
educational avenues). It is common for some colleges or universities to collaborate with MOOCs
to provide a certificate of completion to potential students who complete a course. These online
platforms allow select users (generally with an extensive background in a specific field) to share
videos and supplemental materials to teach the masses. Each course structure is run at the
discretion of the teacher and, depending on the course materials, can be submitted by users
and usually is graded.
MOOCs are great places to begin when testing the waters of Data Science, although the only
value they provide is to the user that takes the most out of them. Taking a MOOC in Data
Science domain is not a good selling point on a resume, but if you want to learn more at a low
cost, there truly is no better outlet. Here are three things that I advise you to consider when
searching for the right Data Science-related MOOC:
1. Content Overview Most courses provide users a detailed syllabus of what will be
covered in the course. Make sure this is as detailed as possible and is what you’ve
signed up for. It may be the case that this MOOC was set up to only cover a certain
topic (or product).

2015 EMC Proven Professional Knowledge Sharing 21
2. What is Required Be ready to commit time and resources to some of the extensive
MOOCs offered in the realm of Data Science. Some require you to turn in homework,
collaborate with individuals online, or download tools you are completely unfamiliar
with. While these tasks are not necessarily negative things, it’s recommended to use
your best judgment when initially signing up for such an undertaking.
3. Teacher’s Background This is something I wish I had the opportunity to dive into
when I went to college. The vast majority of teachers on MOOCs provide a general
background of their degrees, work experience, etc. In the realm of Data Science
MOOCs, they will more than likely have profound educational backgrounds in Statistics,
Computer Science, Market Research, and so on. Make sure you take some time to
validate their credentials and find out about their teaching style.
Learning in Certifications from the Industry Frontrunners
Another approach to delving deeper into the world of Data Science is to take certification
courses. Courses are offered through a variety of outlets. The first would be a classic, instructor-
led course, where you would attend a week-long class at a designated location. The second
would be a Virtual Instructor-Led Training course (VILT). These courses are delivered via a
CD/USB drive to a user by mail or streamed online. This provides the user an option to take a
course when is best for them. The cost of such certification courses tend to run in the price
range of $1,000 (for VILTs) to upwards of $5,000 (for an Instructor-led course). After the course
is taken, an exam is needed to be passed before certification can be achieved. The cost of an
exam is generally around $200 per attempt. While attaining these certifications will not
necessarily land you a job, they are fantastic jumping off points and provide a structured, self-
paced approach to learning Data Science.
Below I have alphabetically listed three organizations who offer certification tracks in Data
Science and Data Science-related topics:
1. Cloudera University Offers a wide range of certification tracks in Hadoop (both a
Developer and Administrator track) and an introduction course into Data Science. Its
offerings are presented either online or in a classroom setting with an option for
private tutoring. There are other hands-on tools available on the website (for an extra
cost) to assist in the Hadoop-specific certification tracks22.

2015 EMC Proven Professional Knowledge Sharing 22
2. EMC Proven Professional Offers one “open” (meaning the contents of the course
are vendor neutral) path for the Data Science discipline. The Data Scientist track
(EMCDS) has an Associate Level course, Data Science and Big Data Analytics
(DSBDA). This course comes in three different delivery options: Instructor-led, a USB
Flash Drive Video ILT, and a streaming VILT (VILT-Stream). The course provides
foundational training on Data Science. This offering comes with a lab, providing a
hands-on approach to learning the intricacies of Big Data projects23.
3. Hortonworks Offers in-person and virtual classroom training on multiple Big Data
and Data Science subjects, but is best known for its certification tracks that focus on
Hadoop. Its Hortonworks Data Platform (HDP) Data Science course covers the
basics of Data Science principles as well as some hand-on programming practice
with some of the languages used by Data Scientists24.
Saved by the Bell - Formal Education
My father always told me to stay in school. This advice proves worthy in assisting aspiring Data
Scientists ready to take their education to the next level. Many colleges today offer a wide
variety of Data Science Master’s programs that you may want to consider taking the time to
research and invest your time in as the average salary of a Data Scientist, according to
Payscale.com, is $95,587 per year25.
Try “Googling” Data Science Classes. At the time this article is being written, the outcome is a
yield of about 28,700,000 results26. To assist in wading through the massive output of results,
here are three key items to check for when choosing a Data Science education path:
1. Cost This one was obvious from the start and I am sure it is first on your list as well.
In a recent article written by Petersons “The cost of tuition and fees of graduate
degree programs varies greatly depending on the type of school and academic
program. On average, annual tuition at public colleges and universities totals
nearly $30,000 and at private schools nearly $40,00027.” Considering that the
average graduate degree requires around 15-20 months, the costs add up quickly.
2. In-Class vs. Online The majority of results you will find are for online courses
offered by colleges/universities. Be careful of these. While it may beneficial to go for
a degree in Data Science on a part-time online basis, the degree you would acquire
post-graduation may not actually be from the school to which you’ve applied. Some

2015 EMC Proven Professional Knowledge Sharing 23
colleges/universities only offer degrees through their online programs, meaning you’d
get a degree from XYZ University Online and not from the school (officially) itself.
3. Note the Curriculum Data Science has become a “buzzword”, and like many
buzzwords they tend to be used freely. Some colleges/universities have Data
Science as a focus in their Computer Science degree path. Make sure you sign up
for exactly what you want stated on your final transcript. Take note of opportunities to
work towards a Doctorate as well (if feasible financially and it’s something you’d like
to do). Some colleges/universities offer a Data Science Master’s degree program
that is the first step toward a PhD.
A Single Step...
Data Science is a discipline built on the foundation of discovery through the implementation of
advanced mathematical principals, scientific processing, data visualization, and cross-discipline
collaboration. Data Scientists are unique individuals who are naturally curious, have a passion
for discovery, and a yearning to dissect large volumes of data. While an educational background
in advanced mathematics or computer science is important, it is more important to have a
curiosity for the unknown, an appetite for discovery, and a desire to analyze data.
At the beginning of this writing journey I introduced the term Data Science and described what it
is and how it has embodied the framework of Big Data and the Internet of Things (IoT). I then
took a brief look at what I believe makes up the personas of Data Scientists and what skill sets
they use to confront the complex challenges faced in the data we generate today. We’ve gotten
cozy with two tools of the trade, took a short detour with a quick example using R, and learned a
bit about select online Data Science communities. We ended our excursion by exploring and
highlighting key aspects of the numerous available educational avenues that focus in the Data
Science discipline.
An aspiring Data Scientist will take the lessons learned throughout this article and begin their
journey. So if you’re ready to don the white coat, ask yourself again: Do you yearn to discover?
Do you want to decipher intricacies in unstructured data? Take seemingly disjointed files and
construct a cohesive masterpiece? Challenge complex hypotheses? Develop data-driven
models? If you’ve answered yes to any of the above, then becoming a Data Scientist is the
career path for you...enjoy the journey!

2015 EMC Proven Professional Knowledge Sharing 24
Appendix
1) Dhar, Vasant. Copyright 2013. Communications of the ACM, Vol. 56 No. 12, Pages 64-73
http://cacm.acm.org/magazines/2013/12/169933-data-science-and-prediction/abstract
2) Tukey, John (1977), Exploratory Data Analysis, Addison-Wesley.
3) O’Neil, Cathy and Schutt, Rachel. Copyright 2013. “Doing Data Science: Straight Talk from
the Frontline”.
4) Provost, Foster and Fawcett, Tom. Copyright 2013. “Data Science for Business: What you
need to know about data mining and data-analytic thinking.”
5) BBC Corporation. June 2014. Big Data: Are you ready for blast-off?
http://www.bbc.com/news/business-26383058
6) META Group. February 2001. "3D Data Management: Controlling Data Volume, Velocity, and
Variety."
7) Techopedia. “Internet of Things (IoT)”. http://www.techopedia.com/definition/28247/internet-
of-things-iot
8) Singh, Tarry. June 2014. Digital Transformation.
9) Dutra, Anthony. 2015. The Three Personas of a Data Scientist- The Nerd, the Artist and the
Business Professional
10) The Apache Software Foundation. http://lucene.apache.org/core/
11) Jeffrey Dean and Sanjay Ghemawat. December 2004. “MapReduce: Simplified data
Processing on Large Clusters.” http://labs.google.com/papers/mapreduce.html
12) White, Tom. Copyright 2011. “Hadoop: The Definitive Guide, 3rd Edition.”
13) EMC eLearning. “Big Data Solutions: Get Started with Hadoop”
14) Dutra, Anthony. 2015. “The Dutra Simple MapReduce Word Count Process”
15) About the R Language. http://www.r-project.org/about.html

2015 EMC Proven Professional Knowledge Sharing 25
16) Downloading R: http://www.r-project.org/ and RStudio:
http://www.rstudio.com/products/rstudio/download/
17) University of Northern Texas. Mining Twitter and Sentiment Analysis w/R.
iralab.unt.edu/sentiment-analysis
18) Image created by utilizing Tagxedo. www.tagxedo.com
19) Kaggle. http://www.kaggle.com/
20)Cormier, Dave. http://davecormier.com/edblog/2008/10/02/the-cck08-mooc-connectivism-
course-14-way/
21) Udemy, ALISON and Coursera websites: https://www.udemy.com/ ; http://alison.com/ ;
https://www.coursera.org/
22) Cloudera University. http://www.cloudera.com/content/cloudera/en/training.html
23) EMC Proven Professional.
https://education.emc.com/guest/certification/framework/stf/data_science.aspx
24) Hortonworks. http://hortonworks.com/
25) Data Scientist, IT Salary.
http://www.payscale.com/research/US/Job=Data_Scientist,_IT/Salary
26) Google search for Data Science Classes
https://www.google.com/#q=Data+Science+Classes
27) Petersons. “Is the Cost of a Graduate Degree Worth It?”
http://www.petersons.com/graduate-schools/cost-graduate-degree-worth.aspx

2015 EMC Proven Professional Knowledge Sharing 26
Code for Sentiment Analysis17
Credit to the University of Northern Texas for their blog and videos on Mining Twitter and
Sentiment Analysis w/R which inspired the provided example.
Feel free to copy and paste the code into your R or RStudio environment. Fill in the bold items
with your own input. Be sure to note the commented out portions (the R language comments out
lines with the # symbol) as some portions require extra input!
Scoring Tweets
Function: This code allows users to compare overall positive or negative sentiment of tweets.
Note: Anything in bold needs to be updated by user.
#Install packages
install.packages("ROAuth")
install.packages("twitteR")
install.packages("plyr")
install.packages("stingr")
library("ROAuth")
library("twitteR")
library("plyr")
library("stingr")
#Download Certifications-necessary step for Windows
download.file(url="http://curl.haxx.se/ca/cacert.pem", destfile="cacert.pem")

2015 EMC Proven Professional Knowledge Sharing 27
#Get your consumerKey and consumerSecret see the twitteR documentation for instructions
cred <- OAuthFactory$new(consumerKey='YOUR CONSUMER KEY',
consumerSecret='YOUR CONSUMER SECRET',
requestURL='https://api.twitter.com/oauth/request_token',
accessURL='https://api.twitter.com/oauth/access_token',
authURL='https://api.twitter.com/oauth/authorize')
#Generate PIN to complete the authorization process-necessary step for Windows
cred$handshake(cainfo="cacert.pem")
#save for later use for Windows
save(cred, file="twitter_authentication.Rdata")
#once saved, next time all you have to do is
#load("twitter_authentication.Rdata")
#registerTwitterOAuth(cred)
#the cainfo parameter is necessary on Windows
DATA.list<- searchTwitter("#INPUT HASHTAG HERE", n=INPUT AN INTEGER VALUE,
cainfo="cacert.pem")
DATA.df <- twListToDF(DATA.list)
write.csv(DATA.df, file=’INPUT FILE PATH HERE’, row.names=F)
#Create the Sentiment Function
score.sentiment <- function(sentences, pos.words, neg.words,.progress = 'none') {
require (plyr)

2015 EMC Proven Professional Knowledge Sharing 28
require (stringr)
scores<- laply(sentences, function(sentence, pos.words, neg.words){
#Clean up the data
sentence <-gsub('[[:punct:]]', '', sentence) #removes punctuation
sentence <-gsub('[[:cntrl:]]', '', sentence) #removes correctors
sentence <-gsub('\\d+', '', sentence) #removes digits
sentence<-tolower(sentence) #puts all characters in lowercase
#Split words
word.list<- str_split(sentence, '\\s+')
words<-unlist(word.list)
#compare our words to the dictionaries of positive and negative terms
pos.matches<-match(words,pos.words)
neg.matches<- match(words,neg.words)
#Return boolean positive or negative word matches
pos.matches<- !is.na(pos.matches)
neg.matches<- !is.na(neg.matches)
score<-sum(pos.matches)-sum(neg.matches)
return(score)
}, pos.words, neg.words, .progress=.progress)
scores.df<- data.frame(scores=scores, text=sentences)
return(scores.df)

2015 EMC Proven Professional Knowledge Sharing 29
}
#Read in positive and negative words
hu.liu.pos<- scan(‘INPUT FILE PATH', what='character',comment.char=';')
hu.liu.neg<- scan(‘INPUT FILE PATH', what='character',comment.char=';')
#Import the csv file
DATA_dataset<-read.csv(‘INPUT FILE PATH')
DATA _dataset$text<-as.factor(DATA _dataset$text)
#Score all Tweets
DATA.scores<-score.sentiment(RobinWilliams_dataset$text, pos.words, neg.words,
.progress='text')
#Visualization
hist(DATA.scores$score)
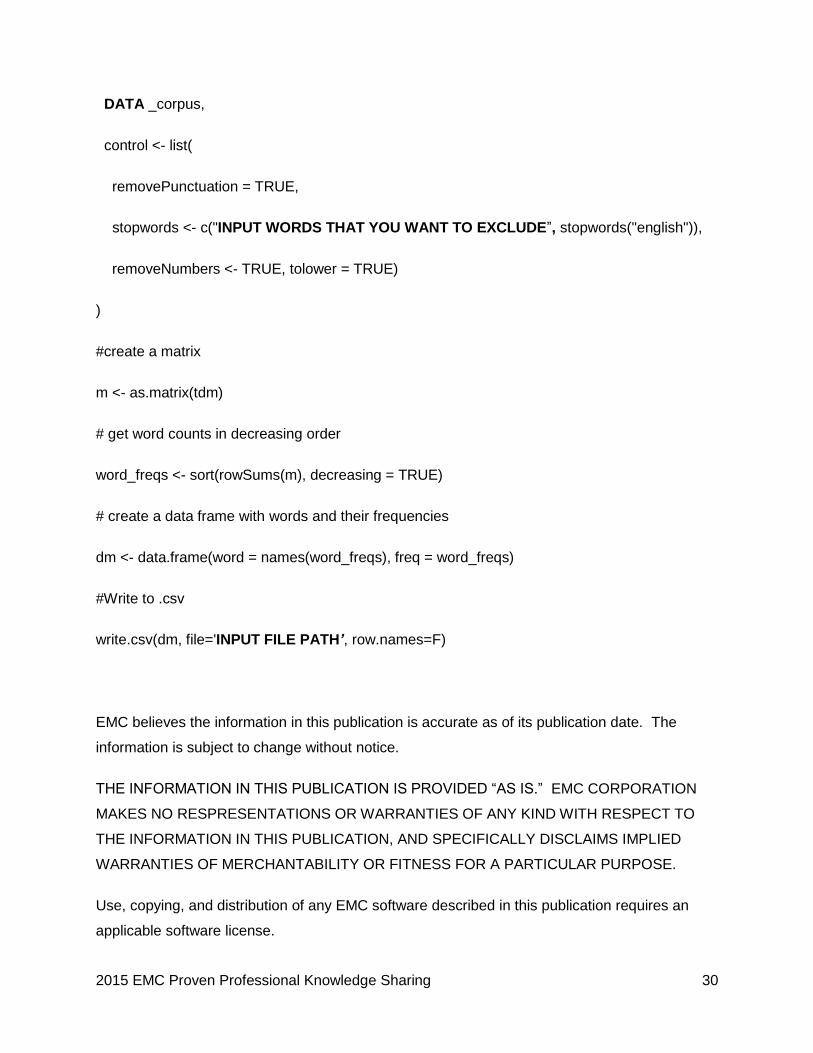
Word Frequency in Tweets
Function: This code allows users to pull tweets from a designated hashtag, and provide a table
of the most frequently used words
#Set the search parameter- necessary on Windows
DATA.list<- searchTwitter("#INPUT HASHTAG HERE ", n=1500, cainfo="cacert.pem")
DATA _text <- sapply(DATA.list, function(x) x$getText())
#create a corpus
DATA _corpus = Corpus(VectorSource(DATA _text))
#clean up the data
tdm <- TermDocumentMatrix(
2015 EMC Proven Professional Knowledge Sharing 30
DATA _corpus,
control <- list(
removePunctuation = TRUE,
stopwords <- c("INPUT WORDS THAT YOU WANT TO EXCLUDE”, stopwords("english")),
removeNumbers <- TRUE, tolower = TRUE)
)
#create a matrix
m <- as.matrix(tdm)
# get word counts in decreasing order
word_freqs <- sort(rowSums(m), decreasing = TRUE)
# create a data frame with words and their frequencies
dm <- data.frame(word = names(word_freqs), freq = word_freqs)
#Write to .csv
write.csv(dm, file='INPUT FILE PATH’, row.names=F)
EMC believes the information in this publication is accurate as of its publication date. The
information is subject to change without notice.
THE INFORMATION IN THIS PUBLICATION IS PROVIDED “AS IS.” EMC CORPORATION
MAKES NO RESPRESENTATIONS OR WARRANTIES OF ANY KIND WITH RESPECT TO
THE INFORMATION IN THIS PUBLICATION, AND SPECIFICALLY DISCLAIMS IMPLIED
WARRANTIES OF MERCHANTABILITY OR FITNESS FOR A PARTICULAR PURPOSE.
Use, copying, and distribution of any EMC software described in this publication requires an
applicable software license.