a guide to calibrating your spectrum analyzer - elcal.ch · pdf file3 fluke corporation a...
TRANSCRIPT
Application Note
A Guide to Calibrating Your
Spectrum Analyzer
Table of Contents
Introduction...............................................................................1What.is.a.spectrum.analyzer?....................................................2What.does.a.spectrum.analyzer.measure?..................................3Which.calibration.tests.are.needed?.........................................4
Display Linearity test ......................................................................... 5Noise Floor test ................................................................................... 6Input Attenuator test .......................................................................... 7Absolute Amplitude Accuracy and Frequency Response test ...... 8Resolution Bandwidth and Selectivity test .................................... 9Resolution Bandwidth Switching test ........................................... 10Reference Level Accuracy test ....................................................... 11Noise Sideband test ......................................................................... 12Residual FM test ............................................................................... 13Frequency Span test ........................................................................ 14Sweep Time Accuracy test ............................................................. 15Harmonic Distortion test .................................................................. 16Third-Order Intermodulation Intercept test ...................................17Gain Compression test ......................................................................17
Manual.vs..automatic.testing...................................................18Conclusion...............................................................................18
References...............................................................................18
IntroductionAs a technician or engineer who works with electronics, you rely on your spectrum analyzer to verify that the devices you design, manufacture, and test—devices such as cell phones, TV broadcast systems, and test equipment—are generating the proper signals at the intended frequencies and levels. For example, if you work with cellular radio systems, you need to ensure that carrier signal harmonics won’t interfere with other systems operating at the same frequencies as the harmon-ics; that intermodulation will not distort the infor-mation modulated onto the carrier; that the device complies with regulatory requirements by operating at the assigned frequency and staying within the allocated channel bandwidth; and that unwanted emissions, whether radiated or conducted through power lines or other wires, do not impair the opera-tion of other systems.
All of these measurements can be verified with a spectrum analyzer, which displays the frequency content of the signal generated by a device. But the performance of spectrum analyzer circuits can drift over time and under changing temperature condi-tions. This drift affects the accuracy of the analyz-er’s measurements. If the analyzer’s measurements are not accurate, the devices you are testing with it may not perform as intended.
Since you use your spectrum analyzer to test other equipment, you need to have confidence in its measurements. Confidence, both that a device that tests out as good really is operating properly, and that a device that tests out as having problems really does not meet requirements. A high level of confidence is especially important these days, as more signals are crowded into the same space, making even small deviations capable of causing problems. This is why it is important to calibrate your spectrum analyzer at the intervals specified by the manufacturer and why it is vital that all critical spectrum analyzer functional parameters are tested to make sure they are operating within specification.
Spectrum analyzers are often perceived as being complex products that are time-consuming to calibrate. It is true that the procedure can take several hours or even days and requires an array of equipment, including signal sources, sophisticated reference standards, and accessories. However, calibration time can be significantly reduced by simply automating the verification process.
Another issue with spectrum analyzer calibration is the difficulty of interpreting the test results. For
example, the test for noise sidebands that deter-mines whether the spectrum analyzer meets its phase noise specification often expresses the results in dBc, while analyzer specifications are typically quoted in dBc/Hz. Consequently, the test engineer must convert dBc to dBc/Hz as well as applying several correction factors to determine whether the spectrum analyzer is in compliance with specifications.
For these reasons, spectrum analyzer calibra-tion is a task best handled by skilled metrolo-gists, who have both the necessary equipment and an in-depth understanding of the procedures involved. Still, it’s helpful for everyone who works with spectrum analyzers to understand the value of calibrating these instruments. This application note is intended both to help application engineers who work with spectrum analyzers understand the importance of regular calibration and to explain to calibration lab metrologists the key steps in cali-brating a spectrum analyzer. It begins with a brief recap of what a spectrum analyzer is and what it does and then goes on to describe several of the most important tests needed to keep your spectrum analyzer operating within specifications.
2 Fluke Corporation A guide to calibrating your spectrum analyzer.
What is a spectrum analyzer?There are several types of spectrum analyz-ers, ranging from low-cost entry-level handheld devices and traditional analog analyzers to modern, high-performance analyzers employing digital signal processing techniques. In this application note, we concentrate on the swept-tuned, super-heterodyne spectrum analyzer. However, it should be noted that real-time spectrum analyzers have a significantly different architecture and are outside the scope of this application note.
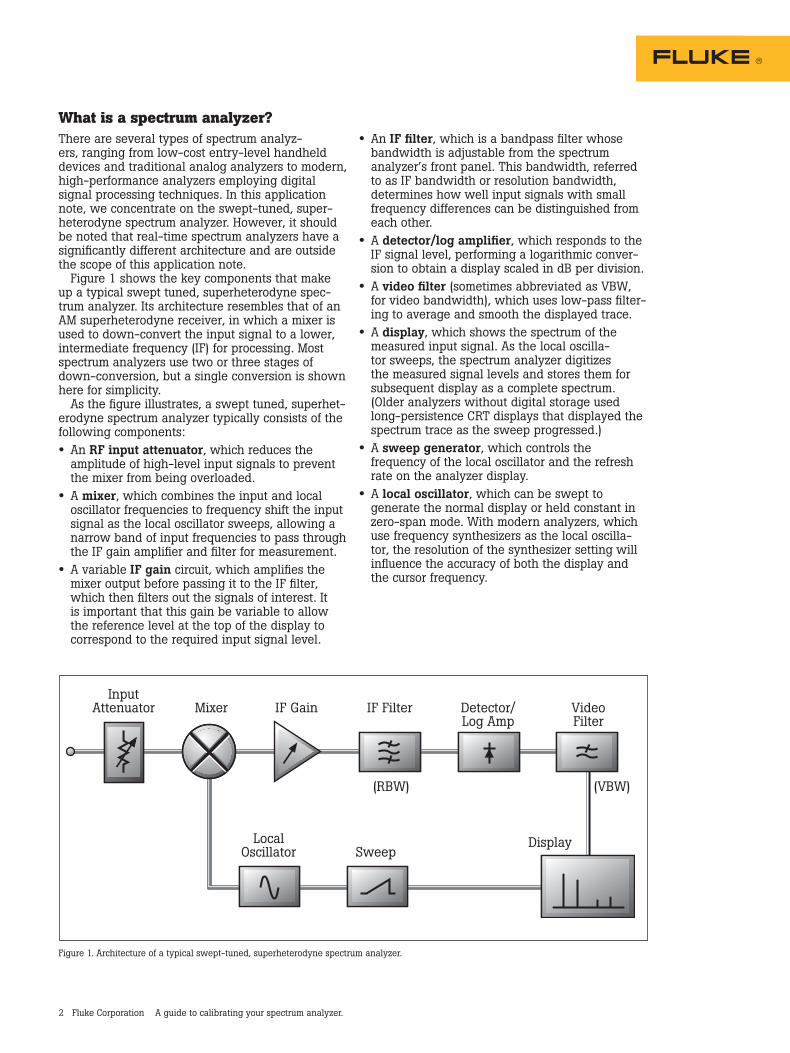
Figure 1 shows the key components that make up a typical swept tuned, superheterodyne spec-trum analyzer. Its architecture resembles that of an AM superheterodyne receiver, in which a mixer is used to down-convert the input signal to a lower, intermediate frequency (IF) for processing. Most spectrum analyzers use two or three stages of down-conversion, but a single conversion is shown here for simplicity.
As the figure illustrates, a swept tuned, superhet-erodyne spectrum analyzer typically consists of the following components:
• An.RF.input.attenuator, which reduces the amplitude of high-level input signals to prevent the mixer from being overloaded.
• A mixer, which combines the input and local oscillator frequencies to frequency shift the input signal as the local oscillator sweeps, allowing a narrow band of input frequencies to pass through the IF gain amplifier and filter for measurement.
• A variable IF.gain circuit, which amplifies the mixer output before passing it to the IF filter, which then filters out the signals of interest. It is important that this gain be variable to allow the reference level at the top of the display to correspond to the required input signal level.
• An IF.filter, which is a bandpass filter whose bandwidth is adjustable from the spectrum analyzer’s front panel. This bandwidth, referred to as IF bandwidth or resolution bandwidth, determines how well input signals with small frequency differences can be distinguished from each other.
• A detector/log.amplifier, which responds to the IF signal level, performing a logarithmic conver-sion to obtain a display scaled in dB per division.
• A video.filter (sometimes abbreviated as VBW, for video bandwidth), which uses low-pass filter-ing to average and smooth the displayed trace.
• A display, which shows the spectrum of the measured input signal. As the local oscilla-tor sweeps, the spectrum analyzer digitizes the measured signal levels and stores them for subsequent display as a complete spectrum. (Older analyzers without digital storage used long-persistence CRT displays that displayed the spectrum trace as the sweep progressed.)
• A sweep.generator, which controls the frequency of the local oscillator and the refresh rate on the analyzer display.
• A local.oscillator, which can be swept to generate the normal display or held constant in zero-span mode. With modern analyzers, which use frequency synthesizers as the local oscilla-tor, the resolution of the synthesizer setting will influence the accuracy of both the display and the cursor frequency.
Figure 1. Architecture of a typical swept-tuned, superheterodyne spectrum analyzer.
InputAttenuator Mixer
LocalOscillator Sweep
Display
IF Gain IF Filter VideoFilter
(VBW)(RBW)
Detector/Log Amp
3 Fluke Corporation A guide to calibrating your spectrum analyzer.
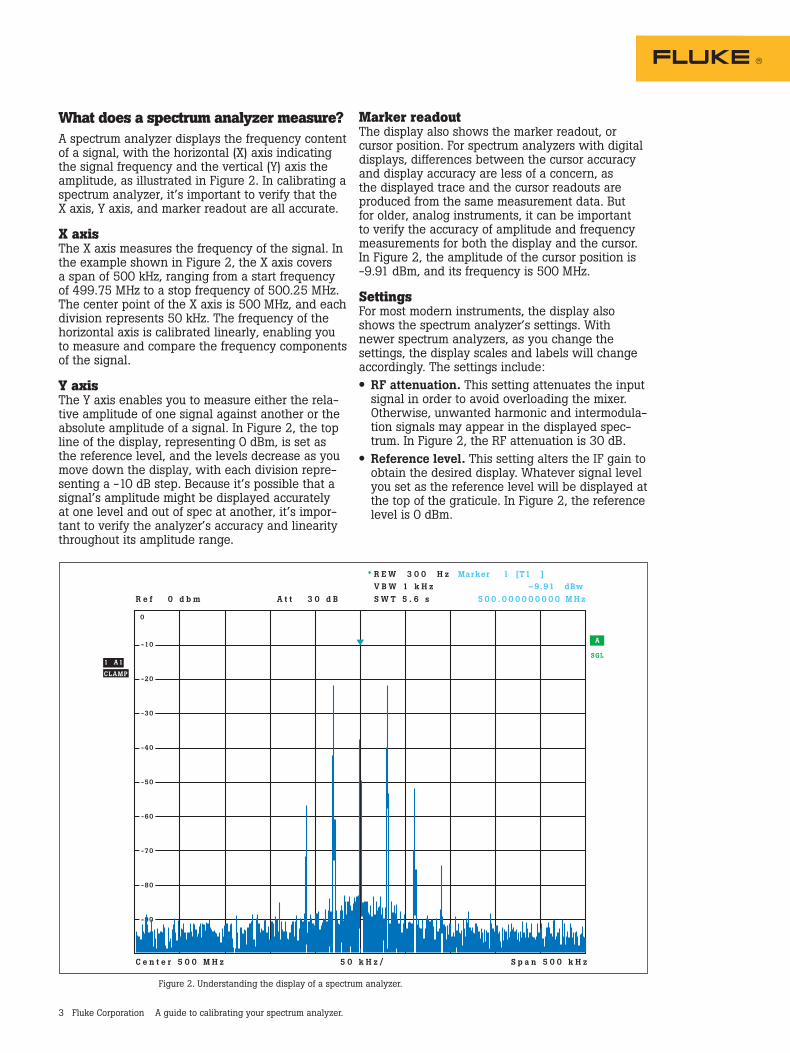
What does a spectrum analyzer measure?A spectrum analyzer displays the frequency content of a signal, with the horizontal (X) axis indicating the signal frequency and the vertical (Y) axis the amplitude, as illustrated in Figure 2. In calibrating a spectrum analyzer, it’s important to verify that the X axis, Y axis, and marker readout are all accurate.
X axisThe X axis measures the frequency of the signal. In the example shown in Figure 2, the X axis covers a span of 500 kHz, ranging from a start frequency of 499.75 MHz to a stop frequency of 500.25 MHz. The center point of the X axis is 500 MHz, and each division represents 50 kHz. The frequency of the horizontal axis is calibrated linearly, enabling you to measure and compare the frequency components of the signal.
Y axisThe Y axis enables you to measure either the rela-tive amplitude of one signal against another or the absolute amplitude of a signal. In Figure 2, the top line of the display, representing 0 dBm, is set as the reference level, and the levels decrease as you move down the display, with each division repre-senting a -10 dB step. Because it’s possible that a signal’s amplitude might be displayed accurately at one level and out of spec at another, it’s impor-tant to verify the analyzer’s accuracy and linearity throughout its amplitude range.
Marker readoutThe display also shows the marker readout, or cursor position. For spectrum analyzers with digital displays, differences between the cursor accuracy and display accuracy are less of a concern, as the displayed trace and the cursor readouts are produced from the same measurement data. But for older, analog instruments, it can be important to verify the accuracy of amplitude and frequency measurements for both the display and the cursor. In Figure 2, the amplitude of the cursor position is -9.91 dBm, and its frequency is 500 MHz.
SettingsFor most modern instruments, the display also shows the spectrum analyzer’s settings. With newer spectrum analyzers, as you change the settings, the display scales and labels will change accordingly. The settings include:
•. RF.attenuation. This setting attenuates the input signal in order to avoid overloading the mixer. Otherwise, unwanted harmonic and intermodula-tion signals may appear in the displayed spec-trum. In Figure 2, the RF attenuation is 30 dB.
•. Reference.level. This setting alters the IF gain to obtain the desired display. Whatever signal level you set as the reference level will be displayed at the top of the graticule. In Figure 2, the reference level is 0 dBm.
Figure 2. Understanding the display of a spectrum analyzer.
4 Fluke Corporation A guide to calibrating your spectrum analyzer.
•. Resolution.bandwidth. This setting (abbreviated as RBW) refers to the bandwidth of the IF filter. The smaller the filter bandwidth, the longer time it takes to complete a sweep of a signal. In Figure 2, the filter bandwidth is 300 Hz.
•. Video.bandwidth..This setting (often abbrevi-ated as VBW) determines how much the signal is filtered to remove noise after passing through the detector. The smaller the video bandwidth, the smoother the signal. In Figure 2, the video bandwidth is set to 1 kHz.
•. Sweep.time. The sweep time determines how long it takes to go from the start frequency to the stop frequency. In Figure 2, the sweep time is 5.6 seconds.
Note that the sweep time, filter bandwidth, and frequency span are all linked, in that a faster sweep time requires a wider filter bandwidth and/or a narrower span. If you speed up the sweep time without making the appropriate adjustments to the filter bandwidth and span, you could end up with a skewed and therefore false spectrum display. With newer analyzers, you set the span, filter bandwidth, and video bandwidth, and the analyzer automatically sets the appropriate sweep time. With older devices, you may have to manually adjust each setting to optimize the displayed signal of interest.
Which calibration tests are needed?While not all tests are required by all spectrum analyzer manufacturers, the following parameters represent a core set of the most frequently used tests for spectrum analyzer calibration
• Display Linearity
• Noise Floor
• Input Attenuator
• Absolute Amplitude Accuracy and Frequency Response
• Resolution Bandwidth and Selectivity
• Resolution Bandwidth Switching
• Reference Level Accuracy
• Noise Sidebands
• Residual FM
• Frequency Span Accuracy
• Sweep Time Accuracy
• Harmonic Distortion
• Third-Order Intermodulation Intercept
• Gain Compression
Although outside the scope of this application note, additional functional tests may include:
• Reference Output Accuracy
• Input Return Loss (VSWR)
• Marker Count Accuracy
• Filter Bandwidth Accuracy
• IF Gain Uncertainty
• Frequency Counter Readout Accuracy
Calibrating all of these parameters is not as daunting a task as it may seem, as it is possible to calibrate several of the core parameters with a single test equipment configuration. In fact, for many of the tests, the only equipment required is a signal generator and precision step attenuators. For the Frequency Response test, you also need a power meter and power splitters, and for the Noise Sidebands and Residual FM tests, you need to add a low phase noise signal generator.
Note that some of the tests that are outside the scope of this application note also require addi-tional test equipment. For example, to perform the Reference Output Accuracy test, in addition to the basic test equipment you would need a universal counter and power meter.
For further information on either the core tests or the additional functional tests, see the reference docu-mentation listed at the end of this application note.
The remainder of this document is devoted to describing several of the most common core tests. The top part of each diagram shows the part of the spectrum analyzer that is being tested, followed by an example of what you might see on the display, followed by the test setup.
As you review the following test descriptions, be aware that the sequence in which the tests are performed is important, as some tests rely on the analyzer performance verified in previous tests. For example, calibration of the display linearity and noise floor usually needs to take place before most of the other tests. Because different manufac-turers require different sets of tests, it’s not possible to list a single test sequence that will work in all cases, so be sure to check your user handbook to determine the proper test sequence for your spectrum analyzer.
5 Fluke Corporation A guide to calibrating your spectrum analyzer.
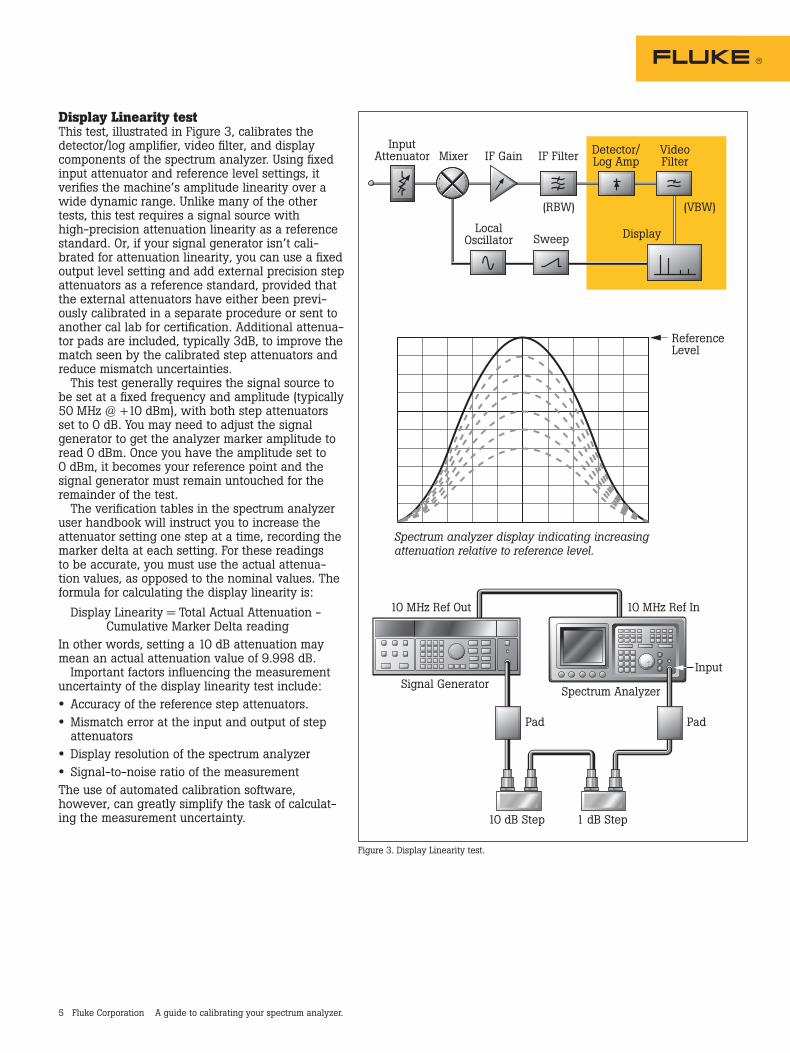
Figure 3. Display Linearity test.
InputAttenuator Mixer
LocalOscillator Sweep Display
IF Gain IF Filter VideoFilter
(VBW)(RBW)
Detector/Log Amp
Signal GeneratorSpectrum Analyzer
10 MHz Ref Out 10 MHz Ref In
10 dB Step 1 dB Step
Pad Pad
ReferenceLevel
Spectrum analyzer display indicating increasing attenuation relative to reference level.
Input
Display Linearity testThis test, illustrated in Figure 3, calibrates the detector/log amplifier, video filter, and display components of the spectrum analyzer. Using fixed input attenuator and reference level settings, it verifies the machine’s amplitude linearity over a wide dynamic range. Unlike many of the other tests, this test requires a signal source with high-precision attenuation linearity as a reference standard. Or, if your signal generator isn’t cali-brated for attenuation linearity, you can use a fixed output level setting and add external precision step attenuators as a reference standard, provided that the external attenuators have either been previ-ously calibrated in a separate procedure or sent to another cal lab for certification. Additional attenua-tor pads are included, typically 3dB, to improve the match seen by the calibrated step attenuators and reduce mismatch uncertainties.
This test generally requires the signal source to be set at a fixed frequency and amplitude (typically 50 MHz @ +10 dBm), with both step attenuators set to 0 dB. You may need to adjust the signal generator to get the analyzer marker amplitude to read 0 dBm. Once you have the amplitude set to 0 dBm, it becomes your reference point and the signal generator must remain untouched for the remainder of the test.
The verification tables in the spectrum analyzer user handbook will instruct you to increase the attenuator setting one step at a time, recording the marker delta at each setting. For these readings to be accurate, you must use the actual attenua-tion values, as opposed to the nominal values. The formula for calculating the display linearity is:
Display Linearity = Total Actual Attenuation - Cumulative Marker Delta reading In other words, setting a 10 dB attenuation may mean an actual attenuation value of 9.998 dB.
Important factors influencing the measurement uncertainty of the display linearity test include:
• Accuracy of the reference step attenuators.
• Mismatch error at the input and output of step attenuators
• Display resolution of the spectrum analyzer
• Signal-to-noise ratio of the measurementThe use of automated calibration software, however, can greatly simplify the task of calculat-ing the measurement uncertainty.
6 Fluke Corporation A guide to calibrating your spectrum analyzer.
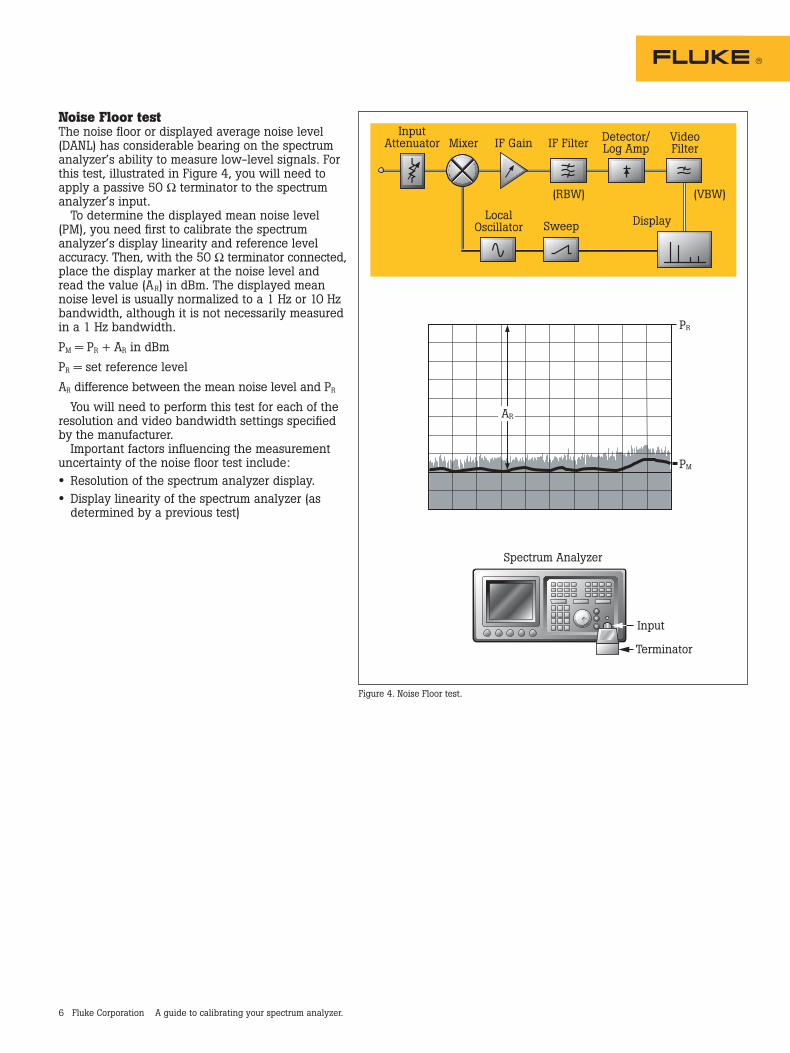
Noise Floor testThe noise floor or displayed average noise level (DANL) has considerable bearing on the spectrum analyzer’s ability to measure low-level signals. For this test, illustrated in Figure 4, you will need to apply a passive 50 W terminator to the spectrum analyzer’s input.
To determine the displayed mean noise level (PM), you need first to calibrate the spectrum analyzer’s display linearity and reference level accuracy. Then, with the 50 W terminator connected, place the display marker at the noise level and read the value (AR) in dBm. The displayed mean noise level is usually normalized to a 1 Hz or 10 Hz bandwidth, although it is not necessarily measured in a 1 Hz bandwidth.
PM = PR + AR in dBm
PR = set reference level
AR difference between the mean noise level and PR
You will need to perform this test for each of the resolution and video bandwidth settings specified by the manufacturer.
Important factors influencing the measurement uncertainty of the noise floor test include:
• Resolution of the spectrum analyzer display.
• Display linearity of the spectrum analyzer (as determined by a previous test)
Figure 4. Noise Floor test.
InputAttenuator Mixer
LocalOscillator Sweep Display
IF Gain IF Filter VideoFilter
(VBW)(RBW)
Detector/Log Amp
PR
PM
AR
Spectrum Analyzer
Terminator
Input
7 Fluke Corporation A guide to calibrating your spectrum analyzer.
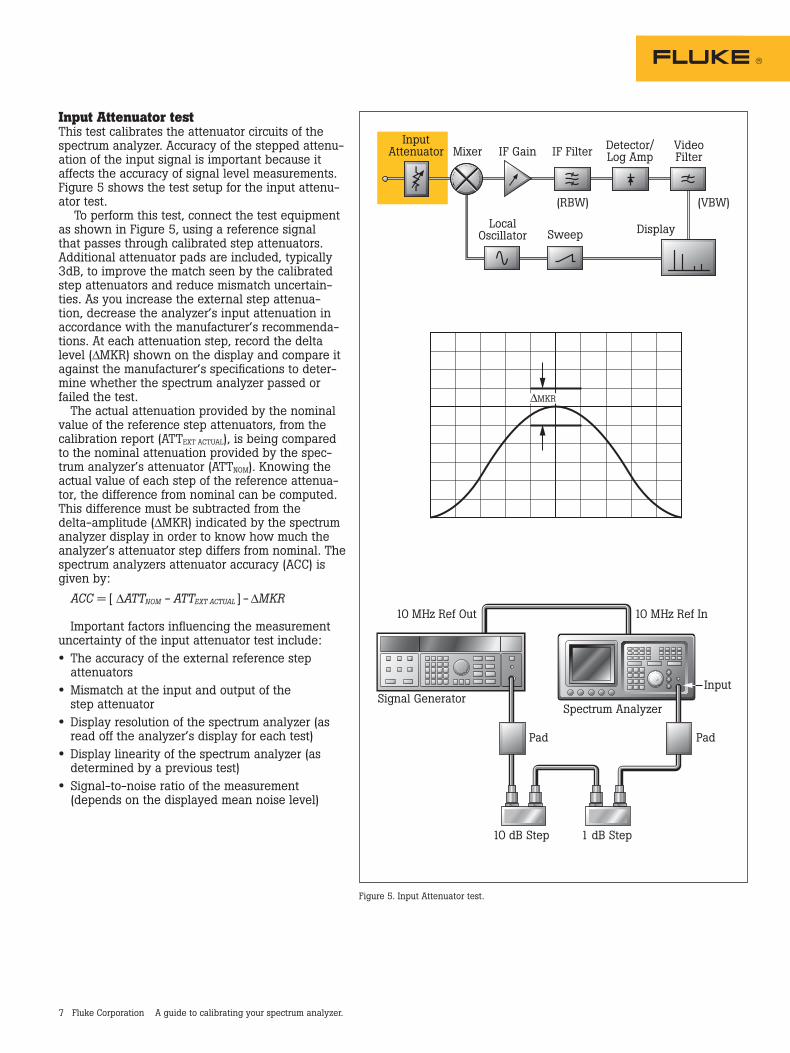
Input Attenuator testThis test calibrates the attenuator circuits of the spectrum analyzer. Accuracy of the stepped attenu-ation of the input signal is important because it affects the accuracy of signal level measurements. Figure 5 shows the test setup for the input attenu-ator test.
To perform this test, connect the test equipment as shown in Figure 5, using a reference signal that passes through calibrated step attenuators. Additional attenuator pads are included, typically 3dB, to improve the match seen by the calibrated step attenuators and reduce mismatch uncertain-ties. As you increase the external step attenua-tion, decrease the analyzer’s input attenuation in accordance with the manufacturer’s recommenda-tions. At each attenuation step, record the delta level (DMKR) shown on the display and compare it against the manufacturer’s specifications to deter-mine whether the spectrum analyzer passed or failed the test.
The actual attenuation provided by the nominal value of the reference step attenuators, from the calibration report (ATTEXT ACTUAL), is being compared to the nominal attenuation provided by the spec-trum analyzer’s attenuator (ATTNOM). Knowing the actual value of each step of the reference attenua-tor, the difference from nominal can be computed. This difference must be subtracted from the delta-amplitude (DMKR) indicated by the spectrum analyzer display in order to know how much the analyzer’s attenuator step differs from nominal. The spectrum analyzers attenuator accuracy (ACC) is given by:
ACC = [ DATTNOM - ATTEXT ACTUAL ] - DMKR Important factors influencing the measurement
uncertainty of the input attenuator test include:
• The accuracy of the external reference step attenuators
• Mismatch at the input and output of the step attenuator
• Display resolution of the spectrum analyzer (as read off the analyzer’s display for each test)
• Display linearity of the spectrum analyzer (as determined by a previous test)
• Signal-to-noise ratio of the measurement (depends on the displayed mean noise level)
Figure 5. Input Attenuator test.
InputAttenuator Mixer
LocalOscillator Sweep Display
IF Gain IF Filter VideoFilter
(VBW)(RBW)
Detector/Log Amp
Signal GeneratorSpectrum Analyzer
10 MHz Ref Out 10 MHz Ref In
10 dB Step 1 dB Step
Pad Pad
∆MKR
Input
8 Fluke Corporation A guide to calibrating your spectrum analyzer.
InputAttenuator Mixer
LocalOscillator Sweep Display
IF Gain IF Filter VideoFilter
(VBW)(RBW)
Detector/Log Amp
ReferenceLine
LevelDeviation
Adapter
Power Splitter
“Reference”Power Sensor
“Buried”Power Sensor
Output Input
Input
Input
Signal/Level GeneratorSpectrum Analyzer
RF Power Meter
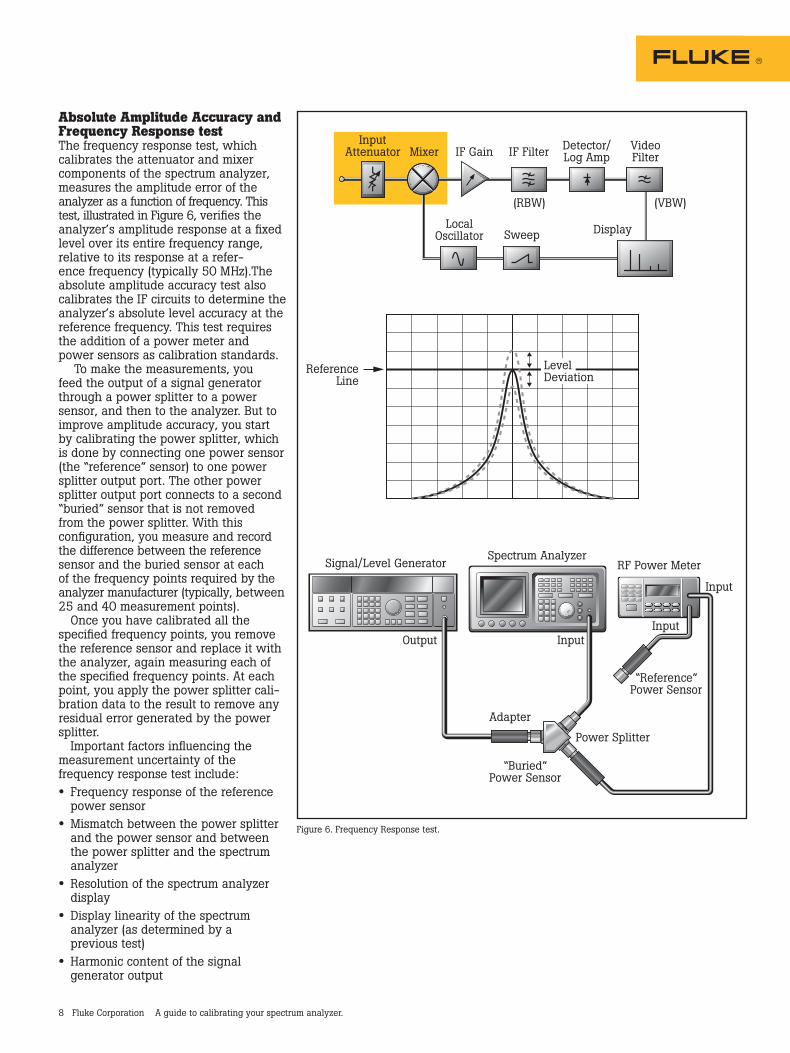
Absolute Amplitude Accuracy and Frequency Response testThe frequency response test, which calibrates the attenuator and mixer components of the spectrum analyzer, measures the amplitude error of the analyzer as a function of frequency. This test, illustrated in Figure 6, verifies the analyzer’s amplitude response at a fixed level over its entire frequency range, relative to its response at a refer-ence frequency (typically 50 MHz).The absolute amplitude accuracy test also calibrates the IF circuits to determine the analyzer’s absolute level accuracy at the reference frequency. This test requires the addition of a power meter and power sensors as calibration standards.
To make the measurements, you feed the output of a signal generator through a power splitter to a power sensor, and then to the analyzer. But to improve amplitude accuracy, you start by calibrating the power splitter, which is done by connecting one power sensor (the “reference” sensor) to one power splitter output port. The other power splitter output port connects to a second “buried” sensor that is not removed from the power splitter. With this configuration, you measure and record the difference between the reference sensor and the buried sensor at each of the frequency points required by the analyzer manufacturer (typically, between 25 and 40 measurement points).
Once you have calibrated all the specified frequency points, you remove the reference sensor and replace it with the analyzer, again measuring each of the specified frequency points. At each point, you apply the power splitter cali-bration data to the result to remove any residual error generated by the power splitter.
Important factors influencing the measurement uncertainty of the frequency response test include:
• Frequency response of the reference power sensor
• Mismatch between the power splitter and the power sensor and between the power splitter and the spectrum analyzer
• Resolution of the spectrum analyzer display
• Display linearity of the spectrum analyzer (as determined by a previous test)
• Harmonic content of the signal generator output
Figure 6. Frequency Response test.
9 Fluke Corporation A guide to calibrating your spectrum analyzer.
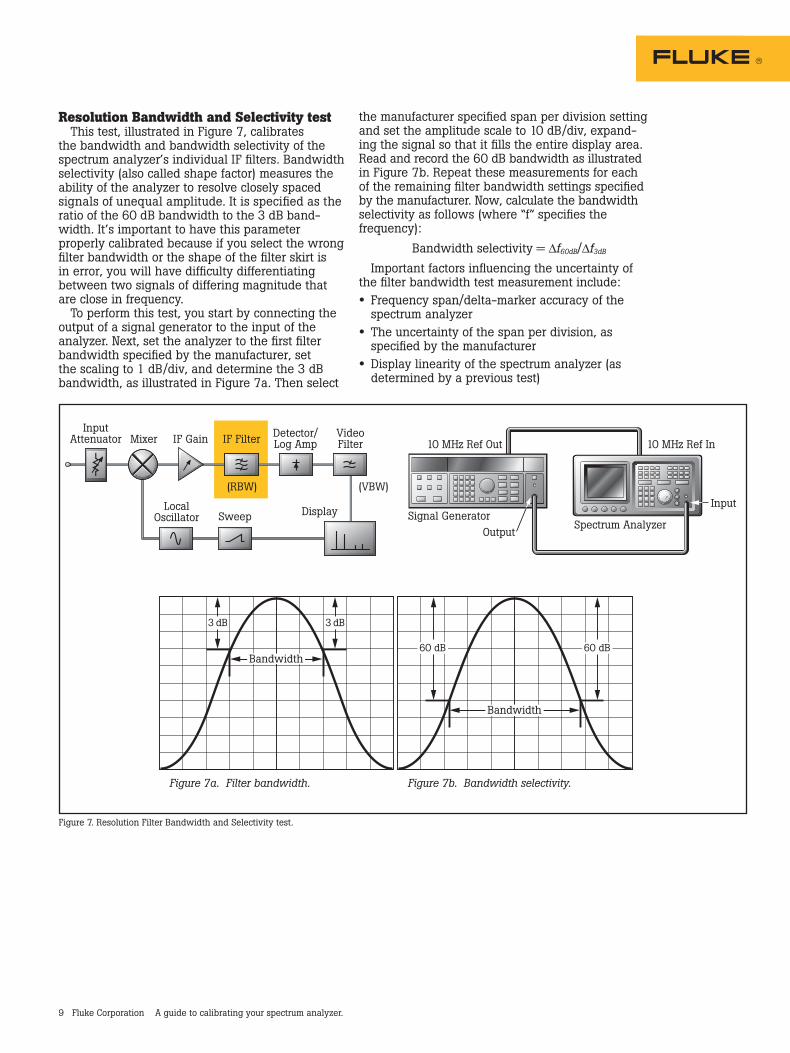
Resolution Bandwidth and Selectivity testThis test, illustrated in Figure 7, calibrates
the bandwidth and bandwidth selectivity of the spectrum analyzer’s individual IF filters. Bandwidth selectivity (also called shape factor) measures the ability of the analyzer to resolve closely spaced signals of unequal amplitude. It is specified as the ratio of the 60 dB bandwidth to the 3 dB band-width. It’s important to have this parameter properly calibrated because if you select the wrong filter bandwidth or the shape of the filter skirt is in error, you will have difficulty differentiating between two signals of differing magnitude that are close in frequency.
To perform this test, you start by connecting the output of a signal generator to the input of the analyzer. Next, set the analyzer to the first filter bandwidth specified by the manufacturer, set the scaling to 1 dB/div, and determine the 3 dB bandwidth, as illustrated in Figure 7a. Then select
InputAttenuator Mixer
LocalOscillator Sweep Display
IF Gain IF Filter VideoFilter
(VBW)(RBW)
Detector/Log Amp
Figure 7a. Filter bandwidth.
Bandwidth
Figure 7b. Bandwidth selectivity.
Bandwidth
3 dB
60 dB
3 dB
60 dB
Signal GeneratorSpectrum Analyzer
10 MHz Ref Out 10 MHz Ref In
Input
Output
the manufacturer specified span per division setting and set the amplitude scale to 10 dB/div, expand-ing the signal so that it fills the entire display area. Read and record the 60 dB bandwidth as illustrated in Figure 7b. Repeat these measurements for each of the remaining filter bandwidth settings specified by the manufacturer. Now, calculate the bandwidth selectivity as follows (where “f” specifies the frequency):
Bandwidth selectivity = Df60dB/Df3dB
Important factors influencing the uncertainty of the filter bandwidth test measurement include:
• Frequency span/delta-marker accuracy of the spectrum analyzer
• The uncertainty of the span per division, as specified by the manufacturer
• Display linearity of the spectrum analyzer (as determined by a previous test)
Figure 7. Resolution Filter Bandwidth and Selectivity test.
10 Fluke Corporation A guide to calibrating your spectrum analyzer.
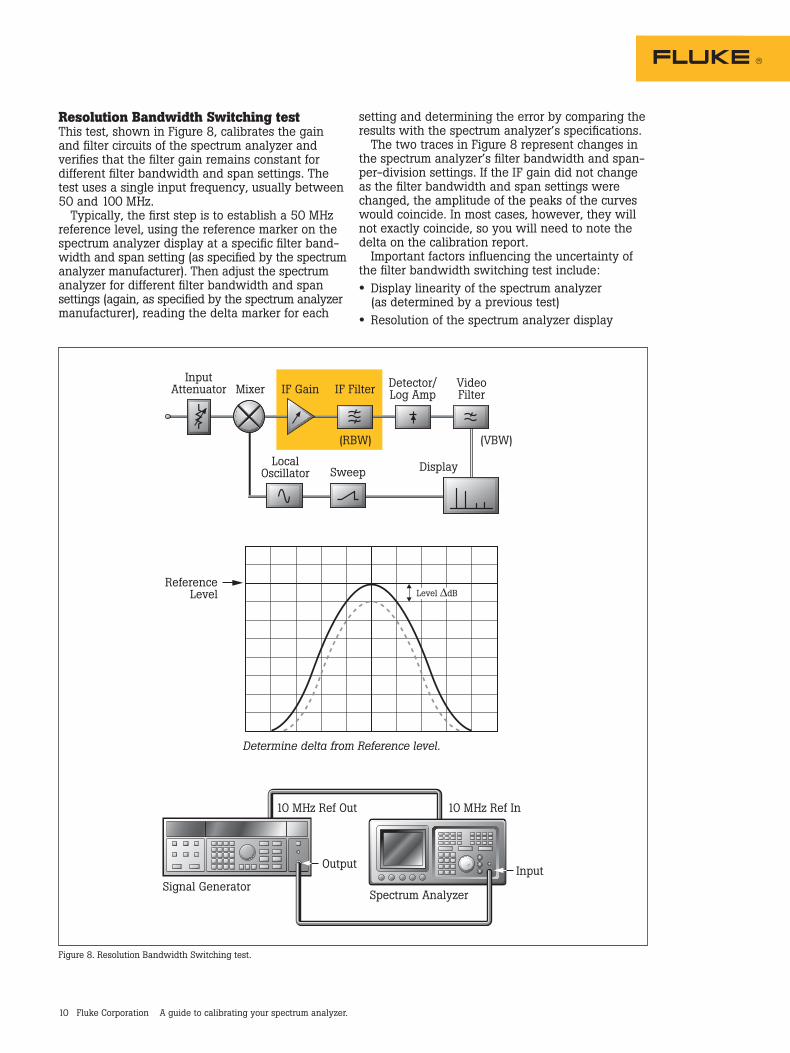
Resolution Bandwidth Switching testThis test, shown in Figure 8, calibrates the gain and filter circuits of the spectrum analyzer and verifies that the filter gain remains constant for different filter bandwidth and span settings. The test uses a single input frequency, usually between 50 and 100 MHz.
Typically, the first step is to establish a 50 MHz reference level, using the reference marker on the spectrum analyzer display at a specific filter band- width and span setting (as specified by the spectrum analyzer manufacturer). Then adjust the spectrum analyzer for different filter bandwidth and span settings (again, as specified by the spectrum analyzer manufacturer), reading the delta marker for each
InputAttenuator Mixer
LocalOscillator Sweep Display
IF Gain IF Filter VideoFilter
(VBW)(RBW)
Detector/Log Amp
Signal GeneratorSpectrum Analyzer
10 MHz Ref Out 10 MHz Ref In
Determine delta from Reference level.
InputOutput
ReferenceLevel Level ∆dB
Figure 8. Resolution Bandwidth Switching test.
setting and determining the error by comparing the results with the spectrum analyzer’s specifications.
The two traces in Figure 8 represent changes in the spectrum analyzer’s filter bandwidth and span-per-division settings. If the IF gain did not change as the filter bandwidth and span settings were changed, the amplitude of the peaks of the curves would coincide. In most cases, however, they will not exactly coincide, so you will need to note the delta on the calibration report.
Important factors influencing the uncertainty of the filter bandwidth switching test include:
• Display linearity of the spectrum analyzer (as determined by a previous test)
• Resolution of the spectrum analyzer display
11 Fluke Corporation A guide to calibrating your spectrum analyzer.
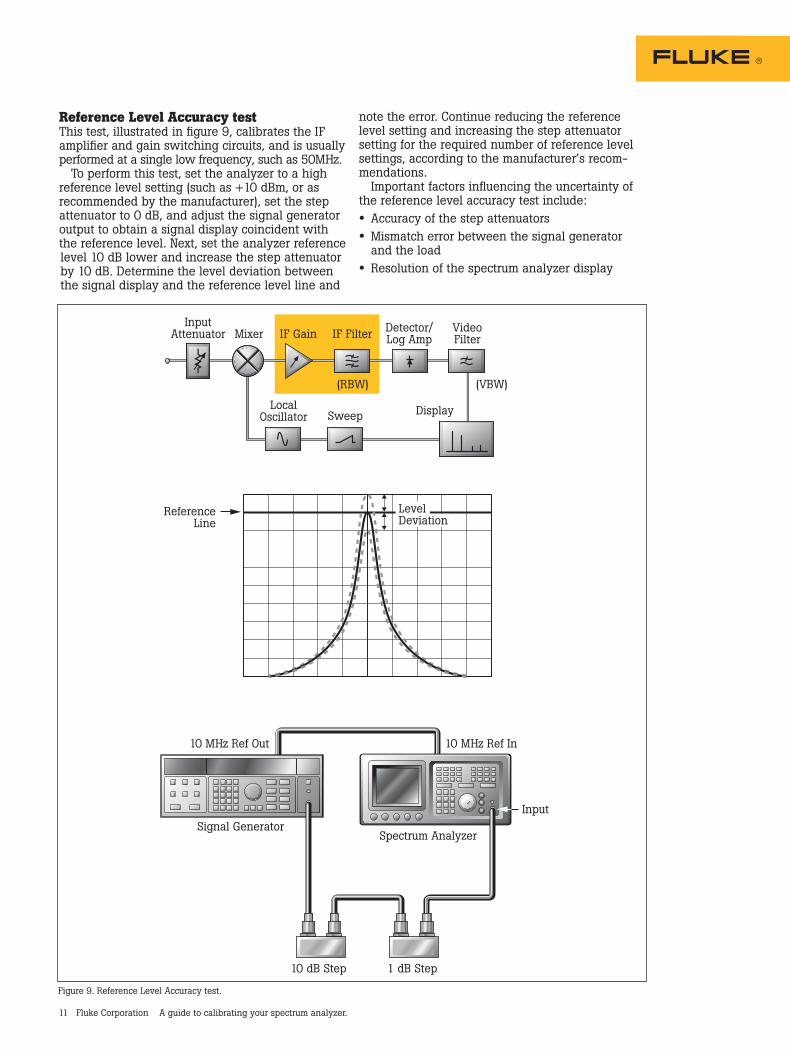
Reference Level Accuracy testThis test, illustrated in figure 9, calibrates the IF amplifier and gain switching circuits, and is usually performed at a single low frequency, such as 50MHz.
To perform this test, set the analyzer to a high reference level setting (such as +10 dBm, or as recommended by the manufacturer), set the step attenuator to 0 dB, and adjust the signal generator output to obtain a signal display coincident with the reference level. Next, set the analyzer reference level 10 dB lower and increase the step attenuator by 10 dB. Determine the level deviation between the signal display and the reference level line and
note the error. Continue reducing the reference level setting and increasing the step attenuator setting for the required number of reference level settings, according to the manufacturer’s recom-mendations.
Important factors influencing the uncertainty of the reference level accuracy test include:
• Accuracy of the step attenuators
• Mismatch error between the signal generator and the load
• Resolution of the spectrum analyzer display
InputAttenuator Mixer
LocalOscillator Sweep Display
IF Gain IF Filter VideoFilter
(VBW)(RBW)
Detector/Log Amp
Signal GeneratorSpectrum Analyzer
10 MHz Ref Out 10 MHz Ref In
10 dB Step 1 dB Step
Input
ReferenceLine
LevelDeviation
Figure 9. Reference Level Accuracy test.
12 Fluke Corporation A guide to calibrating your spectrum analyzer.
InputAttenuator Mixer
LocalOscillator Sweep Display
IF Gain IF Filter VideoFilter
(VBW)(RBW)
Detector/Log Amp
Signal GeneratorSpectrum Analyzer
10 MHz Ref Out 10 MHz Ref In
InputOutput
dBc
∆f
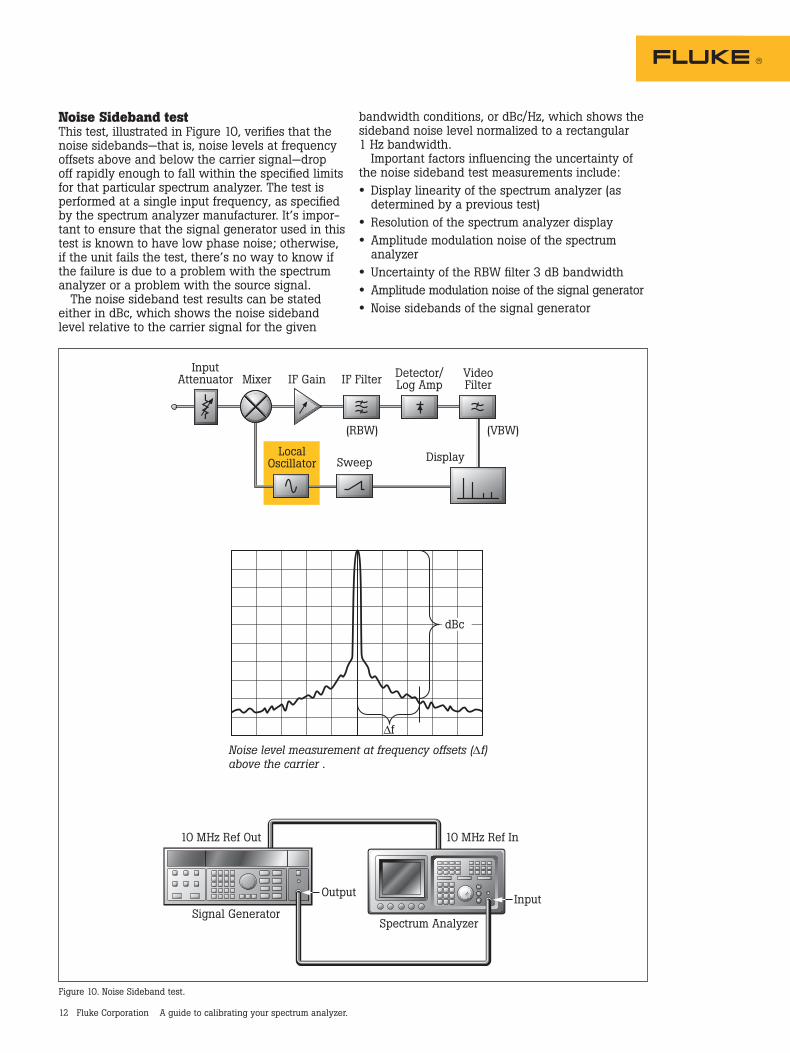
Noise level measurement at frequency offsets (∆f)above the carrier .
Noise Sideband testThis test, illustrated in Figure 10, verifies that the noise sidebands—that is, noise levels at frequency offsets above and below the carrier signal—drop off rapidly enough to fall within the specified limits for that particular spectrum analyzer. The test is performed at a single input frequency, as specified by the spectrum analyzer manufacturer. It’s impor-tant to ensure that the signal generator used in this test is known to have low phase noise; otherwise, if the unit fails the test, there’s no way to know if the failure is due to a problem with the spectrum analyzer or a problem with the source signal.
The noise sideband test results can be stated either in dBc, which shows the noise sideband level relative to the carrier signal for the given
Figure 10. Noise Sideband test.
bandwidth conditions, or dBc/Hz, which shows the sideband noise level normalized to a rectangular 1 Hz bandwidth.
Important factors influencing the uncertainty of the noise sideband test measurements include:
• Display linearity of the spectrum analyzer (as determined by a previous test)
• Resolution of the spectrum analyzer display
• Amplitude modulation noise of the spectrum analyzer
• Uncertainty of the RBW filter 3 dB bandwidth
• Amplitude modulation noise of the signal generator
• Noise sidebands of the signal generator
13 Fluke Corporation A guide to calibrating your spectrum analyzer.
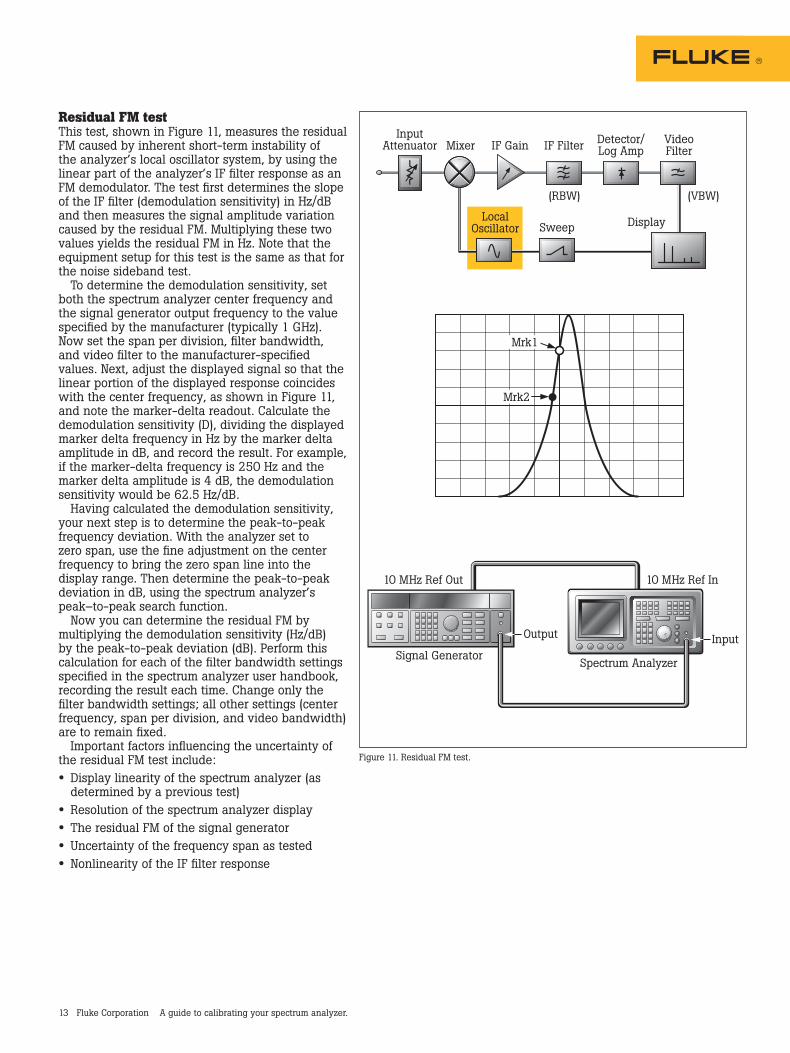
Residual FM testThis test, shown in Figure 11, measures the residual FM caused by inherent short-term instability of the analyzer’s local oscillator system, by using the linear part of the analyzer’s IF filter response as an FM demodulator. The test first determines the slope of the IF filter (demodulation sensitivity) in Hz/dB and then measures the signal amplitude variation caused by the residual FM. Multiplying these two values yields the residual FM in Hz. Note that the equipment setup for this test is the same as that for the noise sideband test.
To determine the demodulation sensitivity, set both the spectrum analyzer center frequency and the signal generator output frequency to the value specified by the manufacturer (typically 1 GHz). Now set the span per division, filter bandwidth, and video filter to the manufacturer-specified values. Next, adjust the displayed signal so that the linear portion of the displayed response coincides with the center frequency, as shown in Figure 11, and note the marker-delta readout. Calculate the demodulation sensitivity (D), dividing the displayed marker delta frequency in Hz by the marker delta amplitude in dB, and record the result. For example, if the marker-delta frequency is 250 Hz and the marker delta amplitude is 4 dB, the demodulation sensitivity would be 62.5 Hz/dB.
Having calculated the demodulation sensitivity, your next step is to determine the peak-to-peak frequency deviation. With the analyzer set to zero span, use the fine adjustment on the center frequency to bring the zero span line into the display range. Then determine the peak-to-peak deviation in dB, using the spectrum analyzer’s peak–to-peak search function.
Now you can determine the residual FM by multiplying the demodulation sensitivity (Hz/dB) by the peak-to-peak deviation (dB). Perform this calculation for each of the filter bandwidth settings specified in the spectrum analyzer user handbook, recording the result each time. Change only the filter bandwidth settings; all other settings (center frequency, span per division, and video bandwidth) are to remain fixed.
Important factors influencing the uncertainty of the residual FM test include:
• Display linearity of the spectrum analyzer (as determined by a previous test)
• Resolution of the spectrum analyzer display
• The residual FM of the signal generator
• Uncertainty of the frequency span as tested
• Nonlinearity of the IF filter response
Figure 11. Residual FM test.
InputAttenuator Mixer
LocalOscillator Sweep Display
IF Gain IF Filter VideoFilter
(VBW)(RBW)
Detector/Log Amp
Mrk1
Mrk2
Signal GeneratorSpectrum Analyzer
10 MHz Ref Out 10 MHz Ref In
InputOutput
14 Fluke Corporation A guide to calibrating your spectrum analyzer.
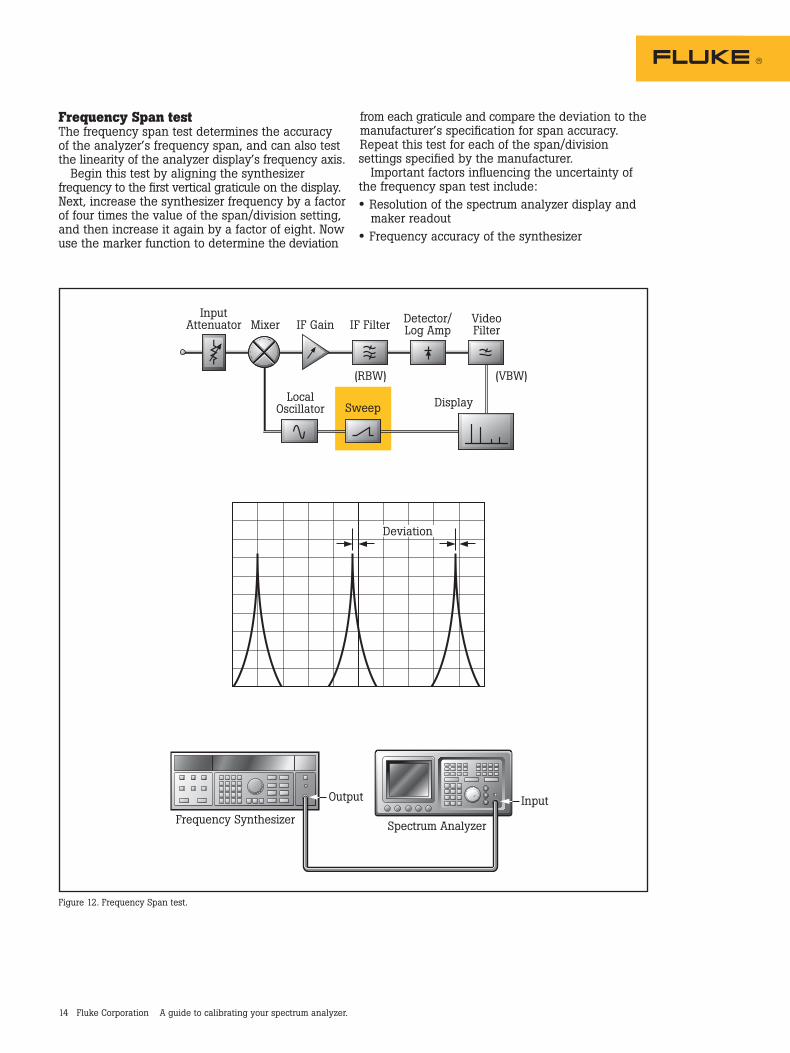
Frequency Span testThe frequency span test determines the accuracy of the analyzer’s frequency span, and can also test the linearity of the analyzer display’s frequency axis.
Begin this test by aligning the synthesizer frequency to the first vertical graticule on the display. Next, increase the synthesizer frequency by a factor of four times the value of the span/division setting, and then increase it again by a factor of eight. Now use the marker function to determine the deviation
Figure 12. Frequency Span test.
Frequency Synthesizer Spectrum Analyzer
InputOutput
Deviation
Input Attenuator Mixer
Local Oscillator Sweep Display
IF Gain IF Filter Video Filter
(VBW) (RBW)
Detector/ Log Amp
from each graticule and compare the deviation to the manufacturer’s specification for span accuracy. Repeat this test for each of the span/division settings specified by the manufacturer.
Important factors influencing the uncertainty of the frequency span test include:
• Resolution of the spectrum analyzer display and maker readout
• Frequency accuracy of the synthesizer
15 Fluke Corporation A guide to calibrating your spectrum analyzer.
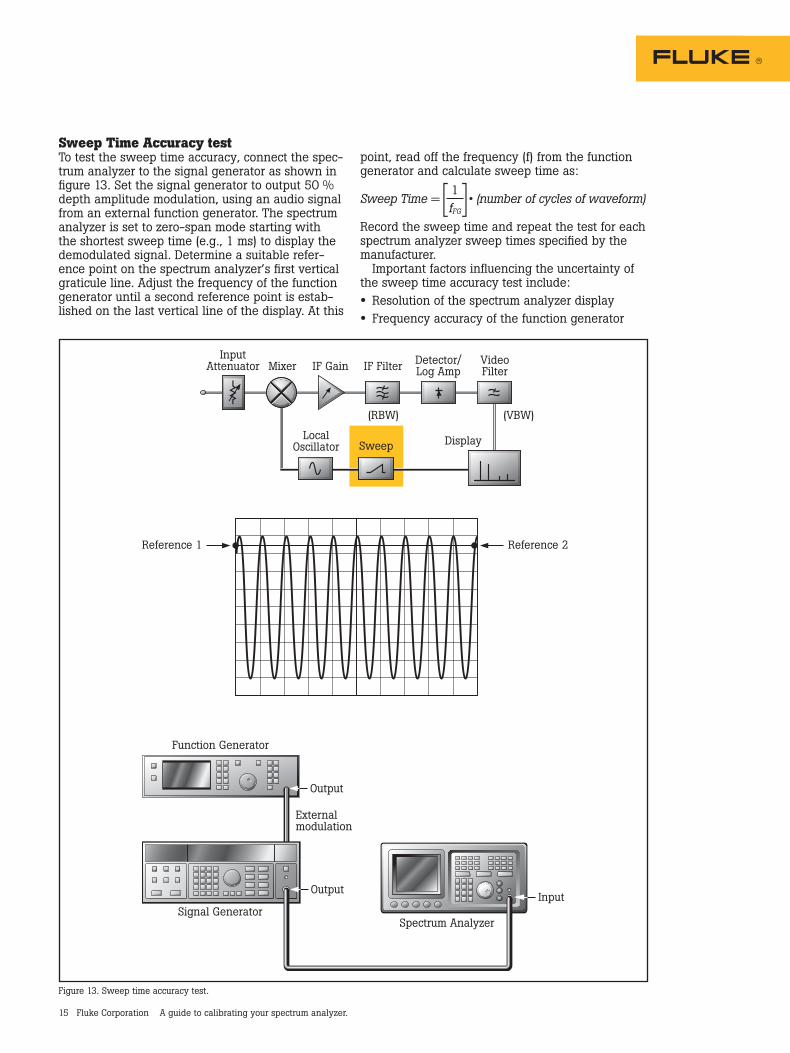
point, read off the frequency (f) from the function generator and calculate sweep time as:
Sweep Time = • (number of cycles of waveform)
Record the sweep time and repeat the test for each spectrum analyzer sweep times specified by the manufacturer.
Important factors influencing the uncertainty of the sweep time accuracy test include:
• Resolution of the spectrum analyzer display
• Frequency accuracy of the function generator
Figure 13. Sweep time accuracy test.
Signal Generator
Externalmodulation
Function Generator
Spectrum Analyzer
InputOutput
Reference 1 Reference 2
Output
InputAttenuator Mixer
LocalOscillator Sweep Display
IF Gain IF Filter VideoFilter
(VBW)(RBW)
Detector/Log Amp
Sweep Time Accuracy testTo test the sweep time accuracy, connect the spec-trum analyzer to the signal generator as shown in figure 13. Set the signal generator to output 50 % depth amplitude modulation, using an audio signal from an external function generator. The spectrum analyzer is set to zero-span mode starting with the shortest sweep time (e.g., 1 ms) to display the demodulated signal. Determine a suitable refer-ence point on the spectrum analyzer’s first vertical graticule line. Adjust the frequency of the function generator until a second reference point is estab-lished on the last vertical line of the display. At this
1fFG[ ]
16 Fluke Corporation A guide to calibrating your spectrum analyzer.
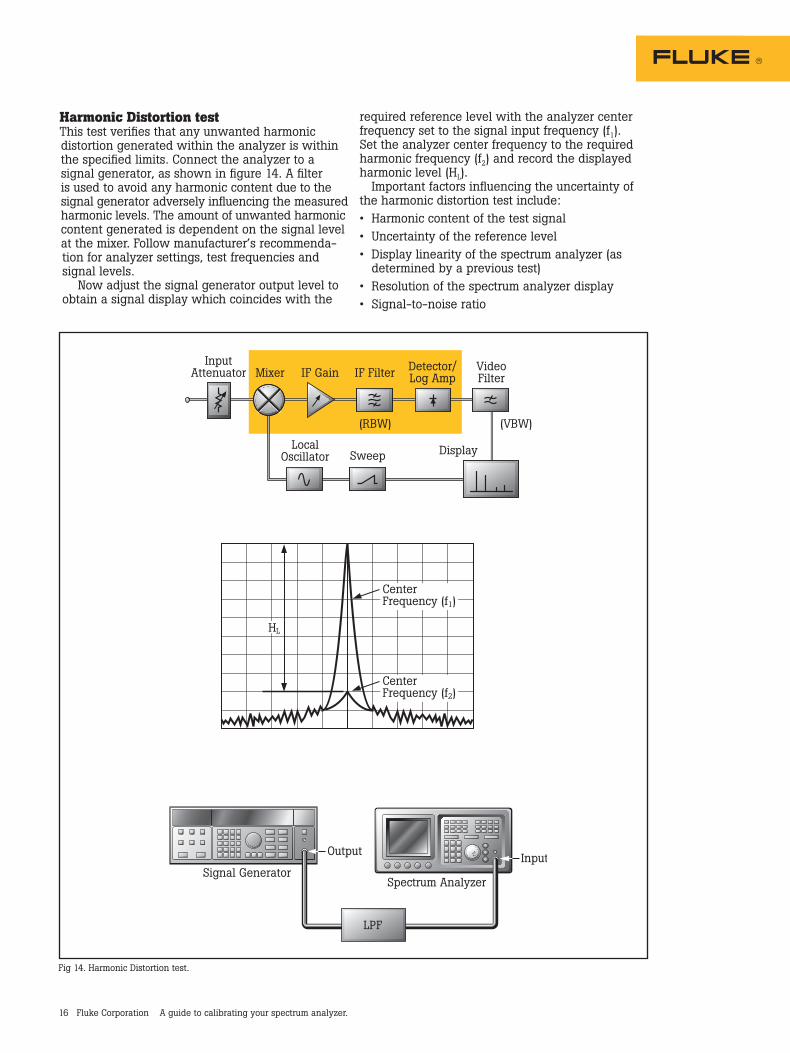
Harmonic Distortion testThis test verifies that any unwanted harmonic distortion generated within the analyzer is within the specified limits. Connect the analyzer to a signal generator, as shown in figure 14. A filter is used to avoid any harmonic content due to the signal generator adversely influencing the measured harmonic levels. The amount of unwanted harmonic content generated is dependent on the signal level at the mixer. Follow manufacturer’s recommenda-tion for analyzer settings, test frequencies and signal levels.
Now adjust the signal generator output level to obtain a signal display which coincides with the
Signal GeneratorSpectrum Analyzer
LPF
InputOutput
HL
CenterFrequency (f1)
CenterFrequency (f2)
InputAttenuator Mixer
LocalOscillator Sweep Display
IF Gain IF Filter VideoFilter
(VBW)(RBW)
Detector/Log Amp
Fig 14. Harmonic Distortion test.
required reference level with the analyzer center frequency set to the signal input frequency (f1). Set the analyzer center frequency to the required harmonic frequency (f2) and record the displayed harmonic level (HL).
Important factors influencing the uncertainty of the harmonic distortion test include:• Harmonic content of the test signal• Uncertainty of the reference level• Display linearity of the spectrum analyzer (as
determined by a previous test)• Resolution of the spectrum analyzer display• Signal-to-noise ratio
17 Fluke Corporation A guide to calibrating your spectrum analyzer.
InputAttenuator Mixer
LocalOscillator Sweep Display
IF Gain IF Filter VideoFilter
(VBW)(RBW)
Detector/Log Amp
f1 f2
IR3
2f2-f1
2f1-f2
Power Coupler
Output Input
Signal Generator 1
Output
Signal Generator 2
Spectrum Analyzer
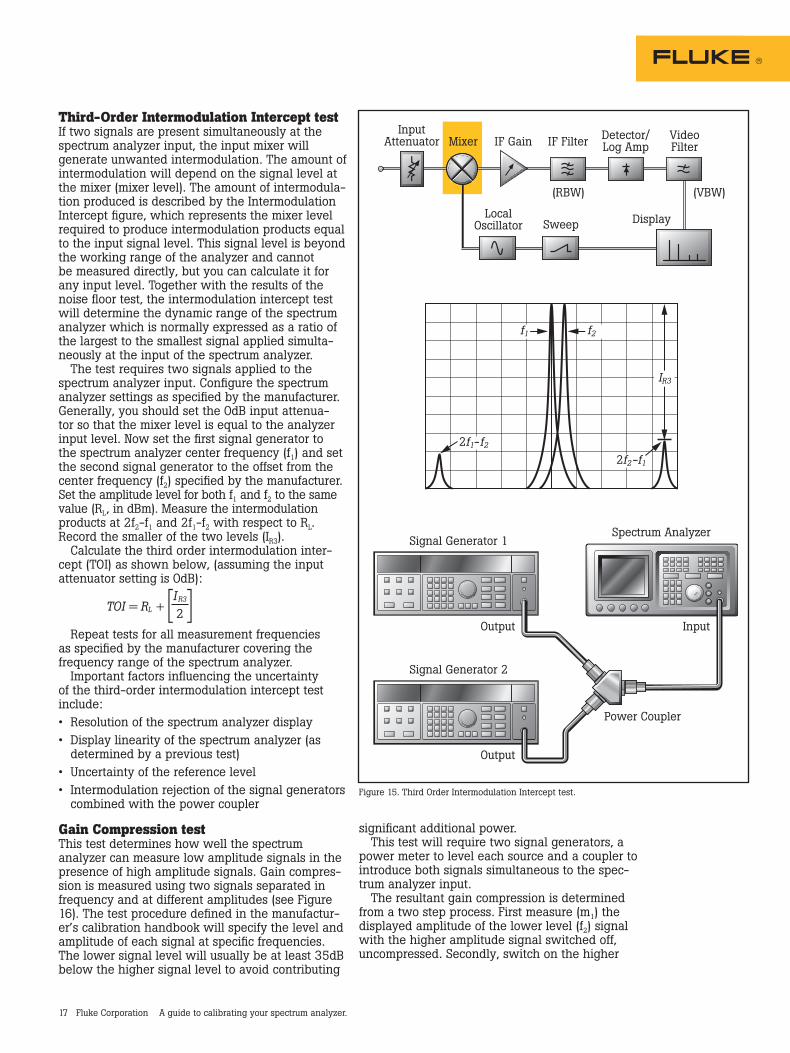
Figure 15. Third Order Intermodulation Intercept test.
Third-Order Intermodulation Intercept testIf two signals are present simultaneously at the spectrum analyzer input, the input mixer will generate unwanted intermodulation. The amount of intermodulation will depend on the signal level at the mixer (mixer level). The amount of intermodula-tion produced is described by the Intermodulation Intercept figure, which represents the mixer level required to produce intermodulation products equal to the input signal level. This signal level is beyond the working range of the analyzer and cannot be measured directly, but you can calculate it for any input level. Together with the results of the noise floor test, the intermodulation intercept test will determine the dynamic range of the spectrum analyzer which is normally expressed as a ratio of the largest to the smallest signal applied simulta-neously at the input of the spectrum analyzer.
The test requires two signals applied to the spectrum analyzer input. Configure the spectrum analyzer settings as specified by the manufacturer. Generally, you should set the 0dB input attenua-tor so that the mixer level is equal to the analyzer input level. Now set the first signal generator to the spectrum analyzer center frequency (f1) and set the second signal generator to the offset from the center frequency (f2) specified by the manufacturer. Set the amplitude level for both f1 and f2 to the same value (RL, in dBm). Measure the intermodulation products at 2f2-f1 and 2f1-f2 with respect to RL. Record the smaller of the two levels (IR3).
Calculate the third order intermodulation inter-cept (TOI) as shown below, (assuming the input attenuator setting is 0dB):
TOI = RL +
Repeat tests for all measurement frequencies as specified by the manufacturer covering the frequency range of the spectrum analyzer.
Important factors influencing the uncertainty of the third-order intermodulation intercept test include:• Resolution of the spectrum analyzer display• Display linearity of the spectrum analyzer (as
determined by a previous test)• Uncertainty of the reference level• Intermodulation rejection of the signal generators
combined with the power coupler
Gain Compression testThis test determines how well the spectrum analyzer can measure low amplitude signals in the presence of high amplitude signals. Gain compres-sion is measured using two signals separated in frequency and at different amplitudes (see Figure 16). The test procedure defined in the manufactur-er’s calibration handbook will specify the level and amplitude of each signal at specific frequencies. The lower signal level will usually be at least 35dB below the higher signal level to avoid contributing
[ ]I R3
2
significant additional power. This test will require two signal generators, a
power meter to level each source and a coupler to introduce both signals simultaneous to the spec-trum analyzer input.
The resultant gain compression is determined from a two step process. First measure (m1) the displayed amplitude of the lower level (f2) signal with the higher amplitude signal switched off, uncompressed. Secondly, switch on the higher

18 Fluke Corporation A guide to calibrating your spectrum analyzer.
Fluke Corporation PO Box 9090, Everett, WA USA 98206
Fluke Europe B.V. PO Box 1186, 5602 BD Eindhoven, The Netherlands
For more information call: In the U.S.A. (800) 443-5853 or Fax (425) 446-5116 In Europe/M-East/Africa +31 (0)40 2 675 200 or Fax +31 (0)40 2 675 222 In Canada (800) 36-FLUKE or Fax (905) 890-6866 From other countries +1 (425) 446-5500 or Fax +1 (425) 446-5116 Web access: http://www.fluke.com
©2006 Fluke Corporation. All rights reserved. Printed in U.S.A. 9/2006 2519570 A-EN-N Rev B
Pub_ID 11048 eng. Rev 02
Fluke. Keeping your world up and running.
Manual vs. automatic testingWhile all of the above tests can be performed manually, many of them are repetitive and use the same test configuration performed at different spec-trum analyzer settings, requiring many man-hours of repetitive effort. The calibration task is much more efficient when performed using automated calibra-tion software, such as Fluke MET/CAL® automated metrology software. Using MET/CAL software will improve control over the instrument, automati-cally determine pass/fail status, and automatically calculate measurement uncertainty, saving you a substantial amount of time while improving measurement repeatability. For more information about MET/CAL software and the availability of spectrum analyzer procedures, go to www.fluke.com or contact your local Fluke representative.
ConclusionWe began this paper by stating that spectrum analyzer calibration is perceived as complex and time consuming. This is true for those who are not familiar with the task, or who perform the tests manually. However, with careful selection of refer-ence standards (i.e., making sure to select those that incorporate the correct signal characteristics), an understanding of the factors that influence measurement uncertainty, and the help of auto-mated calibration software, the task of producing a calibration report is well within reach of most cali-bration labs. By calibrating your spectrum analyzer at the intervals specified by the manufacturer, you can ensure that its measurements are accurate and that the electronic equipment that you test with it will perform within specification.
ReferencesAgilent Technologies Application Note 150, “Spectrum Analysis Basics”
VDI/VDE/DGQ/DKD 2622, “Calibration of measuring equipment for electrical quantities: Spectrum Analyzer.”
InputAttenuator Mixer
LocalOscillator Sweep Display
IF Gain IF Filter VideoFilter
(VBW)(RBW)
Detector/Log Amp
f1
f2
m2
m1
∆
Power Coupler
Output Input
Signal Generator 1
Output
Signal Generator 2
Spectrum Analyzer
Figure 16. Gain Compression test.
level (f1) signal and again measure (m2) the displayed lower amplitude, compressed. The difference between the uncompressed and compressed measurements is the resultant gain compression and is compared with the spectrum analyzer Gain Compression specifications.
Important factors influencing the uncertainty of the gain compression test include:
• Resolution of the spectrum analyzer display
• Display linearity of the spectrum analyzer (as determined by a previous test)
• Uncertainty of the reference level