a global perspective on food allergens · pdf fileelisa systems: casein ... allergen elisa...
TRANSCRIPT

A GLOBAL PERSPECTIVEON FOOD ALLERGENS
Steve L. Taylor, Ph.D.Food Allergy Research & Resource Program
University of [email protected]
www.farrp.org
Perspectives Require Historical Context
For the worldwide food industry, the allergen issue emerged slowly at first beginning in late 1980s in several countries but had become a major public health focus in several countries by the late 1990sAwareness in the public health agencies began to emerge also in the late 1980s
Food Allergy Research and Resource Program © 2011
Food Allergy Research and Resource Program © 2011
U.S. – Chaos (1988-late 1990s)8 deaths reported from food allergies by Mayo Clinic group in 1988 – JAMAFAAN formed in 199112 deaths and near-deaths reported by Johns Hopkins group in 1992 – NEJMFDA recalls for undeclared allergensbegin in earnest in 1992FDA Notice to Manufacturers in 1996FDA Compliance Policy Guide in 2001FDA Guide to Inspections in 2001
Food Allergy Research and Resource Program © 2011
International ChaosCanada leads the way from late 1980’s– Severe reaction at food industry party
Industry group produces Allergy Beware video– Several highly publicized deaths from peanuts
Sabrina’s Law in Ontario– CFIA begins to initiate recalls– CFIA institutes “may contain” labeling– Schools ban peanuts
Food Allergy Research and Resource Program © 2011
International ChaosSeveral deaths occur in U. K. – D. Reading’s daughter leading to Anaphylaxis Campaign
Sweden develops allergy death reporting systemFAO initiates development of Big 8Codex Alimentarius Commission adopts Big 8 in 1999New regulatory approaches pending in Japan, EU, and Canada
Food Allergy Research and Resource Program © 2011
Why Are Allergens Now a Key Issue?
Increased Awareness– Medical Journal Publications 1988, 1992– Advocacy Support Groups
Trend toward “Value Added” Products
Improvements in Detection
Company Liability– Negative Publicity/Financial Impact
From Early Chaos Came Concern Followed by
Commitment and Control
Food Allergy Research and Resource Program © 2011
Food Allergy Research and Resource Program © 2011
1990 Industry Status on Food Allergens
Lack of knowledge and awarenessLessons from the sulfite issue of 1980’sResistance to changeComplex webLack of recognition of vulnerabilityFocus on the minutiae
Food Allergy Research and Resource Program © 2011
Key Food Industry Lessons
Major company recalls– Rework– Inadequate cleaning of shared equipment– Line cross-overs– Packaging errors– Ingredient suppliers– Custom processors
Food Allergy Research and Resource Program © 2011
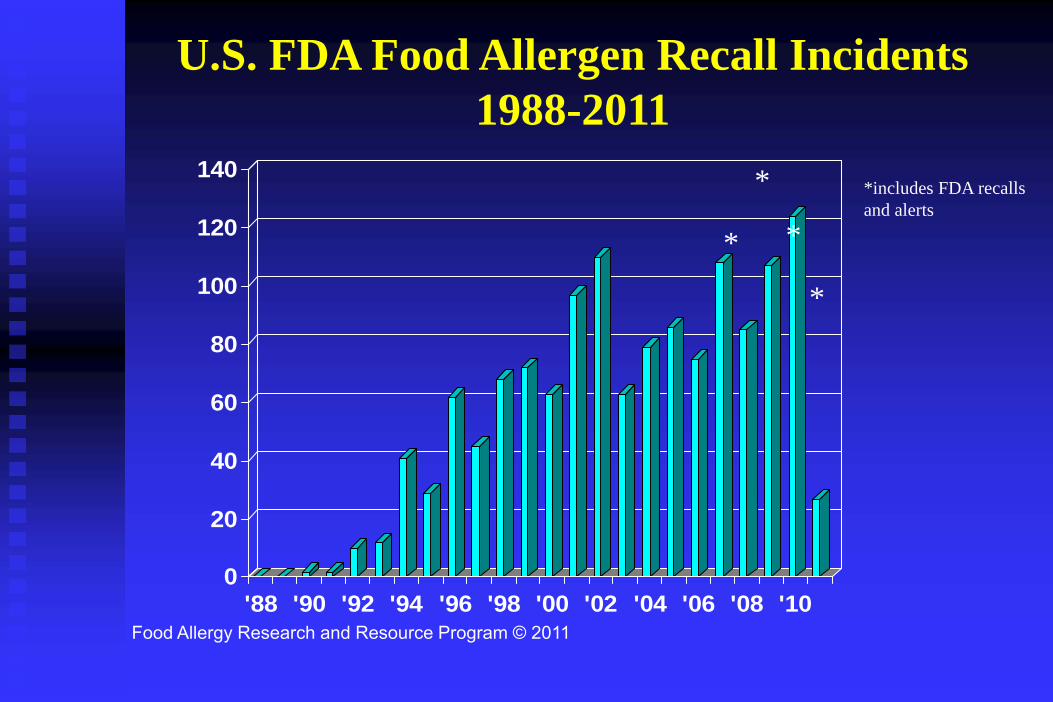
U.S. FDA Food Allergen Recall Incidents1988-2011
0
20
40
60
80
100
120
140
'88 '90 '92 '94 '96 '98 '00 '02 '04 '06 '08 '10
*
*
*includes FDA recalls and alerts
*
*
Food Allergy Research and Resource Program © 2011
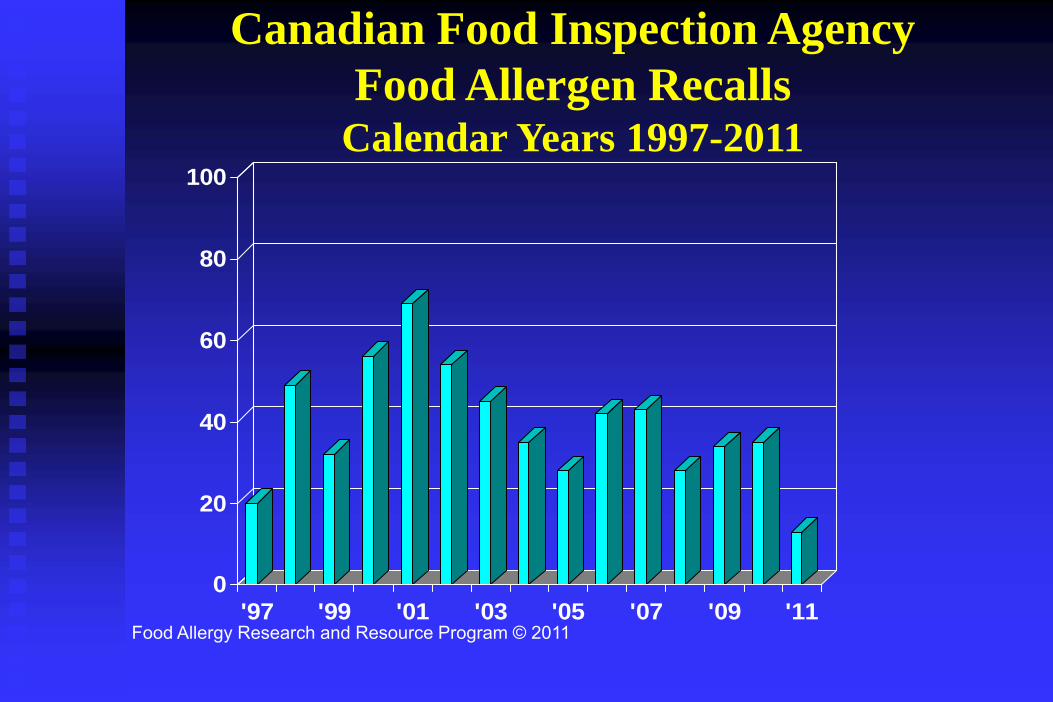
Canadian Food Inspection Agency Food Allergen Recalls
Calendar Years 1997-2011
0
20
40
60
80
100
'97 '99 '01 '03 '05 '07 '09 '11
Food Allergy Research and Resource Program © 2011
Food Industry Response
CommitmentInstitution of improved GMP’s Institution of improved sanitation practicesChanges in facility and equipment designEmployee and management trainingFood Allergy Issues AllianceIndustry support for FAANCreation of Food Allergy Research & Resource Program
Food Allergy Research and Resource Program © 2011
FARRP
Food Allergy Research and Resource ProgramUniversity of NebraskaFood industry consortium created to address/support research and methods development for food allergen issuesFormed in 1996 (now has 57 member companies from 11 countries)
FARRP ResearchDevelop the tools for industry to use to assess and control allergen risks – analytical detection methods, sanitation strategies, etc.Develop risk assessment approaches that allow appropriate management of the allergen issue for balanced protection of allergic consumers and maintenance of quality of life
Food Allergy Research and Resource Program © 2011
Detection ofAllergenic Food Residues
Food Allergy Research and Resource Program © 2011
Detection of Allergenic Food Residues
• First method (Skerritt ELISA for gluten) was published in 1990; commercialized soon after
• First peanut ELISA (Neogen) marketed in 1996• Now – many different methods and formats from
numerous companies from around the world• The food industry now has the analytical tools
needed to detect allergen residues
Food Allergy Research and Resource Program © 2011
Detection of Allergenic Food Residues
• But be careful!!• All allergen detection methods are not created
equal!!• The right choice for one application may be
wrong for another!• Results can differ qualitatively and quantitatively• Food industry ability to select the best method
and interpret results still well short of idealFood Allergy Research and Resource Program © 2011
Detection Methods
• Enzyme Linked Immunosorbent Assay (ELISA)• General Protein Tests• ATP/Bioluminescence Tests• Polymerase Chain Reaction (PCR)
Food Allergy Research and Resource Program © 2011
Food Allergy Research and Resource Program © 2011
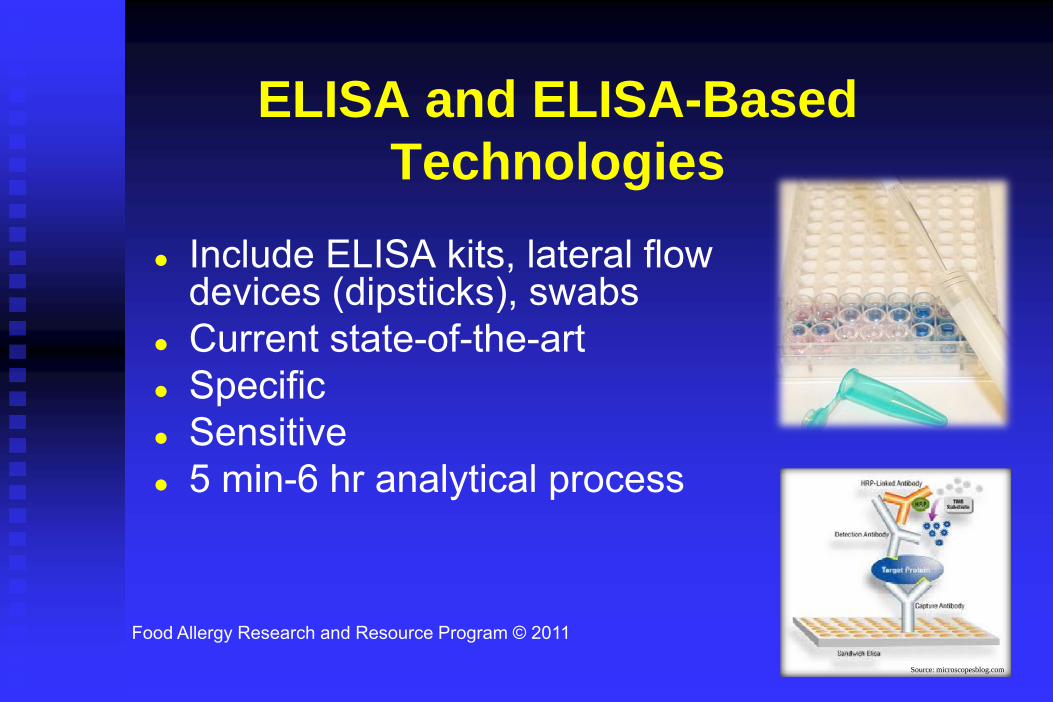
ELISA and ELISA-Based Technologies
Include ELISA kits, lateral flow devices (dipsticks), swabsCurrent state-of-the-artSpecificSensitive5 min-6 hr analytical process
Source: microscopesblog.com
Food Allergy Research and Resource Program © 2011
ELISASpecific – detects protein(s) from source; not always specific for an allergenic protein but that is rarely an important concernSensitive (low ppm and could be less)
– FARRP/Neogen methods – Limit of Quantitation(LOQ) of 1-2.5 ppm
– No clinical reason to “chase molecules”
Quantitative (96 well) and Qualitative (lateral flow and swab) formats
Commercial ELISAs
PeanutMilkEggGlutenAlmondHazelnutWalnut
SoybeanCrustaceaMustardLupineSesame seedBuckwheat
Food Allergy Research and Resource Program © 2011
Food Allergy Research and Resource Program © 2011
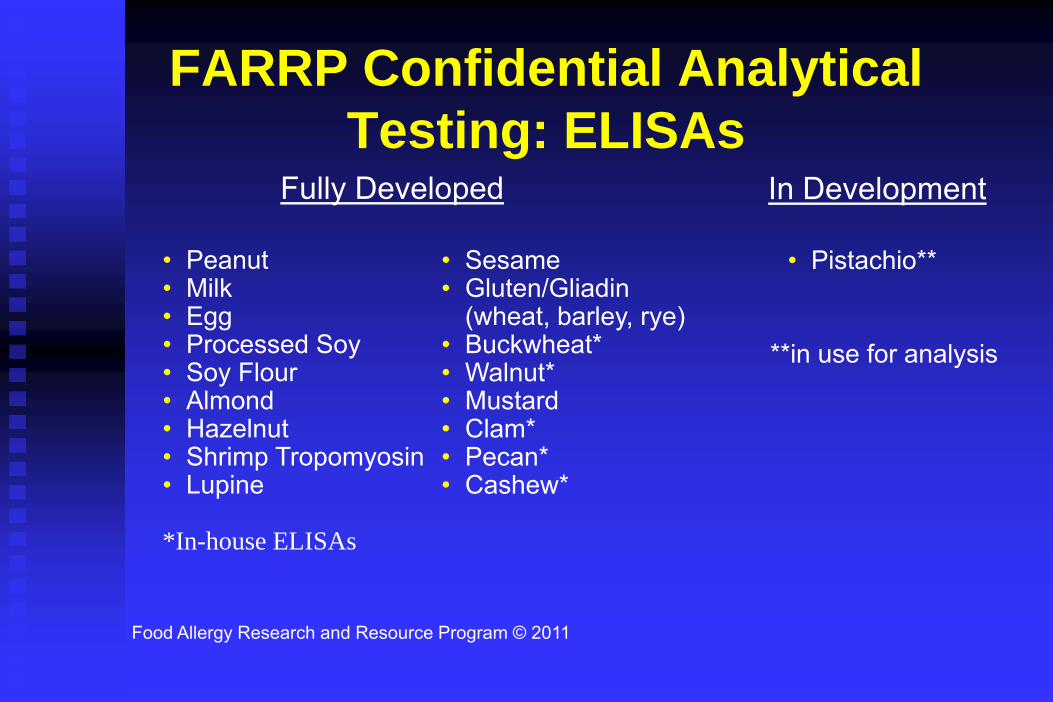
FARRP Confidential Analytical Testing: ELISAs
In Development
• Pistachio**
**in use for analysis
• Peanut• Milk• Egg• Processed Soy• Soy Flour• Almond• Hazelnut• Shrimp Tropomyosin• Lupine
*In-house ELISAs
• Sesame• Gluten/Gliadin
(wheat, barley, rye)• Buckwheat*• Walnut*• Mustard• Clam*• Pecan*• Cashew*
Fully Developed
All ELISAs Are Not Created Equal
SpecificitySensitivityFormatQuantitative vs. Qualitative
Food Allergy Research and Resource Program © 2011
ELISA Points of Difference
Antibody Specificity – total protein vs. allergenPolyclonal vs. MonoclonalCalibratorsEffects of Processing on DetectionExtraction MethodsSensitivity Limits
Food Allergy Research and Resource Program © 2011
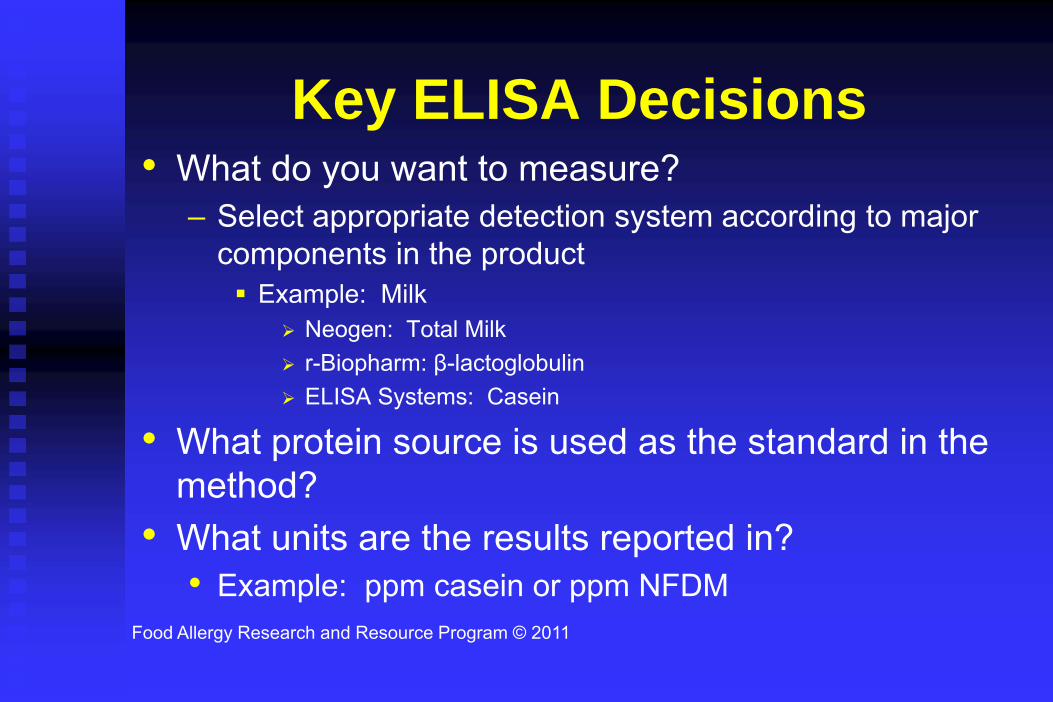
Key ELISA Decisions• What do you want to measure?
– Select appropriate detection system according to major components in the product
Example: MilkNeogen: Total Milkr-Biopharm: β-lactoglobulinELISA Systems: Casein
• What protein source is used as the standard in the method?
• What units are the results reported in?• Example: ppm casein or ppm NFDM
Food Allergy Research and Resource Program © 2011
ELISA Specificity
Total Peanut vs. Ara h 1Total Milk vs. Casein vs. β-LactoglobulinSoy Flour vs. Processed Soy
Food Allergy Research and Resource Program © 2011
Food Allergy Research and Resource Program © 2011
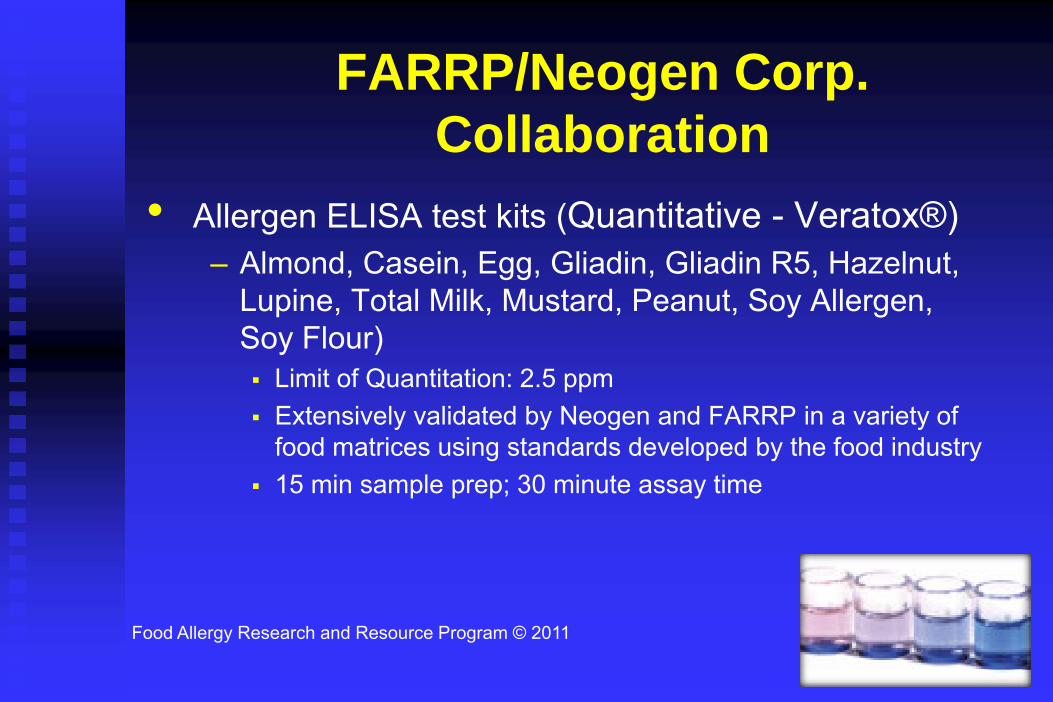
FARRP/Neogen Corp.Collaboration
• Allergen ELISA test kits (Quantitative - Veratox®) – Almond, Casein, Egg, Gliadin, Gliadin R5, Hazelnut,
Lupine, Total Milk, Mustard, Peanut, Soy Allergen, Soy Flour)
Limit of Quantitation: 2.5 ppmExtensively validated by Neogen and FARRP in a variety of food matrices using standards developed by the food industry15 min sample prep; 30 minute assay time
Food Allergy Research and Resource Program © 2011
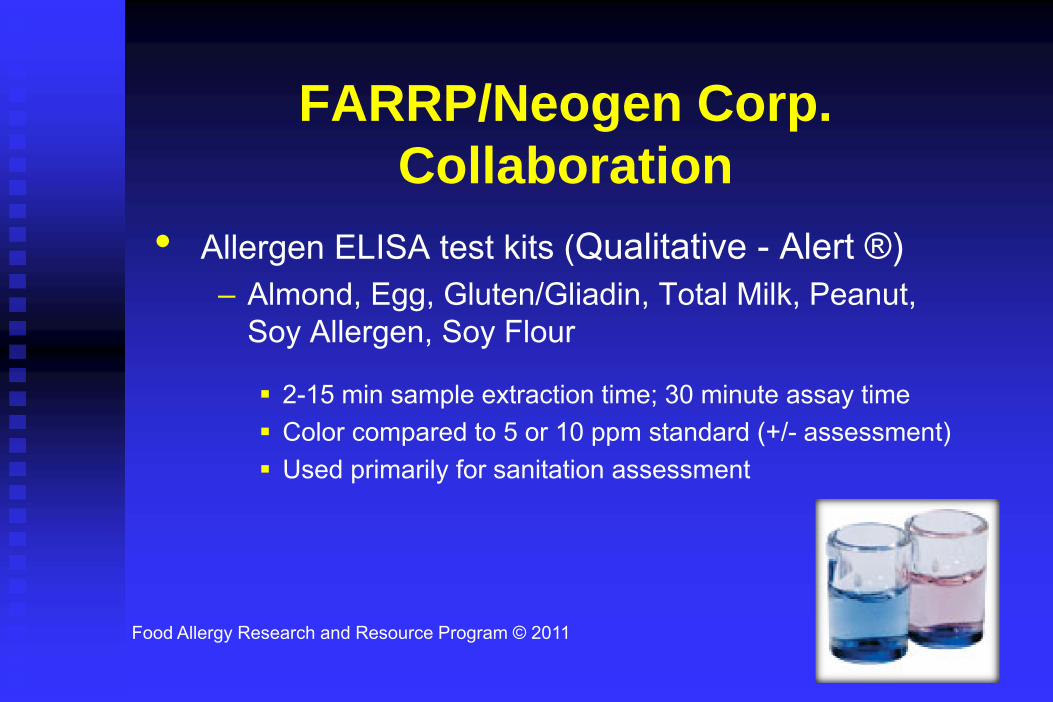
FARRP/Neogen Corp. Collaboration
• Allergen ELISA test kits (Qualitative - Alert ®) – Almond, Egg, Gluten/Gliadin, Total Milk, Peanut,
Soy Allergen, Soy Flour
2-15 min sample extraction time; 30 minute assay timeColor compared to 5 or 10 ppm standard (+/- assessment)Used primarily for sanitation assessment
Food Allergy Research and Resource Program © 2011
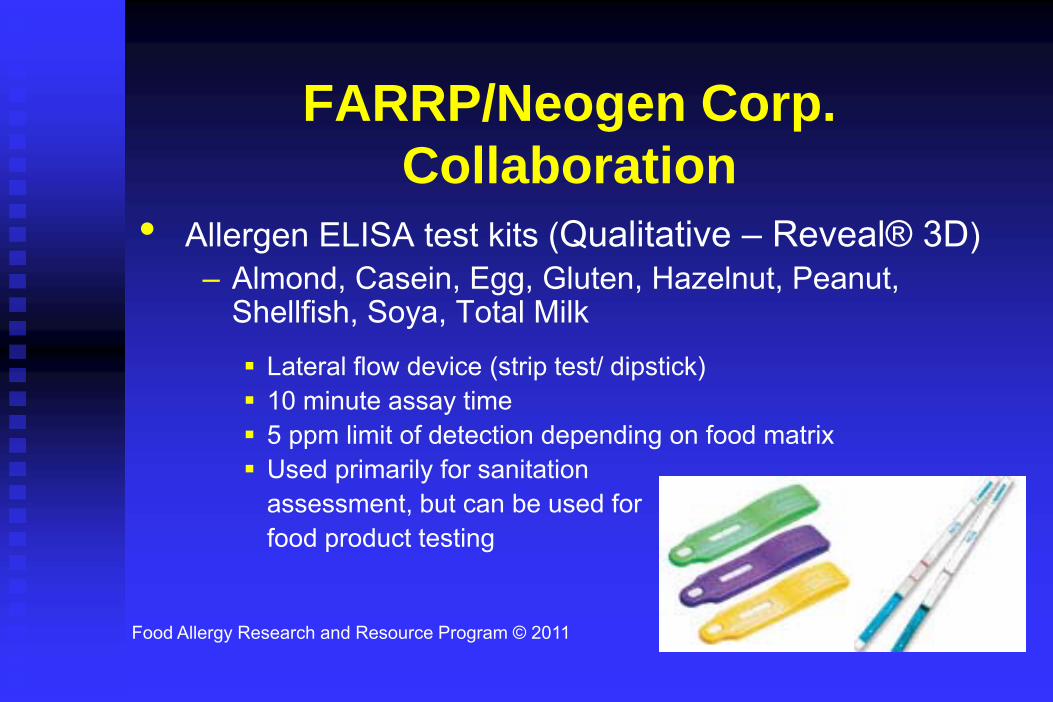
FARRP/Neogen Corp.Collaboration
• Allergen ELISA test kits (Qualitative – Reveal® 3D)– Almond, Casein, Egg, Gluten, Hazelnut, Peanut,
Shellfish, Soya, Total Milk
Lateral flow device (strip test/ dipstick)10 minute assay time5 ppm limit of detection depending on food matrixUsed primarily for sanitation assessment, but can be used forfood product testing
Food Allergy Research and Resource Program © 2011
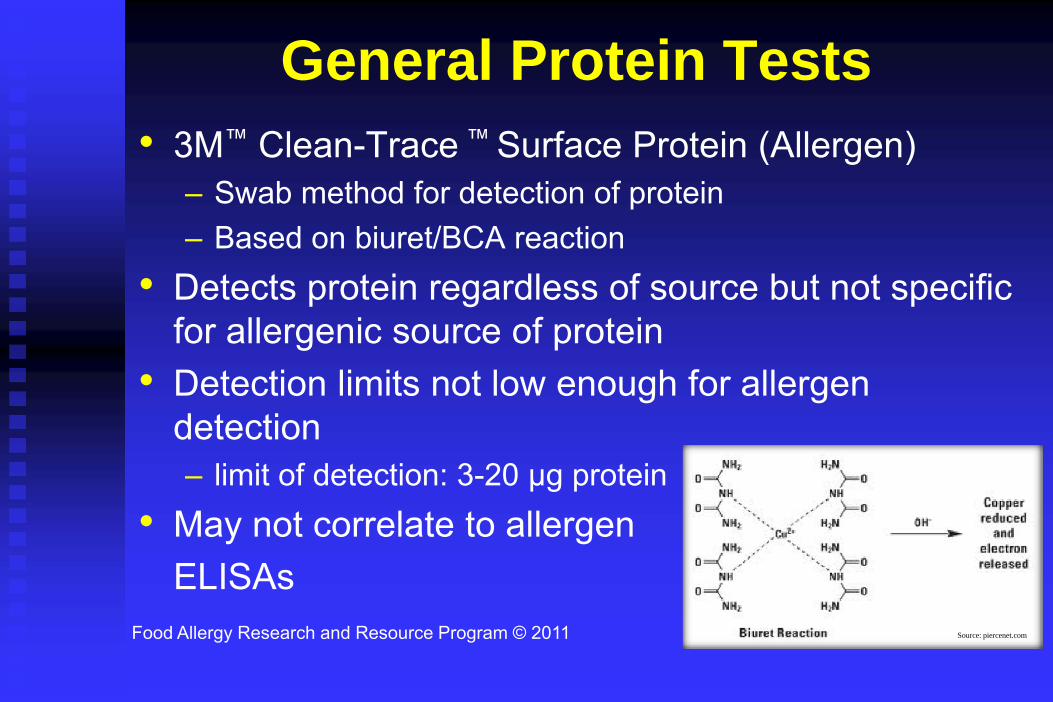
General Protein Tests• 3M™ Clean-Trace ™ Surface Protein (Allergen)
– Swab method for detection of protein– Based on biuret/BCA reaction
• Detects protein regardless of source but not specific for allergenic source of protein
• Detection limits not low enough for allergen detection– limit of detection: 3-20 µg protein
• May not correlate to allergen ELISAs
Source: piercenet.com
Food Allergy Research and Resource Program © 2011
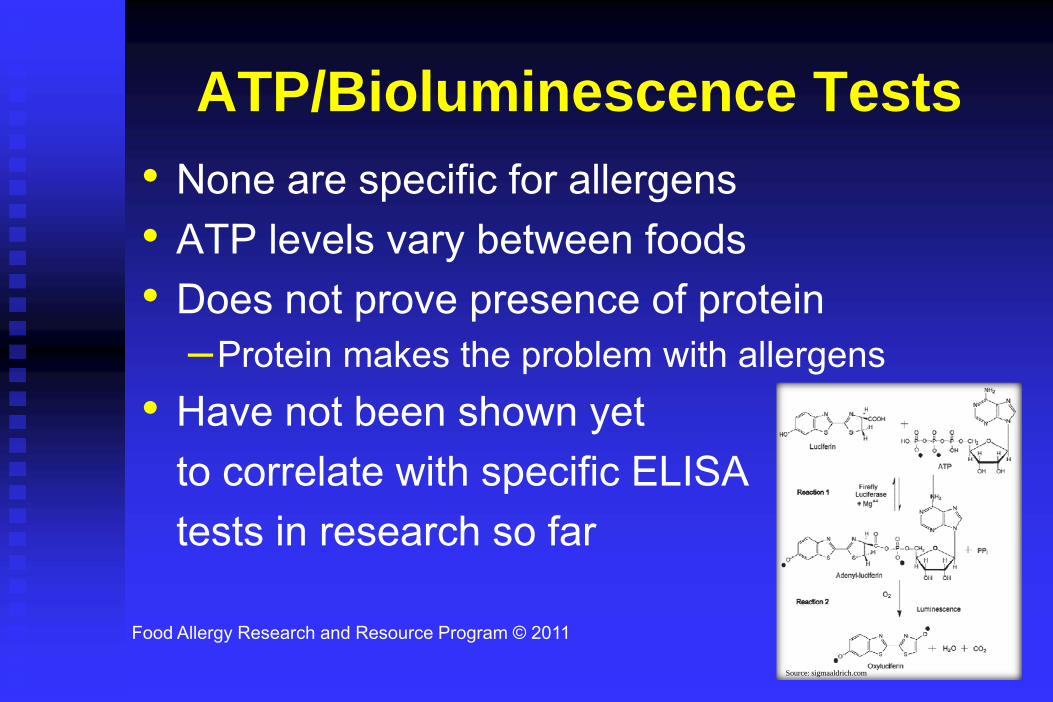
ATP/Bioluminescence Tests• None are specific for allergens• ATP levels vary between foods• Does not prove presence of protein
–Protein makes the problem with allergens• Have not been shown yet
to correlate with specific ELISA tests in research so far
Source: sigmaaldrich.com
Food Allergy Research and Resource Program © 2011
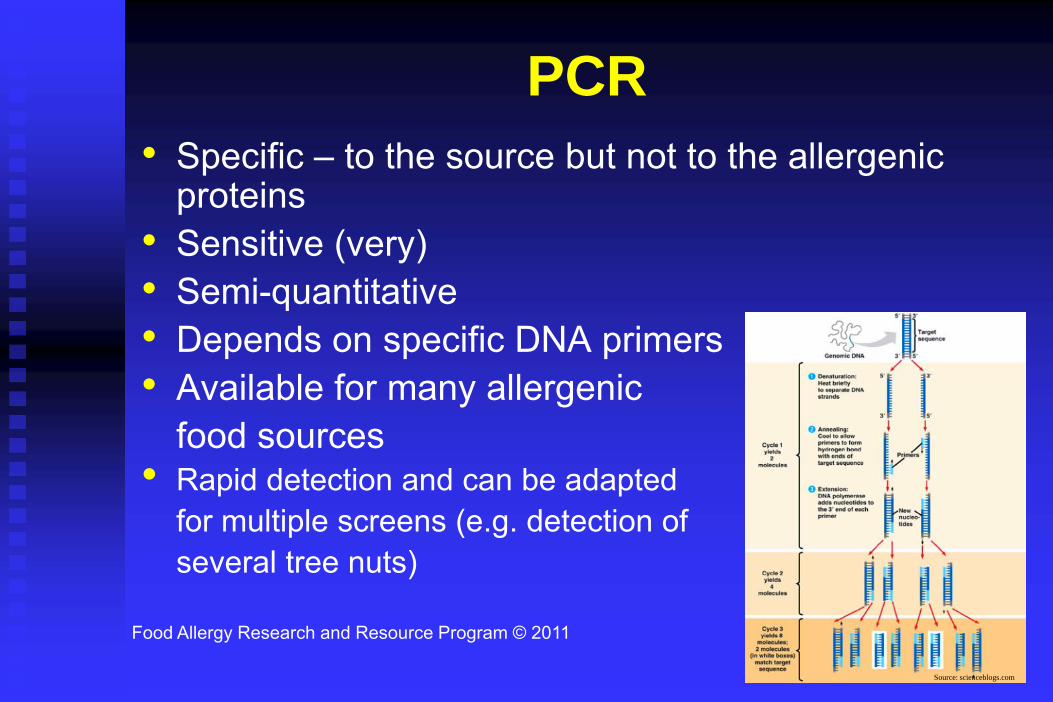
PCR• Specific – to the source but not to the allergenic
proteins• Sensitive (very)• Semi-quantitative• Depends on specific DNA primers• Available for many allergenic
food sources• Rapid detection and can be adapted
for multiple screens (e.g. detection of several tree nuts)
Source: scienceblogs.com
PCR Methodology• PCR (DNA) tests available for many allergenic
foods but must send out samples– Not practical for in-plant use
expensive equipment required (>$30,000 USD)isolated lab required to avoid contamination
– Does not prove presence or absence of protein/allergen
Food Allergy Research and Resource Program © 2011
Food Allergy Research and Resource Program © 2011
Issues with PCRThese cannot be differentiated by PCR
Beef/milkEgg/chicken
Food Allergy Research and Resource Program © 2011
Things You Can Test
• CIP rinse water• Equipment surfaces• Environmental surfaces• In-process product (“throwaway”)• “Push-through” – product, ingredient, etc.
– Ice, salt, flour, other things used to “scour” equipment

Food Allergy Research and Resource Program © 2011
Status of Allergen Testing in U.S.• Many companies are testing for allergen
residues• ELISA or lateral flow-type is the preferred
method• Some do in-house testing, others use contract
labs• Most companies are not testing finished product
– Are testing to validate sanitation methodsenvironmental swabbingpush-through materials
– Some testing of finished product advised after sanitation methods are validated
Thresholds and Risk Assessment
How Much is Too Much?How Clean is Clean Enough?
When is it Appropriate to Apply an Advisory Label?
Food Allergy Research and Resource Program © 2011
Today’s Situation
We live in a world without thresholds where uncertainty abounds regarding the safety (or lack of safety) of various products for food-allergic consumersIn some countries (e.g. USA), that world is reasonably safe (at least for packaged foods) but loaded with restricted choices

Food Allergy Research and Resource Program © 2011
The Ideal Future
We establish finite thresholds based upon scientifically defensible clinical dataWe then become much more certain about the level of risk posed by any given product for food-allergic consumersThe world remains reasonably safe (at least for packaged foods) with many fewer restrictionsAll countries are equally safe with respect to food allergies
Why Are We Interested in Thresholds?Circa 2000
Very small amounts of specific allergens can provoke reactions in some individuals, but– we don’t know in how many– we don’t know how small the amounts are– we don’t know how severity of reaction relates to an individual’s
sensitivity– allergic people are known to react differently on different occasions
So it is difficult to assess how much needs to be done to achieve the desired level of safety with respect to allergens.
Source: R. Crevel, IUFoST - Chicago, July 2003
Food Allergy Research and Resource Program © 2011
Terminology NOAEL = no observed adverse effect level the highest amount that an individual can tolerate before experiencing symptomsLOAEL = lowest observed adverse effect level the lowest dose that would provoke an allergic response in an individualObjective NOAEL/LOAEL – based on observable symptomsSubjective NOAEL/LOAE – based on non-confirmable response

Food Allergy Research and Resource Program © 2011
Terminology
Individual Threshold – LOAEL or NOAEL for anindividual patientPopulation Threshold – LOAEL or NOAEL for a group of food-allergic individuals- all peanut-allergic individuals - peanut-allergic individuals in a particular clinic or
group/sub-group
Food Allergy Research and Resource Program © 2011
TerminologyRegulatory Threshold – an allowed amount or concentration that would be safe for the vast majority of individuals in a group e.g. peanut-allergic consumers- based upon population NOAEL/LOAEL and risk
assessment modeling
Food Industry Threshold – an amount or concentration that triggers labeling to protect the allergic consumer; predicated upon regulatory threshold where such thresholds exist
Food Allergy Research and Resource Program © 2011
Historical Approach to Dose/Response
Physicians recommended completed avoidance (ZERO threshold)Ingestion of small amounts (not well defined) could elicit allergic reactionsDBPCFC was the gold standard for diagnosis but challenges often started at 400 – 500 mg20%+ of patients reacted to first challenge dose – some severe rxns
Food Allergy Research and Resource Program © 2011
Historical Approach to Dose/Response
Peanut-allergic consumers have practiced complete avoidance (zero threshold)Peanut-allergic consumers still experienced occasional allergic reactions (hidden ingredients, cross contact, FOOD SERVICE)Unexpected allergic reactions to peanuts were occasionally severe leading to widespread belief that low doses elicited severe reactions
Food Allergy Research and Resource Program © 2011
Status of Dose/Response Knowledge circa 2005
Trace amounts (low mg) can elicit allergic reactions; individual thresholds variableA few clinics started doing very low dose DBPCFC and proved that safe doses exist for every subject and that severe reactions did not occur at very low doses (low mg)
Food Allergy Research and Resource Program © 2011
Current Situation
Public health authorities have not established regulatory thresholds for peanut or other allergenic foodsLabeling regulations in some countries based on de facto zero thresholdIndustry acutely aware of allergens, no guidance on thresholds so rampant use of precautionary/advisory labeling
Food Allergy Research and Resource Program © 2011
Food Allergy Research and Resource Program © 2011
Current SituationQuality of life for food-allergic consumers suffers partially as a result of seriously restricted food choicesSome food-allergic consumers ignore products with precautionary labelsSome physicians advise food-allergic patients to ignore precautionary labelsAllergic reactions continue to occur but rarely with packaged foods (USA)
US FDA Allergen ThresholdsThreshold Working Group Report“Approaches to Establish Thresholds for Major Food Allergens and for Gluten in Food” (March, 2006) (Journal of Food Protection, Vol. 71, No. 5, 2008, Pages 1043–1088)
Food Allergy Research and Resource Program © 2011

Food Allergy Research and Resource Program © 2011
Current FocusThe FDA Threshold Working Group Report of 2006 favored use of the quantitative risk assessment-based approachQRA based on knowledge of individual threshold doses within the overall population of individuals with a particular food allergy and then uses statistical dose distribution modelingVery data intensive!!
Food Allergy Research and Resource Program © 2011
FDA ConclusionConclusion Finding 4 – ‘the quantitative risk assessment-based approach provides the strongest, most transparent scientific analyses to establish thresholds for the major food allergens. However, . . . the currently available data are not sufficient to meet the requirements of this approach. A research program should be initiated to develop applicable risk assessment tools and to acquire and evaluate the clinical and epidemiological data needed to support the .... approach.”Do we have or can we create enough data to use this approach?
Food Allergy Research and Resource Program © 2011
The FARRP ApproachAcknowledge help from Unilever (Rene Crevel and David Sheffield), FARRP colleagues (Joe Baumert, Jamie Kabourek, and Ben Remington) and ILSI-North AmericaFirst attempt – peanutPeanut - prevalence, severity, and likely availability of dataUse of this approach outlined in recent publication: Crevel et al. Food Chem. Toxicol. 45:691-701 (2007) Can we find enough data points in the literature to use this model? Uncertainties? Data gaps?
Food Allergy Research and Resource Program © 2011
FARRP Peanut Threshold Study Task #1
Mined individual NOAEL and LOAEL data for peanut from existing published literatureFocused on objective NOAELs and LOAELsTaylor SL, Crevel RWR, Sheffield D, Kabourek J, Baumert J. 2009. Threshold dose for peanut: risk characterization based upon published results from challenges of peanut-allergic individuals. Food Chem. Toxicol. 47:1198-1204.
Food Allergy Research and Resource Program © 2011
ILSI- FARRP Peanut Threshold Study
Task #2We mined additional existing but unpublished clinical data on individual threshold dosesIn examining clinical literature, determined that clinical group in Nancy France might have data on low dose challenges of large numbers of peanut-allergic subject that have not been publishedWe had only gleaned 21 individual thresholds for peanut from 3 publications from this group in Task #1Obtained data on 286 peanut-allergic subjects!!Limited selection bias because everyone challenged
Food Allergy Research and Resource Program © 2011
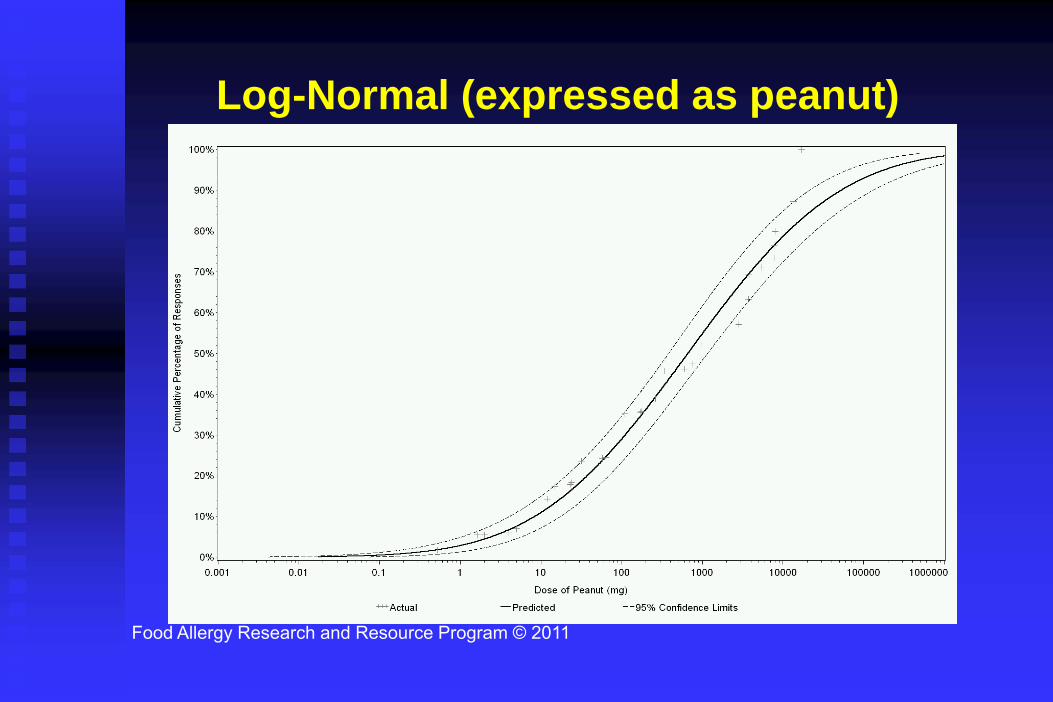
Log-Normal (expressed as peanut)
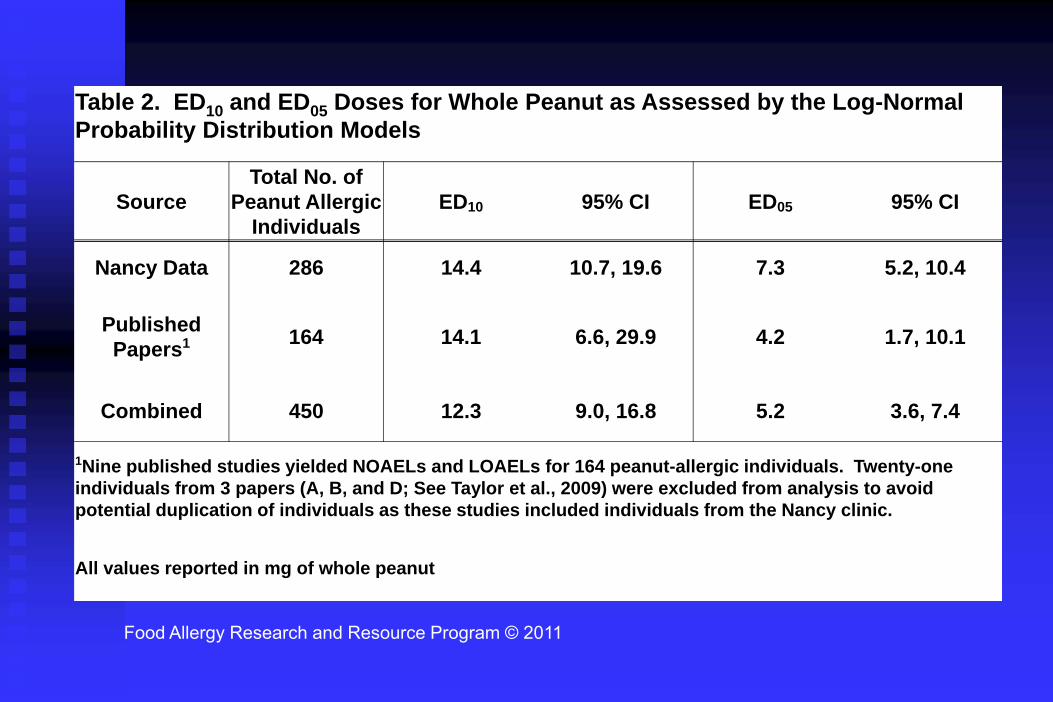
Table 2. ED10 and ED05 Doses for Whole Peanut as Assessed by the Log-Normal Probability Distribution Models
SourceTotal No. of
Peanut Allergic Individuals
ED10 95% CI ED05 95% CI
Nancy Data 286 14.4 10.7, 19.6 7.3 5.2, 10.4
Published Papers1 164 14.1 6.6, 29.9 4.2 1.7, 10.1
Combined 450 12.3 9.0, 16.8 5.2 3.6, 7.4
1Nine published studies yielded NOAELs and LOAELs for 164 peanut-allergic individuals. Twenty-one individuals from 3 papers (A, B, and D; See Taylor et al., 2009) were excluded from analysis to avoid potential duplication of individuals as these studies included individuals from the Nancy clinic.
All values reported in mg of whole peanut
Food Allergy Research and Resource Program © 2011
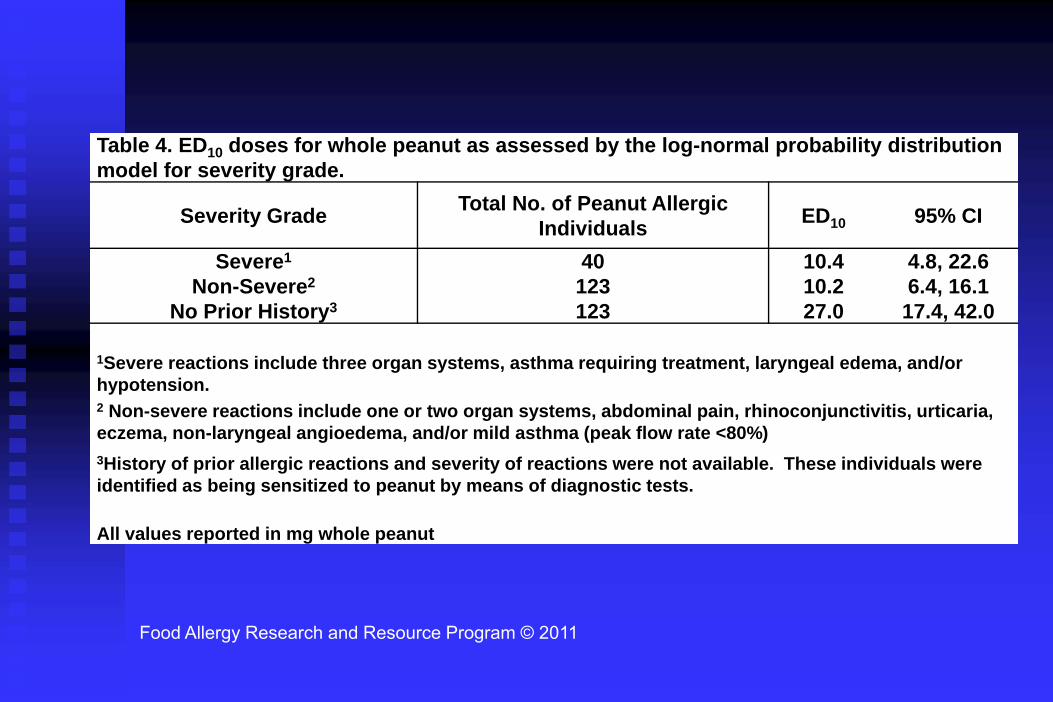
Table 4. ED10 doses for whole peanut as assessed by the log-normal probability distribution model for severity grade.
Severity Grade Total No. of Peanut Allergic Individuals ED10 95% CI
Severe1 40 10.4 4.8, 22.6Non-Severe2 123 10.2 6.4, 16.1
No Prior History3 123 27.0 17.4, 42.0
1Severe reactions include three organ systems, asthma requiring treatment, laryngeal edema, and/or hypotension.2 Non-severe reactions include one or two organ systems, abdominal pain, rhinoconjunctivitis, urticaria, eczema, non-laryngeal angioedema, and/or mild asthma (peak flow rate <80%)3History of prior allergic reactions and severity of reactions were not available. These individuals were identified as being sensitized to peanut by means of diagnostic tests.
All values reported in mg whole peanut
Food Allergy Research and Resource Program © 2011
Food Allergy Research and Resource Program © 2011
Task #2Taylor SL, Moneret-Vautrin DA, Crevel RWR, Sheffield D, Morisset M, Dumont P, Remington BC, Baumert JL. 2010. Threshold dose for peanut: risk characterization based upon diagnostic oral challenges of a series of 286 peanut-allergic individuals. Food Chem. Toxicol. 48:814-819.