a geographic analysis of homeless management information system (hmis) data for north ga tim...
TRANSCRIPT

1
A Geographic Analysis of Homeless Management Information System
(HMIS) Data for North GA
Tim BranscombGeog 596A Capstone ProposalPenn State MGIS ProgramMay 2015

2
Outline
• Background• Goals• Project Phases • Potential Focus Areas• Project Status• Schedule • Beyond Final Project

3
Background
• Homelessness in Atlanta
• Multiple homeless organizations in Atlanta
• Desire to utilize GIS for homeless purposes
• Arrival at the Pathways Organization
• What is Pathways?
• Discussions lead to using GIS with Homeless
Management Information Systems (HMIS) data
• What is HMIS?

4
Project Goals
• Apply skills learned in MGIS program to aid homelessness
• Provide customer focused geographic analysis
• Create template of GIS procedures for other HMIS providers to follow
• Create ‘path’ for data sharing between Pathways and other requesting organizations

5
Project PhasesPhase 1-Data Phase 2-Analysis Phase 3-Presentation

6
Phase 1 – Data
• Research HMIS data
• Investigate available census data estimates and entities
• Locate tools for pre-processing (Excel, Access, ArcMap)
• Execute required training and agreements
• Establish accounts needed for data access

7Data Dictionary Data Model
Data Standards Manual
HMIS: Homeless Management Information System
Phase 1 – Data

8
• Basic review of Census Bureau geographic entities, their relationships, and available datasets
• Non-alignment between zip code boundaries and traditional census entities (tracts, block groups, etc.)
• Close alignment between zip code boundaries and Zip Code Tabulation Areas (ZCTAs)
U.S. Census Bureau Information
Phase 1 – Data

9
Use Iterative workflow to answer general questions:
• What areas have the highest concentration of clients?
• What types of clients are from which areas?
• What types of service do the clients use the most?
• What distances do clients have to travel for services?
• Which areas have an increasing/decreasing rate of clients?
Phase 2 – Analysis
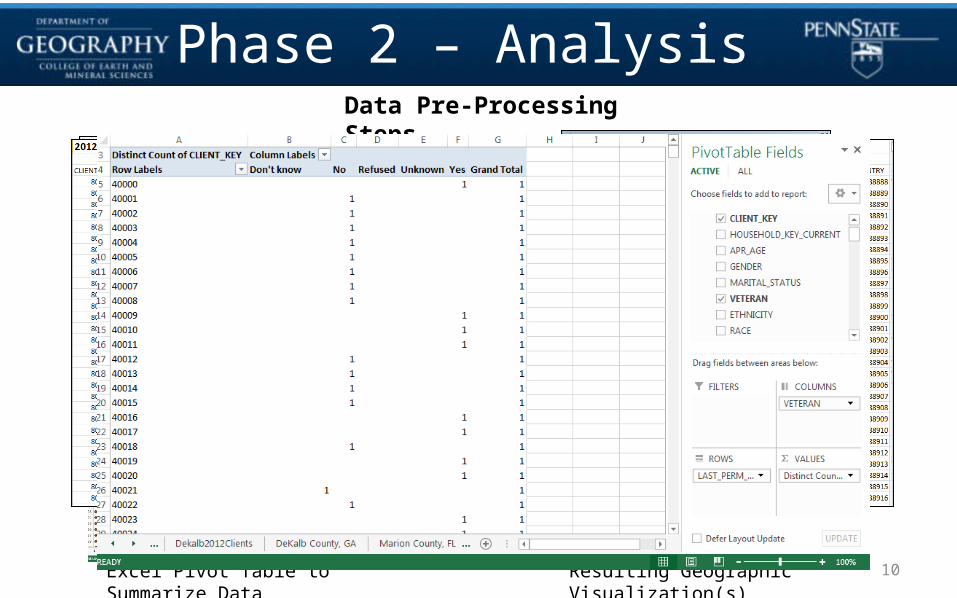
10
Original HMIS Report Data
Excel Pivot Table to Summarize Data
Imported and Linked to ZCTAs
Resulting Geographic Visualization(s)
Phase 2 – AnalysisData Pre-Processing Steps

11
Phase 2 - Analysis
Thematic Map of Clients with Children Rates per Zip Code
Proportional Symbol Map of Client Totals per Zip Code

12
Phase 2 - Analysis
Pie Chart Symbol Map of Client Race Proportions per Zip Code
Drive-Time Polygon Map from Family Focused Shelters

13
Phase 2 - Analysis
Hotspot Analysis of Veteran Rate per Zip Code
Grouping Analysis Map of Homeless Client Rates per Zip Code

14
• Most ‘telling’ results are selected by Pathways
• Storyboard created by Pathways for the selected results
• Publish appropriate feature services to support storyboard
• Story Map created and published after iterative process
• Appendix documentation created for selected data and maps
Phase 3 - Presentation

15
• Initial Inquiry
• Outcome (map)
• HMIS entities used
• Required SQL
• Census data used
• Pre-processing steps
• GIS workflow
Report Documentation
Phase 3 - Presentation

16
• Regression modelling
• Custom modification of Story Maps (using JavaScript)
• Significant focus on template for other HMIS organizations
• Windows utility application creation for pulling and aggregating data
as needed (via ODBC connection)
• ArcMap Python scripts and/or models for pre-processing needs
• Excel VBA scripts for converting data and/or producing necessary
pivot tables
Potential Focus Areas

17
Project Status

18
February – May 2015 Phase 1 – Data Research and Coordination
April – July 2015 Phase 2 – Analysis
June – September 2015Phase 3 – Presentation (Templates and Story Maps )
September 2015Draft final paper and conference presentation
October 2015 Present Results at National HMIS Users Conference (Washington, DC)
Project Schedule

19
• Continued involvement/analysis for Pathways
• Obtain non-profit ArcGIS software for Pathways
• GIS Training for Pathways
• Take basic approach to one of several non-profit
organizations I would like to work GIS for
• Adapt methods to open source products
Beyond Capstone Project
2016…
Ref: ESRI 2015

20
Dr. Douglas Miller – Project Advisor
Dr. Josie Parker – Pathway’s Research Project Manager
Dr. Jack Barile– Pathway’s Data Researcher
Dr. Justine Blanford – Future geo-statistical consultant
Meghan Branscomb – Supporting Wife!
Acknowledgements

21
Census.gov (2015a). Zip code Tabulation Areas (ZCTAs). Retrieved April 2, 2015 from https://www.census.gov/geo/reference/zctas.html Census.gov (2015b). American Community Survey: When to use 1-year, 3-year, or 5-year estimates. Retrieved April 2, 2015 from http://www.census.gov/acs/www/guidance_for_data_users/estimates/ Department of Housing and Urban Development (2005). Making the Most of HMIS Data: A Guide to Understanding Homelessness and Improving Programs in Your Community. Retrieved March 20, 2015 from https://www.hudexchange.info/resource/1316/guide-to-understanding-homelessness-and-improving-programs/ HudExchange.info (2014a). Homeless Management Information System. Retrieved March 20, 2015 from https://www.hudexchange.info/hmis/ HudExchange.info (2014b). HMIS Data Dictionary. Retrieved March 20, 2015 from https://www.hudexchange.info/resource/3824/hmis-data-dictionary/ Loubert, Linda (2010). Mapping Urban Inequalities with GIS. Retrieved March 20, 2015, from http://www.esri.com/news/arcnews/spring10articles/mapping-urban.html Olivia, Jon-Paul (2006). Using Geographic Information Systems (GIS) as a tool for HMIS decision making. Retrieved March 20, 2015 from https://www.hudexchange.info/resource/1572/using-gis-as-a-tool-for-hmis-decision-making/ PCNI.org (n.d.) Pathways Community Network Institute. Retrieved March 20, 2015, from http://www.pcni.org/about-us Storymaps.argis.com (n.d.) Use StoryMaps to Inform and Inspire Your Audience. Retrieved March 20, 2015, from http://storymaps.arcgis.com/en/ Wong, Yin-Ling I, Hiller, Amy E. (2001). Evaluating a Community Based Homelessness Prevention Program: A Geographic Information System Approach. Administration in Social Work 25:4, pp21-45.
References