a framework for extending visual brands to new products
TRANSCRIPT
A framework for extending visualbrands to new products
by
Douglas H. Bjorkdal
Bachelor of Mechanical EngineeringMajor in Design and Product Development, 2012
Link6ping University
MASSACHUSETTS INSTITUTEOF TECHNOLOGY
MAR 0 2 2016
LIBRARIESARCHIVES
Submitted to the Department of Mechanical Engineering in partial fulfillment ofthe Requirements for the degree of
Master of Science in Mechanical Engineeringat the
Massachusetts Institute of Technology
February 2016
Massachusetts Institute of Technology 2016. All rights reserved.
Signature redactedDouglas H. Bj6rkdal
Department of Mechanical EngineeringJanjuar15 20Y/
Signature redactedCertified by David R. Wallace
Professor of Mechanical Engineering, MacVicar Faculty FellowA -Thesis SuperyisorSignature redacted
Accepted by Rohan AbeyaratneQuentin Berg Professor of Mechanics
Chairman, Committee on Graduate Students
1
Author
This page intentionally left blank
2

A framework for extending visualbrands to new productsby Douglas H. Bj6rkdal
Submitted to the Department of Mechanical Engineering on January 15, 2016, inpartial fulfillment of the requirements for the degree of Master of Science inMechanical Engineering.
AbstractVisual design has become an increasingly important product differentiation tool forcompanies. By deploying a consistent visual design language that communicatesbrand-specific values, a company can foster recognition for its brand as a whole.When a brand seeks to launch a new product, it can take advantage of its establishedbrand recognition, by extending its visual language to the new product. In doing so,the brand increases the new product's ability to be recognized. Supportive brandingtools for industrial designers are lacking, yet strategic decisions related to visualdesign have become increasingly important.
The objective of this thesis was to investigate how designers may extend a brand'svisual design language to new products in practice. A framework was derived basedon established branding theory and on design research related to visual recognition.The aim was to derive a framework that could support designers in strategicdecisions, while also leaving room for designers to express their individualcreativity within a viable frame of reference. An experiment was conducted toassess the framework's performance and designers' attitudes towards it. In addition,designers' own practical approaches to the task were explored. An expert panel wasutilized to evaluate designers' product drafts. The results indicate that designers,while applying the framework, designed products that communicated the targetbrands' visual design language more clearly than without the framework, whereasno significant difference in the concepts' creativity levels were found. Perceivedadvantages associated with the framework were usually linked to its structure andhelpfulness in determining brands' visual strategies. In order to strengthen thefindings of this study, future research should explore the effectiveness of theproposed framework with larger sample sizes and additional means of evaluation.The framework may prove especially useful in educational settings, fosteringdesigners' ability to think about visual design in a strategic manner. As such, futureexperiments may be conducted at institutions offering educational programs withinthe field of industrial design.
Thesis Supervisor: David R. WallaceTitle: Professor of Mechanical Engineering, MacVicar Faculty Fellow
3

This page intentionally left blank
4
Acknowledgments
First and foremost, I would like to express gratitude to my advisor, Professor DavidWallace, who provided continuous support and enlightening advice throughout thisthesis. I would also like to thank Professor Maria Yang and Professor Dan Frey fortheir insightful feedback and interest in this work. Professor Anders Warell, at LundUniversity, offered invaluable support and assisted with arrangements forevaluation sessions at his institution, for which I am greatly thankful. Furthermore, Iwish to thank Tomonori Honda for advice on statistical matters, and AndersH5ggman for valuable feedback and support. In addition, I would like to expressmany thanks to the designers and evaluators who participated in this study. Finally,I must direct my heartfelt gratitude to my family for their endless and profoundsupport - I cannot put into words how much it means to me.
5

This page intentionally left blank
6
Table of Contents
Chapter 1
Intro d u ctio n ........................................................ . 111.1 Motivation ........................................................................................... 111.2 Study objective................................................................................... 131.3 Purpose.............................................................................................. 13
1.3.1 Question formulation...................................................................... 141.4 Lim itations ......................................................................................... 141.5 Study approach and overview of adopted theory ............................ 151.6 Practical process of the study .......................................................... 161.7 Thesis outline ..................................................................................... 16
Chapter 2
IT h e o re i b a i ................................................... 192.1 Branding.............................................................................................. 19
2.1.1 Brand architecture ......................................................................... 202.1.2 Brand hierarchy ............................................................................ 21
2.2 Brand equity ....................................................................................... 232.2.1 Brand awareness.......................................................................... 232.2.2 Brand image .................................................................................. 232.2.3 Creating brand equity.................................................................... 242.2.4 Competitive frame of reference.................................................... 262.2.5 Target market ................................................................................ 262.2.6 Nature of the competition............................................................... 27
2.3 New products and brand extensions................................................ 272.3.1 Applying an existing brand............................................................. 272.3.2 Creating a sub-brand ..................................................................... 282.3.3 Advantages and disadvantages.................................................... 28
2.4 Design for recognition and association ........................................... 292.4.1 POD.............................................................................................. 292.4.2 POP .............................................................................................. 302.4.3 Core brand associations ............................................................... 302.4.4 Current product sign ..................................................................... 30
2.5 Communication through visual product design..............................312.5.1 Design features............................................................................... 31
7
2.5.2 PO D and PO P features................................................................. 322.6 A nalysis theory.................................................................................. 32
2.6.1 Statistical analysis approaches...................................................... 322.6.2 Inter-rater reliability ....................................................................... 342.6.3 Visual design analysis of a product portfolio..................................352.6.4 Identifying design features in a product ........................................ 37
Chapter 3
D e rivig a framework .......... ......... 393.1 Step I - Identify current product sign ............................................. 393.2 Step 2 - Identify product location in brand hierarchy.....................403.3 Step 3 - Identify current visual design language ........................... 433.4 Generating concepts..........................................................................44
Chapter 4
Experim ental evaluation........................................ 454.1 Experimental design ......................................................................... 45
4.1.1 Experim ental outline ..................................................................... 464 .1.2 C ase selection ............................................................................. . 4 6
4.2 Case descriptions .............................................................................. 474.2.1 Case A - B&O PLAY ..................................................................... 484.2.2 C ase B - D yson ............................................................................ 50
4.3 Participants......................................................................................... 524.4 Detailed experimental procedures....................................................52
4.4.1 Background survey ....................................................................... 534 .4 .2 P a rt 1 .......................................................................................... . . 5 34 .4 .3 R eflectio n 1 .................................................................................. . . 5 34 .4 .4 P a rt 2 ........................................................................................... . . 5 34 .4 .5 R eflectio n 2 .................................................................................... . 54
4.5 Experimental duration ....................................................................... 55
Chapter 5
Evaluation m ethodology ................. .............. 575.1 Preparation of drafts .......................................................................... 575.2 Expert Evaluation 1 ........................................................................... 58
8
5.3 Design analysis .................................................................................. 595.4 Expert Evaluation 2............................................................................ 62
5 .4 .1 M o tivatio n .................................................................................... . . 6 25.4.2 Development of new evaluation methodology ............................... 63
Chapter 6
Resuls .................................................................. 676.1 Initial evaluation ................................................................................ 67
6.1.1 Expert Evaluation 1....................................................................... 676.1.2 V isual design analysis.................................................................... 68
6.2 Expert Evaluation 2............................................................................ 696.3 Assessment of designers' ability to identify design factors ....... 736.4 Assessment of designers' own approaches....................................756.5 Designers' attitudes towards the proposed method......................76
Chapter 7
Discussion and conclusions ................................ 797.1 Designers' approaches to a brand extension task..........................807.2 Assessment of the framework .......................................................... 81
7.2.1 Interpretation of results ................................................................. 817.3 Im pact on creativity............................................................................ 837.4 Evaluation methodology................................................................... 84
7 .4 .1 S tructure ..................................................................................... . . 847.4 .2 Expert evaluation .......................................................................... 857.4.3 C om m ents on statistics................................................................. 85
7.5 Frameworks for visual design...........................................................867.6 Future w ork.......................................................................................... 87
Bibliography........................................................... 89
Appendices ............................................................ 95Appendix A: Experiment introduction....................................................95Appendix B: Design format analysis ...................................................... 96Appendix C: Design drafts - B&O PLAY................................................98Appendix D: Design drafts - Dyson .......................................................... 103Appendix E: Raw data - Expert Evaluation 2............................................108
9

This page intentionally left blank
10
Chapter 1
Introduction1.1 Motivation
When walking through a store or searching the Internet looking for a specificproduct, customers are typically presented with several options - multiplecompanies produce their own version of a specific product. In today's competitivemarket place, consumers often have to choose between products with similartechnical performance, quality, service, and price. As a consequence, recognitionplays an increasingly crucial role.
A company can attain recognition through various media; visual product design isone of them. A distinctive, aesthetically appealing design can certainly attractcustomers' attention. However, when companies aim to attain recognition throughvisual product design, they generally seek to develop a strong design language thatties some, or all, of the company's products together in a visually coherent manner.This is a strategic decision made with the purpose of achieving a broaderrecognition of the brand as a whole, referred to as brand recognition. The goal ofevery brand-oriented organization is to have a strong identity. In order to achieve astrong brand identity, recognition of the brand is highly desired.
Complementarily to incorporating visual consistency, companies can strategicallyemploy visual product design to communicate core brand values through theirproducts' appearance. Different forms, materials, textures, etc., evoke differentqualities and meanings in customers' minds. An important task for the company anddesigner is to identify and utilize design features that communicate the desiredmessage to current and potential target consumers. As such, visual product designbecomes an effective communication channel for the brand (Karjalainen, 2006), and
11
has been put forward as an essential strategic tool for companies to consider as theyseek to achieve a strong brand identity (Schmitt & Simonson, 1997; Stompff, 2003).
"In addition to meeting our practical needs, products are also used for social andpersonal purposes. Products functions as vehicles for communication and self-expression while revealing the user's identity to the external world and arousingpersonal pleasure." (Karjalainen, 2006)
The level of brand impact may fluctuate depending on market segment and culturaldifferences. However, if the market segment of interest is narrowed down to
consumer products for the commercial market, it is challenging to identify productsthat are not connected to some sort of branding association. Nevertheless, the trulysuccessful are the ones that manage to combine the tangible product performance
and technical excellence with the intangible brand associations.
Frameworks and methodologies that practically support designers as they approacha visual design task are very limited. An explanation proposed by Warell and Nabo
(2002) may be the fact that appreciation of visual design is dependent on subjectivefactors linked to individuals' expectations, taste, and attitudes (Tjalve, 1979).Decisions related to such factors rely heavily on the skill and experience of theindustrial designer. Traditionally, this type of "know-how" is considereduncapturable and indescribable (Warell & Nabo, 2002).
The methodology developed by Tjalve (1979) remains one of the few practical toolsavailable to industrial designers. Tjalve demonstrates a procedure for identificationof potential product structures, total form, and form elements. The process is builtaround variation of five product properties: structure, form, material, dimension,and surface. The focus is mainly on operation, space, and technical functionality,while less emphasis is put on semantics or aesthetic criteria. The work of Warell and
Nabo (2002) is another exception. The authors propose a set of tools based on
design syntactics: "design functionality analysis", "form development", and "design
format handling". Design format handling is a practical method for the identificationof visual brand-specific characteristics. The method does, however, tend to become
more of an analysis and evaluation tool, due to its time-consuming and directed
nature. Implementation of basic design guidelines is a more common routine
applied by companies to describe and communicate identity, sometimes referred to
as "design philosophies", "identity guidelines", or "design formats". Warell and Nabo
(2002) state that policies and vision declarations of such character have limited
ability to express design directions that can be translated to industrial design
specifications in a meaningful way. As a result, they are not well suited for practical
12
design work. Statements of this nature are further justified, since Karjalainen (2006)reveals that it can take up to two years for new designers at Nokia and Volvo tograsp what constitutes a viable design.
1.2 Study objective
The main objective of this study is to investigate how industrial designers may inpractice transfer an already established visual design language to new products.This is an important task for designers to master in today's competitive marketenvironment. By transferring an established visual design language to new productintroductions, a company can utilize its existing brand identity and recognition.Furthermore, introducing additional products with a similar design language willstrengthen brand recognition since individuals will come across the brand and itsappearance in new market segments - the brand will be more visible.
The goal is to derive and investigate a structured framework, grounded in existingbranding and visual design research, which can help industrial designers to moresuccessfully extend a brand's design language to a new product. Measurements ofsuccessfulness in this scenario are derived from established branding research. Thestarting point is a company brand with an established visual design language that isconsidered "up to date". When a company introduces a product in a new productsegment under an existing brand, it is referred to as a "brand extension"; this termwill be used throughout this thesis. Since there is no, to the author's knowledge,established and agreed upon practical framework applicable to this subject, asecondary goal is to investigate how designers in the field today would approach aproduct extension task.
The aim is to formalize a framework that is transparent and adaptable to variouscategories of consumer goods, something that both experienced and inexperienceddesigners can apply with confidence. Design is supposed to be a creative process;hence, it is crucial that the framework leaves room for the designers' creativity toflourish.
1.3 Purpose
The purpose of this empirical study is to add knowledge to the field of visual designmethodology, and to encourage further exploration in the area. A framework withthe characteristics described in the above section would have the ability to support
newly employed in-house designers as well as designers at design firms working
13
with different clients. In addition, the framework could potentially have educationalapplications, serving as a tool to develop design students' ability to think aboutvisual design in a strategic yet creative manner.
1.3.1 Question formulation
With regard to the purpose presented above, this thesis strives to answer thefollowing questions:
1. How do designers approach a brand extension task?
2. Can a structured framework, based on established branding and visualdesign research, help designers create more successful brand extensions?
3. Can a structured framework of this type limit designers' creative abilities?
1.4 Limitations
The study concerns physical, mass-produced products in the commercialmarketplace, where visual design is a key attribute affecting the artifact'sappearance. An industrial designer is in this scenario generally responsible for thedevelopment of the product's visual appearance. Parts of the proposed frameworkmay have applications in other fields of design, such as graphic design andmultimedia. However, such applications are not explored in this thesis.
As mentioned in Section 1.2, the starting point of this framework is a company witha visual design language with which it is satisfied. In some cases companies maywant to revitalize their visual design language, re-design an existing product, ordevelop a completely new visual design language. Such strategic decisions and tasksare not the focus of this study. The framework is specifically aimed at brands withan existing visual design language that is considered up to date; the company'sobjective is to extend its brand with a new product. The company's goal is tostrengthen its brand identity by applying its existing visual design language to a newproduct in a strategic manner.
Strategic decisions on visual product design are generally linked to differentiationand similarity on three dimensions. These dimensions are the company's existing
products, the company's former products (heritage), and competing products
(Mono, 1997; Warell, 2001). The author acknowledges that there can be value in
considering the visual appearance of past product generations. This is howevermainly applicable when a company aims to re-design an existing product or to
14
revitalize its visual design language as a whole. The framework therefore does nottake past products into consideration.
"Mimicking" is another interesting, yet invasive, design strategy related to brandrecognition. Typically, companies aim for similarity among their products andproduct generations, in combination with aesthetic differentiation from thecompeting products on the market. However, despite legal consideration, acompany may try to mimic another successful company's design language (Person,Schoormans, Snelders, & Karjalainen, 2008). As a result, the product might catchcustomers' attention, perhaps leading them to purchase the product, eitherbelieving that it is from a competing company (Miaoulis & D'Amato, 1978), or
believing that it has similar qualities as the product from the pioneering company
(Kapferer, 1995). Since this thesis focuses on companies with an established visualdesign language of their own, this strategy is not considered.
1.5 Study approach and overview of adopted theory
This section provides a brief overview of .the study approach and the adopted
theoretical reference frame.
The proposed framework is founded on established branding theory. The central
parts of the framework are derived through a holistic investigation of the basic
concept of branding. The investigation starts with the very basic notion of branding,
continues with an exploration of concepts such as brand architecture and brand
hierarchy, and finally arrives at the concept of brand equity. To ensure that the
framework is applicable from a practical standpoint, theories related to introduction
of new products and strategic visual product design are explored. Central parts of
the investigation include new products and brand extensions, design for recognition
and association, and communication theory in product design.
Works by Kevin Lane Keller and David A. Aaker form the foundation of the
theoretical basis related to branding concepts. These authors may be regarded as
some of the most influential in the field of marketing and branding. They have both
authored multiple books and articles that have been cited tens of thousands of
times. On theory related to branding considerations and methodology in visual
design, works by Anders Warell and Toni-Matti Karjalainen constitute the
foundation. The author of this thesis views them as some of the most influential
contributors in the field, and their works are cited multiple times throughout this
thesis.
15
1.6 Practical process of the study
The practical process consisted of the following sequential steps (see Figure 1).
00o
000 0 Designing &Literature 0 Deriving a Csning& Initial Enhanced
o Study Framwork ond ng Evaluation Evaluation0 Experiment - Expert - Expert
000 Evaluation I Evaluation 2- Visual DesignAnalysis
Figure 1: The practical process
1.7 Thesis outline
The thesis is divided into six chapters. Following the introductory chapter, Chapter
2 presents the theoretical basis of the thesis. The chapter provides information on
central branding concepts, new product introductions, and topics related to visual
product design that have directly influenced the development of the framework.
Finally, Section 2.6 contains information on visual design analysis approaches and
statistical data analysis methods applied during the experiment evaluation process.
The intent of Chapter 3 is to describe the proposed framework in detail. Decisions
on practical steps and the structure of the framework are motivated by the theories
presented in Chapter 2, Sections 2.1-2.5.
In Chapter 4, an experiment designed for evaluation of the framework is presented
and motivations behind design decisions are provided. 10 practicing industrial
designers participated in the experiment. The participants were asked to create two
product drafts, one using their intuition or own process, and the second using the
proposed framework.
The experiment evaluation procedures are presented in Chapter 5. First, a
preliminary expert evaluation is described and justified. Second, a visual design
analysis is exhibited and a process for identifying design features is explained. With
insights from these two evaluation methods, a refined second expert evaluation is
described and motivations are provided. The focus in this chapter is on the second
expert evaluation, since it is viewed as the final, most sensible and reliable
assessment of the experiment.
16
Chapter 6 presents the results of the study. Results from the statistical analysis ofExpert Evaluation 1, the visual design analysis, and Expert Evaluation 2 arepresented. Expert Evaluation 2 is analyzed in greater depth since it is consideredmore reliable. Results from an evaluation of designers' ability to identify designfeatures and storytelling factors are provided. In addition, an assessment ofdesigners' own approaches to the task is presented, and designers' attitudestowards the proposed framework are examined.
Finally, in Chapter 7 each research question is discussed based on the resultsdemonstrated in Chapter 6, and conclusions are drawn. In addition, the framework,
experiment methodology, and designers' attitudes are expanded upon. Lastly, the
possibilities for future work are addressed.
17
This page intentionally left blank
18
Chapter 2
Theoretical basis
2.1 Branding
The American Marketing Association defines a brand as a "name, term, design,symbol, or any other feature that identifies one seller's goods or services as distinctfrom those of other sellers" (AMA). According to this definition, when someone
creates an identifying feature, that person or organization has created a brand.However, to managers the meaning of a brand usually implies more than a singlefeature. An alternative definition is that a brand is something (tangible orintangible) that creates "awareness, reputation, prominence and so on in the marketplace" (Keller, Aperia, & Georgson, 2012).
Furthermore, brands can add value to both the brand owner, i.e. the company, and
the customer. Brands help customers to identify specific companies. Customerslearn about brands over time, through past product experiences and marketingcampaigns. Ultimately, brands help customers to identify the companies that fulfill
their expectations, and as a result simplify decision-making in the marketplace.
Because brands take on a personal meaning and create unique customer
experiences, they can provoke feelings and enrich customers' everyday lives (Keller
et al., 2012).
For companies, brands are an invaluable differentiation tool for attracting
customers. Due to personal attachment, brands evoke customer loyalty, which
creates bias for a specific company's products and therefore increase sales and/orallows for premium pricing. Design and manufacturing processes can often be
replicated to some extent. However, deeply rooted impressions in customers' mindsas a result of consistent product experiences and marketing are difficult to
19
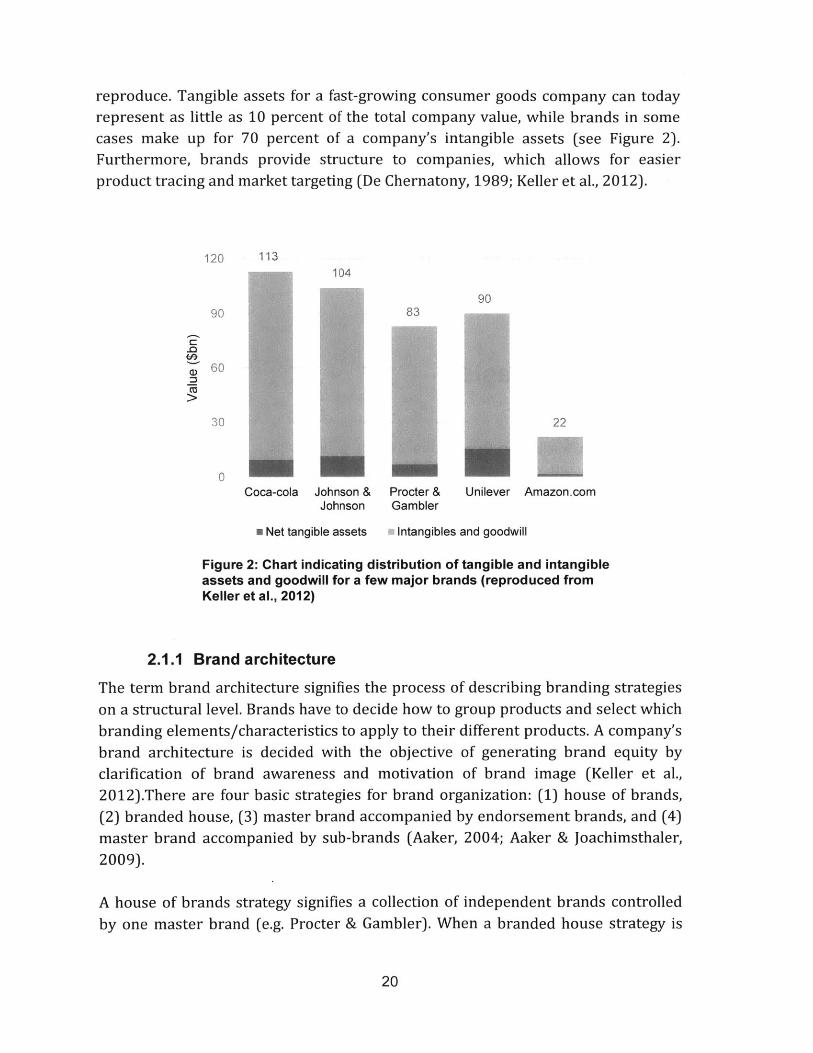
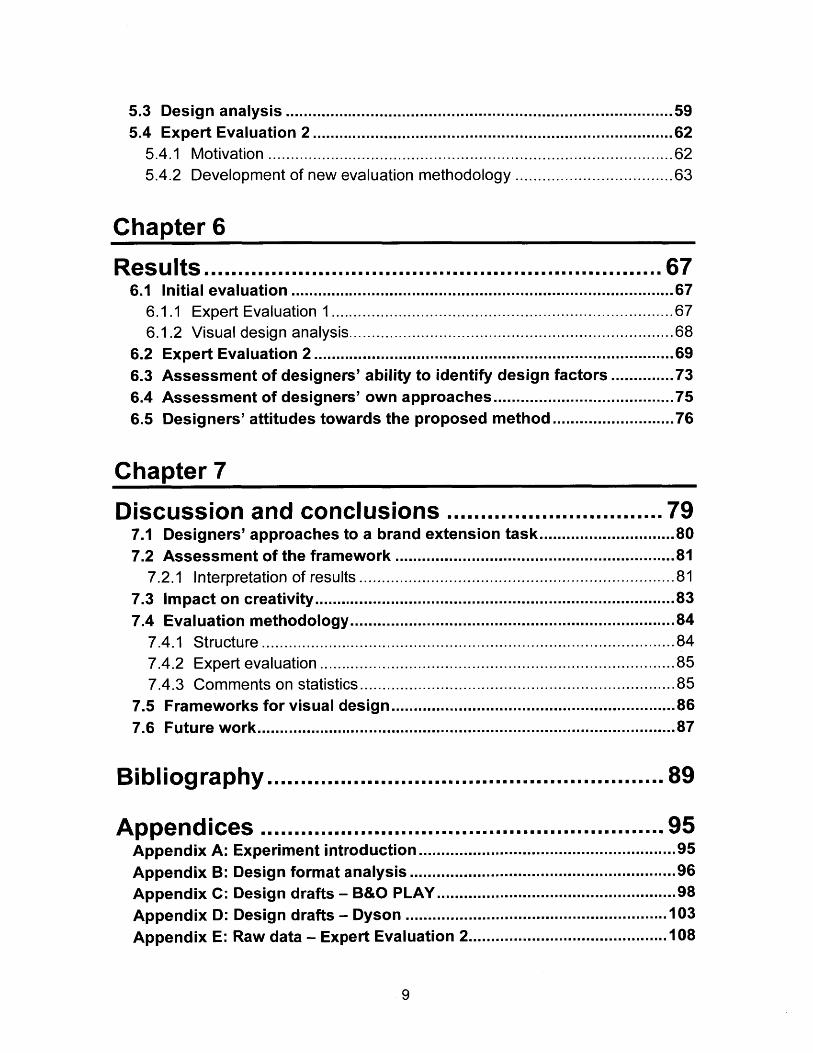
reproduce. Tangible assets for a fast-growing consumer goods company can todayrepresent as little as 10 percent of the total company value, while brands in somecases make up for 70 percent of a company's intangible assets (see Figure 2).Furthermore, brands provide structure to companies, which allows for easierproduct tracing and market targeting (De Chernatony, 1989; Keller et al., 2012).
120 113104
8390
22
Coca-cola Johnson & Procter &Johnson Gambler
m Net tangible assets
Unilever Amazon.com
Intangibles and goodwill
Figure 2: Chart indicating distribution of tangible and intangibleassets and goodwill for a few major brands (reproduced fromKeller et al., 2012)
2.1.1 Brand architecture
The term brand architecture signifies the process of describing branding strategieson a structural level. Brands have to decide how to group products and select whichbranding elements/characteristics to apply to their different products. A company'sbrand architecture is decided with the objective of generating brand equity byclarification of brand awareness and motivation of brand image (Keller et al.,2012).There are four basic strategies for brand organization: (1) house of brands,(2) branded house, (3) master brand accompanied by endorsement brands, and (4)master brand accompanied by sub-brands (Aaker, 2004; Aaker & Joachimsthaler,
2009).
A house of brands strategy signifies a collection of independent brands controlled
by one master brand (e.g. Procter & Gambler). When a branded house strategy is
20
:3
76
90
60
30
0
employed, one master brand is applied to all products. In this case, the master brandis called an umbrella brand or family brand (e.g. Toshiba). Endorsement brands areindependent to a certain extent, although linked to a master brand (e.g. Post-it by3M). Sub-brands are also somewhat independent, except that they have a strongerconnection to the master brand (e.g. Lenovo ThinkPad) (Aaker, 2004).
It should be noted that the vast majority of organizations applies some type ofcombination of the four branding strategies mentioned above. Each strategy andcombination of strategies has its advantages and disadvantages (Aaker, 2004);however, they are outside the scope of this thesis.
2.1.2 Brand hierarchy
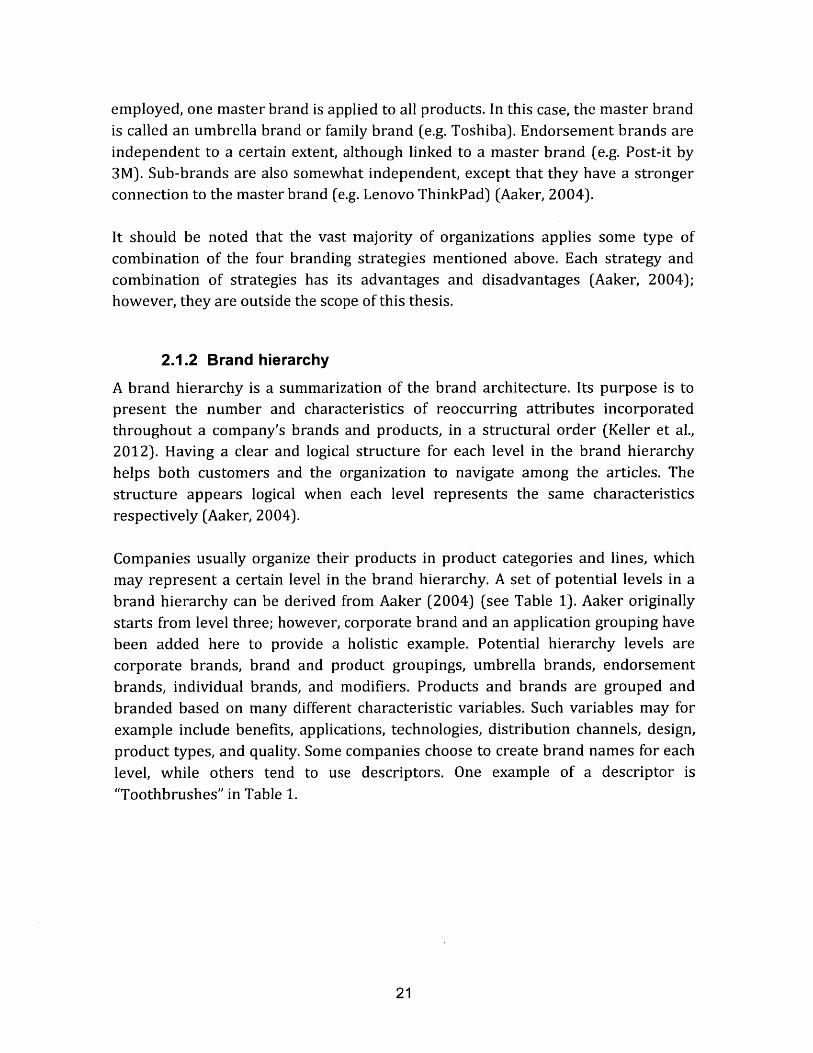
A brand hierarchy is a summarization of the brand architecture. Its purpose is topresent the number and characteristics of reoccurring attributes incorporatedthroughout a company's brands and products, in a structural order (Keller et al.,2012). Having a clear and logical structure for each level in the brand hierarchyhelps both customers and the organization to navigate among the articles. Thestructure appears logical when each level represents the same characteristicsrespectively (Aaker, 2004).
Companies usually organize their products in product categories and lines, whichmay represent a certain level in the brand hierarchy. A set of potential levels in a
brand hierarchy can be derived from Aaker (2004) (see Table 1). Aaker originallystarts from level three; however, corporate brand and an application grouping havebeen added here to provide a holistic example. Potential hierarchy levels arecorporate brands, brand and product groupings, umbrella brands, endorsementbrands, individual brands, and modifiers. Products and brands are grouped andbranded based on many different characteristic variables. Such variables may for
example include benefits, applications, technologies, distribution channels, design,
product types, and quality. Some companies choose to create brand names for each
level, while others tend to use descriptors. One example of a descriptor is
"Toothbrushes" in Table 1.
21
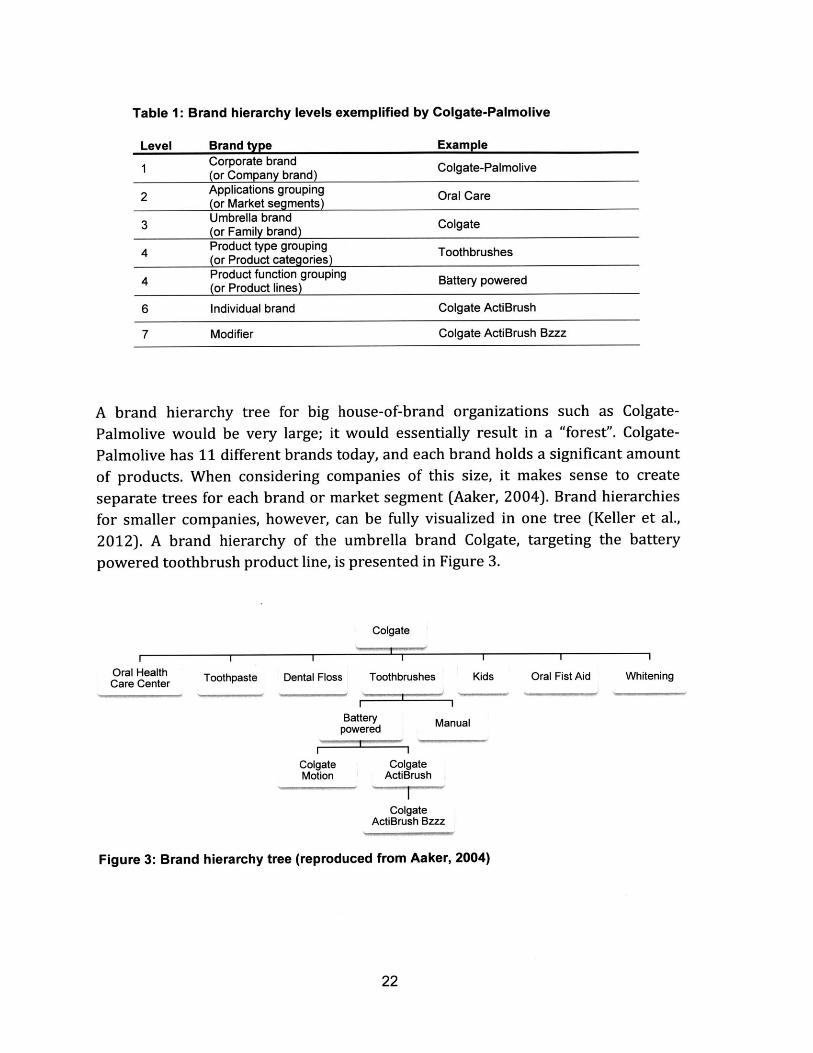
Table 1: Brand hierarchy levels exemplified by Colgate-Palmolive
Level Brand type Example
1 Corporate brand Colgate-Palmolive(or Company brand)
2 Applications grouping Oral Care(or Market segments)
3 Umbrella brand Colgate(or Family brand)
4 Product type grouping Toothbrushes(or Product categories)
4 Product function grouping Battery powered(or Product lines)
6 Individual brand Colgate ActiBrush
7 Modifier Colgate ActiBrush Bzzz
A brand hierarchy tree for big house-of-brand organizations such as Colgate-
Palmolive would be very large; it would essentially result in a "forest". Colgate-
Palmolive has 11 different brands today, and each brand holds a significant amount
of products. When considering companies of this size, it makes sense to create
separate trees for each brand or market segment (Aaker, 2004). Brand hierarchies
for smaller companies, however, can be fully visualized in one tree (Keller et al.,
2012). A brand hierarchy of the umbrella brand Colgate, targeting the battery
powered toothbrush product line, is presented in Figure 3.
Oral HealthCare Center Toothpaste
Colgate
Dental Floss Toothbrushes Kids Oral Fist Aid Whitening
Battery Manualpowered
Colgate ColgateMotion ActiBrush
ColgateActiBrush Bzzz
Figure 3: Brand hierarchy tree (reproduced from Aaker, 2004)
22
2.2 Brand equity
Keller et al. (2012) defines brand equity as "the differential effect that brandknowledge has on consumer response to the marketing of that brand". When abrand has positive brand equity, consumers perceive a product and its marketingmaterial as more appealing once the brand has been identified, compared to when itis unknown. As a result, consumers tend to be less concerned with price increases,more open to brand extensions, and more willing to connect with the brand via newchannels. If a brand possesses negative brand equity, on the other hand, consumersfind unnamed or fictitious versions of a product more appealing. According to itsdefinition, brand equity is based on three components: brand knowledge,differential effect, and consumer response to marketing. However, the essentialsource of brand equity generation is said to be brand knowledge, since it enlightensconsumers about differences and draws interest to the brand. Brand knowledgeitself consists of two components: brand awareness and brand image (Keller et al.,2012).
2.2.1 Brand awareness
Brand awareness signifies consumers' ability to identify a brand from memoryunder certain conditions; it can be divided in two categories: brand recognition andbrand recall. Brand recognition represents customers' ability to correctly identifythe brand when given brand cues. In the market place this refers to how wellconsumers perceive a brand as something that they have seen before. On the otherhand, brand recall represents consumers' ability to from memory relate a brand to aproduct category (Keller et al., 2012).
2.2.2 Brand image
Brand image refers to consumers' perceptions of a brand as reflected byassociations to a brand in memory. Thus, for a brand to have a positive brand image,the brand has to communicate information that generates strong, favorable, andunique associations. Associations may be directly related to consumers' productexperience, but can also come from other product-independent sources. Marketingcampaigns, word of mouth, and identification with a company, country, distributionchannel, particular person, place, or event are all examples of product-independentsources (Keller et al., 2012).
23
2.2.3 Creating brand equity
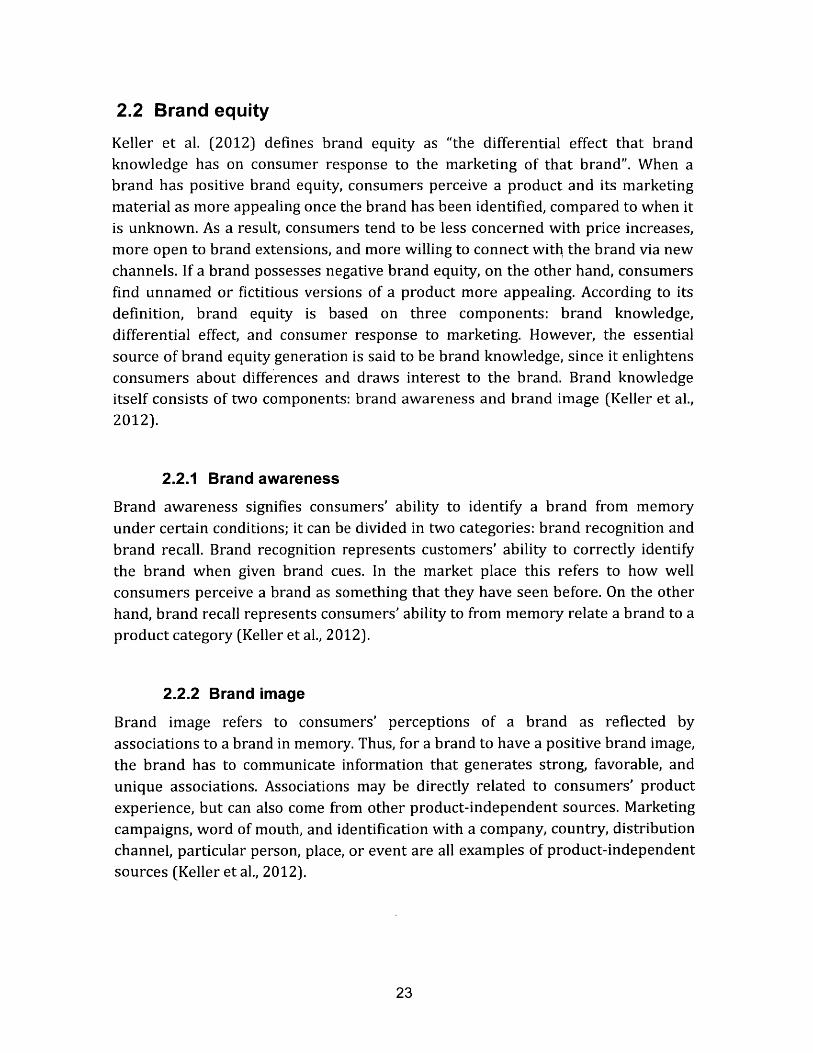
As mentioned above, the key to positive brand equity is brand knowledge. Brandknowledge is established though brand awareness and brand image. Hence thequestion becomes: how are positive brand awareness and prominent brand imagegenerated? A widely adopted approach is the Customer-Based Brand Equity (CBBE)model, first introduced by Kevin Lane Keller. CBBE consists of four steps, allconnected to a certain task, customer question, and branding step (see Table 2).
Keller emphasizes that these four steps have to be completed sequentially. Hence abrand has to establish an identity before it can achieve a brand meaning in
consumers' minds; brand meaning fosters consumer response, and ultimately aconsumer relationship can be accomplished.
Table 2: The four steps of CBBE (reproduced from Keller et al., 2012)
Step Branding taskQuestion asked by thecustomer
Correspondingbrand step
Identify the brand with customers and Who are you? Brand identity
1 associate the brand in customers' mindswith a specific product class or customerneed.
Establish the totality of brand meaning in What are you? Brand meaningthe minds of customers by strategically
2 linking a host of tangible and intangible
properties.
Elicit the proper customer responses to What about you? Brand response
3 this brand identification and brandmeaning.
Convert brand response to create an What about you and me? Brand relationship
4 intense, active loyalty relationshipbetween customers and the brand.
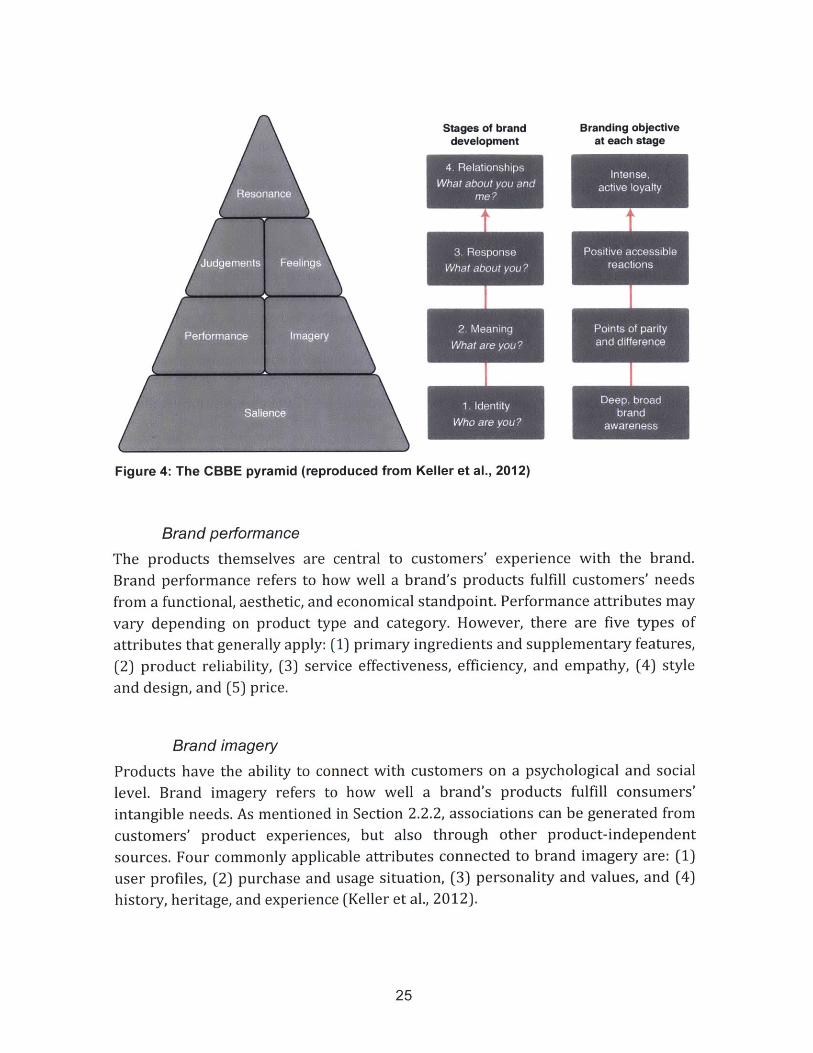
This process is illustrated as a pyramid consisting of six building blocks (see Figure4). Brand meaning can be categorized into two groups: performance and imagery.The same holds for brand response, which can be divided into judgments andfeelings. Brand equity is created when the blocks are assembled and the pinnacle isreached. As the pyramid shape suggests, brand equity can only be created when theblocks are assembled in the right order, starting from the bottom (Keller et al.,2012). The nature of this thesis suggests that brand meaning, i.e. performance andimagery, is subject to further examination.
24
Stages of branddevelopment
Branding objectiveat each stage
t t
I I
I I
Figure 4: The CBBE pyramid (reproduced from Keller et al., 2012)
Brand performance
The products themselves are central to customers' experience with the brand.Brand performance refers to how well a brand's products fulfill customers' needs
from a functional, aesthetic, and economical standpoint. Performance attributes mayvary depending on product type and category. However, there are five types ofattributes that generally apply: (1) primary ingredients and supplementary features,(2) product reliability, (3) service effectiveness, efficiency, and empathy, (4) style
and design, and (5) price.
Brand imagery
Products have the ability to connect with customers on a psychological and sociallevel. Brand imagery refers to how well a brand's products fulfill consumers'intangible needs. As mentioned in Section 2.2.2, associations can be generated fromcustomers' product experiences, but also through other product-independent
sources. Four commonly applicable attributes connected to brand imagery are: (1)user profiles, (2) purchase and usage situation, (3) personality and values, and (4)
history, heritage, and experience (Keller et al., 2012).
25
2.2.4 Competitive frame of reference
In order to generate desired brand knowledge, it is necessary to define the brand'scompetitive frame of reference. Before applying the customer-based brand equity
model addressed in Section 2.2.3, it is crucial to define the brand positioning, since itwill help to decide on the specific characteristics of each block in the pyramid model.Thus, the competitive frame of reference will have an impact on the decisionsrelated to desired performance and imagery.
Consumers perceive a brand differently depending on its position with regard tocompetitors. The objective is to position the brand so that it enlightens core values,unique aspects, and aspects that may be shared with other brands. Therefore, it is
important to have a clear frame of reference, i.e. an understanding of howconsumers behave and what they take into consideration when making their choice
of brand and product. To determine the competitive frame of reference, it isnecessary to identify the target market and the nature of the competition (Keller et
al., 2012).
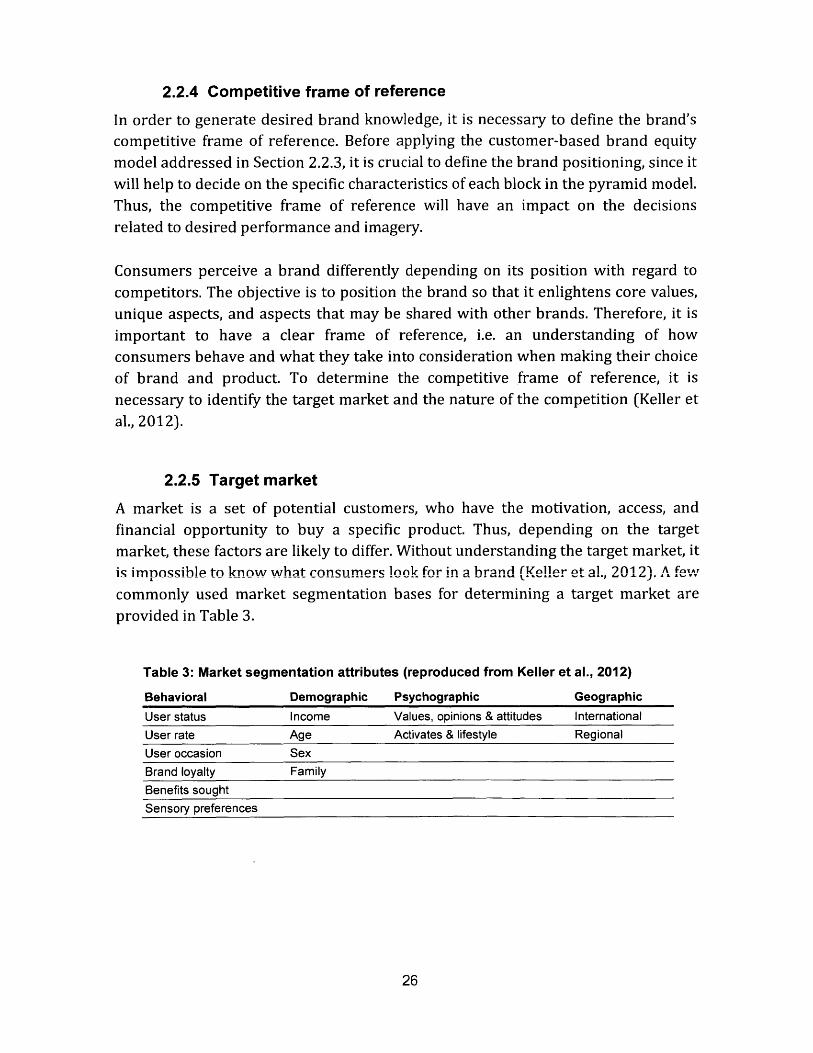
2.2.5 Target market
A market is a set of potential customers, who have the motivation, access, andfinancial opportunity to buy a specific product. Thus, depending on the targetmarket, these factors are likely to differ. Without understanding the target market, itis impossilhe to know whait roniimers lnnk fnr in n hrand (Waller et n1 ?tH2). A feiA
commonly used market segmentation bases for determining a target market areprovided in Table 3.
Table 3: Market segmentation attributes (reproduced from Keller et al., 2012)
Behavioral Demographic Psychographic Geographic
User status Income Values, opinions & attitudes International
User rate Age Activates & lifestyle Regional
User occasion Sex
Brand loyalty Family
Benefits sought
Sensory preferences
26
2.2.6 Nature of the competition
It is vital to have a clear understanding of the nature of the competition. Studyingcompeting brands and their products assists designers, strategists, and marketers todecide on which common elements to incorporate in order to help the customersnavigate the offerings on the market. In addition, it provides guidance as to how thebrand can differentiate itself from the competition (Warell, 2001).
However, depending on product type, it is sometimes hard to distinguish the natureof the competition and the target market for a brand or product, since the targetconsumers might already be looking at similar brands, which can implicitly indicatethe nature of the competition (Keller et al., 2012).
2.3 New products and brand extensions
For a company to achieve long-standing success, new product releases are essential.When a company wants to introduce a new product, it has three different brandingstrategies to choose from: (1) introducing a completely new brand, specific to thenew product, (2) applying an already existing brand, or (3) creating a so-called sub-brand by combining a new brand with an existing brand. The second and thirdalternatives are both considered brand extensions. Brand extension is defined as"when a firm uses an established brand to introduce a new product" (Keller & Aaker,1992; Keller et al., 2012).
2.3.1 Applying an existing brand
Farquhar (1989) classifies brand extension of this type in two groups: categoryextensions and line extensions. "Category extension" is when a brand introduces anew product outside of its previously existing product categories. For example, ifB&O Play were to introduce a camera it would be considered a brand categoryextension, since B&O Play does not currently market a product in that category.
"Line extension" is when a company introduces a product that fits into an existing
product line within the brand. For example, if Dyson were to introduce a robotic
vacuum cleaner to its existing vacuum cleaner line, it would be considered a productline extension.
Another concept for brand extension categorization is based on horizontal andvertical brand extensions. This concept provides a way to distinguish between whenan existing brand extends within its current market position, and when it changes
positioning upward and downward, in terms of price and quality. "Horizontal
27
extension" is when an established brand introduces a new product that is eitherrelated to an existing product category or creates a new category on its own (Pitta &Katsanis, 1995; Doust & Esfahlan, 2012). Hence, a horizontal extension can be eithera category or line extension, but market position is kept the same. "Verticalextension" is instead when an established brand introduces a new productassociated with an existing product category or line, but in a different marketposition. "Upward vertical extension" signifies higher quality and price, while"downward vertical extension" signifies lower quality and price (Aaker, 1997; He &Li, 2010). In this case, a brand generates two products from one by creating aprofessional, luxury or low-cost version of an existing product (Andersson & Warell,2015).
2.3.2 Creating a sub-brand
This branding strategy is utilized when a brand seeks to shift target market and/ormarket position. Therefore, the horizontal and vertical extension concepts can beapplied to this strategy as well. Sub-brands are introduced with the intention thatthey will benefit from the awareness brought by the existing brand, also referred toas a "mother brand". This has to be done carefully in order to not damage themother brand, especially when considering downward vertical extensions (Aaker,1997; Keller et al., 2012). For example, B&O PLAY can be considered a sub-brand toBang & Olufsen. Furthermore, since B&O PLAY products have a lower price pointand different target market (B&O a), it can be considered a downward verticalbrand extension.
2.3.3 Advantages and disadvantages
Keller et al. (2012) state that for most companies "the question is not whether abrand should be extended, but when, where and how". There are generally twoadvantages associated with brand extensions: aid of new product acceptance, andnew feedback to the brand. Although brand extensions are common practice today,brands should still plan extensions thoughtfully and be aware that there are a fewdisadvantages associated with the act. Table 4 provides a compilation of advantagesand disadvantages associated with brand extensions.
28
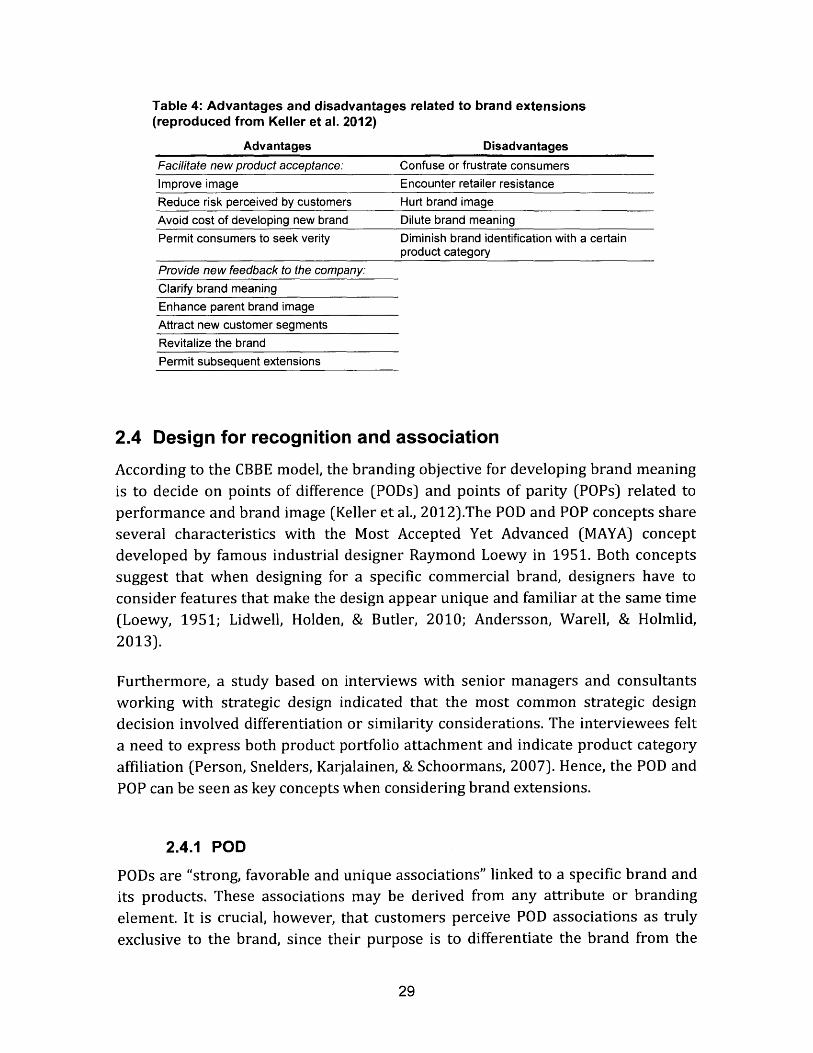
Table 4: Advantages and disadvantages related to brand extensions(reproduced from Keller et al. 2012)
Advantages DisadvantagesFacilitate new product acceptance: Confuse or frustrate consumersImprove image Encounter retailer resistanceReduce risk perceived by customers Hurt brand imageAvoid cost of developing new brand Dilute brand meaningPermit consumers to seek verity Diminish brand identification with a certain
product categoryProvide new feedback to the company:Clarify brand meaningEnhance parent brand imageAttract new customer segmentsRevitalize the brandPermit subsequent extensions
2.4 Design for recognition and association
According to the CBBE model, the branding objective for developing brand meaningis to decide on points of difference (PODs) and points of parity (POPs) related toperformance and brand image (Keller et al., 2012).The POD and POP concepts shareseveral characteristics with the Most Accepted Yet Advanced (MAYA) conceptdeveloped by famous industrial designer Raymond Loewy in 1951. Both conceptssuggest that when designing for a specific commercial brand, designers have toconsider features that make the design appear unique and familiar at the same time(Loewy, 1951; Lidwell, Holden, & Butler, 2010; Andersson, Warell, & Holmlid,
2013).
Furthermore, a study based on interviews with senior managers and consultantsworking with strategic design indicated that the most common strategic designdecision involved differentiation or similarity considerations. The interviewees felt
a need to express both product portfolio attachment and indicate product categoryaffiliation (Person, Snelders, Karjalainen, & Schoormans, 2007). Hence, the POD and
POP can be seen as key concepts when considering brand extensions.
2.4.1 POD
PODs are "strong, favorable and unique associations" linked to a specific brand and
its products. These associations may be derived from any attribute or branding
element. It is crucial, however, that customers perceive POD associations as truly
exclusive to the brand, since their purpose is to differentiate the brand from the
29
crowd. Keller et al. state that consumers often choose a brand based on uniqueness;thus it is important to create strong and favorable associations (Keller et al., 2012).By systematically applying defined design strategies over a longer period of time,brands can develop strong PODs, defined by the brand history and what some referto as "brand DNA" (Warell, 2006; Karjalainen & Snelders, 2010; Kapferer, 2012;Andersson & Warell, 2015).
2.4.2 POP
POPs are associations shared with other brands and their products. There are twotypes of POPs: category POPs and competitive POPs. Category POPs are associationsnecessary for customers to consider a product to be a member of a certain productcategory. When introducing a brand extension, a solid understanding of whichcategory POPs to include is crucial. Competitive POPs are associations extractedfrom competitors' products. For example, if customers perceive one brand's PODs astypical for a specific product category, another brand may incorporate similarassociations as an attempt to "break even" (Keller et al., 2012).
2.4.3 Core brand associations
The core brand associations are a set of five to 10 attributes that capture theessence of the brand and what it represents. More specifically, they should reflecthow consumers perceive the brand based on attributes such as beliefs, attitudes.opinions, feelings, images, and experiences. As a brand evolves and expands, theseassociations serve as a foundation for brand positioning and identification of PODs.Core brand associations are often categorized as top-of-mind associations, and canbe identified by creating a simple mental map (Keller et al., 2012). Some may referto core brand associations as "storytelling factors" (Bennett, 2013). In terms ofproduct design, core brand associations function as an indication of what semanticfunction the product should express (Mono, 1997).
2.4.4 Current product sign
The current product sign is a notion closely related to the category POP concept.Both concepts aim to define design features necessary for customers to recognizeaffiliation with a certain product category. However, the current product sign is aconcept directly related to product design. It implies a more holistic viewconsidering the product's complete physical appearance. Design attributes toconsider when identifying the current product sign are usually related totechnological principles, and ergonomic and communicative functions. Attributes
30
may differ widely depending on the product (Mon6, 1997; Ranscombe, Hicks, &Mullineux, 2012; Andersson et al., 2013). However, a few general attributes toconsider are product components, product organization/structure, materials,texture, and ergonomic and communicative elements.
2.5 Communication through visual product design
Companies may use many different tools to communicate their core brand values tothe consumers; product design is one of these tools (Karjalainen, 2006). In order forthe communication to be successful, companies should utilize all tools in a coherentmanner. In other words, all communication channels should be synchronized andaim to deliver a similar message (Aaker, 1996).
When product design is employed as a communication tool, company values areexpressed via design features incorporated into the design of the product. Thesedesign features, together with the other communication tools, embody the brand'sidentity (Mooy & Robben, 2002).
2.5.1 Design features
Design features, also referred to as design cues or design references, are specificelements of a product gestalt. For example, form elements, such as a specific curve,shape or pattern, can be considered design features (Mollerup, 1997; Karjalainen &Snelders, 2010; Andersson & Warell, 2015). In some cases, the characteristics of an
overall appearance may be considered a feature. Harm Lagaay, accomplished car
designer and former design director at Porsche, states that the characteristic
Porsche shape is defined by "the combination of surface treatment, highlighting and
tension, which to a large extent comes from the transition from convex and concave
shapes". Lagaay infers that there is no single design feature, such as a radiator grill,
that identifies a Porsche, but rather it is the overall design of details and surfaces
(Weernink, 2001).
Design features can utilized in a strategic manner to create recognition through
similarity, as a result of repetitive implementation over a product rage (Warell,
2001; Person et al., 2007). Furthermore, depending on characteristics (shape, color,
texture, material, etc.) a design feature can communicate core brand values on its
own. Hence, design features can be used as an embodiment of product and brand
associations (Kreuzbauer & Malter, 2005; Karjalainen & Snelders, 2010).
Consequently, when design features are employed thoughtfully, they have the
31
potential to become a central, well-recognized communicator of the brand's corevalues (Oppenheimer, 2005).
2.5.2 POD and POP features
Design features can be categorized by the POD and POP concepts addressed inSection 2.4. A visually distinct design feature can be incorporated into a design todifferentiate a product from competing products; a feature of this type iscategorized as a POD. Design features categorized as POP may be used tocommunicate affiliation to a specific product category. As such, they are featurescommonly employed throughout the product category, and are therefore sharedwith other brands. As a result, designers commonly use both POD and POP featuresto create products that demonstrate distinct brand affiliation while at the same timeproviding a product category indication (Keller et al., 2012; Andersson & Warell,2015).
2.6 Analysis theory
The theory presented in this section covers concepts relevant to the analysis of theexperimental evaluation conducted in this study.
2.6.1 Statistical analysis approaches
The Student's t-test is a commonly applied method used to determine thesignificance of the difference between means of two independent samples. In otherwords, it is a test of the null hypothesis that the means of two samples are equal.The Student's t-test compares differences between the mean value for a specificgroup and that of the whole population. Furthermore, the Student's t-test requirescontinuous data and assumes that the data are normally distributed. The Kruskal-Wallis test is another method applicable to comparison of two or more independentsamples. It is a rank-based method that tests the null hypothesis that the samplescome from the same location, i.e. same group. The Kruskal-Wallis test is non-parametric and thus does not assume that the data are normally distributed.Furthermore, the method is valid for small samples, the minimum limit being five(N=5). The Kruskal-Wallis test does, however, make the assumption that thedistribution for each group has a similar shape (McDonald, 2014).
Bootstrapping, i.e. random sampling with replacement, is a useful approach whenassumptions about the population cannot be made directly. The method is valid for
32
small samples, since it expands the data set by selecting new observations sampledfrom the experimental data, making it particularly useful when it is difficult tosource more data. The only assumption made is that the sample is a goodapproximation of the population (Ader, Mellenbergh, & Hand, 2008). To comparethe performance of two groups, one may want compare the difference between themeans of two experimental groups. For example, when comparing the performanceof two groups of N people, scores from both groups can be selected to form a pool of2N scores. From that pool, two new groups of N scores can be extracted withreplacement allowed. Mean values of scores from both groups can then becalculated. The difference in means can then be computed, resulting in a data point.Repeating the same scheme multiple (e.g. 1000) times results in a distribution ofdata points. The computer-generated distribution has its own mean and standarddeviation, and is normally distributed. Confidence intervals can then be calculated.The difference between the experimental and the control means can be comparedwith the computer-generated distribution. The experimental difference isdetermined to be statistically significant if it is outside the confidence interval.Usually a 95% confidence interval is applied.
Paired tests
The paired sample t-test is a statistical technique that is commonly used to comparetwo population means when the observations are paired. The test is frequently usedin scenarios such as "before-after" and "case-control" studies. It tests the nullhypothesis that the mean difference between paired observations is zero. The test
requires continuous data, and assumes that the data is normally distributed. TheWilcoxon signed-rank test is another method applicable to comparison of paired
samples. It can be considered the non-parametric equivalent to the paired t-test.Since the Wilcoxon signed-rank test is non-parametric, it does not assume that thedata are normally distributed. It is a rank-based method that tests the nullhypothesis that the median difference between paired measurements is zero, i.e.that the number of differences in each direction are equal. Furthermore, the method
is frequently applied for small samples. (McDonald, 2014).
Fisher's exact test
The Fisher's exact test can be used to examine the significance of the contingency
between two classifications, for example between "before-after" scenarios. The
method is for example useful when the assumptions that two samples line up cannot
be steadily proved. Moreover, when members of two independent groups can fall
into one of two mutually exclusive classifications, e.g. a "high ranked group" and a
33
"low ranked group", a two by two contingency table may be created (see Table 5).The Fisher's exact test is used to determine whether the proportions of those fallinginto each classification differ by group. Hence, the null hypothesis is that there is noassociation between the relative proportions of the two variables (McDonald, 2014).
Table 5: Two by two contingency table template for Fisher's exact test
High ranked group Low ranked group Row Total
Scenario 1 a b a+bScenario 2 c d c+dColumn Total a+c b+d a+b+c+d (=n)
Furthermore, the probability of observing a given set of frequencies a, b, c, and d in atwo by two contingency table, with fixed row and column totals and sample size n,can be calculated using Equation (1). The equation below gives the one-tailed Fisherp-value and exemplifies the concept; however, usually a two-tailed p-value isrecommended, unless it can be justified that one scenario simply cannot be "worse"than the other.
(a+b(c+d) (a + b)! (c + d)! (a + c)! (b + d)!+n) a! b! c! d! n!
2.6.2 Inter-rater reliability
Consider an event where multiple individuals, here referred to as raters, are askedto independently evaluate a subject or an object based on a specific criterion. Ratersmay for example evaluate a subject or an object by assigning values with nominal orordinal characteristics. Inter-rater reliability is a measurement of the extent of theagreement among raters; it indicates whether the differences among raters'assigned values are comparable with the differences among randomly assignedvalues. As such, it provides information on whether the data are to a large extentaffected by the raters instead of by the subjects or objects that are being evaluated(Gwet, 2014).
There are many types of statistical approaches to inter-rater reliability for differenttypes of measurements. Krippendorff's alpha is considered to be one of the moreversatile approaches, applicable on numerous distance metrics including: nominal,
34
ordinal, interval, and ratio labels (van Rysewyk & Pontier, 2014). Furthermore, it isvalid for small sample sizes, and when two or more raters have been utilized. AKrippendorff's alpha of 1 signifies perfect reliability, while and an alpha of 0.67typically can be considered satisfactory. Although, some researchers have acceptedslightly lower alpha values as satisfactory or sufficient (Poetz & Schreier, 2012;Antoine, Villaneau, & Lefeuvre, 2014). Krippendorffs alpha can for example becalculated in the analytics software IBM SPSS using a macro, or in MATLAB using averified function (Eggink, 2012).
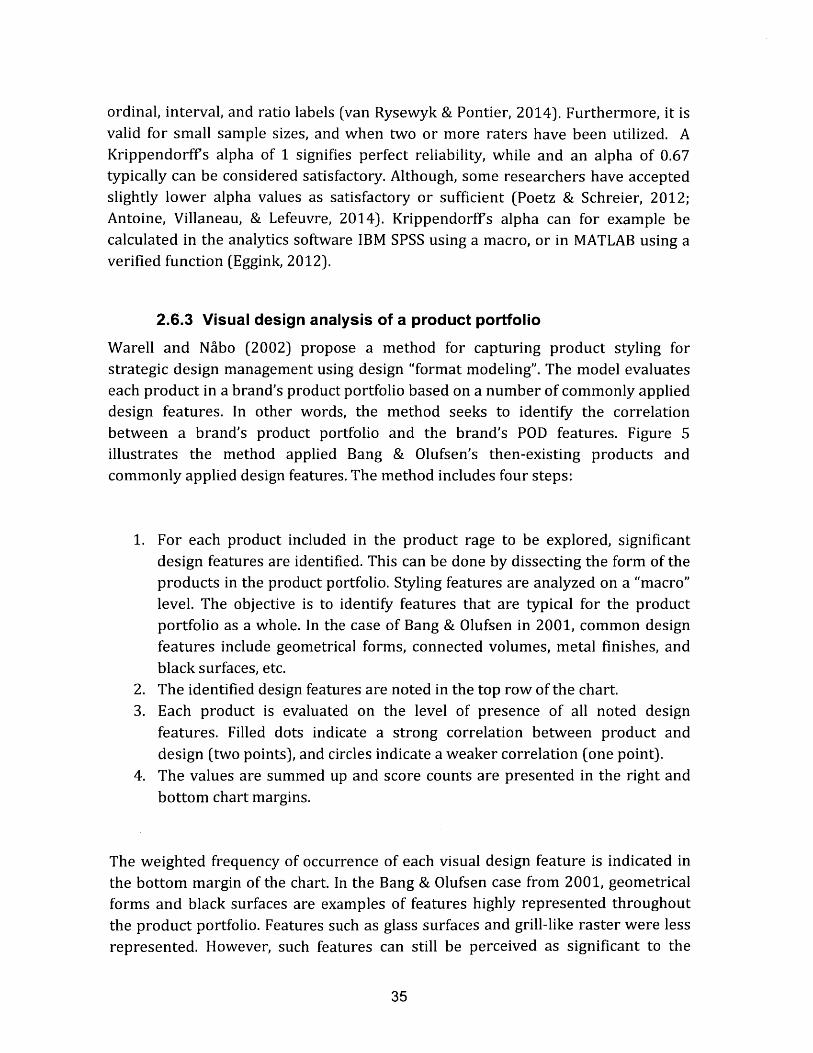
2.6.3 Visual design analysis of a product portfolio
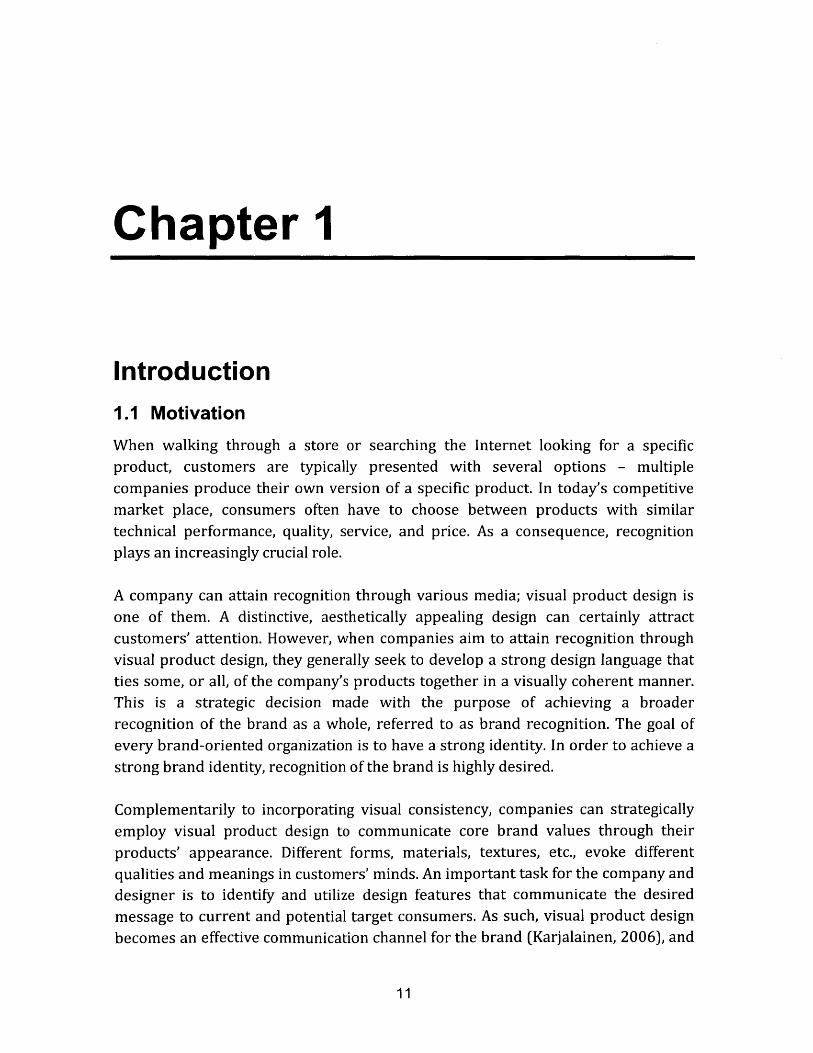
Warell and Nabo (2002) propose a method for capturing product styling forstrategic design management using design "format modeling". The model evaluateseach product in a brand's product portfolio based on a number of commonly applieddesign features. In other words, the method seeks to identify the correlationbetween a brand's product portfolio and the brand's POD features. Figure 5illustrates the method applied Bang & Olufsen's then-existing products andcommonly applied design features. The method includes four steps:
1. For each product included in the product rage to be explored, significantdesign features are identified. This can be done by dissecting the form of theproducts in the product portfolio. Styling features are analyzed on a "macro"level. The objective is to identify features that are typical for the productportfolio as a whole. In the case of Bang & Olufsen in 2001, common designfeatures include geometrical forms, connected volumes, metal finishes, andblack surfaces, etc.
2. The identified design features are noted in the top row of the chart.3. Each product is evaluated on the level of presence of all noted design
features. Filled dots indicate a strong correlation between product anddesign (two points), and circles indicate a weaker correlation (one point).
4. The values are summed up and score counts are presented in the right andbottom chart margins.
The weighted frequency of occurrence of each visual design feature is indicated inthe bottom margin of the chart. In the Bang & Olufsen case from 2001, geometricalforms and black surfaces are examples of features highly represented throughoutthe product portfolio. Features such as glass surfaces and grill-like raster were lessrepresented. However, such features can still be perceived as significant to the
35

brand's visual brand identity if applied consistently over a couple of products in the
brand's portfolio. Numbers in the right margin indicate the level of occurrence of
styling features in each product. Products receiving high scores are typical to the
brand's styling scheme and can be referred to as "strong" products, while products
receiving low scores are less characteristic to the product portfolio's visual design
language (Warell & Nabo, 2002).
C <~
020
14
0 0 15
* ~ 14
fL4-4-20.B *4 15
15
Figure 5: Visual design analysis performed on Bang &Olufsen's product portfolio in 2001 (Warell & Nbbo 2002)
36
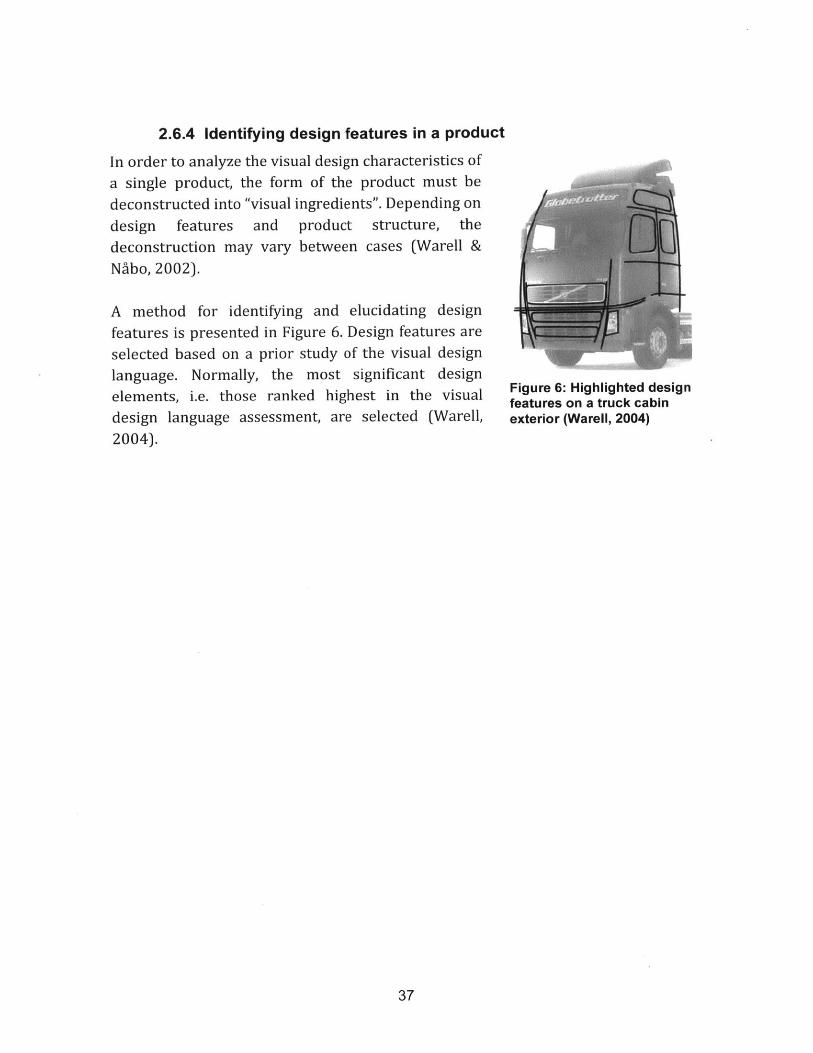
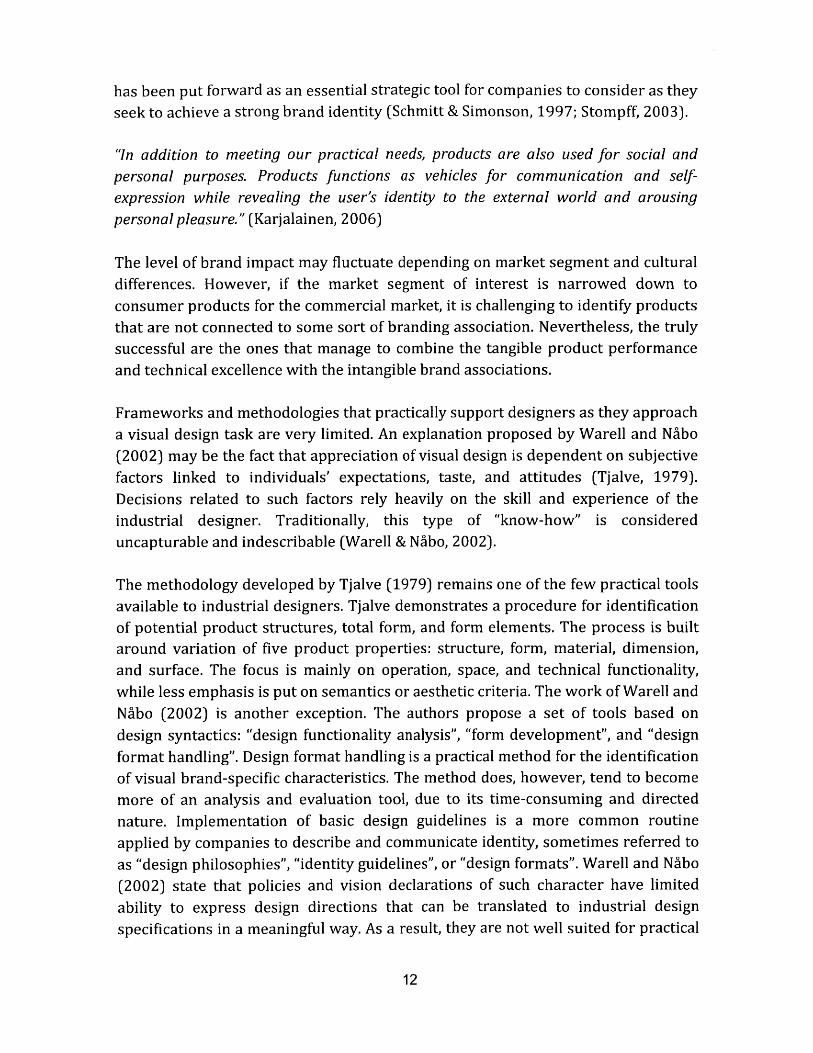
2.6.4 Identifying design features in a product
In order to analyze the visual design characteristics of
a single product, the form of the product must be
deconstructed into "visual ingredients". Depending on
design features and product structure, the
deconstruction may vary between cases (Warell &
Nubo, 2002).
A method for identifying and elucidating design
features is presented in Figure 6. Design features are
selected based on a prior study of the visual design
language. Normally, the most significant design
elements, i.e. those ranked highest in the visual
design language assessment, are selected (Warell,
2004).
Figure 6: Highlighted designfeatures on a truck cabinexterior (Warell, 2004)
37

This page intentionally left blank
38
Chapter 3
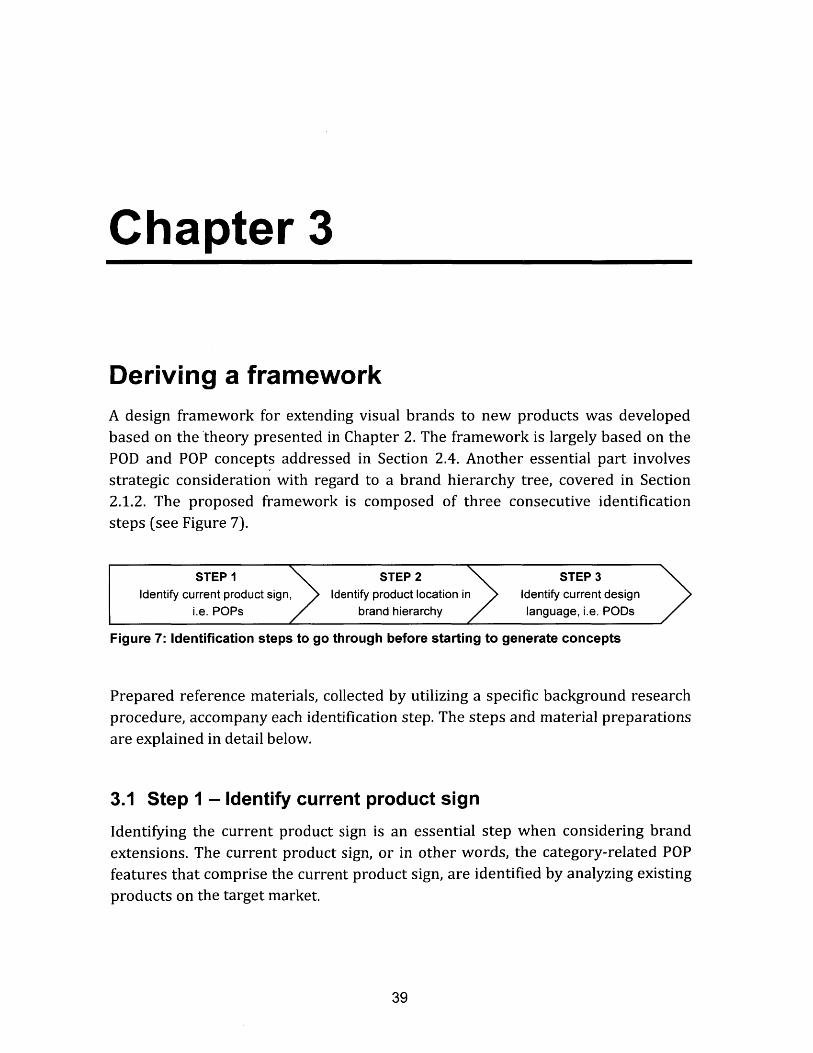
Deriving a frameworkA design framework for extending visual brands to new products was developedbased on the theory presented in Chapter 2. The framework is largely based on thePOD and POP concepts addressed in Section 2.4. Another essential part involvesstrategic consideration with regard to a brand hierarchy tree, covered in Section2.1.2. The proposed framework is composed of three consecutive identificationsteps (see Figure 7).
STEP 1 STEP 2 STEP 3Identify current product sign, Identify product location in Identify current design
i.e. POPs brand hierarchy language, i.e. PODs
Figure 7: Identification steps to go through before starting to generate concepts
Prepared reference materials, collected by utilizing a specific background researchprocedure, accompany each identification step. The steps and material preparationsare explained in detail below.
3.1 Step 1 - Identify current product sign
Identifying the current product sign is an essential step when considering brandextensions. The current product sign, or in other words, the category-related POPfeatures that comprise the current product sign, are identified by analyzing existingproducts on the target market.
39
Products in different market segments may have different features and functions.Therefore, it is important to select reference products from the correct marketsegment. By utilizing search filters on retailer websites, product configurations andprice ranges can be selected. To allow for a holistic overview and consistent analysisof the products, it is recommended to arrange a setseparate page or "art board".
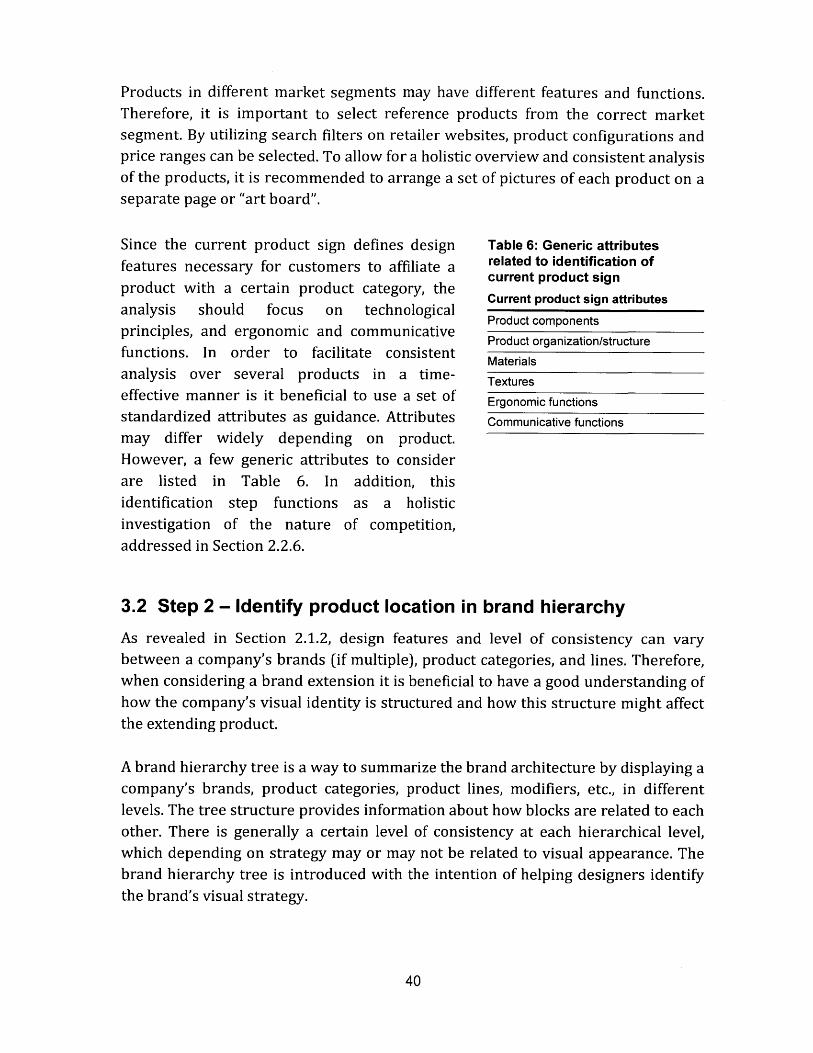
Since the current product sign defines designfeatures necessary for customers to affiliate aproduct with a certain product category, theanalysis should focus on technologicalprinciples, and ergonomic and communicativefunctions. In order to facilitate consistentanalysis over several products in a time-effective manner is it beneficial to use a set ofstandardized attributes as guidance. Attributesmay differ widely depending on product.However, a few generic attributes to considerare listed in Table 6. In addition, thisidentification step functions as a holisticinvestigation of the nature of competition,addressed in Section 2.2.6.
of pictures of each product on a
Table 6: Generic attributesrelated to identification ofcurrent product signCurrent product sign attributesProduct components
Product organization/structure
Materials
Textures
Ergonomic functions
Communicative functions
3.2 Step 2 - Identify product location in brand hierarchy
As revealed in Section 2.1.2, design features and level of consistency can varybetween a company's brands (if multiple), product categories, and lines. Therefore,when considering a brand extension it is beneficial to have a good understanding ofhow the company's visual identity is structured and how this structure might affectthe extending product.
A brand hierarchy tree is a way to summarize the brand architecture by displaying acompany's brands, product categories, product lines, modifiers, etc., in differentlevels. The tree structure provides information about how blocks are related to eachother. There is generally a certain level of consistency at each hierarchical level,which depending on strategy may or may not be related to visual appearance. Thebrand hierarchy tree is introduced with the intention of helping designers identifythe brand's visual strategy.
40
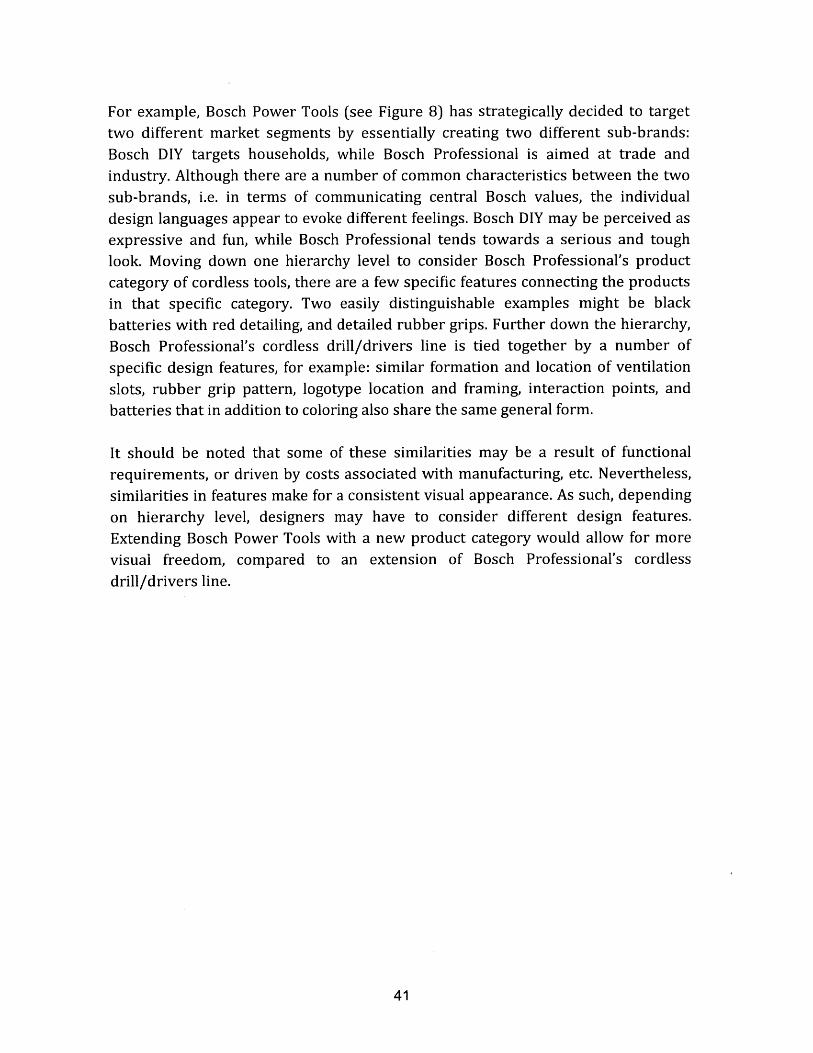
For example, Bosch Power Tools (see Figure 8) has strategically decided to targettwo different market segments by essentially creating two different sub-brands:Bosch DIY targets households, while Bosch Professional is aimed at trade andindustry. Although there are a number of common characteristics between the twosub-brands, i.e. in terms of communicating central Bosch values, the individualdesign languages appear to evoke different feelings. Bosch DIY may be perceived asexpressive and fun, while Bosch Professional tends towards a serious and toughlook. Moving down one hierarchy level to consider Bosch Professional's productcategory of cordless tools, there are a few specific features connecting the productsin that specific category. Two easily distinguishable examples might be blackbatteries with red detailing, and detailed rubber grips. Further down the hierarchy,
Bosch Professional's cordless drill/drivers line is tied together by a number of
specific design features, for example: similar formation and location of ventilation
slots, rubber grip pattern, logotype location and framing, interaction points, andbatteries that in addition to coloring also share the same general form.
It should be noted that some of these similarities may be a result of functional
requirements, or driven by costs associated with manufacturing, etc. Nevertheless,
similarities in features make for a consistent visual appearance. As such, depending
on hierarchy level, designers may have to consider different design features.
Extending Bosch Power Tools with a new product category would allow for more
visual freedom, compared to an extension of Bosch Professional's cordless
drill/drivers line.
41
Mt -df11
Bch r w~r*o'I
Bosch DIY
Tas oo W
RotaryHammers
CSR'Mx2briver
DrilVDrivers
.I -Lii
OSi~ 108
I2-1-1
M~QSU~~QTe&
Jigsaws
IG$~4,4
I
Bosch Professional
"Tr~s
rW
Planers
GR18,
IV-1-1
R~t~r~saws
Mutli-Cutters
IAngel
Grinders
I05R36
VE-2-LI
Figure 8: Brand and product map (modifiedTools
brand hierarchy tree) for Bosch Power
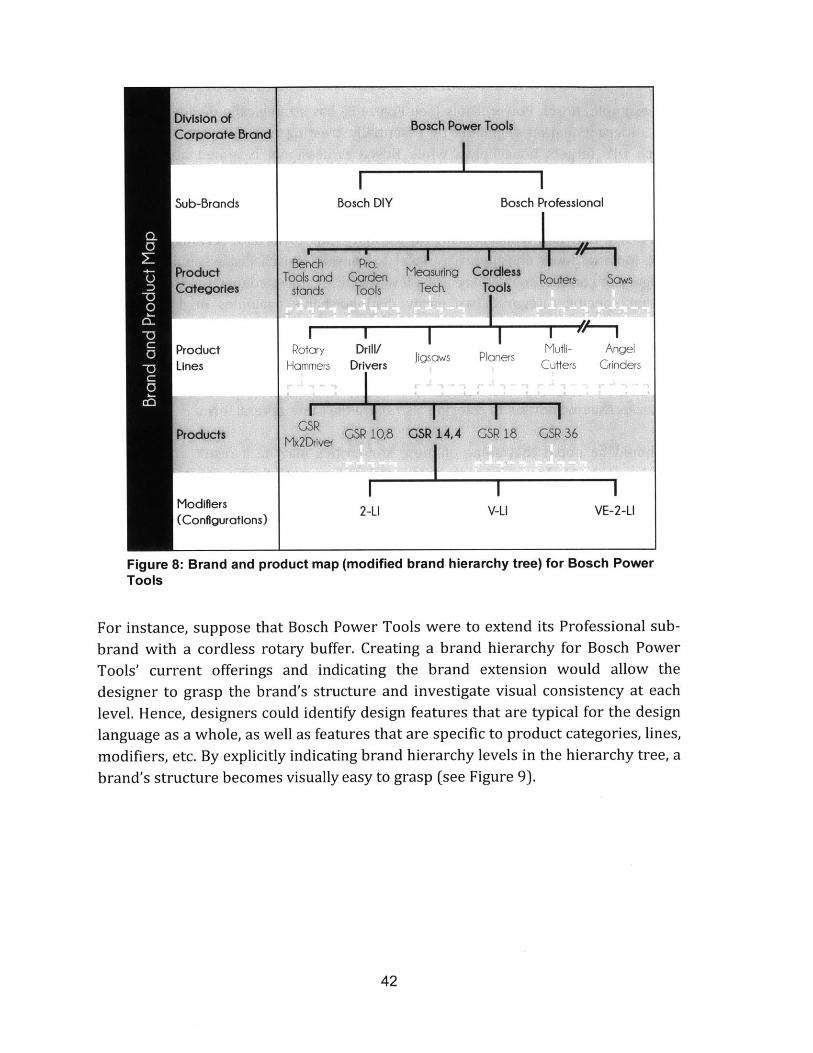
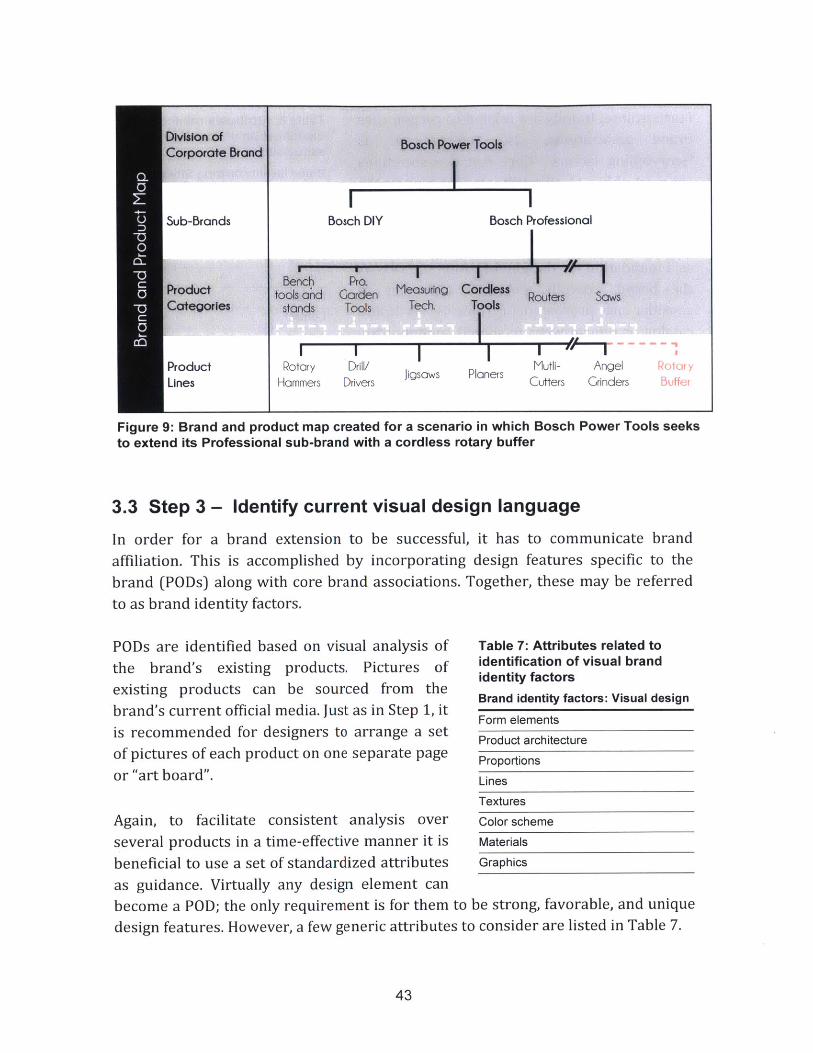
For instance, suppose that Bosch Power Tools were to extend its Professional sub-
brand with a cordless rotary buffer. Creating a brand hierarchy for Bosch Power
Tools' current offerings and indicating the brand extension would allow the
designer to grasp the brand's structure and investigate visual consistency at each
level. Hence, designers could identify design features that are typical for the design
language as a whole, as well as features that are specific to product categories, lines,
modifiers, etc. By explicitly indicating brand hierarchy levels in the hierarchy tree, a
brand's structure becomes visually easy to grasp (see Figure 9).
42
- IFA E
I
Bosch Power Tools
IBosch Professional
IMeasuring
Tech.
Jigsaws
ICordlem
Tools
IPlaners
Figure 9: Brand and product map createdto extend its Professional sub-brand with
for a scenario in which Bosch Power Tools seeksa cordless rotary buffer
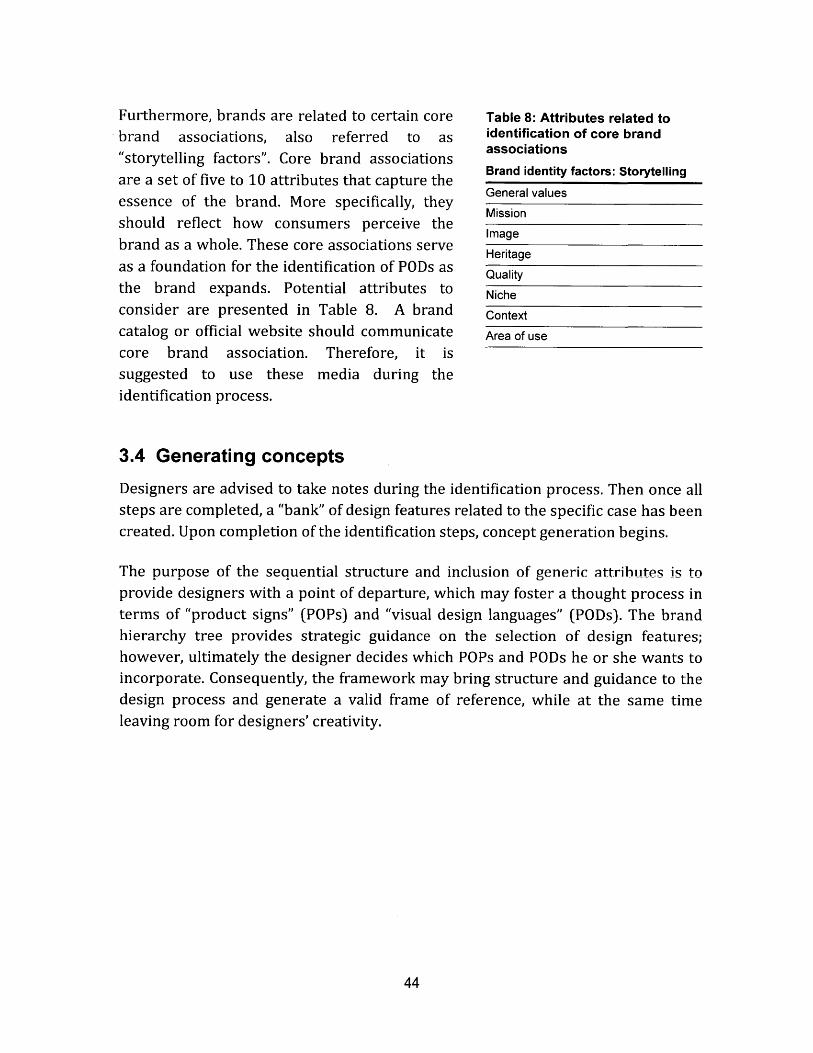
3.3 Step 3 - Identify current visual design language
In order for a brand extension to be successful, it has to communicate brandaffiliation. This is accomplished by incorporating design features specific to the
brand (PODs) along with core brand associations. Together, these may be referred
to as brand identity factors.
PODs are identified based on visual analysis of
the brand's existing products. Pictures ofexisting products can be sourced from thebrand's current official media. Just as in Step 1, itis recommended for designers to arrange a setof pictures of each product on one separate page
or "art board".
Table 7: Attributes related toidentification of visual brandidentity factors
Brand identity factors: Visual design
Form elements
Product architecture
Proportions
Lines
Textures
Again, to facilitate consistent analysis over Color scheme
several products in a time-effective manner it is Materialsbeneficial to use a set of standardized attributes Graphics
as guidance. Virtually any design element can
become a POD; the only requirement is for them to be strong, favorable, and unique
design features. However, a few generic attributes to consider are listed in Table 7.
43
I YBosch DlY
I *1
Benchtools and
stands
RotaryHammers
Pro.GardenTools
Dril/Drivers
SawsRouters
Mutli-Cutters
AngelGrinders
RotirhyBuffer
- IrA
Furthermore, brands are related to certain corebrand associations, also referred to as"storytelling factors". Core brand associationsare a set of five to 10 attributes that capture theessence of the brand. More specifically, theyshould reflect how consumers perceive thebrand as a whole. These core associations serveas a foundation for the identification of PODs asthe brand expands. Potential attributes toconsider are presented in Table 8. A brandcatalog or official website should communicatecore brand association. Therefore, it issuggested to use these media during theidentification process.
Table 8: Attributes related toidentification of core brandassociations
Brand identity factors: Storytelling
General values
Mission
Image
Heritage
Quality
Niche
Context
Area of use
3.4 Generating concepts
Designers are advised to take notes during the identification process. Then once allsteps are completed, a "bank" of design features related to the specific case has beencreated. Upon completion of the identification steps, concept generation begins.
The purpose of the sequential structure and inclusion of generic attributes is toprovide designers with a point of departure, which may foster a thought process interms of "product signs" (POPs) and "visual design languages" (PODs). The brandhierarchy tree provides strategic guidance on the selection of design features;however, ultimately the designer decides which POPs and PODs he or she wants toincorporate. Consequently, the framework may bring structure and guidance to thedesign process and generate a valid frame of reference, while at the same timeleaving room for designers' creativity.
44
Chapter 4
Experimental evaluation
In order to evaluate the framework and gain further insight into how designersapproach a brand extension task, an experiment and observational study weredesigned and conducted with the participation of industrial designers.
To present the industrial designers with a well-defined task and allow forconsequential evaluation, three general assumptions were made.
" Case brands are satisfied with current visual design language." Strategists at the companies have identified a target market segment and
decided that the proposed brand extension is lucrative." Existing products in the market segment of interest reflect the principal
functional requirements.
4.1 Experimental design
To evaluate the proposed design framework, an experimental study was devised.The experiment consisted of two brand extension cases. The framework was appliedon one case, while the other functioned as a "control" case.
45
4.1.1 Experimental outline
Participating designers were asked to create design drafts for two different brands.Each product was considered a brand extension. The objective was to designproducts that would fit with the brand's existing design language. The participantswere asked to create their design draft by sketching products on paper andproviding descriptive notes as they saw fit. In addition, participants were asked toidentify visual brand elements and storytelling factors that they perceived as centralto the brand.
Furthermore, the experiment consisted of two scenarios, through which allparticipating designers cycled:Scenario (I): Designers imagined, i.e. used intuition or their own method; andScenario (II): Designers were asked to follow the proposed framework.
Since all participants cycled through both scenarios, two brand extension caseswere created. Case (A) sought to extend the brand B&O PLAY with a compact digitalcamera. Case (B) sought to extend the brand Dyson with a robotic vacuum cleaner.To minimize secondary effects on the experiment, scenarios and cases werealternated among the participants. One half of the total number of participants wasassigned case (A) in scenario (I), and consequently case (B) in scenario (II), whilethe other half was assigned case (B) in scenario (I), and case (A) in scenario (II).
Scenarin (fl) srved twn nurposes. First, it functinned as a benchmark scenario,
allowing for the evaluation of design drafts created during Scenario (II). Second, itserved as an exploration of how industrial designers today would approach a brandextension task.
4.1.2 Case selection
Since all participants were asked to cycle through both scenarios, it was importantto select cases with similar characteristics and complexity. Each case had two maincomponents: a brand and a product. To add a feeling of reality to the task, thecombination of brand and product was selected in such a way that it could beperceived as a probable case.
46
Brand selection
Selection of brands was based on three parameters: nature of design language,brand awareness among industrial designers, and complexity of branding strategy.Brands with distinctly different design languages were selected in order to ensurethat the two were not confused and that they did not in some way affect each other'svisually significant characteristics. However, brands with equally defined designlanguages and similar levels of brand awareness within the industrial designcommunity were targeted.
Furthermore, brands with equally complex branding strategies were selected.Complexity was determined based on brands' internal structure of design language.As stated in Chapter 2, there are many different ways to structure a brand. Somebrands choose a consistent design language throughout their whole productportfolio, while some differentiate design language between product categories andlines, and others choose to introduce a sub-brand with a slightly different designlanguage. For this experiment, brands with two different design languages weretargeted.
Product selection
Selection of products was based on two parameters: general product type andproduct maturity. To narrow down the scope, technical products were selected asthe general product segment. In terms of industrial design, technical productsgenerally allow for a certain level of freedom; there are often some types of casingdesign or interaction points to consider. Mature products generally have a well-defined product sign, which implies that companies apply the same technical
concept. To ensure that POPs were equally difficult to determine, products with asimilar level of product maturity were targeted.
4.2 Case descriptions
Based on the considerations addressed in Section 4.1.2, two cases were identified
(see Table 9). A brief motivation for these selections is provided below, after which
the two cases are investigated in more detail.
Table 9: Selected cases
Case Brand Product for brand extension
A B&O PLAY Compact digital camera
B Dyson Robotic vacuum cleaner
47
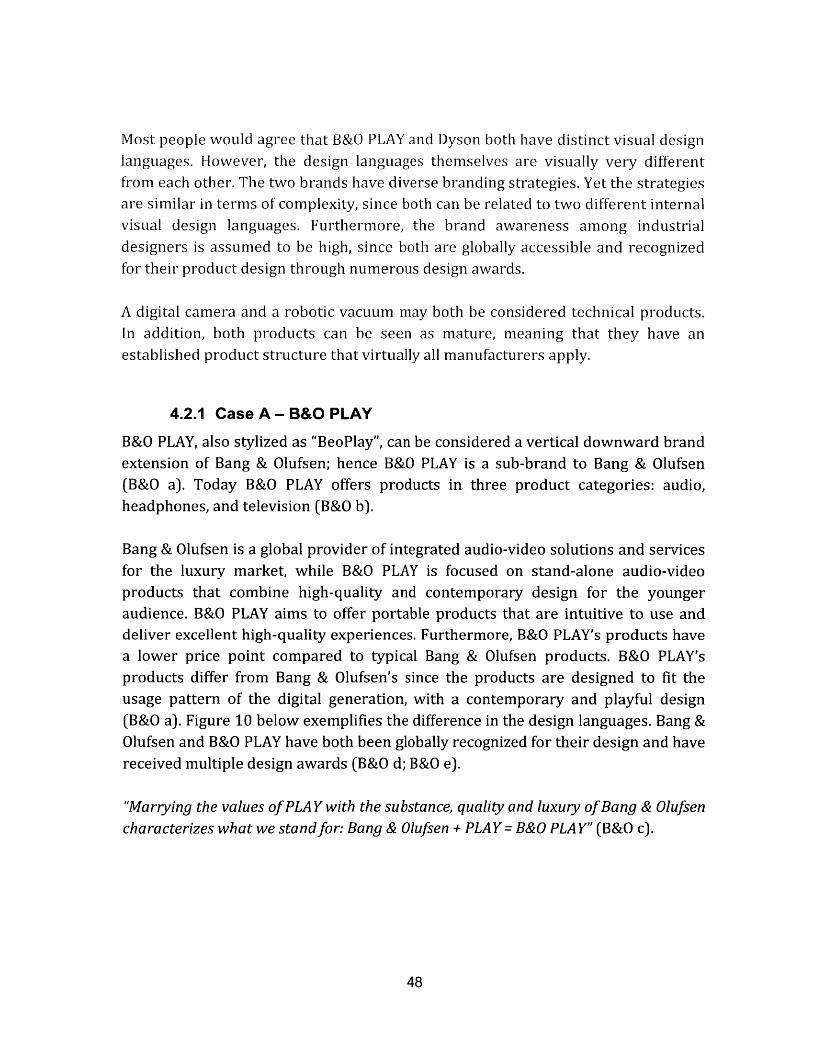
Most people would agree that B&O PLAY and Dyson both have distinct visual designlanguages. However, the design languages themselves are visually very differentfrom each other. The two brands have diverse branding strategies. Yet the strategiesare similar in terms of complexity, since both can be related to two different internalvisual design languages. Furthermore, the brand awareness among industrialdesigners is assumed to be high, since both are globally accessible and recognizedfor their product design through numerous design awards.
A digital camera and a robotic vacuum may both be considered technical products.In addition, both products can be seen as mature, meaning that they have anestablished product structure that virtually all manufacturers apply.
4.2.1 Case A - B&O PLAY
B&O PLAY, also stylized as "BeoPlay", can be considered a vertical downward brandextension of Bang & Olufsen; hence B&O PLAY is a sub-brand to Bang & Olufsen(B&O a). Today B&O PLAY offers products in three product categories: audio,headphones, and television (B&O b).
Bang & Olufsen is a global provider of integrated audio-video solutions and servicesfor the luxury market, while B&O PLAY is focused on stand-alone audio-videoproducts that combine high-quality and contemporary design for the youngeraudience. B&O PLAY aims to offer portable products that are intuitive to use anddeliver excellent high-quality experiences. Furthermore, B&O PLAY's products havea lower price point compared to typical Bang & Olufsen products. B&O PLAY'sproducts differ from Bang & Olufsen's since the products are designed to fit theusage pattern of the digital generation, with a contemporary and playful design(B&O a). Figure 10 below exemplifies the difference in the design languages. Bang &Olufsen and B&O PLAY have both been globally recognized for their design and havereceived multiple design awards (B&O d; B&O e).
"Marrying the values of PLAY with the substance, quality and luxury of Bang & Olufsencharacterizes what we stand for: Bang & Olufsen + PLAY = B&O PLAY" (B&O c).
48
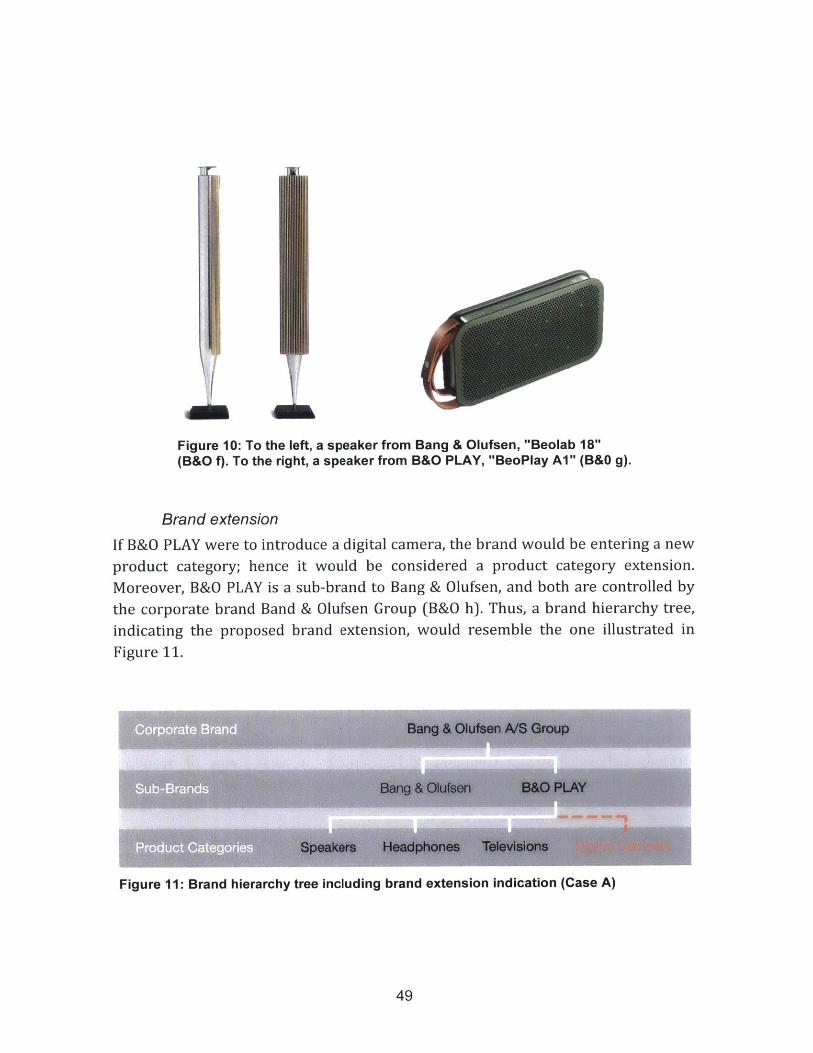
Figure 10: To the left, a speaker from Bang & Olufsen, "Beolab 18"(B&O f). To the right, a speaker from B&O PLAY, "BeoPlay Al" (B&0 g).
Brand extension
If B&O PLAY were to introduce a digital camera, the brand would be entering a new
product category; hence it would be considered a product category extension.
Moreover, B&O PLAY is a sub-brand to Bang & Olufsen, and both are controlled by
the corporate brand Band & Olufsen Group (B&O h). Thus, a brand hierarchy tree,
indicating the proposed brand extension, would resemble the one illustrated in
Figure 11.
Figure 11: Brand hierarchy tree including brand extension indication (Case A)
49
To further define the case, a target market segment was specified. In this case themarket segment was characterized by the following parameters: compact/point-and-shoot digital camera, standard configuration, and high-end segment ($250-400). Moreover, market research indicates that a compact digital camera can beconsidered a mature product, since nearly all companies apply a similar productstructure (B&H Photo).
4.2.2 Case B - Dyson
Dyson is a global manufacturer and supplier of home appliances. The company isperformance focused and is constantly striving to make things better by technologyresearch and innovative design. Its products are often a combination of inventiveengineering, passion for technology, and brave design (Dyson a).
Today Dyson offers vacuums, fans, and heaters aimed at the consumer market.'Dyson has chosen to categorize these products into two product categories:"Vacuums" and "Fans and Heaters" (Dyson b). Figure 12 below exemplifies thedifference in design language between the two product categories. Dyson has beenglobally recognized for its design and has received multiple design awards (Red Dot;Dyson d).
"We start with a problem. Something thatfrustrates or nags because it doesn't workproperly. It could be any everyday object. Then we fiqure out how to make it workbetter." (Dyson c)
It is reasonable to believe that Dyson's visual appearance is to some extent a resultof a technical concept. However, it is obvious that the company employs visualconsistency and conveys a design language in terms of form elements, coloring,finishes, etc., throughout its respective product categories. Furthermore, it shouldbe mentioned that Sir James Dyson himself, at one point, stated in an interview thathe does not believe in brands. However, branding researchers and strategistsstrongly believe that the company in fact applies a wide range of brandingstrategies. Some consider the statement to be a result of Dyson's own interpretation
1 Dyson also offers hand dryers, designed for public spaces (business-to-business sales). Since the focus of thisstudy is on consumer products, they were not considered. It should furthermore be recognized that Dyson isabout to enter new product categories later this year, with products such as humidifiers and LED lamps. Theseproducts are however not released yet, and were thus not considered either (Dyson b). In addition, Dyson did infact release a robotic vacuum for the Japanese market only in July 2015, and a limited number in July 2014(Dyson e). These releases occurred after the development of the experiment in this study. However, none of theexperiment participants located Dyson's "360 Eye" vacuum while conducting the experiment. Participants werealso asked afterwards if they were aware of its existence, and none expressed that they were.
50
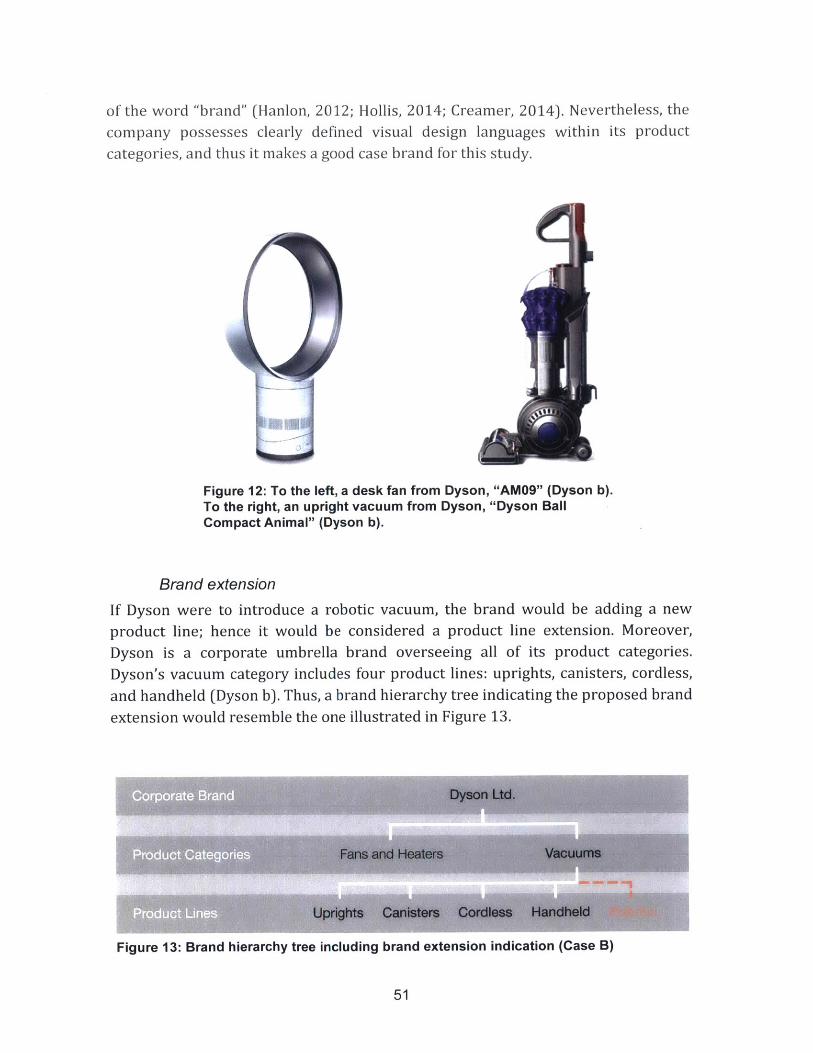
of the word "brand" (Hanlon, 2012; Hollis, 2014; Creamer, 2014). Nevertheless, the
company possesses clearly defined visual design languages within its product
categories, and thus it makes a good case brand for this study.
Figure 12: To the left, a desk fan from Dyson, "AMO9" (Dyson b).To the right, an upright vacuum from Dyson, "Dyson BallCompact Animal" (Dyson b).
Brand extension
If Dyson were to introduce a robotic vacuum, the brand would be adding a new
product line; hence it would be considered a product line extension. Moreover,
Dyson is a corporate umbrella brand overseeing all of its product categories.
Dyson's vacuum category includes four product lines: uprights, canisters, cordless,
and handheld (Dyson b). Thus, a brand hierarchy tree indicating the proposed brand
extension would resemble the one illustrated in Figure 13.
Figure 13: Brand hierarchy tree including brand extension indication (Case B)
51
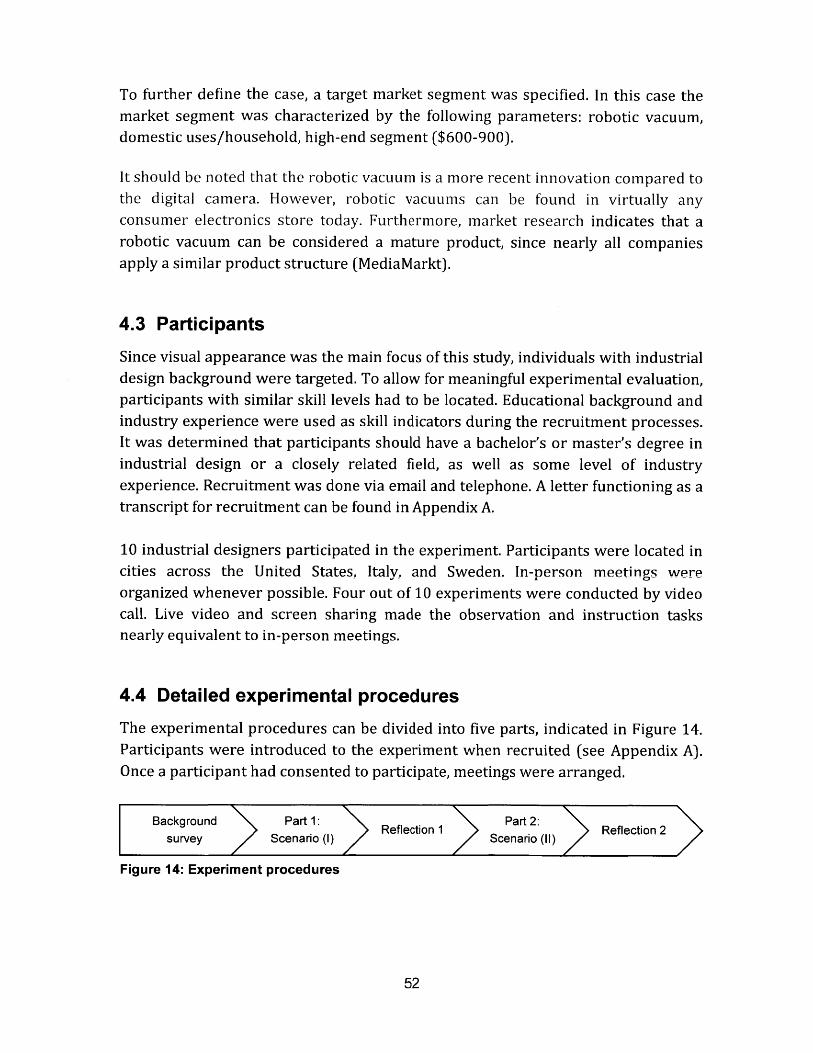
To further define the case, a target market segment was specified. In this case themarket segment was characterized by the following parameters: robotic vacuum,domestic uses/household, high-end segment ($600-900).
It should be noted that the robotic vacuum is a more recent innovation compared tothe digital camera. However, robotic vacuums can be found in virtually anyconsumer electronics store today. Furthermore, market research indicates that arobotic vacuum can be considered a mature product, since nearly all companiesapply a similar product structure (MediaMarkt).
4.3 Participants
Since visual appearance was the main focus of this study, individuals with industrialdesign background were targeted. To allow for meaningful experimental evaluation,participants with similar skill levels had to be located. Educational background andindustry experience were used as skill indicators during the recruitment processes.It was determined that participants should have a bachelor's or master's degree inindustrial design or a closely related field, as well as some level of industryexperience. Recruitment was done via email and telephone. A letter functioning as atranscript for recruitment can be found in Appendix A.
10 industrial designers participated in the experiment. Participants were located incities across the United States. Italy. and Sweden. In-person meetings wereorganized whenever possible. Four out of 10 experiments were conducted by videocall. Live video and screen sharing made the observation and instruction tasksnearly equivalent to in-person meetings.
4.4 Detailed experimental procedures
The experimental procedures can be divided into five parts, indicated in Figure 14.Participants were introduced to the experiment when recruited (see Appendix A).Once a participant had consented to participate, meetings were arranged.
Background Part 1: Reflection 1 Part 2: Reflection 2survey Scenario (1) Scenario (II)
Figure 14: Experiment procedures
52
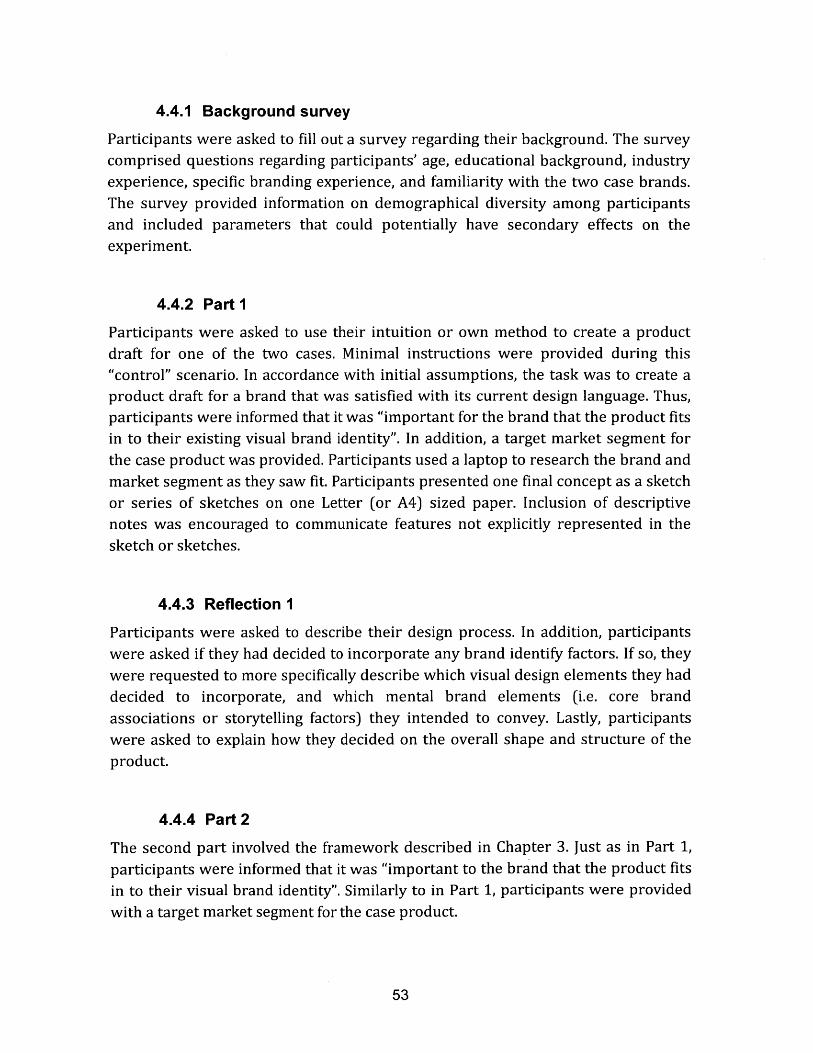
4.4.1 Background survey
Participants were asked to fill out a survey regarding their background. The surveycomprised questions regarding participants' age, educational background, industryexperience, specific branding experience, and familiarity with the two case brands.The survey provided information on demographical diversity among participantsand included parameters that could potentially have secondary effects on theexperiment.
4.4.2 Part 1
Participants were asked to use their intuition or own method to create a productdraft for one of the two cases. Minimal instructions were provided during this"control" scenario. In accordance with initial assumptions, the task was to create aproduct draft for a brand that was satisfied with its current design language. Thus,participants were informed that it was "important for the brand that the product fitsin to their existing visual brand identity". In addition, a target market segment forthe case product was provided. Participants used a laptop to research the brand andmarket segment as they saw fit. Participants presented one final concept as a sketchor series of sketches on one Letter (or A4) sized paper. Inclusion of descriptivenotes was encouraged to communicate features not explicitly represented in thesketch or sketches.
4.4.3 Reflection 1
Participants were asked to describe their design process. In addition, participantswere asked if they had decided to incorporate any brand identify factors. If so, theywere requested to more specifically describe which visual design elements they haddecided to incorporate, and which mental brand elements (i.e. core brandassociations or storytelling factors) they intended to convey. Lastly, participantswere asked to explain how they decided on the overall shape and structure of theproduct.
4.4.4 Part 2
The second part involved the framework described in Chapter 3. Just as in Part 1,participants were informed that it was "important to the brand that the product fitsin to their visual brand identity". Similarly to in Part 1, participants were provided
with a target market segment for the case product.
53
As explained in Chapter 3, the proposed framework is based on three identificationsteps. In Step 1, "Identify current product sign", participants were provided with adocument prepared according to Section 3.1, including pictures of existing productsin the target market segment. Participants were asked to view the document andidentify design features that they found representative for a product in thissegment. Furthermore, participants were offered a list of potential attributes toguide the identification process.
The framework's second step is to "Identify product location in brand hierarchy". Ina real event, managers or brand strategists may complete or at the very least play acrucial role during a task of this nature. The framework suggests, however, thatdesigners should be aware of the brand's structure and the location of the productthey intend to design. Therefore, designers were provided with a prepared brandhierarchy tree, indicating the location of the brand extension. The prepared brandhierarchy trees are presented in Section 4.2. As designers moved on to Step 3,"Identify current design language", they were requested to think about how thebrand hierarchy location of the product might affect the product design language.
In Step 3, participants were provided with a document, prepared according toSection 3.3, including pictures of the brand's existing products. Participants wereasked to view the document and identify visual brand identity factors theyperceived as specific to the brand. Case A was considered a category extension,while Case B was viewed as a line extension. Participants were specifically asked tofocus on factors they found common between all product categories/lines, ratherthan using one product as their single source of inspiration. In addition, participantswere asked to identify storytelling factors related to the brand by reviewing a brandcatalog. Participants were given a list of potential visual brand identity andstorytelling attributes to consider.
Just as in Part 1, participants presented one final concept as a sketch or series ofsketches, on one Letter (or A4) sized paper. Inclusion of descriptive notes wasencouraged to communicate features not explicitly represented in the sketch orsketches.
4.4.5 Reflection 2
Participants were requested to describe which visual design elements they haddecided to incorporate, and which mental brand elements (i.e. core brandassociations or storytelling factors) they intended to convey. In addition,
54
participants were asked to share their thoughts regarding the structure of theframework and the brand hierarchy tree.
4.5 Experimental duration
In order to decide on a reasonable experimental duration, two test trials wereconducted. The trials indicated that the amount of time participants spent onreading the instructions and viewing the materials provided in Part 2 wascomparable to the time participants spent on scouring and reviewing referencematerials in Part 1. Therefore, the same amount of time was allocated to both parts.The test trials showed that 30 minutes per part resulted in reasonable conceptquality, without making the designers feel uncomfortably rushed. The totalexperiment time, including the background survey and reflections, was set to 90minutes.
55

This page intentionally left blank
56
Chapter 5
Evaluation methodologyVisual evaluation may be regarded as a challenging matter. The task is highlysubjective; people have different opinions, which are to a large extent grounded intheir personal experiences with the brand and the product. For that reason, twoinitial, explorative evaluation approaches were conducted. The initial evaluationsincluded an online expert panel survey (Expert Evaluation 1), and a visual designanalysis performed by the author. Based on results and feedback obtained from theinitial approaches, a third and final evaluation method was developed (ExpertEvaluation 2). The initial evaluation methods are presented in this chapter;however, emphasis has been put on Expert Evaluation 2, which generally produceddata with higher inter-rater reliability, and indicated proper level of dedicationamong the expert evaluators.
5.1 Preparation of drafts
Sketch quality can potentially affect how a person responds to a product concept(Macomber & Yang, 2011). Therefore, all design drafts were translated to the sameformat. Drafts were scanned into a computer, and form elements and lines definedby the participants were traced in vector graphics software. Elements were coloredwith a gray scale. Participants used pens or gray markers to create sketches butwere requested to specify details, including colors and material, by including notesand arrows. These notes were also traced in the vectors-based software. Line widthwas consistently set to 1.Opt, with the exception of small details, for which 0.5pt linewidth was used. Gradients were only applied for the center section of the cameralens, except in one other instance, in a product draft where this seemed essential in
57
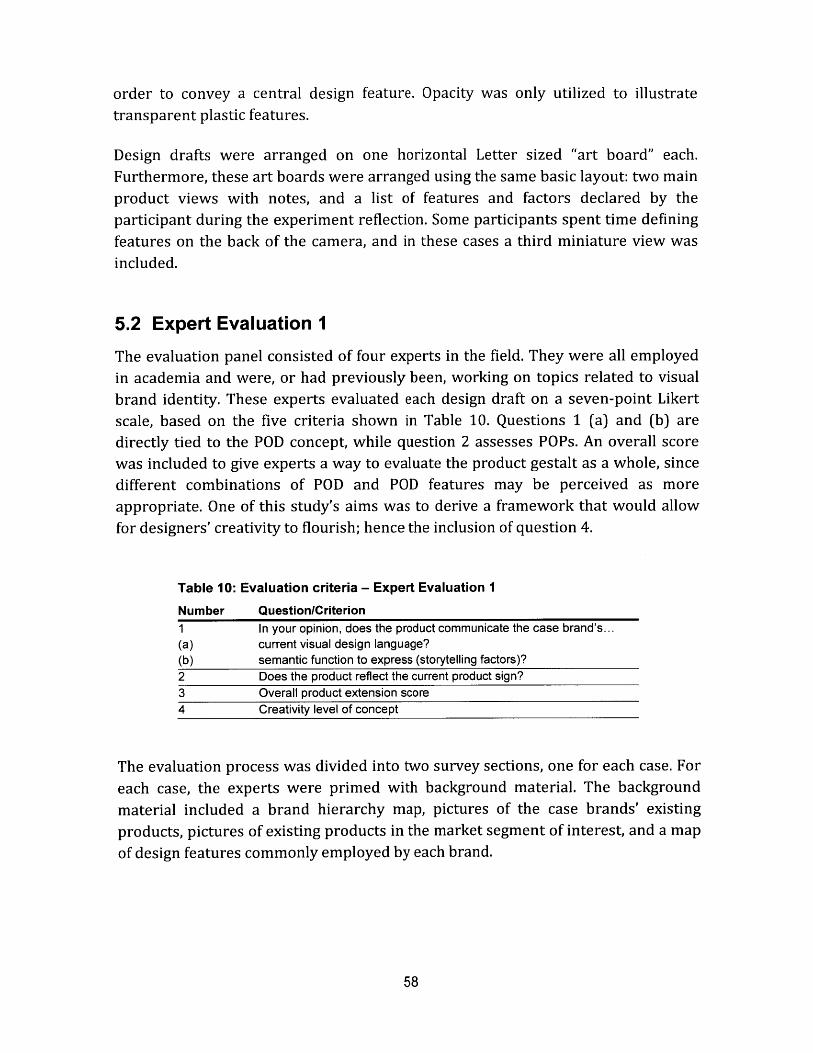
order to convey a central design feature. Opacity was only utilized to illustratetransparent plastic features.
Design drafts were arranged on one horizontal Letter sized "art board" each.Furthermore, these art boards were arranged using the same basic layout: two mainproduct views with notes, and a list of features and factors declared by theparticipant during the experiment reflection. Some participants spent time defining
features on the back of the camera, and in these cases a third miniature view was
included.
5.2 Expert Evaluation 1
The evaluation panel consisted of four experts in the field. They were all employed
in academia and were, or had previously been, working on topics related to visual
brand identity. These experts evaluated each design draft on a seven-point Likert
scale, based on the five criteria shown in Table 10. Questions 1 (a) and (b) aredirectly tied to the POD concept, while question 2 assesses POPs. An overall score
was included to give experts a way to evaluate the product gestalt as a whole, sincedifferent combinations of POD and POD features may be perceived as more
appropriate. One of this study's aims was to derive a framework that would allow
for designers' creativity to flourish; hence the inclusion of question 4.
Table 10: Evaluation criteria - Expert Evaluation 1
Number Question/Criterion1 In your opinion, does the product communicate the case brand's...(a) current visual design language?(b) semantic function to express (storytelling factors)?2 Does the product reflect the current product sign?3 Overall product extension score4 Creativity level of concept
The evaluation process was divided into two survey sections, one for each case. For
each case, the experts were primed with background material. The background
material included a brand hierarchy map, pictures of the case brands' existing
products, pictures of existing products in the market segment of interest, and a map
of design features commonly employed by each brand.
58
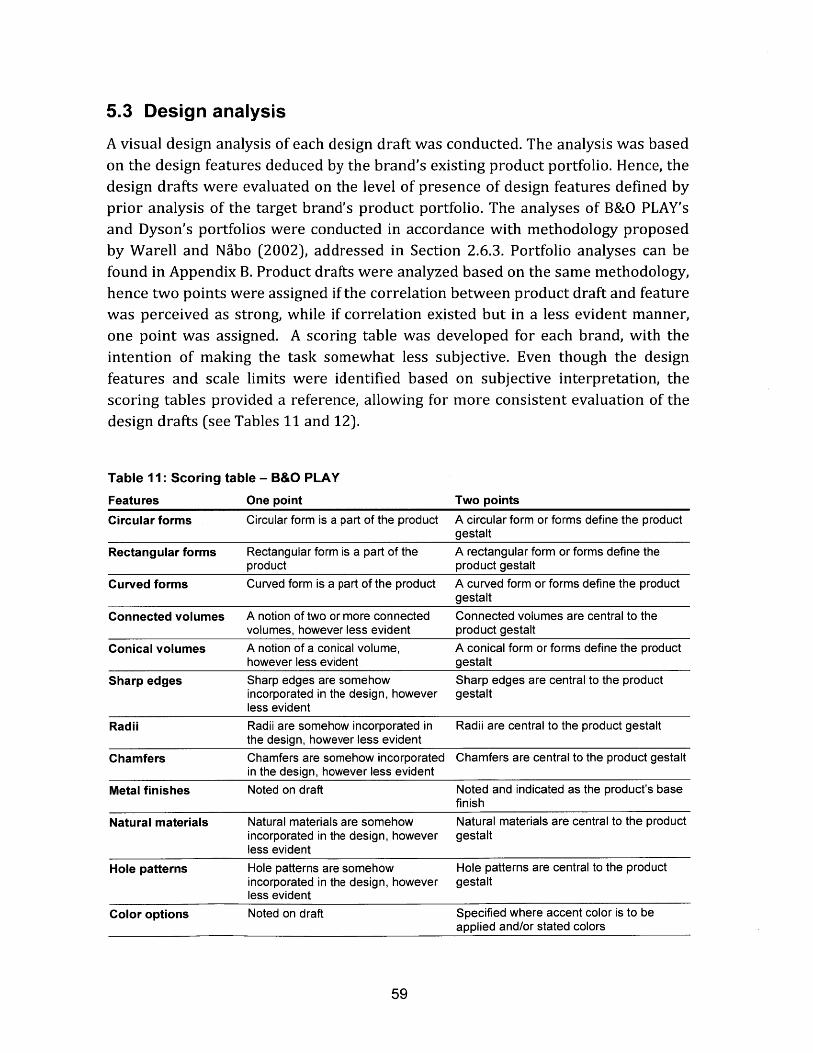
5.3 Design analysis
A visual design analysis of each design draft was conducted. The analysis was basedon the design features deduced by the brand's existing product portfolio. Hence, thedesign drafts were evaluated on the level of presence of design features defined byprior analysis of the target brand's product portfolio. The analyses of B&O PLAY'sand Dyson's portfolios were conducted in accordance with methodology proposedby Warell and Nabo (2002), addressed in Section 2.6.3. Portfolio analyses can befound in Appendix B. Product drafts were analyzed based on the same methodology,hence two points were assigned if the correlation between product draft and featurewas perceived as strong, while if correlation existed but in a less evident manner,one point was assigned. A scoring table was developed for each brand, with theintention of making the task somewhat less subjective. Even though the designfeatures and scale limits were identified based on subjective interpretation, thescoring tables provided a reference, allowing for more consistent evaluation of thedesign drafts (see Tables 11 and 12).
Table 11: Scoring table - B&O PLAY
Features One point Two points
Circular forms Circular form is a part of the product A circular form or forms define the productgestalt
Rectangular forms Rectangular form is a part of the A rectangular form or forms define theproduct product gestalt
Curved forms Curved form is a part of the product A curved form or forms define the productgestalt
Connected volumes A notion of two or more connected Connected volumes are central to thevolumes, however less evident product gestalt
Conical volumes A notion of a conical volume, A conical form or forms define the producthowever less evident gestalt
Sharp edges Sharp edges are somehow Sharp edges are central to the productincorporated in the design, however gestaltless evident
Radii Radii are somehow incorporated in Radii are central to the product gestaltthe design, however less evident
Chamfers Chamfers are somehow incorporated Chamfers are central to the product gestaltin the design, however less evident
Metal finishes Noted on draft Noted and indicated as the product's basefinish
Natural materials Natural materials are somehow Natural materials are central to the productincorporated in the design, however gestaltless evident
Hole patterns Hole patterns are somehow Hole patterns are central to the productincorporated in the design, however gestaltless evident
Color options Noted on draft Specified where accent color is to beapplied and/or stated colors
59
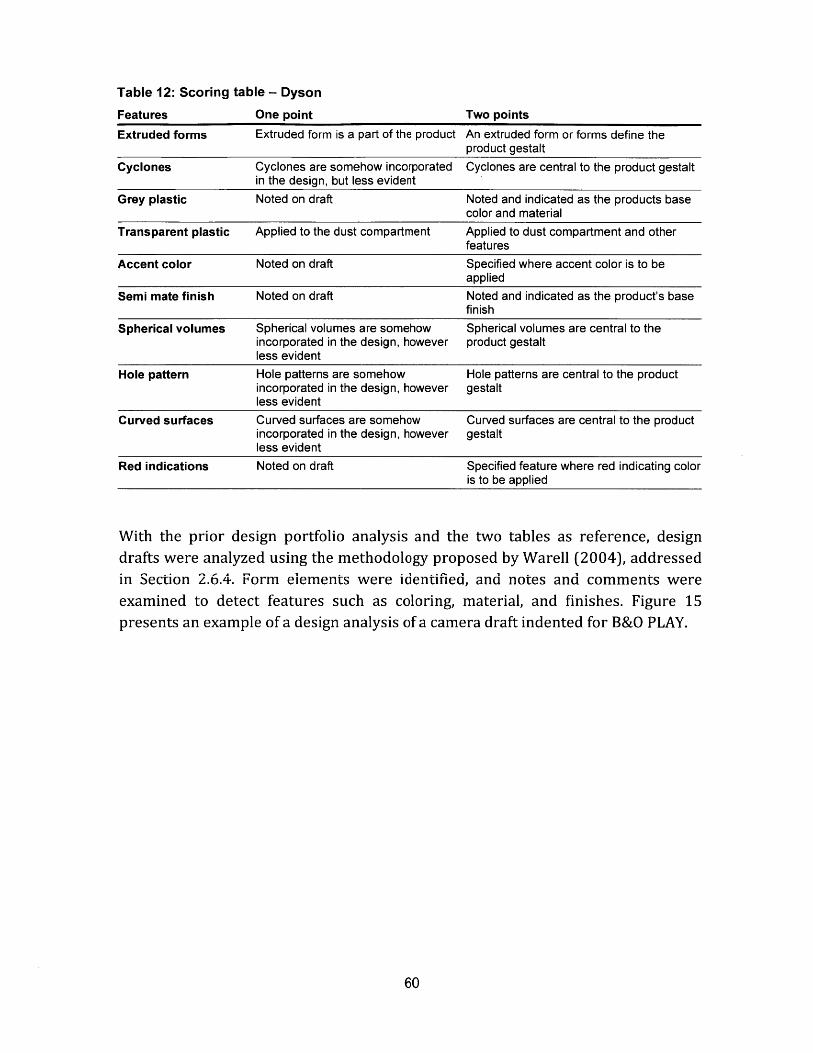
Table 12: Scoring table - Dyson
Features One pointExtruded forms Extruded form is a part of the product
Cyclones Cyclones are somehow incorporatedin the design, but less evident
Grey plastic Noted on draft
Transparent plastic Applied to the dust compartment
Accent color Noted on draft
Semi mate finish Noted on draft
Spherical volumes Spherical volumes are somehowincorporated in the design, howeverless evident
Hole pattern Hole patterns are somehowincorporated in the design, howeverless evident
Curved surfaces Curved surfaces are somehowincorporated in the design, howeverless evident
Red indications Noted on draft
With the prior design portfolio analysis and the two tables as reference, designdrafts were analyzed using the methodology proposed by Warell (2004), addressedin Section 2.6.4. Form elements were identified, and notes and comments wereexamined to detect features such as coloring, material, and finishes. Figure 15presents an example of a design analysis of a camera draft indented for B&O PLAY.
60
Two points
An extruded form or forms define theproduct gestalt
Cyclones are central to the product gestalt
Noted and indicated as the products basecolor and material
Applied to dust compartment and otherfeatures
Specified where accent color is to beapplied
Noted and indicated as the product's basefinish
Spherical volumes are central to theproduct gestalt
Hole patterns are central to the productgestalt
Curved surfaces are central to the productgestalt
Specified feature where red indicating coloris to be applied
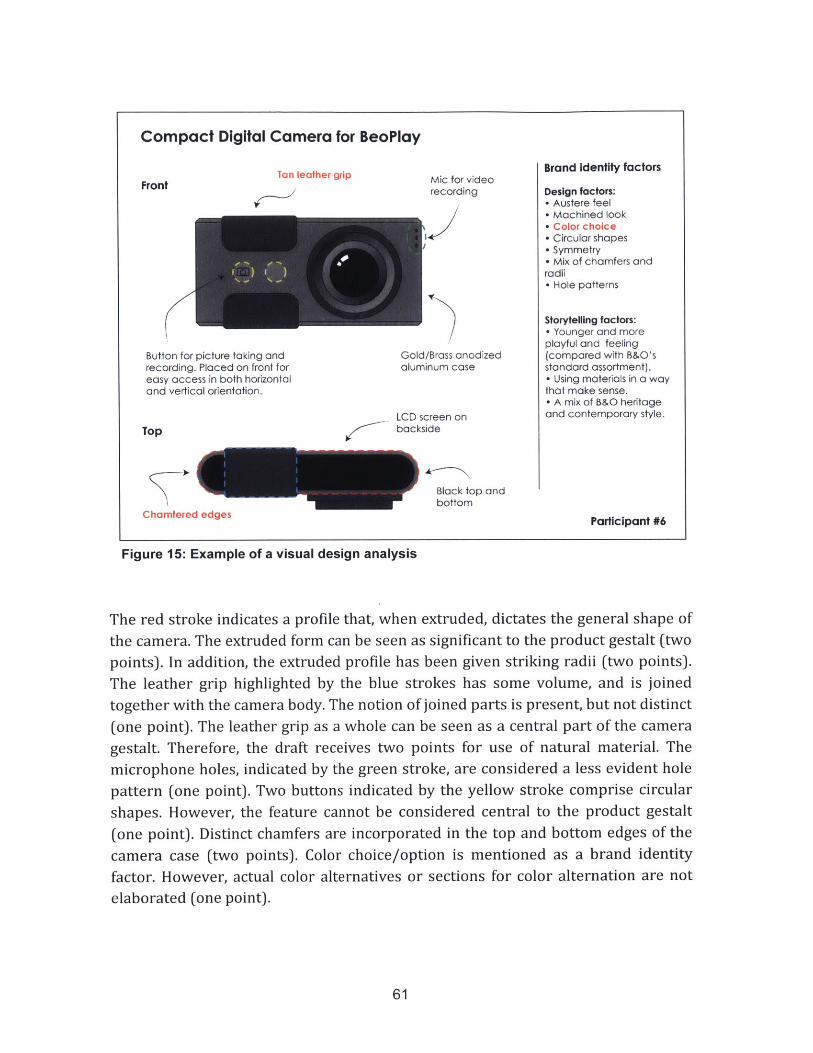
Compact Digital Camera for BeoPlay
Tan leather gripFront
Button for picture taking andrecording. Placed on front foreasy access in both horizontaland vertical orientation.
Mic for videorecording
Gold/Brass anodizedaluminum case
LCD screen onbackside
Black top andbottom
Chamfered edges
Brand Identity factors
Design factors:" Austere feel" Machined look* Color choice* Circular shapes* Symmetry* Mix of chamfers andradii- Hole patterns
Storytelling factors:* Younger and moreplayful and feeling(compared with B&O'sstandard assortment).- Using materials in a waythat make sense.* A mix of B&O heritageand contemporary style.
Participant #6
Figure 15: Example of a visual design analysis
The red stroke indicates a profile that, when extruded, dictates the general shape of
the camera. The extruded form can be seen as significant to the product gestalt (two
points). In addition, the extruded profile has been given striking radii (two points).
The leather grip highlighted by the blue strokes has some volume, and is joined
together with the camera body. The notion of joined parts is present, but not distinct
(one point). The leather grip as a whole can be seen as a central part of the camera
gestalt. Therefore, the draft receives two points for use of natural material. The
microphone holes, indicated by the green stroke, are considered a less evident hole
pattern (one point). Two buttons indicated by the yellow stroke comprise circular
shapes. However, the feature cannot be considered central to the product gestalt
(one point). Distinct chamfers are incorporated in the top and bottom edges of the
camera case (two points). Color choice/option is mentioned as a brand identity
factor. However, actual color alternatives or sections for color alternation are not
elaborated (one point).
61
Top
By repeating the process described above on all design drafts, a scoreboard wasgenerated. The difference in score between the control and framework scenarioswas then be compared by using bootstrapping analysis.
5.4 Expert Evaluation 2
In this section, the motivation behind Expert Evaluation 2 is presented, and newmethodology and procedures are described. For motivation purposes, results fromExpert Evaluation 1 are partly displayed in this section. The results are howeverfurther addressed in Chapter 6.
5.4.1 Motivation
Based on results from Expert Evaluation 1, feedback from participating experts, andthe visual analysis, a new evaluation was developed and conducted. The aim withthe new evaluation was to obtain data with improved inter-rater reliability, and toensure that evaluators were fully dedicated to the task.
The first expert evaluation exhibited no significant difference in average rating,while the visual design analysis indicated a significant difference in terms of numberof incorporated design features. Furthermore, the data obtained from the fourexperts participating in Expert Evaluation 1 had low inter-rater reliability, rangingfrom an alpha of 0.21 to 0.46. Since only four experts nrticintPd, the low intpr-ratp
reliability raised concerns. Another problematic observation was the difference insurvey completion time. Experts' survey completion time ranged from 4-13 minutesper case. One expert in particular, who spent 4 and 6 minutes evaluating each caserespectively, rated drafts consistently in the mid-range. Moreover, two out of fourexperts provided spontaneous feedback upon completion of the first evaluation,indicating a few concerns. Two citations from these experts are provided blow.
"It was difficulty to get a good overview of the material whilefilling out the survey."
"In this survey format, I think questions need to be more specific. I found it hard toevaluate all concepts with precision."
Furthermore, while the visual design analysis indicated significance, it should benoted that a higher number of incorporated design features in a product might notnecessarily mean that the product expresses the brand's visual design language in amore advantageous way. Some features might be more predominant, and if a featurewith such characteristics is incorporated in a bold manner, the product might be
62
perceived as expressive of the brand's design language. However, it is thecombination of the visual design analysis showing a significant difference, with thesubstantial differences in evaluator engagement, low inter-rater reliability, andfeedback from the expert participants that constitutes the motivation behind ExpertEvaluation 2.
5.4.2 Development of new evaluation methodology
The experts in the first evaluation received background material for each case.However, since the evaluation was performed online, experts felt it was hard toobtain a good overview of the material as they scored the product drafts. Thus, oneof the goals with Expert Evaluation 2 was to provide participants with clearinstructions and an obvious, fixed, visual reference. A clear reference wasintroduced to ensure that experts evaluated the drafts based on the brand's currentproducts, reflecting the brand's current visual design language, and not based ontheir own experience with the brand and product type. As such, evaluators shouldhave a profound ability to visually analyze products.
Seven individuals with expert knowledge in visual design were recruited. Theexperts had a profound background in the field of industrial design and werecurrently professors, lecturers, or doctoral students at universities with industrialdesign-oriented educational programs. Their current research was related to visualproduct design, form development, or visual branding. The group was culturally
diverse; three continents were represented. Gender diversity comprised of twofemale and five male participants.
Expert Evaluation 2 was performed on an ordinal ranking scale, commonly appliedin marketing research settings (MSG). The Likert scale, applied in Expert Evaluation1, is also an ordinal scale. Ordinal data cannot generally be treated as continuousdata, since it is not possible to know the distance between each rank, or in the Likert
case, each ordered value. Thus, parametric analysis approaches such as the mean
and standard deviation are not suitable. For this type of data, non-parametric
approaches are recommended, one example being the median. However, though not
statistically justified, it has become common practice to assume that Likert
categories are ordered with equal distance, and to therefore treat the data as
continuous. For ordinal ranking data, this is a concern since the distance between
ranks may be even more ambiguous. However, for the purposes of positioning and
identifying a rough picture, the ordinal ranked measurements were treated as
continuous data in this study.
63
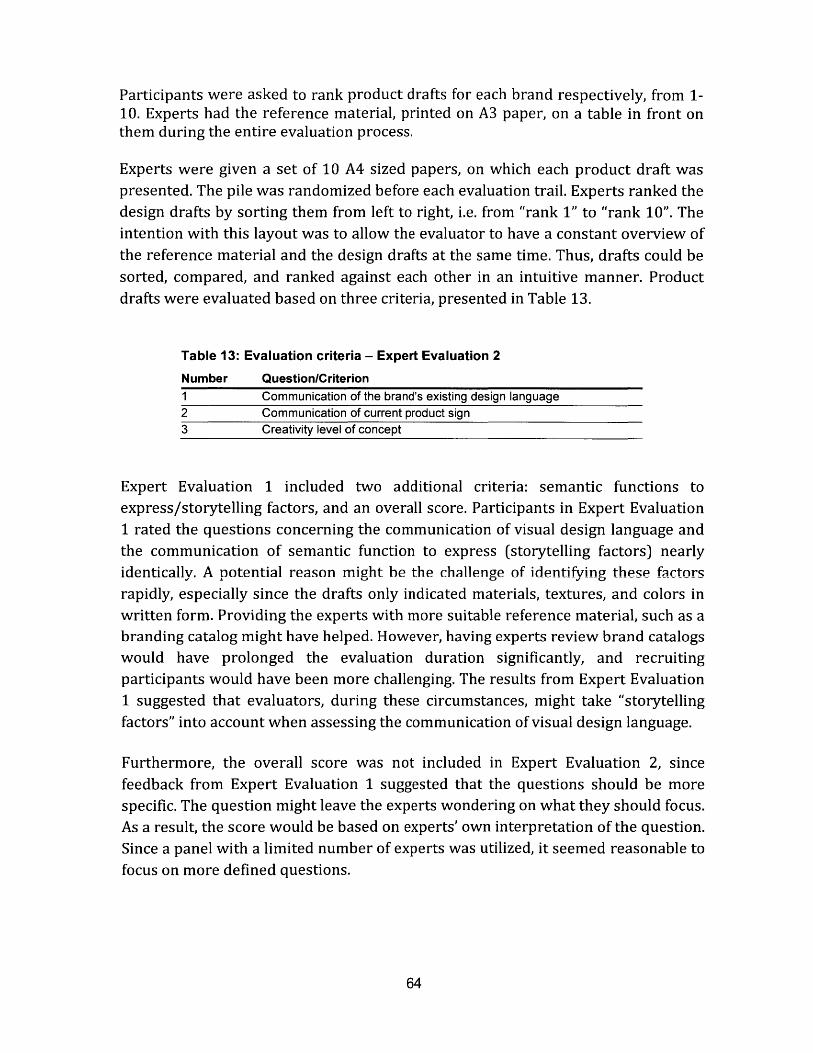
Participants were asked to rank product drafts for each brand respectively, from 1-10. Experts had the reference material, printed on A3 paper, on a table in front onthem during the entire evaluation process.
Experts were given a set of 10 A4 sized papers, on which each product draft waspresented. The pile was randomized before each evaluation trail. Experts ranked thedesign drafts by sorting them from left to right, i.e. from "rank 1" to "rank 10". Theintention with this layout was to allow the evaluator to have a constant overview ofthe reference material and the design drafts at the same time. Thus, drafts could besorted, compared, and ranked against each other in an intuitive manner. Productdrafts were evaluated based on three criteria, presented in Table 13.
Table 13: Evaluation criteria - Expert Evaluation 2
Number Question/Criterion1 Communication of the brand's existing design language2 Communication of current product sign3 Creativity level of concept
Expert Evaluation 1 included two additional criteria: semantic functions toexpress/storytelling factors, and an overall score. Participants in Expert Evaluation1 rated the questions concerning the communication of visual design language andthe communication of semantic function to express (storytelling factors) nearlyidentically. A potential reason might be the challenge of identifving these factorsrapidly, especially since the drafts only indicated materials, textures, and colors inwritten form. Providing the experts with more suitable reference material, such as abranding catalog might have helped. However, having experts review brand catalogswould have prolonged the evaluation duration significantly, and recruitingparticipants would have been more challenging. The results from Expert Evaluation1 suggested that evaluators, during these circumstances, might take "storytellingfactors" into account when assessing the communication of visual design language.
Furthermore, the overall score was not included in Expert Evaluation 2, sincefeedback from Expert Evaluation 1 suggested that the questions should be morespecific. The question might leave the experts wondering on what they should focus.As a result, the score would be based on experts' own interpretation of the question.Since a panel with a limited number of experts was utilized, it seemed reasonable tofocus on more defined questions.
64
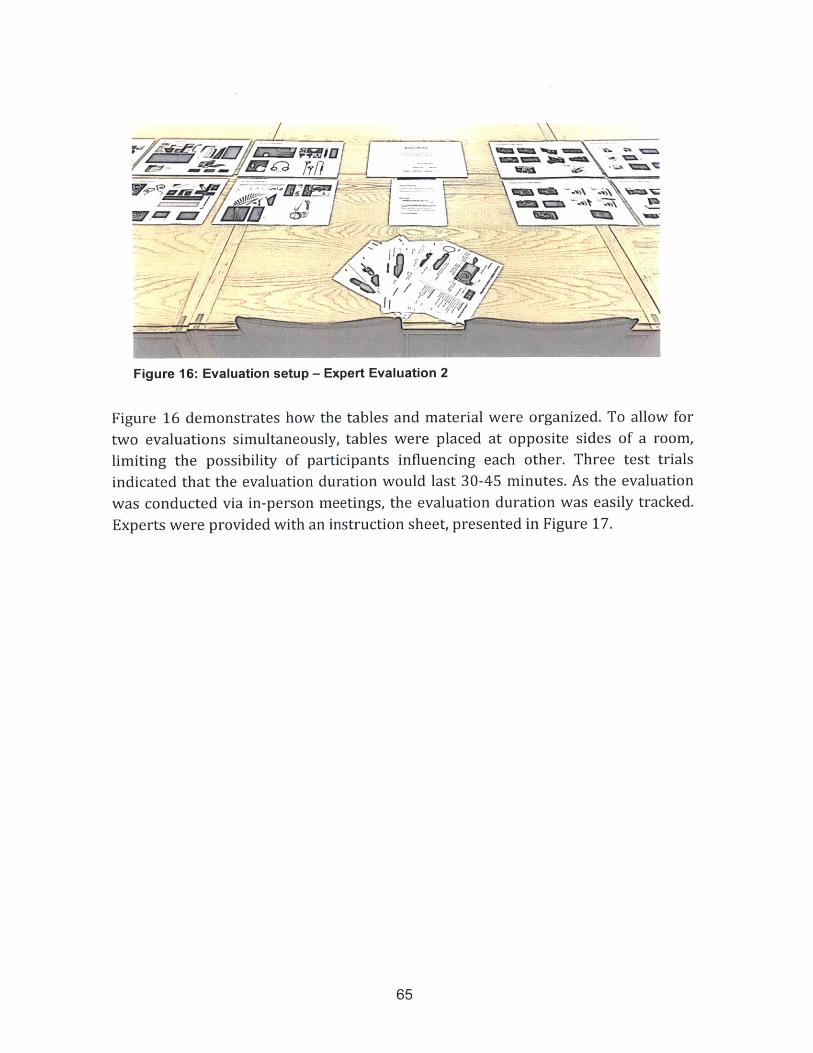
Figure 16: Evaluation setup - Expert Evaluation 2
Figure 16 demonstrates how the tables and material were organized. To allow for
two evaluations simultaneously, tables were placed at opposite sides of a room,
limiting the possibility of participants influencing each other. Three test trials
indicated that the evaluation duration would last 30-45 minutes. As the evaluation
was conducted via in-person meetings, the evaluation duration was easily tracked.
Experts were provided with an instruction sheet, presented in Figure 17.
65
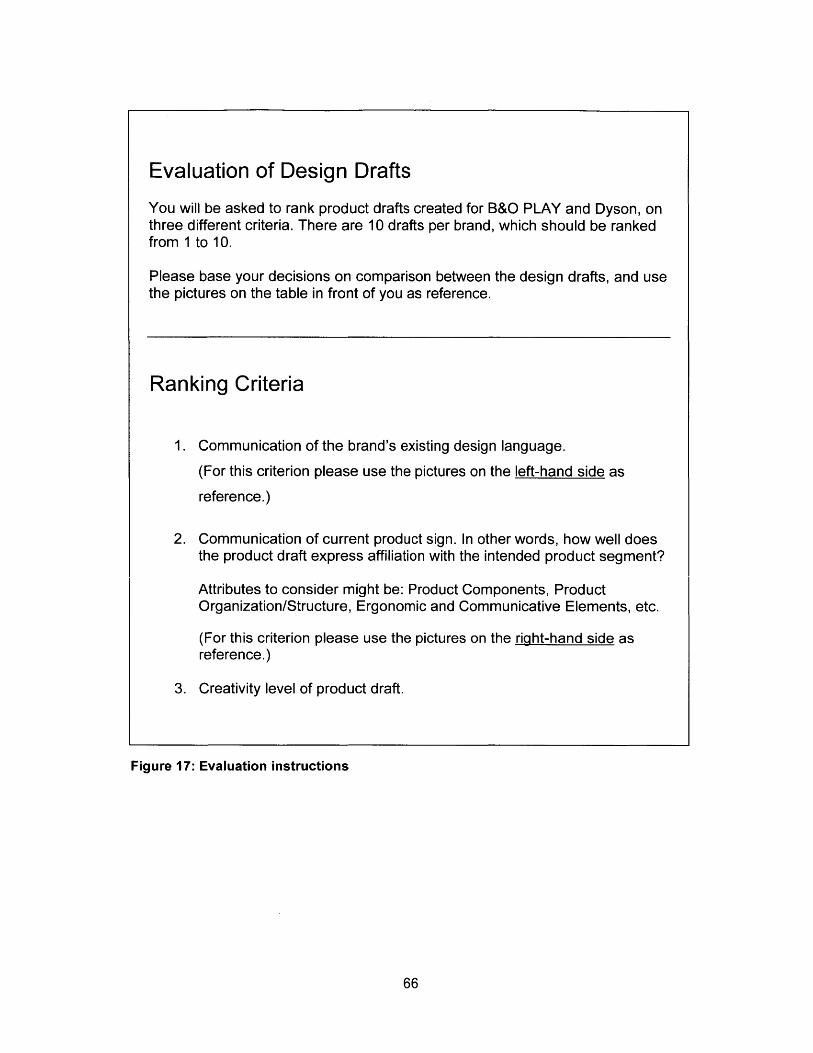
Evaluation of Design Drafts
You will be asked to rank product drafts created for B&O PLAY and Dyson, onthree different criteria. There are 10 drafts per brand, which should be rankedfrom 1 to 10.
Please base your decisions on comparison between the design drafts, and usethe pictures on the table in front of you as reference.
Ranking Criteria
1. Communication of the brand's existing design language.
(For this criterion please use the pictures on the left-hand side as
reference.)
2. Communication of current product sign. In other words, how well doesthe product draft express affiliation with the intended product segment?
Attributes to consider might be: Product Components, ProductOrganization/Structure, Ergonomic and Communicative Elements, etc.
(For this criterion please use the pictures on the right-hand side asreference.)
3. Creativity level of product draft.
Figure 17: Evaluation instructions
66
Chapter 6
ResultsThis chapter presents the results of the experimental evaluation. Data and resultsfrom the statistical analysis of Expert Evaluation 1, the visual design analysis, andExpert Evaluation 2 are presented. Expert Evaluation 2 is analyzed in greater depth,since it, as the chapter will unveil, resulted in the most reliable data. In addition, thechapter outlines the results from the assessment of participating designers' abilityto identify design features and explain their drafts. Designers' initial approaches tothe task are presented. Lastly, designers' attitudes towards the framework areexhibited.
The derived framework, presented in Chapter 3, is considered an intermediateresult on its own. Design drafts created by the experiment participants arepresented in Appendix C and D.
6.1 Initial evaluation
6.1.1 Expert Evaluation I
Survey data were examined using bootstrap analysis, addressed in Section 2.6.1. InExpert Evaluation 1, participants evaluated each product draft on five differentcriteria, using a seven-point Likert scale. Mean score differences between thecontrol and framework scenario were compared using 1,000 bootstrap samples anda 95% confidence interval (CI). Table 14 presents observed mean differences as wellas mean differences and confidence intervals constructed from the bootstrap data.
67
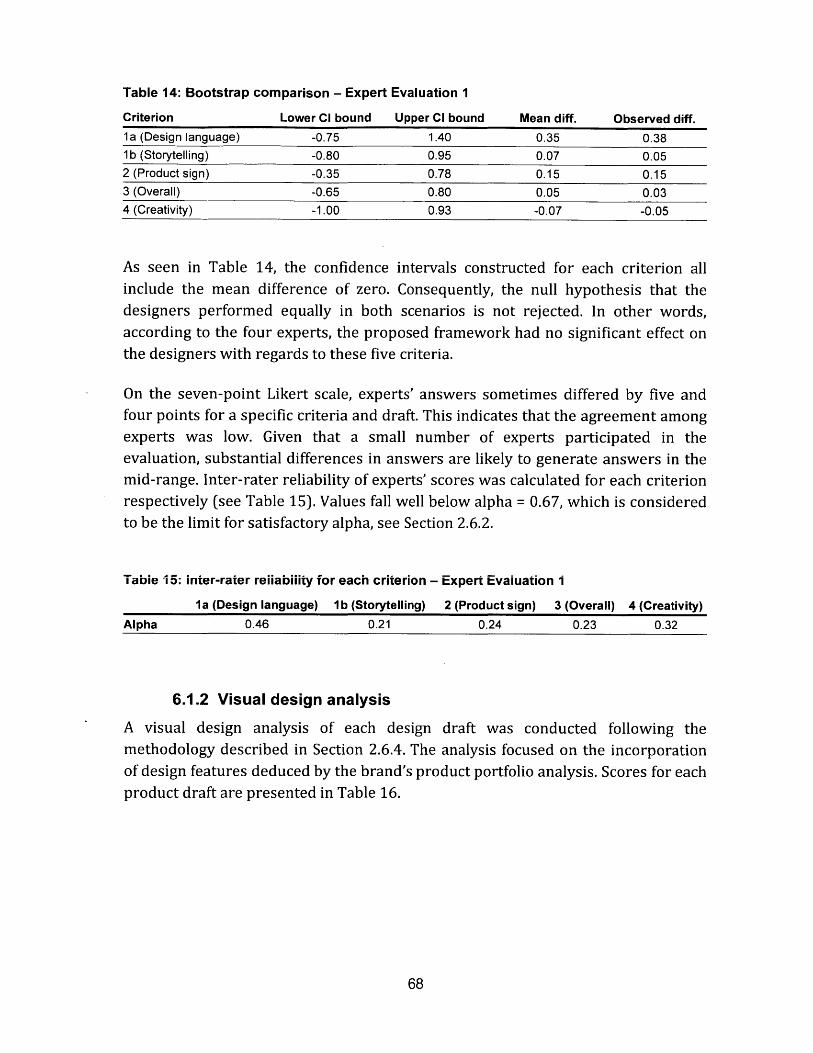
Table 14: Bootstrap comparison - Expert Evaluation 1
Criterion Lower CI bound Upper Cl boundla (Design language) -0.75 1.401b (Storytelling) -0.80 0.952 (Product sign) -0.35 0.783 (Overall) -0.65 0.804 (Creativity) -1.00 0.93
Mean diff.
0.350.070.150.05-0.07
Observed diff.
0.380.050.150.03-0.05
As seen in Table 14, the confidence intervals constructed for each criterion allinclude the mean difference of zero. Consequently, the null hypothesis that thedesigners performed equally in both scenarios is not rejected. In other words,according to the four experts, the proposed framework had no significant effect onthe designers with regards to these five criteria.
On the seven-point Likert scale, experts' answers sometimes differed by five andfour points for a specific criteria and draft. This indicates that the agreement amongexperts was low. Given that a small number of experts participated in theevaluation, substantial differences in answers are likely to generate answers in themid-range. Inter-rater reliability of experts' scores was calculated for each criterionrespectively (see Table 15). Values fall well below alpha = 0.67, which is consideredto be the limit for satisfactory alpha, see Section 2.6.2.
Tabie 15: inter-rater reiiabiiity for each criterion - Expert Evaluation i
la (Design language) lb (Storytelling) 2 (Product sign) 3 (Overall) 4 (Creativity)Alpha 0.46 0.21 0.24 0.23 0.32
6.1.2 Visual design analysis
A visual design analysis of each design draft was conducted following themethodology described in Section 2.6.4. The analysis focused on the incorporationof design features deduced by the brand's product portfolio analysis. Scores for eachproduct draft are presented in Table 16.
68
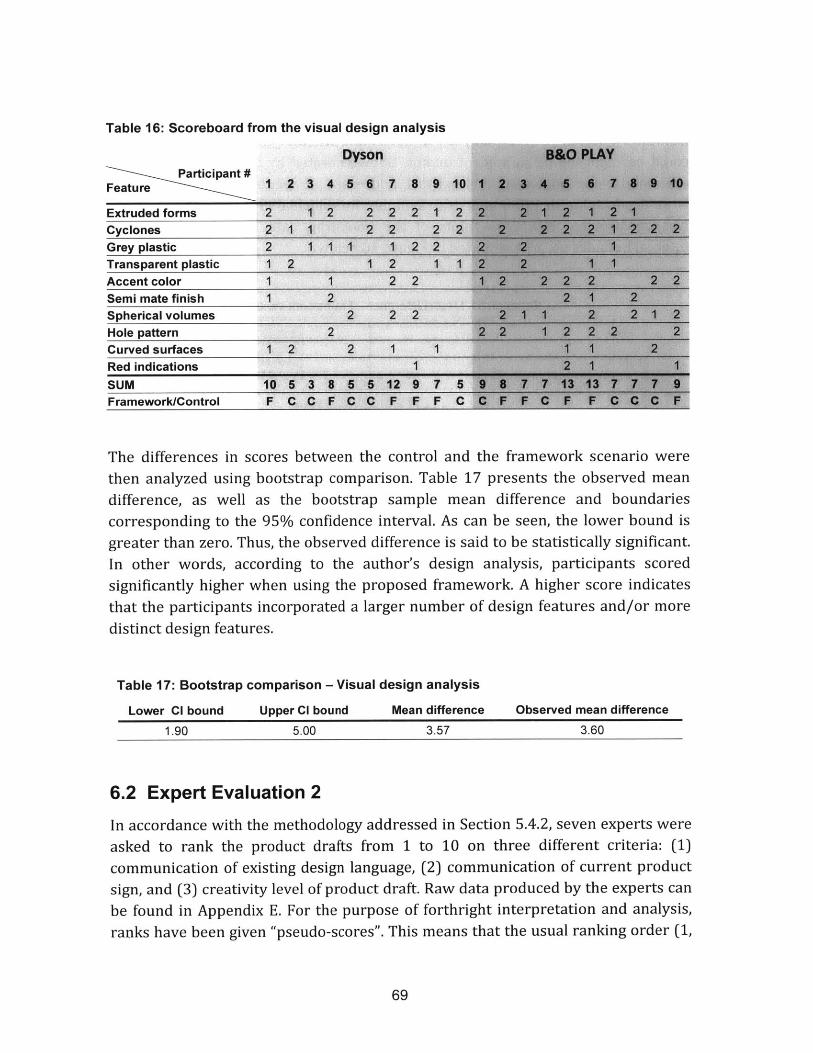
Table 16: Scoreboard from the visual design analysis
Participant#Featu're
Dyson
1 2 3 4 5 6 7 1 9 10
Extruded forms 2 1 2 2 2 2;1-Cyclones 2 1 1 2 2 2 2Grey plastic 2 1 1 1 1 2 2Transparent plastic 1 2 1 2 1 1Accent color 1 1 2 2Semi mate finish 1 2Spherical volumes 2 2 2Hole pattern 2Curved surfaces 1 2 2 1 1Red indications ISUM 1056 3 5 12 9.7. 5Framework/Control F C C F C F F F C
The differences in scores between the control and the framework scenario werethen analyzed using bootstrap comparison. Table 17 presents the observed meandifference, as well as the bootstrap sample mean difference and boundariescorresponding to the 95% confidence interval. As can be seen, the lower bound isgreater than zero. Thus, the observed difference is said to be statistically significant.In other words, according to the author's design analysis, participants scoredsignificantly higher when using the proposed framework. A higher score indicatesthat the participants incorporated a larger number of design features and/or more
distinct design features.
Table 17: Bootstrap comparison - Visual design analysis
Lower Cl bound Upper Cl bound Mean difference Observed mean difference
1.90 5.00 3.57 3.60
6.2 Expert Evaluation 2
In accordance with the methodology addressed in Section 5.4.2, seven experts were
asked to rank the product drafts from 1 to 10 on three different criteria: (1)communication of existing design language, (2) communication of current productsign, and (3) creativity level of product draft. Raw data produced by the experts can
be found in Appendix E. For the purpose of forthright interpretation and analysis,
ranks have been given "pseudo-scores". This means that the usual ranking order (1,
69
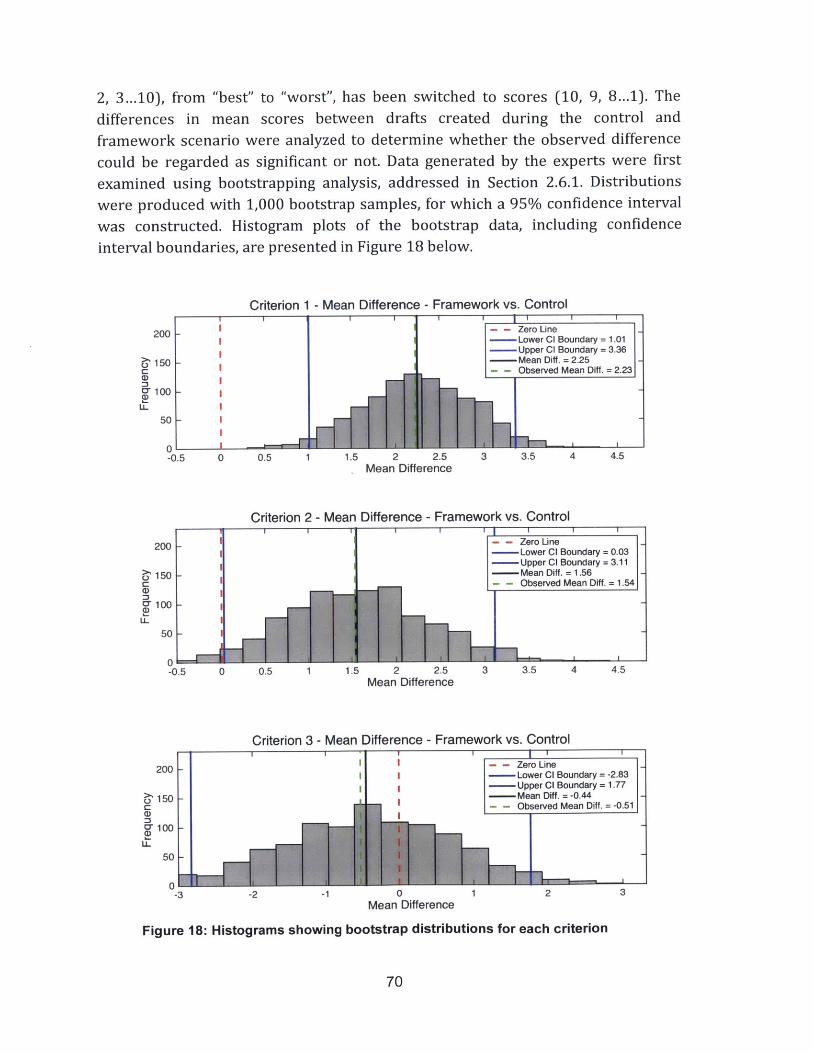
2, 3...10), from "best" to "worst", has been switched to scores (10, 9, 8...1). The
differences in mean scores between drafts created during the control and
framework scenario were analyzed to determine whether the observed difference
could be regarded as significant or not. Data generated by the experts were first
examined using bootstrapping analysis, addressed in Section 2.6.1. Distributions
were produced with 1,000 bootstrap samples, for which a 95% confidence interval
was constructed. Histogram plots of the bootstrap data, including confidence
interval boundaries, are presented in Figure 18 below.
Criterion 1 - Mean Difference - Framework vs. Control
200
150
100 -
50 -
0-0.5 0 0.5
I I I
1.5 2 2.5. Mean Difference
I I
- - Zero Line- Lower CI Boundary = 1.01-Upper CI Boundary = 3.36
- Mean Diff. = 2.25- - Observed Mean Diff. = 2.23
3 3.5 4 4.5
Criterion 2 - Mean Difference - Framework vs. Control
- - Zero Line- Lower CI Boundary = 0.03- Upper CI Boundary = 3.11- Mean Diff. = 1.56- - Observed Mean Diff. = 1.54
0 0.5 1 1.5 2 2.5Mean Difference
3 3.5 4 4.5
Criterion 3 - Mean Difference - Framework vs. Control
- - Zero Line- Lower CI Boundary = -2.83
- Upper CI Boundary = 1.77- Mean Diff. = -0.44- - Observed Mean Diff. = -0.51
-3 -2 -1 0 1 2Mean Difference
Figure 18: Histograms showing bootstrap distributions for each criterion
-IL
3
70
C.)
C)T*
U_
200
150c,
100(D
50.5
-0.5
200
150c)
100
50
I
I
I I
0 N
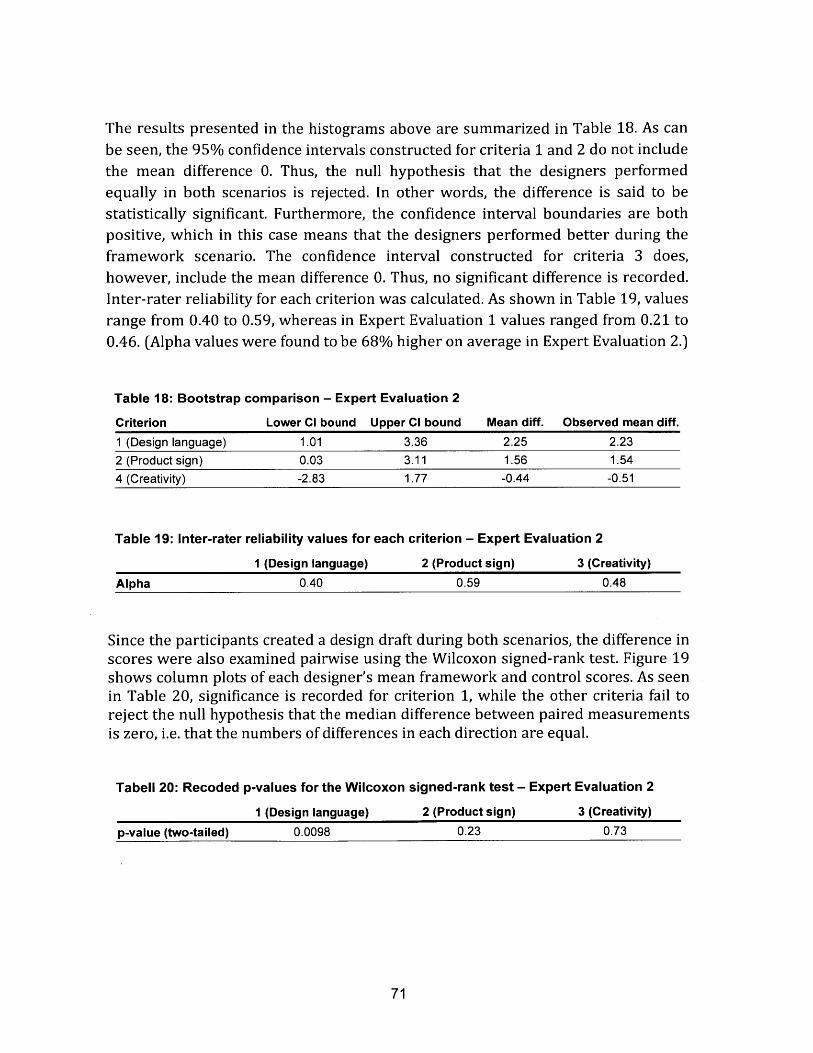
The results presented in the histograms above are summarized in Table 18. As canbe seen, the 95% confidence intervals constructed for criteria 1 and 2 do not includethe mean difference 0. Thus, the null hypothesis that the designers performedequally in both scenarios is rejected. In other words, the difference is said to bestatistically significant. Furthermore, the confidence interval boundaries are bothpositive, which in this case means that the designers performed better during theframework scenario. The confidence interval constructed for criteria 3 does,however, include the mean difference 0. Thus, no significant difference is recorded.Inter-rater reliability for each criterion was calculated. As shown in Table 19, valuesrange from 0.40 to 0.59, whereas in Expert Evaluation 1 values ranged from 0.21 to0.46. (Alpha values were found to be 68% higher on average in Expert Evaluation 2.)
Table 18: Bootstrap comparison - Expert Evaluation 2
Criterion Lower Cl bound Upper Cl bound Mean diff. Observed mean diff.
1 (Design language) 1.01 3.36 2.25 2.232 (Product sign) 0.03 3.11 1.56 1.544 (Creativity) -2.83 1.77 -0.44 -0.51
Table 19: Inter-rater reliability values for each criterion - Expert Evaluation 2
1 (Design language) 2 (Product sign) 3 (Creativity)
Alpha 0.40 0.59 0.48
Since the participants created a design draft during both scenarios, the difference inscores were also examined pairwise using the Wilcoxon signed-rank test. Figure 19shows column plots of each designer's mean framework and control scores. As seenin Table 20, significance is recorded for criterion 1, while the other criteria fail toreject the null hypothesis that the median difference between paired measurementsis zero, i.e. that the numbers of differences in each direction are equal.
Tabell 20: Recoded p-values for the Wilcoxon signed-rank test - Expert Evaluation 2
1 (Design language) 2 (Product sign) 3 (Creativity)
p-value (two-tailed) 0.0098 0.23 0.73
71
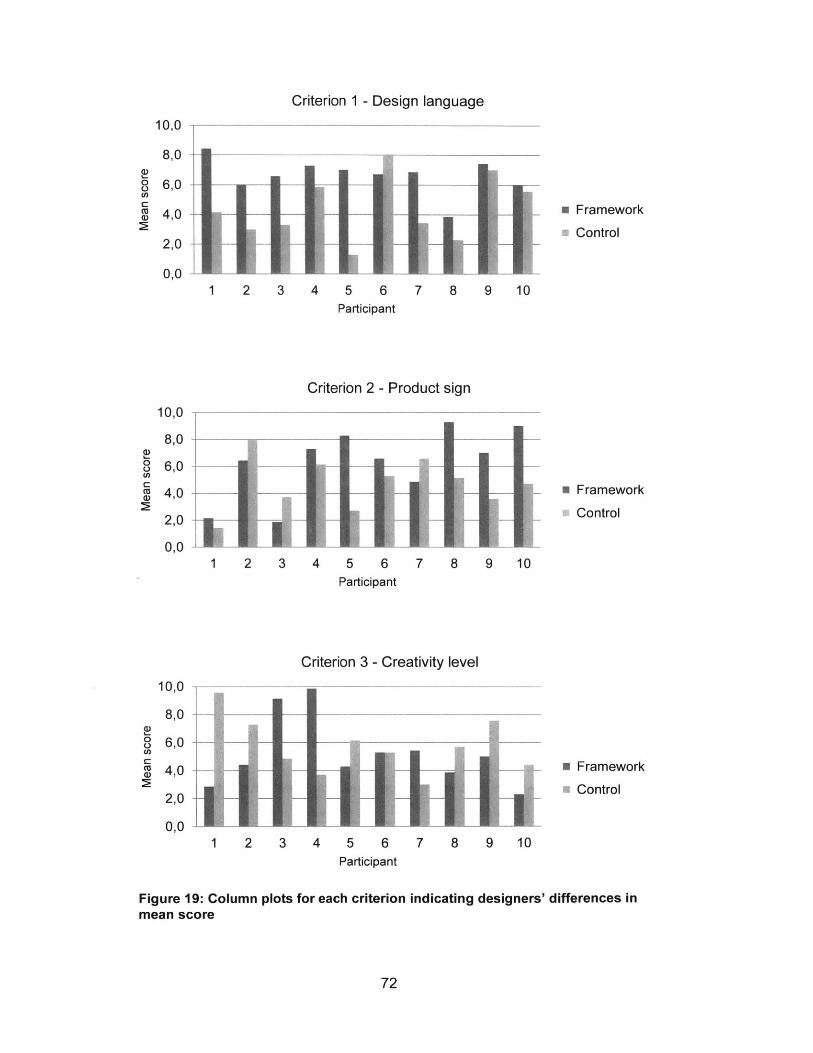
Criterion 1 - Design language1 nAA,
8,0
6,0
4,0
2,0
AAU,J
1 2 3 4 5 6 7 8 9 10Participant
Criterion 2 - Product sign
10,0
8,0 -
6,0
4,0
2,0
0,01 2 3 4 5 6 7 8 9 10
Participant
Criterion 3 - Creativity levelin ,
8,0
6,0
4,0
2,0
0,01 2 3 4 5 6 7 8 9 10
Participant
* Framework
Control
* Framework
Control
* Framework
* Control
Figure 19: Column plots for each criterion indicating designers' differences inmean score
72
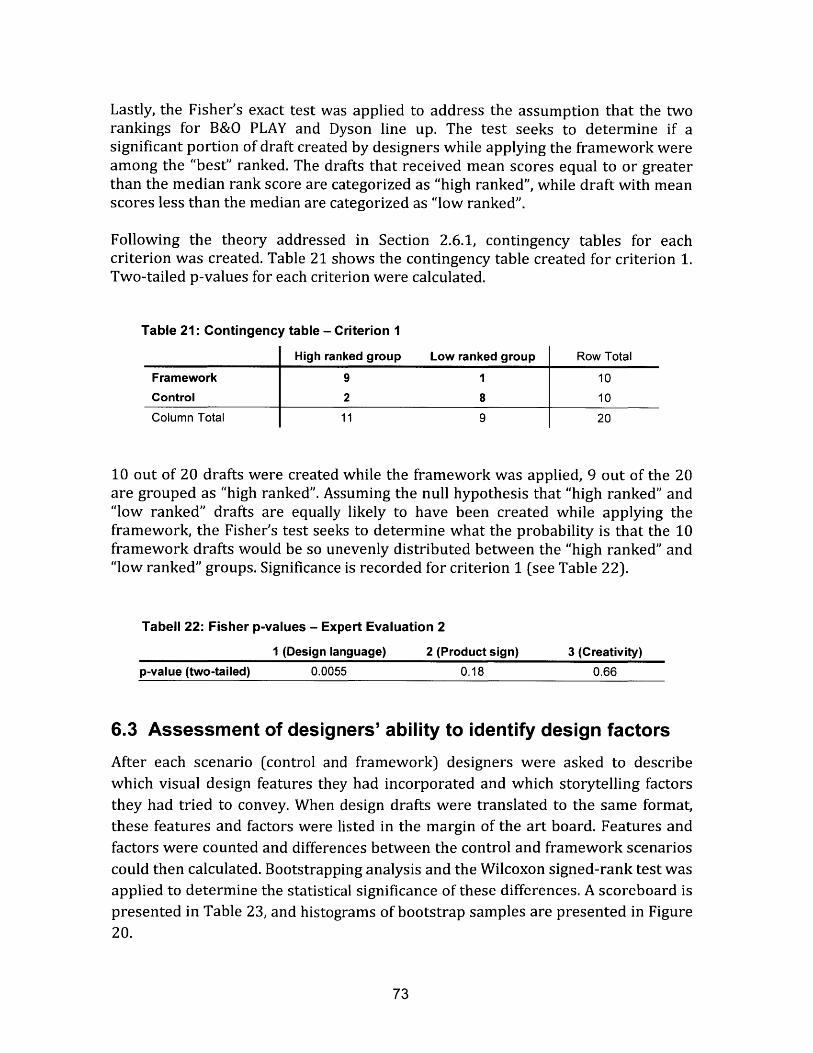
Lastly, the Fisher's exact test was applied to address the assumption that the tworankings for B&O PLAY and Dyson line up. The test seeks to determine if asignificant portion of draft created by designers while applying the framework wereamong the "best" ranked. The drafts that received mean scores equal to or greaterthan the median rank score are categorized as "high ranked", while draft with meanscores less than the median are categorized as "low ranked".
Following the theory addressed in Section 2.6.1, contingency tables for eachcriterion was created. Table 21 shows the contingency table created for criterion 1.Two-tailed p-values for each criterion were calculated.
Table 21: Contingency table - Criterion I
High ranked group Low ranked group Row Total
Framework 9 1 10Control 2 8 10Column Total 11 9 20
10 out of 20 drafts were created while the framework was applied, 9 out of the 20are grouped as "high ranked". Assuming the null hypothesis that "high ranked" and"low ranked" drafts are equally likely to have been created while applying theframework, the Fisher's test seeks to determine what the probability is that the 10framework drafts would be so unevenly distributed between the "high ranked" and"low ranked" groups. Significance is recorded for criterion 1 (see Table 22).
Tabell 22: Fisher p-values - Expert Evaluation 2
1 (Design language) 2 (Product sign) 3 (Creativity)p-value (two-tailed) 0.0055 0.18 0.66
6.3 Assessment of designers' ability to identify design factors
After each scenario (control and framework) designers were asked to describewhich visual design features they had incorporated and which storytelling factorsthey had tried to convey. When design drafts were translated to the same format,these features and factors were listed in the margin of the art board. Features andfactors were counted and differences between the control and framework scenarioscould then calculated. Bootstrapping analysis and the Wilcoxon signed-rank test wasapplied to determine the statistical significance of these differences. A scoreboard ispresented in Table 23, and histograms of bootstrap samples are presented in Figure20.
73
Table 23: Scoreboard showing the number of identified features and factors for eachdesign draft
Participant #
Design features
1 2 3 4
6 3 4 6Storytelling 3 1 2 3 2factorsFramework/Control
F C C F
Features - Mean Difference - Framework vs. Control
00
50
00 -
50 I
0-0.5 0 0.5
I I
1.b z
Mean Difference
I . I I I- - Zero Line- Lower CI Boundary = 0.90- Upper CI Boundary = 3.10
- Mean Diff. = 1.98- - Observed Mean Diff. = 2.00
2.5 3 3.5 4
Factors - Mean Difference - Framework vs. Control
200 -
150 -
100 -
50 -
0-0.5 0
I - - Zero Line-Lower CI Boundary = 0.30
- Upper CI Boundary = 1.60- Mean Diff. = 0.99- - Observed Mean Diff. = 1.00
0.5 1 1.5Mean Difference
2
Figure 20: Histograms showing bootstrap distributions for features and factors
As can be seen in Table 24 below, the difference is statistically significant on the
95% confidence interval in both cases, according to the bootstrapping analysis. In
agreement, the Wilcoxon signed-rank test recorded the two-tailed p-values 0.016
(features) and 0.023 (factors). Thus, participants identified a larger number of
design features and storytelling factors when applying the framework.
74
2
()01a)
LL
CrOR
0)
*

Table 24: Bootstrap comparison - Identification of brand-related features and factors
Lower Ci bound Upper Ci bound Mean diff. Observed mean diff.
Design features 0.90 3.10 1.98 2.00
Storytelling factors 0.30 1.60 0.99 1.00
6.4 Assessment of designers' own approaches
Based on the field notes taken during the observation of the control scenario, and on
designers' responses to the first part of experiment reflection 1 (i.e. "explain yourdesign process"), participants' own approaches to the task were qualitatively
assessed. Overall, designers followed the same general steps. However, there are afew differences in terms methodology and order of completion. In addition, differentapproaches for displaying scoured reference material were found. The identifiedgeneral steps include:
" Procurement of visual references/inspiration related to the brand" Procurement of visual references/inspiration related to the market segment,
or in some cases merely the product type" Displaying procured material" Taking notes" Initial sketching
Visual references to the brand were frequently obtained by using online searchengines. Participants searched for pictures using the image search function inGoogle Search, for example, or located the brand's official website.
Product-related visual references were also frequently sourced by image search.
Other online means included exploration of product review websites, non-
specialized e-commerce websites, and product-specific blogs. Product dimensions
were in one case explored using accessible office artifacts.
The majority of participants used the pictures' original location in the web browser
as method for exhibition. One participant image searched reference material for the
brand and the product category in two different browser windows and placed them
on two separate computer screens to allow for a good overview. Another participant
created a "mood board" in Adobe Illustrator including, according to the participant,
the most relevant reference material.
75
Seven participants took some type of notes, either during the search for referencematerial or before starting sketching. Five of the seven listed parameters related tothe brand's visual design language and storytelling factors, while the other two, inaddition to brand related parameters also listed functional and product-specificattributes.
Designers initiated their sketching processes in different ways and applied differentstrategies. However, the majority researched visual references related to both thebrand and the product before initiating sketching. One designer stated that hepreferred to do a lot of research before starting to draw, while others sketchedgeneral shapes early on and went back and forth between research and sketchingthroughout the experiment. Sketch iterations also varied between designers. Somestarted by making several small sketches before deciding on one final concept withwhich to continue. Other, more research-focused, designers stayed with oneconcept. One participant initiated the sketching process by tracing a design featurefrom one of the brands' existing products, and built a product draft around that.
6.5 Designers' attitudes towards the proposed method
The assessment of participants' attitudes is based on experiment reflection 2, whichpresented designers with two open-ended questions related to their views on theproposed framework.
1. What are your thoughts on the structure of the framework?2. What are your thoughts on the brand and product map?
The designers' responses are presented in Table 25 below. The responses wereexamined to determine whether they emphasized a positive, neutral, or negativeattitude towards the structure or the inclusion of the brand and product map.
Nine participants expressed positive comments with regard to both matters. Thedesigners typically stated benefits in terms of structured workflow, time efficiency,market research, and the ability to view the reference material holistically. In termsof the brand and product map, positive comments were related to product andbrand organization and product categorization. Designers who applied theframework to the B&O PLAY case especially appreciated the brand and productmap.
76

"This was new to me and Ifind it very effective. We will try this on some of our clients'projects. I think this could also help when talking to clients; it is a great way to explainreasoning." (Participant #3) - A designer working at a small design studio
Participant #7 expressed several strengths of the framework, but stated apreference for the first scenario. The participant indicated two reasons to hispreference. The designer felt more satisfied with the draft created during the firstscenario, but explained that he also knew more about that specific brand case brand,which the background survey likewise indicated. A two-point difference on the fivepoint Likert scale was recorded by the survey. In addition, the participant statedthat he recently graduated, and had predominantly worked on "change the worldtype of products", for which he usually applied a less restrictive approach to as well.
77
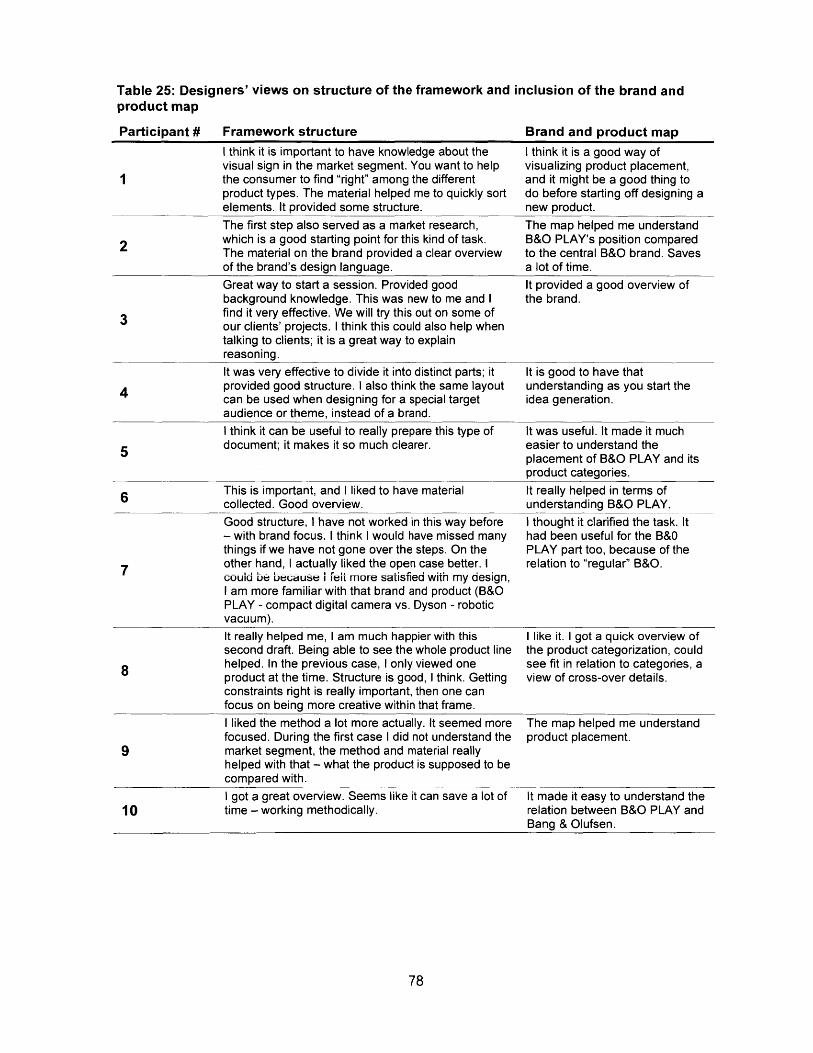
Table 25: Designers' views on structure of the framework and inclusion of the brand andproduct map
Participant # Framework structure Brand and product mapI think it is important to have knowledge about the I think it is a good way ofvisual sign in the market segment. You want to help visualizing product placement,the consumer to find "right" among the different and it might be a good thing toproduct types. The material helped me to quickly sort do before starting off designing aelements. It provided some structure. new product.The first step also served as a market research, The map helped me understand
2 which is a good starting point for this kind of task. B&O PLAY's position comparedThe material on the brand provided a clear overview to the central B&O brand. Savesof the brand's design language. a lot of time.Great way to start a session. Provided good It provided a good overview ofbackground knowledge. This was new to me and I the brand.
3 find it very effective. We will try this out on some ofour clients' projects. I think this could also help whentalking to clients; it is a great way to explainreasoning.It was very effective to divide it into distinct parts; it It is good to have thatprovided good structure. I also think the same layout understanding as you start thecan be used when designing for a special target idea generation.audience or theme, instead of a brand.I think it can be useful to really prepare this type of It was useful. It made it much
5 document; it makes it so much clearer. easier to understand theplacement of B&O PLAY and itsproduct categories.
6 This is important, and I liked to have material It really helped in terms ofcollected. Good overview. understanding B&O PLAY.Good structure, I have not worked in this way before I thought it clarified the task. It- with brand focus. I think I would have missed many had been useful for the B&Othings if we have not gone over the steps. On the PLAY part too, because of the
7 other hand, I actually liked the open case better. I relation to "regular" B&O.could be because i feit more satisfied with my design,I am more familiar with that brand and product (B&OPLAY - compact digital camera vs. Dyson - roboticvacuum).It really helped me, I am much happier with this I like it. I got a quick overview ofsecond draft. Being able to see the whole product line the product categorization, could
8 helped. In the previous case, I only viewed one see fit in relation to categories, aproduct at the time. Structure is good, I think. Getting view of cross-over details.constraints right is really important, then one canfocus on being more creative within that frame.I liked the method a lot more actually. It seemed more The map helped me understandfocused. During the first case I did not understand the product placement.
9 market segment, the method and material reallyhelped with that - what the product is supposed to becompared with.I got a great overview. Seems like it can save a lot of It made it easy to understand the
10 time - working methodically. relation between B&O PLAY andBang & Olufsen.
78
Chapter 7
Discussion and conclusionsThis chapter comprises discussion and conclusions related to the questionformulation of this thesis. Each research question is discussed based on the resultspresented in Chapter 6, and conclusions are drawn. In addition, the framework,experiment methodology, and designers' attitudes are expanded upon. Lastly,possibilities for future work are addressed.
The main objective of this study was to investigate how industrial designers may inpractice transfer an already established visual design language to new products. Thestudy's purpose was to add knowledge to the field of visual design methodology, andto encourage further exploration in the area. The aim was to formalize a frameworkthat is transparent and adaptable to various categories of consumer goods, aframework that both experienced and inexperienced designers can apply withconfidence. Design is supposed to be a creative process. Hence, it was seen as crucialthat the framework left room for the designers' creativity to flourish. A frameworkwith the characteristics described above could have the ability to support newlyemployed in-house designers, and designers at design firms working with differentclients. In addition, the framework could have educational applications, working asa tool to develop design students' ability to think about visual design in a strategicyet creative manner. Three research questions were formulated, which guided the
direction of this study.
79
7.1 Designers' approaches to a brand extension task
Question 1: How do industrial designers approach a brand extension task?
During the assessment of participants' approaches to the task, presented in Section6.4, it was found that designers generally followed a few general steps, even thoughmethodology and order of completion differed. The steps involved:
" Procurement of visual references/inspiration related to the brand" Procurement of visual references/inspiration related to the market segment,
or in some cases merely the product type" Displaying procured material" Taking notes* Initial sketching.
All these steps seem rather intuitive; in order to extend a brand's visual designlanguage to a new product, one simply needs to consider visual references related tothe brand and the product. The information has to be displayed in order for it to bevisually examined. Notes are taken to store information from the examination, afterwhich the sketching session is initiated. The difference may lie in the means bywhich material is sourced and displayed, and most importantly on which groundsdesign features are selected.
None of the participating designers stated that they applied any kind of logicreasoning or methodology to support and explain their selection of design features.In experiment reflection 1, designers were asked to describe their design process.Three quotes from answers intended to explain the reasoning during the selectionof design features are presented below.
"I started with basic market research - scanned Dyson's visual language and roboticvacuums, then tried to 'melt' them together." (Participant #5)
"Sketched general shapes, then added details with B&O PLA Yfeeling." (Participant #8)
"I tried to pick what I likefrom B&O PLAY and combine it with other brands in similarcategories." (Participant #9)
These answers indicate that designers may lack a concise way of communicatingdesign intent. The process of selecting design features seems to be based, to a largeextent, on the "touch and feel" of the designer. Words used to describe design intent
80
are in this case general and ambiguous in meaning. This suggests that theunderlying reasoning related to design decisions is challenging to articulate; this isalso acknowledged by Warell and Nabo (2002). Furthermore, a conclusion based onthese statements and the result presented in Section 6.4 is that industrial designersin fact think, to a certain degree, in terms of the POD and POP concepts proposed byKeller et al. (2012), since they consider reference material related to brand-specificand product-oriented characteristics. However, no general design processapplicable to extensions of visual brands appears to be established.
7.2 Assessment of the framework
Question 2: Can a structured framework, based on established branding andvisual design research, help designers create more successful brand extensions?
Designers' experiment performance was measured based on several differentparameters. During the two expert evaluations a successful brand extension wasdefined based on branding theory, which suggested that the product shouldcommunicate the brand's existing characteristics and indicate product categoryaffiliation. In addition, expert evaluations investigated perceived creativity level ofeach draft. Furthermore, performance was examined by conducting a visual designanalysis of the drafts with regard to the brands' existing product portfolios.Participants' ability to identify design features and core brand values wasinvestigated. Lastly, designers' attitudes towards the framework was explored.
7.2.1 Interpretation of results
Expert Evaluation 1 showed no significant difference among designers'performances. As addressed in Section 5.2, the evaluation posed reliability andexpert engagement concerns, which led to the development of Expert Evaluation 2.All test results from Expert Evaluation 2 indicate significant differences in the drafts'ability to communicate the target brand's existing design language, based onwhether the framework was applied or not. In addition, the bootstrappingcomparison indicated significant difference in designers' ability to create drafts thatshow clear product category affiliation; however, significance was not indicated bythe Wilcoxon signed-rank test and the Fisher's exact test. These results should notbe viewed as definitive, since they are based on ordinal ranking data that weretreated as continuous data. The results should rather be seen as a general firstindication of designer performance. In spite of this, Expert Evaluation 2 was viewedas the more appropriate of the two experimental evaluations, due to improved
81
inter-rater reliability, consequent evaluator engagement, and positive feedbackfrom participating experts. Difference in performance appeared to be more evidentin terms of the drafts' ability to communicate the brand's visual design language,while the significance in difference in terms of the communication of currentproduct sign was merely recognized by one statistical test. However, although it isbeneficial if affiliation with the product category is evident, it does not have to beoverly expressed. Nevertheless, it should be noted camera drafts created during the"control" scenario, in some cases, differed considerably from the typical layout of acamera in the target segment. Two drafts involved extruded and exchangeablelenses, one of which was placed on the right-hand side of the camera body. Camerasin the target segment, (compact/point-and-shoot digital camera, standardconfiguration, $250-400), are today signified by telescopic lenses, which are placeeither in the center or towards the left-hand side of the camera body (B&H Photo).
The visual design analysis indicated significant differences in participants' scores. Ahigher score while applying the framework indicates that participants incorporateda larger number of design features and/or more distinct design features. For bothcase brands, the existing product portfolio was first analyzed and score table wascreated, after which design drafts were analyzed and scored according to the table.It should be noted that the visual design analysis executed by the author, althoughperformed in a methodically manner, is based on subjective identification of designfeatures. Furthermore, it should be stressed that a higher number of incorporateddesign features in a product does not necessarily signify that a product expressesthe brand's visual design language more clearly. Some features might be morepredominant, and if a feature with such characteristics is incorporated alone in abold manner, the product might be perceived as expressive of the brand's designlanguage. As such, the results should not be considered a definite measurement ofthe success of the brand extension, but rather provide further indication thatdesigners, while applying the framework, managed to incorporate a larger numberof designer features in their designs.
Furthermore, participants identified a larger number of visual design features andcore brand values when applying the framework. This is viewed as one of the morestatistically sound results, since the features and factors were stated by theparticipating designers themselves. However, this does not necessarily mean thatthe features and factors were "correct" with regard to the brand, and it does notmean that they were incorporated in an identifiable way. Nevertheless, it doesindicate that the framework helped designers to allocate more features and factors,thus leaving them with a larger "bank" of design parameters to consider as theyinitiated their concept development. There are many aspects of the framework that
82
could have helped in this case. One possible reason may be the attached lists ofpotential attributes to consider during each step, as it provided the designers with astarting point for their identification process.
Designers' attitudes towards the proposed framework were generally positive, bothin terms of structure and inclusion of the brand and product map (modified brandhierarchy tree). Reflection responses suggest that the designers appreciated thestructured process of identifying design features related to the brand's designlanguage and the product's target market segment. The framework's structure wasdescribed as effective, and its ability to project a complete and holistic view of thereference material was mentioned as a major benefit. One designer expressed thatthe framework potentially could help him explain design reasoning to clients. Inaddition, several responses during experiment reflection 2 suggest that the brandand product map helped designers understand brand and product relation, whichwas part of the purpose of its inclusion. Designers who applied the framework to theB&O PLAY case especially appreciated the map, the reason being that it helped themunderstand the relation between B&O PLAY and Bang & Olufsen. One designermentioned that it helped with finding "cross-over" details among productcategorizations, which was the second part of the purpose of its inclusion.
As discussed above, the experiment provided several indications that theframework has the potential to help designers create more successful brandextensions. However, further investigation and evaluation are needed to determinethis with certainty. Furthermore, there are several parts of the framework thatcould have had different levels of impact. Nevertheless, participants' attitudestowards both the structure and the brand and product map were predominantlypositive. Lastly, it should be noted that the study involved a substantial amount ofsubjective reasoning, even though steps were taken in order to make exploration asdefined as possible given available resources.
7.3 Impact on creativity
Question 3: Does a structured method of this type limit designers' creativeabilities?
The expert evaluations indicated no significant difference in creativity level of theproduct drafts created by designers. Furthermore, survey responses indicated thatthe attitude towards the framework was mainly positive, which also may suggestthat the framework's structure was not seen as a concern in terms of the designers'
83

ability to work creatively. However, there was one exception. One participantexpressed that he preferred applying a less directed design process. Experts did,however, rank the product draft he created while applying the framework as morecreative. The participant explained his view by stressing that he had recentlygraduated, and that he had mainly worked on "change the word" types of products.Thus, this participant's view might on its own indicate that there is a potential needto have a framework functioning as an educational tool for strategic visual design.
7.4 Evaluation methodology
7.4.1 Structure
The experimental duration for each scenario was short; designers spent 30 minutescreating each product draft. However, previous research suggests that initialconcepts often tend to stay with designers' (Warell & Naibo, 2001), which alsofunctions as additional motivation for a framework of this nature. If initial conceptstend to stay with the designer throughout the development process, it appearsessential to have a well-defined starting point, i.e. an established visual referenceframe.
Since recruiting industrial designers, who had earned a degree and were active inthe field, for a 90 minute long experiment was perceived as a challenging task, theexperiment was designed to allow for a limited number of participants. For thatreason all designers completed both scenarios: control and framework.Furthermore, the recruitment challenge led to a group of participants with a widerange of experiences and backgrounds. Therefore, designers' performances was alsoassessed pairwise using the Wilcoxon signed-rank test.
The layout raises concerns in terms of fatigue after the first scenario and learningfrom the first scenario for the second scenario. The fatigue concern was partlyaddressed by a short 5-10 minute break between the two scenarios, andparticipants were offered refreshments if they so requested. Designers' learningfrom the first case was not perceived as a major concern. The fundamental task wasthe same; the cases were however different in terms of branding strategies and
visual design languages. Furthermore, participants were not provided with anyinformation or material to foster learning during the first scenario.
As mentioned above, two different cases were applied in order to allow for a limitednumber of participants with different levels of experience. The two different casescould potentially have affected the experiment, depending on participants'
84

individual knowledge about the brand and familiarity with the product type. As an
attempt to minimize these potential effects, cases were selected based on brandreputation, complexity of visual design language, and maturity of product sign. Acomplete view of the reasoning applied during the case selection can be found in
Section 4.2. In addition, all participants indicated a level of familiarly with each
brand in the background survey before the experiment started. The individual
difference between familiarity levels ranged from zero to two on a five-point Likert
scale, where the lowest recoded rating was two - "I know about them"
7.4.2 Expert evaluation
Experts evaluated the concepts based on material similar to the case material
provided during the framework scenario. Since the task was to evaluate how well
each draft communicated: (1) the brands' existing design language, and (2) the
current product sign, reference material was adapted from (1) the brands' official
media channels and (2) specialized retailers, which materials were assumed to be
"up to date". Since expert evaluation was employed, this was viewed as the most
valid option; it is after all the correct reference for an evaluation with these
characteristics. In the future, other means of evaluation might be viable in order to
avoid evaluation with similar material. This will be further addressed in Section 7.6.
7.4.3 Comments on statistics
The main purpose of the experiment was not to definitely determine whether the
framework is a helpful tool to designers or not. The purpose was rather to explore
whether a framework of this nature potentially has the ability to support designers
as they approach a brand extension task. An ordinal rank order scale was used to
make the task of visual evaluation more direct, by letting experts evaluate the
concepts both against the reference material and against each other. Adapting a
rank scale ensured that experts utilized the full scale, and were more devoted to the
task. However, this comes with the drawback of added uncertainty regarding
"distance" between each ranked product draft. Furthermore, even though Expert
Evaluation 2 resulted in data with improved inter-rater reliability, the values did not
fully reach the limit that is generally considered satisfactory. As mentioned in above
section, other means of evaluation may be explored, which ideally also should allow
for collection of data with higher inter-rater reliability. Potential future approaches
are presented in Section 7.6.
85
7.5 Frameworks for visual design
Tools brought forward by researchers in the past, such as that of Warell and Naibo(2002), are certainly interesting and fruitful, and especially useful in determiningtypicality of identified design features throughout a brand. However, to designersthey may in some circumstances appear too static (Ekmekci, 2007). Furthermore,existing tools do not explicitly consider the organization of visual design languages.One reason may be that they mainly appear to have been explored in relation to carbrands (Karjalainen, 2007), which generally employ a strong and similar designlanguage throughout their entire portfolio. However, brands connected to smallerconsumer products may find value in employing slightly different features amongtheir product categories and lines, e.g. Bosch Power Tools. Thus, when considering abrand extension in the context of consumer goods, the task of identifying line andcategory-specific features becomes increasingly important. In comparison withexisting tools, this study explored a framework that allows for more openassessment of features, while at the same time supporting designers in terms ofidentifying visual strategies. Two examples of design strategies were illustrated bythe case brands in this study, Dyson and B&O PLAY. In addition, Bosch Power Tool'sstrategy was addressed in Section 3.2, as the framework was introduced.
Another design strategy acknowledged by researchers (Karjalainen, 2006;Andersson, 2015) is characterized by extra attention to certain "lead products",mainly applied by companies with larger product portfolios. Lead productscommunicate the brand's idenLity in a particularly strong manner, and are createdin a situation where it may be difficult for customers to recall the full productportfolio. The framework does not explicitly suggest that special attention should bepaid to the concept of lead products. Instead it is advocated that all products shouldbe considered, which of course would include products that may be categorized aslead products. Nevertheless, if the starting point is a brand with a large productportfolio, making the task of identifying design features difficult to comprehend, e.g.Bosch Power Tools, one may focus on a set of the brand's most characteristicproducts in each other brand's product categories or lines.
Finally, the framework does not apply the terms "explicit" and "implicit" references,advocated by researchers such as Karjalainen (2006). However, the frameworksuggests the investigation of visual design features as well as core brand values,which provides the designers with necessary information for the generation of bothexplicit and implicit design features. Since this study should be viewed as a firstexploration of frameworks based on POP, POD, and brand hierarchy trees, inclusion
86
of additional terminologies unfamiliar to many practitioners would have made the
task of meaningful experimental design and evaluation even more challenging.
7.6 Future work
Practical, supportive frameworks and tools in this line of work are lacking. Hence,
future research in the area is highly encouraged. Future studies of similar nature,
involving concept generation followed by evaluation, could be extended to a larger
number of participants, both in terms of designers and evaluators. To achieve a high
number of participating designers, future studies could for example be conducted in
collaboration with institutions offering educational programs in the field of
industrial design. Larger samples would allow for richer data collection and
additional qualitative feedback on supportive frameworks' potential benefits and
limitations. As the framework might be useful in educational settings, such
collaborations would be increasingly interesting to explore. In addition, studies in
such settings may allow for an extended experimental duration, which could
potentially result in more detailed product drafts and renderings, displaying
complex shapes, materials, colors, textures, etc., in an intuitive manner.
Visual evaluation is an interest subject on its own. Various evaluation approaches
were explored in this study, and there are further paths to investigate. The central
issue when considering evaluation of brand extensions comes from differences
among evaluators' individual experiences with specific brands and products. Other
deviations in perception may be connected to differences in social and cultural
backgrounds. This a challenge not only for experimental evaluation purposes, but
also for brands and their designers. A brand that is active on the global market has
to communicate to individuals with different experiences and backgrounds. Brands
can choose to apply different strategies in different regions, but there are economic
benefits in terms of production and marketing costs, for example, and benefits
related to global recognition in being able to apply a consistent universal design in
all markets. Thus, added knowledge in areas related to customer perception is
valuable. Perception becomes especially critical when considering communication
of core brand values encoded in shapes and other design features, whereas
communication of brand identity through recognizable consistency alone may be
easier to detect.
Nevertheless, future studies could consider other rating-oriented approach that
would allow for evaluation without extensive reference material, and collection of
data with higher inter-rater reliability. One option may involve recruitment of
87
experts with high-level insight into the target brand's visual language and theproduct category. Experts focusing on brand-related criteria could be recruited from
management with knowledge in the area, flagship stores, or in-house design teams.Employees in stores specialized in the relevant product category could be recruited
for product-related evaluation criteria.
A potential method applicable to evaluation of product perception might be visual
pairwise "conjoint analysis". The method has, for example, been explored in areasrelated to evaluation of individuals' perceptions of different product packaging(Grobelny & Michalski, 2014), which implies that it could have applications in terms
of product design perceptions as well. Analysis of this type would allow for
comparison between two concepts at the time, while reference material, if needed,could be showcased simultaneously and kept the same for each concept pair. Thiswould allow for pairwise and adaptive concept comparison.
Other means suitable for future product draft evaluations may involve identifyingproduct attributes, such as design features or core brand values, based on a crowdassessment, potentially with the implementation of a "semantic differential scale".Individuals could then be asked to evaluate each design draft based on the identified
attributes, after which a model could be built be to quantify the variable importance.
Part of the aim in deriving the framework was to provide designers with strategic
support and a defined starting point, especially applicable to early idea generation,without overly restricting the creative essence many designers associate withdesign practices. However, the derived framework could be combined with other
tools focusing on qualifying frequency of brand-related designer features, such asthe method used for visual evaluation of the design drafts in this study. Equivalenttools could be applied to identify frequency of product category-specific features as
well. Inclusion of tools with these characteristics would result in a more analyticallyoriented framework, potentially useful for detailing and evaluation of brandextensions.
Visual brand recognition plays a pivotal role for many companies today. Practicalsupport for designers could help them create more aesthetically appealing and
consistent product portfolios, for the benefit of both consumers and companies.
88

Bibliography
Aaker, D. A. (1996). Building strong brands. New York, Free Press.
Aaker, D. A. (1997). Should you take your brand to where the action is? HarvardBusiness Review, 75(5), 1997.
Aaker, D. A. (2004). Brand portfolio strategy: creating relevance, differentiation,energy, leverage, and clarity. New York, Free Press.
Aaker, D. A., & Joachimsthaler, E. (2009). Brand leadership. London, Pocket.
Ader, H., Mellenbergh, G., & Hand, D. (2008). Advising on research methods: aconsultant's companion. Huizen, Johannes van Kessel Publishing.
Andersson, T., & Warell, A. (2015). Aesthetic Flexibility in the Management of VisualProduct Branding, AHFE 2015, Procedia Manufacturing, 3(1), 2191-2198.
Andersson, T., Warell, A., & Holmlid, S. (2013). Product gist: An Approach toidentifying from characteristics of the current product sign. 10th EAD,Crafting the Future.
Antoine,J.-Y., Villaneau, J., & Lefeuvre, A. (2014) Weighted Krippendorffs alpha is amore reliable metrics for multi-coders ordinal annotations: experimentalstudies on emotion, opinion and coreference annotation. EACL, 10 p., April,Gothenburg.
Bennett, B. (2013). Bulldog Reporter - PR News, Views, and Resources. Retrievedfrom http://www.bulldogreporter.com/pr-storytelling-how-develop-your-brands-story/, Accessed 06/18/2015.
B&H Photo. Point & Shoot Cameras. Retrieved fromhttp://www.bhphotovideo.com/c/search?atclk=Camera+TypeStandard+Compacts&ci=8612&N=4288586279+4052359763&mnp=250&mxp=400,Accessed 16/03/2015.
B&O a. (2012). Bang & Olufsen unveils new brand: B&O PLAY. Retrieved fromhttp://www.bang-olufsen.com/en-US/the-company/press/-/media/B9333446059342D9252F10A5330411A.pdf,Accessed 03/16/2015.
B&O b. BeoPlay, Retrieved from http://www.beoplay.com/Products, Accessed03/16/2015.
89
B&O c. BeoPlay, Retrieved from http://www.beoplay.com/about, Accessed03/16/2015.
B&O d. Bang & Olufsen, Retrieved from http://www.bang-olufsen.com/en/Search?q=awards, Accessed 10/07/2015.
B&O e. Bang & Olufsen, "Mew and B&O PLAY announce music app." Retrieved fromhttp://www.bang-olufsen.com/-/media/Files/PDF/Newsroom/B_0%20Play/10062013_Mew%20and%20BEO%20PLAY%20announce%20music%20app.pdf, Accessed,10/07/2015.
B&O f. Bang & Olufsen, Retrieved from http://bangolufsen.london/shop/beolab-18-wall-brackets/, Accessed 10/07/2015.
B&O g. B&O PLAY, Retrieved fromhttp://www.beoplay.com/products/beoplaya2#usp, Accessed 10/07/2015.
B&O h. Bang & Olufsen, "Bang & Olufsen A/S Group Annual Report 2014/15."Retrieved fromhttp://az498215.vo.msecnd.net/static/files/annual-reports/BOAR14-15_UK.pdf, Accessed 14/08/2015.
Creamer, M. (2014). AdvertisingAge, "James Dyson: 'I Don't Believe in Brand."'Retrieved from http://adage.com/article/adages/design-icon-james-dyson-
1-2AA4OA Acss --- I/1/21.I Lu 4II /.T V
1f IL~ C U/ LUI ILA) IJ.
De Chernatony, L. (1989). A concise overview of business to business marketingresearch. Cranfield, Bedford: Cranfield School of Management, CranfieldInstitute of Technology.
Doust, H. V., & Esfahlan, H. N. (2012). The effect of brand extension strategies onbrand image: An integrative model and research propositions. African Journalof Business Management, 6(11), 4234-4244.
Dyson a. Dyson, Retrieved fromhttps://www.careers.dyson.com/rdd/default.aspx?panel=design, Accessed03/16/2015.
Dyson b. Dyson, Retrieved from http://www.dyson.com/store.aspx, Accessed03/16/2015.
Dyson c. Dyson, Retrieved fromhttps://www.careers.dyson.com/about/default.aspx, Accessed 03/16/2015.
90

Dyson d. Dyson (2013). "Dyson Air Multiplier". Retrieved fromhttp://www.dyson.com/medialibrary/Files/Dyson/Dyson%20AM01AM 0 5 .pdf, Accessed, 05/16/2015.
Eggink, J. (2012), Krippendorffs Alpha. Retrieved from,http://www.mathworks.com/matlabcentral/fileexchange/36016-krippendorff-s-alpha?stid=srchtitle, Accessed 12/10/2015.
Ekmekci, H. T. (2007). Strategic Brand Communication in Product Design.Graduate School of Engineering and Science. Izmir Institute of Technology,Izmir, Turkey.
Farquhar, P. H. (1989). Managing Brand Equity. Marketing Research, (1), 24-33.
Grobelny I., & Michalski R. (2015). The role of background color, interletter spacing,and font size on preferences in the digital presentation of a product.Computers in Human Behavior, 43, 85-100.
Gwet, K. L. (2014). Handbook of inter-rater reliability: the definitive guide tomeasuring the extent of agreement among raters. Gaithersburg, MD:Advanced Analytics, LLC.
Hanlon, P. (2012). "If Sir Dyson Doesn't Believe In Brands, Why Has He SpentMillions Building One?" Retrieved fromhttp://www.forbes.com/sites/patrickhanlon/2012/05/06/if-sir-dyson-doesnt-believe-in-brands-why-has-he-spent-millions-building-one/2/,Accessed 06/16/2015.
He, H., & Li, Y. (2010). Consumer evaluation of technology-based vertical brandextension. European Journal of Marketing, 44(9/10), 1366-1383.
Hollis, N. (2014). "Innovation continues to power premium brand Dyson." Retrievedfrom http://www.millwardbrown.com/global-navigation/blogs/post/mb-blog/2014/08/18/innovation-continues-to-power-premium-brand-dyson,Accessed 06/16/2015.
Kapferer, J.-N. (1995). Strategic brand management: new approaches to creating andevaluating brand equity. London: Kogan Page, for Les Editions d'Organisation.
Kapferer, J.-N. (2012). The new strategic brand management advanced insights andstrategic thinking. London; Philadelphia: Kogan Page.
Karjalainen, T.-M. (2006). Semantic transformation in design: communicatingstrategic brand identity trough product design references. Helsinki: Universityof Art and Design.
91
Karjalainen, T.-M. (2007). It Looks Like a Toyota: Educational Approaches to Designfor Visual Brand Recognition. InternationalJournal of Design, 1(1), 67-81.
Karjalainen, T.-M., & Snelders, D. (2010). Designing Visual Recognition for the Brand.Journal of Product Innovation Management, 27(1), 6-22.
Keller, K. L., & Aaker, D. A. (1992). The effects of corporate images and brandingstrategies on new product evaluations. Stanford Graduate School of Business,Stanford University.
Keller, K. L., Aperia, T., & Georgson, M. (2012). Strategic brand management: aEuropean perspective. Harlow, England: New York: Financial Times/PrenticeHall.
Lidwell, W., Holden, K., & Butler, J. (2010). Universal principles of design: 125 ways toenhance usability, influence perception, increase appeal, make better designdecisions, and teach through design. Kindle Edition: Creative PublishingInternational.
Loewy, R. (1951). The seminal work on MAYA is Never Leave Well Enough Alone. TheJohn Hopkins University Press.
Macomber, B., & Yang, M. (2011). The role of sketch finish and style in userresponses to early stage design concepts. Proceedings of the ASME IDETC/CIEDesign Engineering Technical Conference, 9, 567-576.
MediaWArkL.t. RotAmmsuAr, (RLtLJULc1L VacUUMSJ. ReLrieveu 11Mhttp://www.mediamarkt.se/mcs/productlist/_Robotdammsugare,90952,510752.html?langld=-16, Accessed 03/16/2015.
Miaoulis, G., & D'Amato, N. (1978). Consumer Confusion & Trademark Infringement.Jmarketing Journal of Marketing, 42(2), 48-55.
Mollerup, P. (1997). Marks of excellence: the function and variety of trademarks.London: Phaidon Press.
Mon6, R. (1997). Design for product understanding: the aesthetics of design from asemiotic approach (Knight, M. Trans.). Stockholm: Liber.
Mooy, S. C., & Robben, H. S.. (2002). Managing consumers' product evaluationsthrough direct product experience.Journal of Product and BrandManagement, 11(7), 432-446.
MSG. Management Study Guide. Retrieved fromhttp://www.managementstudyguide.com/attitude-scales.htm, Accessed12/21/2015.
92
Oppenheimer, A. (2005). From Experience: Products Talking to People-Conversation Closes the Gap between Products and Consumers. JPIMJournalof Product Innovation Management, 22(1), 82-91.
Person, 0., Snelders, D., Karjalainen, T.-M., & Schoormans, J. (2007). Complementingintuition: insights on styling as a strategic tool.Journal of MarketingManagement, 23(9-10), 901-916.
Person, 0., Schoormans, J., Snelders, D., & Karjalainen, T.-M. (2008). Should newproducts look similar or different? The influence of the marketenvironment on strategic product styling. Design Studies, 29(1), 30-48
Pitta, D. A., & Katsanis, L. P. (1995). Understanding brand equity for successful brandextension. Journal of Consumer Marketing, 12(4), 51.
Poetz, M. K., & Schreier, M. (2012). The Value of Crowdsourcing: Can Users ReallyCompete with Professionals in Generating New Product Ideas? JPIMJournalof Product Innovation Management, 29(2), 245-256.
Ranscombe, C., Hicks, B., & Mullineux, G. (2012). A method for exploring similaritiesand visual references to brand in the appearance of mature mass-marketproducts. Design Studies, 33(5), 496-520.
Red Dot. Red Dot Design Awards, Retrieved from http://en.red-dot.org/3214.html,Accessed 05/16/2015.
Schmitt, B., & Simonson, A. (1997). Marketing aesthetics: the strategic managementof brands, identity, and image. New York: Free Press.
Stompff, G. (2003). The forgotten bond: Brand identity and product design. DesignManagement Journal, 14, 26-32.
Tjalve, E. (1979). A Short course in industrial design. Newnes-Butterworth, London.
van Rysewyk, S. P., & Pontier, M. (2014) Machine Medical Ethics (Intelligent Systems,Control and Automation: Science and Engineering). 2015 edition. Switzerland:Springer International Publishing.
Warell, A. (2001). Design syntactics: afunctional approach to visual productform:theory, models, and methods. Product and Production Development,Engineering and Industrial Design, Chalmers University of Technology,Gothenburg.
93
Warell, A. (2004). Towards a Theory-Based Method for Evaluation of Visual FormSyntactics. TMCE, Tools and Methods for Competitive Engineering. Lausanne:Millspress.
Warell, A. (2006). Identity Recognition in Product Design: An Approach for DesignManagement. Proceedings of the 13th International Product DevelopmentManagement Conference, Milan.
Warell, A., & Nabo, M. (2002). Methodology Support for Form Design Developmentin Industrial Design Engineering. TMCE 2002, the 4th InternationalSymposium on Tools and Methods of Competitive Engineering, Wuhan.
Weernink, W. 0. (2001). Porsche Carrera GT expressive purity. AUTO AND DESIGN,(126), 31-38.
94
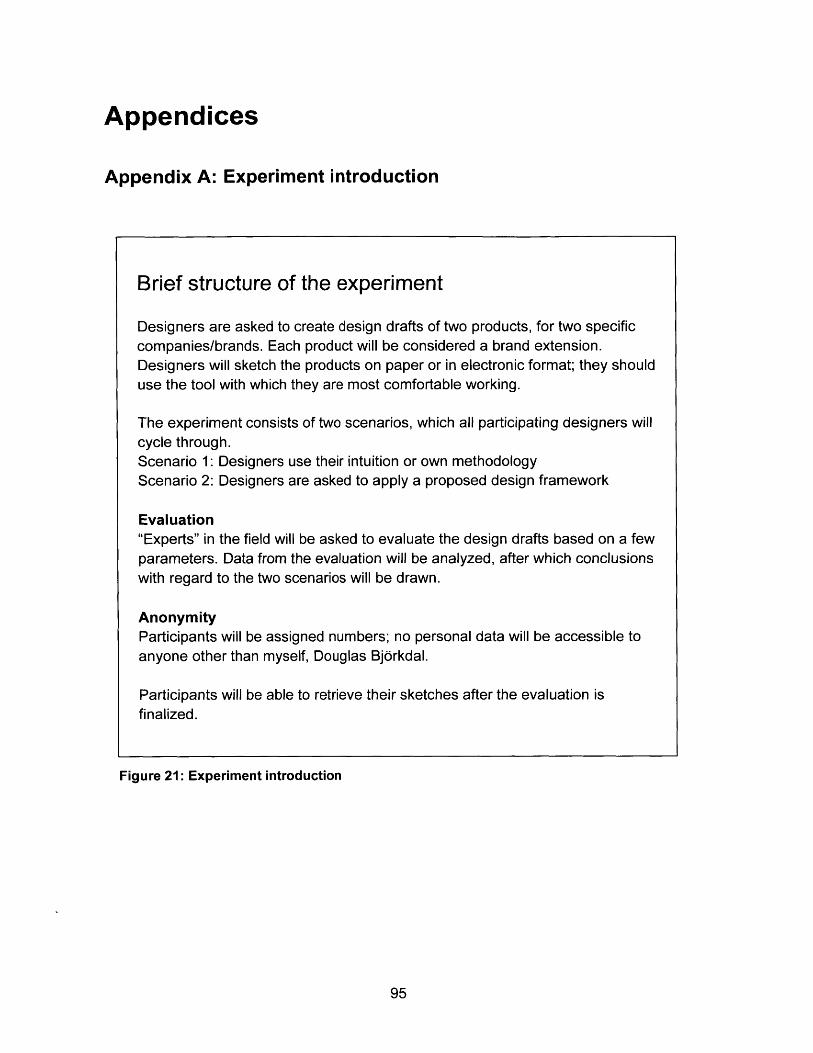
Appendices
Appendix A: Experiment introduction
Brief structure of the experiment
Designers are asked to create design drafts of two products, for two specificcompanies/brands. Each product will be considered a brand extension.Designers will sketch the products on paper or in electronic format; they shoulduse the tool with which they are most comfortable working.
The experiment consists of two scenarios, which all participating designers willcycle through.Scenario 1: Designers use their intuition or own methodologyScenario 2: Designers are asked to apply a proposed design framework
Evaluation"Experts" in the field will be asked to evaluate the design drafts based on a fewparameters. Data from the evaluation will be analyzed, after which conclusionswith regard to the two scenarios will be drawn.
AnonymityParticipants will be assigned numbers; no personal data will be accessible toanyone other than myself, Douglas Bj6rkdal.
Participants will be able to retrieve their sketches after the evaluation isfinalized.
Figure 21: Experiment introduction
95
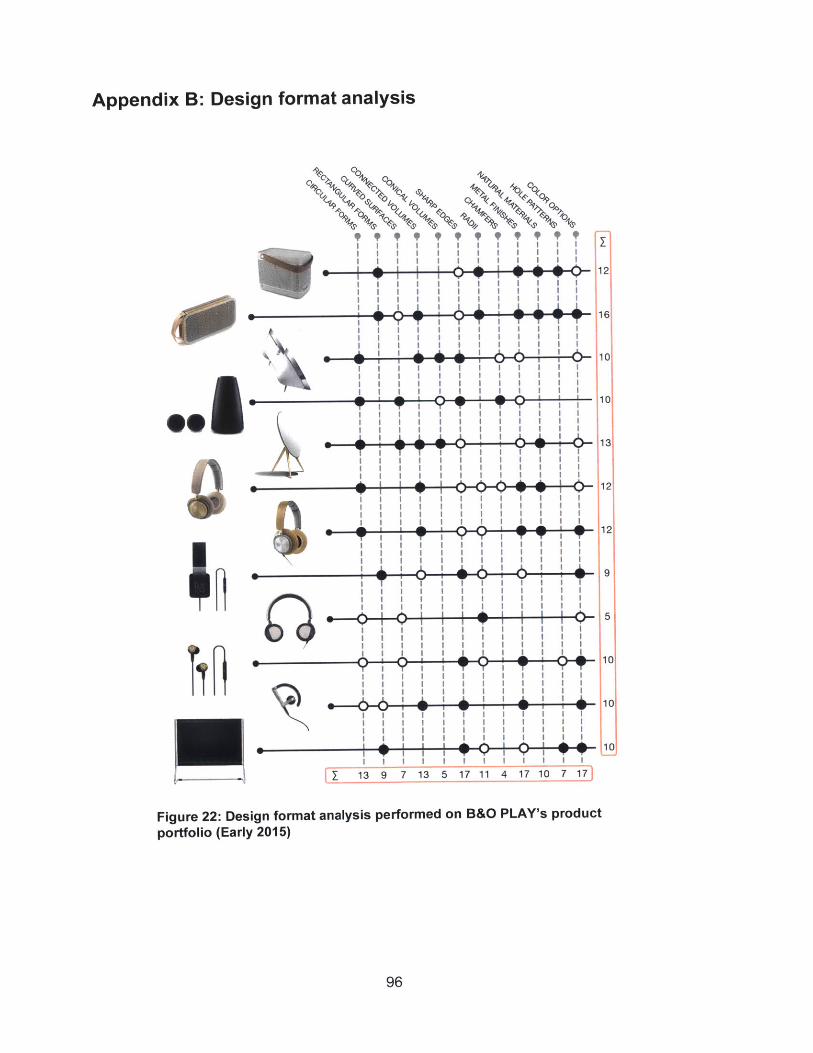
Appendix B: Design format analysis
0 12
.......... 1 6
V~12
T~, 9 9 T9T9T
I I I I I f I I I I I I
12
5
10
13 9 7 13 5 17 11 4 17 10 7 17
Figure 22: Design format analysis performed on B&O PLAY's product
portfolio (Early 2015)
96
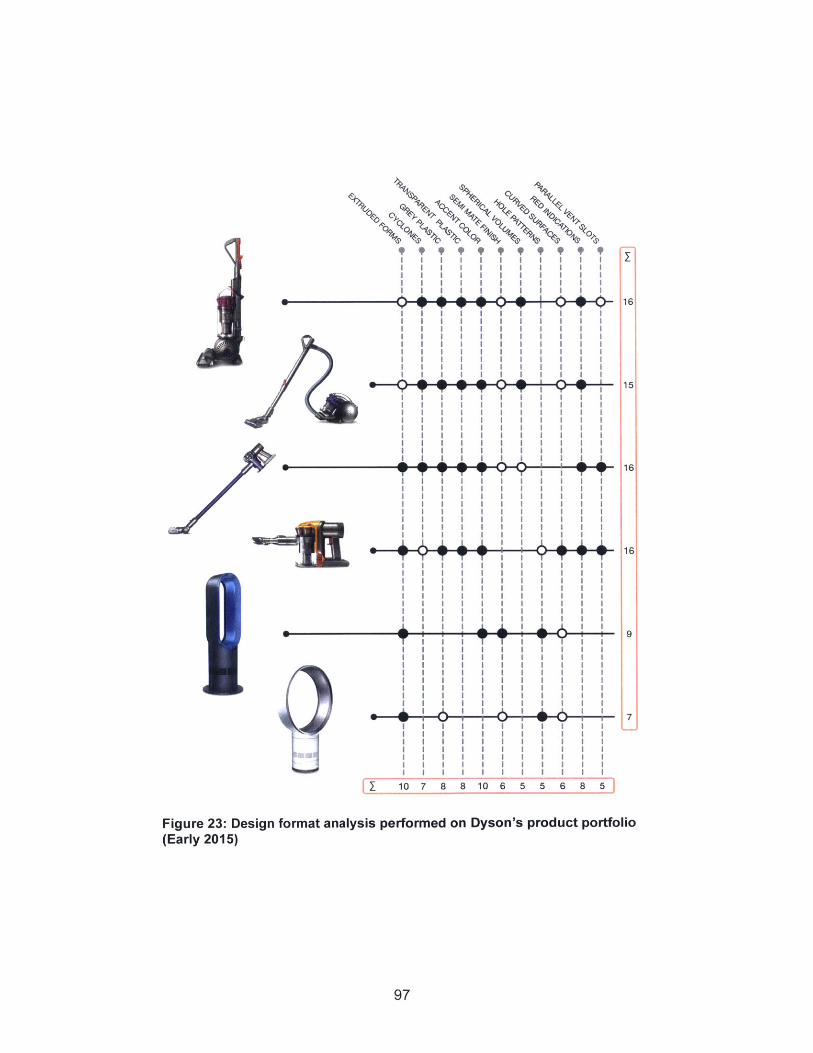
1 I I I I I I I I I I
p i iiUH 14- iI I I I I I I I I I II I I I I I I I I I II I I I I I I I I I I
I I I I I I I I I I Ii i i i i i i I Ii i i i i i i I Ii i i i i i i I Ii i i i i i i I I
I i i i i i i I I uuuiii iiiI I I I I I I I I I I
I I I I I I I I I I II I I I I I I I I I II I I I I I I I I I II I I I I I I I I I I
1I 7 I I 1I I I I I I
16
15
Figure 23: Design format analysis performed on Dyson's product portfolio(Early 2015)
97
I
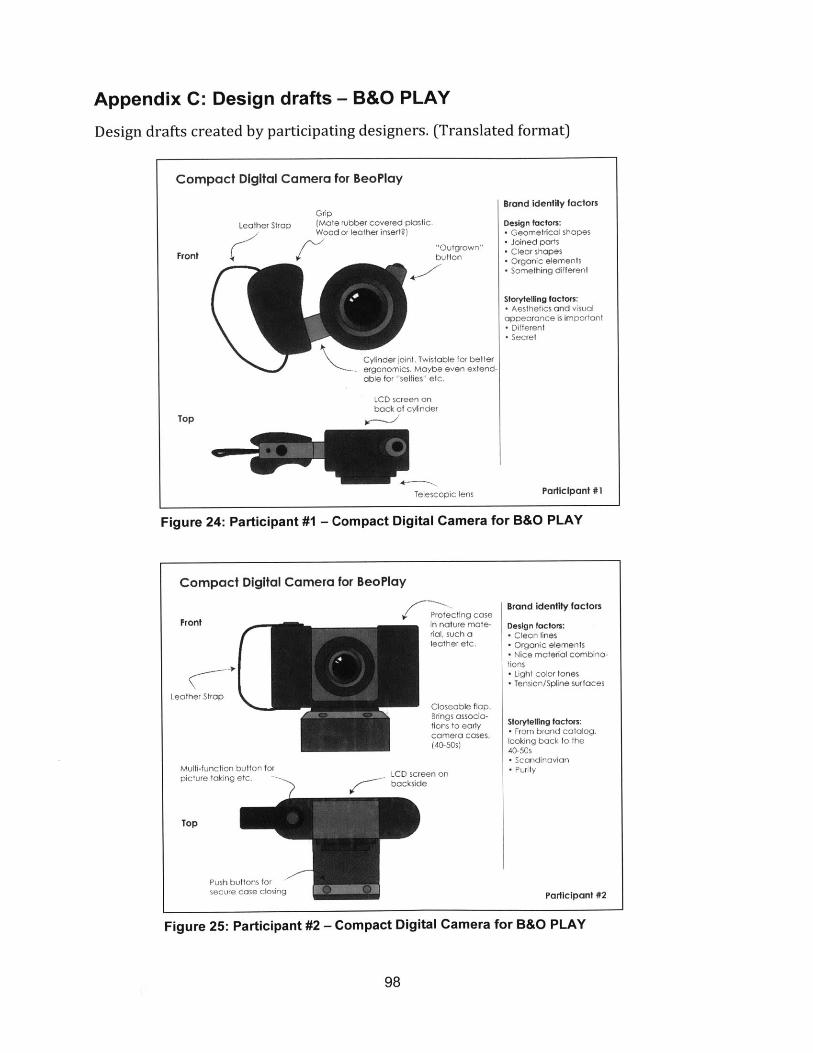
Appendix C: Design drafts - B&O PLAY
Design drafts created by participating designers. (Translated format)
I Compact Digital Camera for BeoPlay
Leather Strap
Front
Grip(Mate rubber covered plastic.Wood or leather insert?)
bOutgrown"button
Cylinder joint. Twistable for betterergonomics. Maybe even extend-able for "selfies" etc.
LCD screen onback of cylinder
Top
Telescopic lens
Brand identity factors
Design factors:- Geometrical shapes- Joined parts- Clear shapes- Organic elements- Something different
Storytelling factors:- Aesthetics and visualappearance is important" Different- Secret
Parficipant #1
Figure 24: Participant #1 - Compact Digital Camera for B&O PLAY
Compact Digital Camera for BeoPlay
Front
Leather Strap
Multi-function button forpicture taking etc. -
Top
Push buttons forsecure case closing
Protecting casein nature mate-rial, such aleather etc.
Closeable flap.Brings associa-tions to earlycamera cases,(40-50s)
LCD screen onbackside
Brand identity factors
Design factors:- Clean lines- Organic elements- Nice material combino-tions- Light color tones- Tension/Spline surfaces
Storytelling factors:* From brand catalog,looking back to the40-50s* Scandinavian* Purity
Participant #2
Figure 25: Participant #2 - Compact Digital Camera for B&O PLAY
98
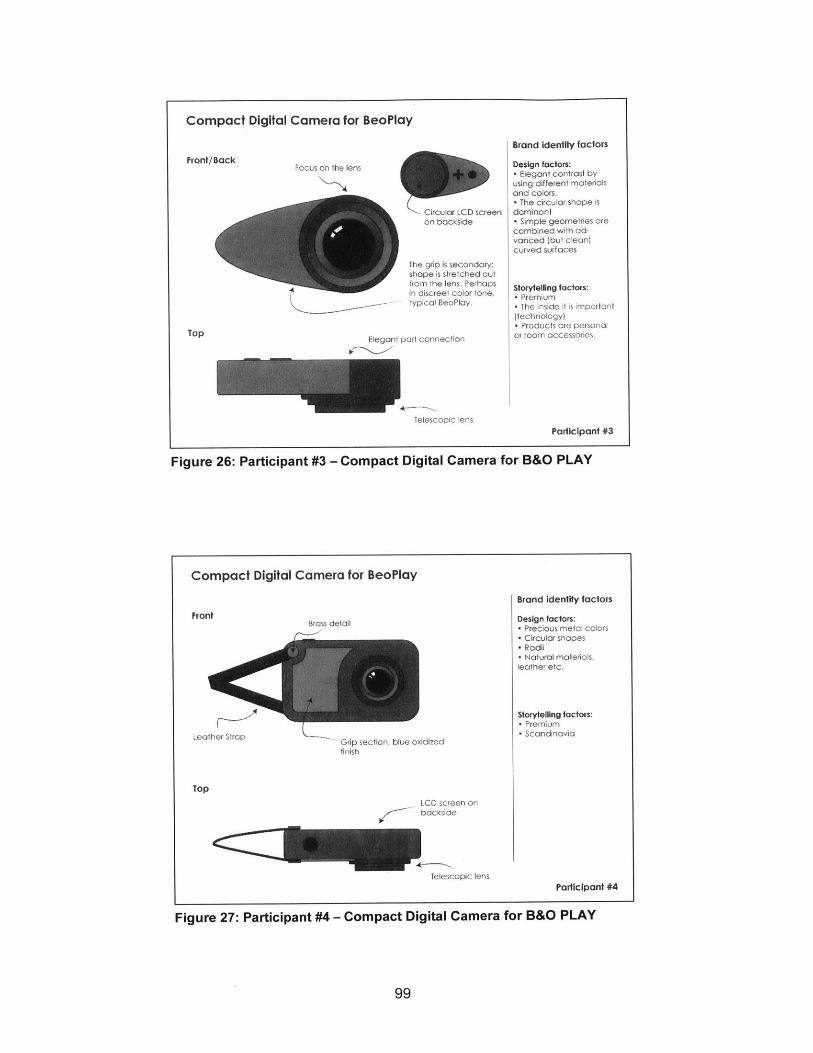
Compact Digital Camera for BeoPlay
Circular LCD screenon backside
The grip is secondary;shape is stretched outfron he lens Per hpsin discreet color tone,typical BeoPlay.
Elegant part connection
Telescopic lens
Brand identity factors
Design factors:- Elegant contrast byusing different materialsand colors.- The circular shape isdominant- Simple geometries arecombined with ad-vanced (but clean)curved surfaces
Storytelling factors:* Premium* The inside it is important(technology)- Products are personalor room accessories.
Participant #3
Figure 26: Participant #3 - Compact Digital Camera for B&O PLAY
Compact Digital Camera for BeoPlay
Brand identity factors
Front Brass detail Design factors:- Precious metal colors- Circular shapes- Radii- Natural materials,leather etc.
Storytelling factors:- Premium
Leather Strop Grip section, blue oxidized - Scandinavia
finish
TopLCD screen onbackside
Telescopic lensParticipant #4
Figure 27: Participant #4 - Compact Digital Camera for B&O PLAY
99
Front/BackFocus on the lens
Top
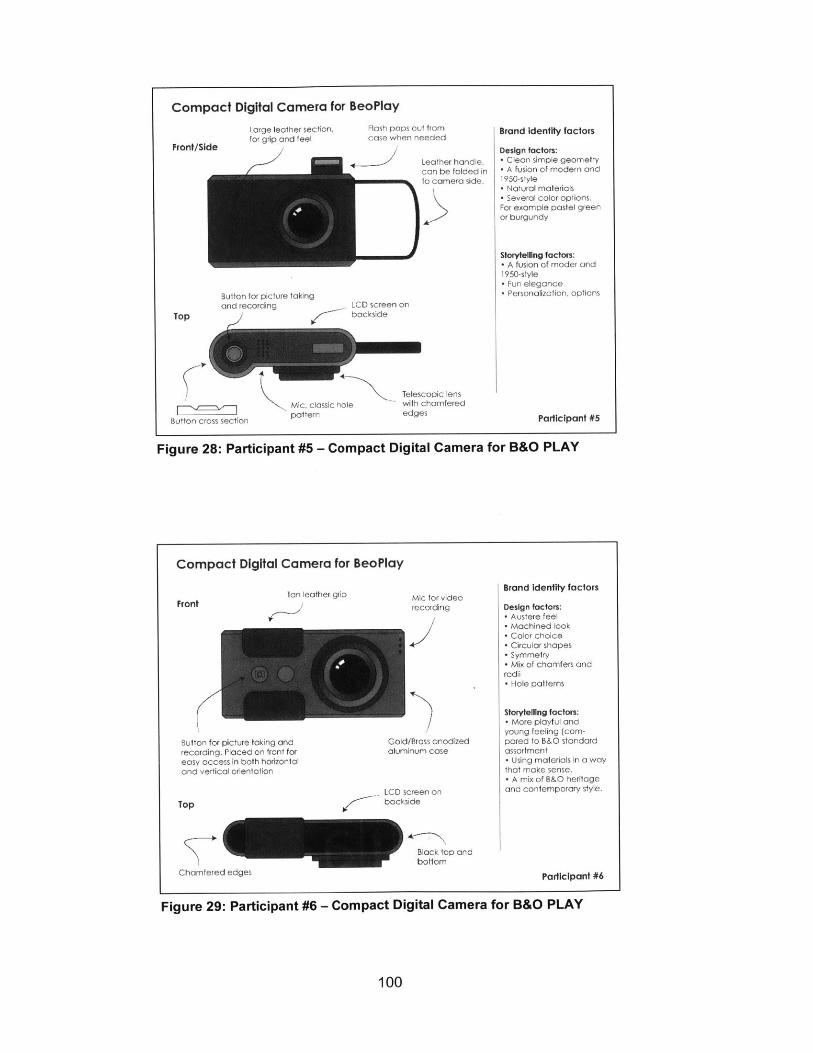
Compact Digital Camera for BeoPlay
Large leather section,for grip and feel
Button for picture takinand recording
Top
Button cross section
Flash pops out fhorncase when needed
Leather handle,can be folded into camera side.
gLCD screen onbackside
Mc, classic holepattern
Telescopic lenswith chamferededges
Brand identiy faCtorS
Design factors:- Clean simple geometry- A fusion of modern and1950-style- Natural materials- Several color options.For example pastel greenor burgundy
Storyteling factors:e A fusion of moder and1950-style* Fun elegance- Personalization, options
Participant #5
Figure 28: Participant #5 - Compact Digital Camera for B&O PLAY
Compact Digital Camera for BeoPlay
Tan leather gipFront
Button for picture taking andrecording. Placed on front foreasy access in both horizontaland vertical orientation
Top
Chamfered edges
Mic for videorecording
Gold/Bross anodizedaluminum case
LCD screen onbackside
Black top andbottom
Brand identity factors
Design factors:- Austere feel- Machined look- Color choice- Circular shapes- Symmetry- Mix of chomfers andradii- Hole patterns
Storytelling factors:* More playful andyoung feeling (com-pared to B&O standardassortment* Using materials in a waythat make sense.- A mix of B&O heritageand contemporary style.
Participant #6
Figure 29: Participant #6 - Compact Digital Camera for B&O PLAY
100
Front/Side
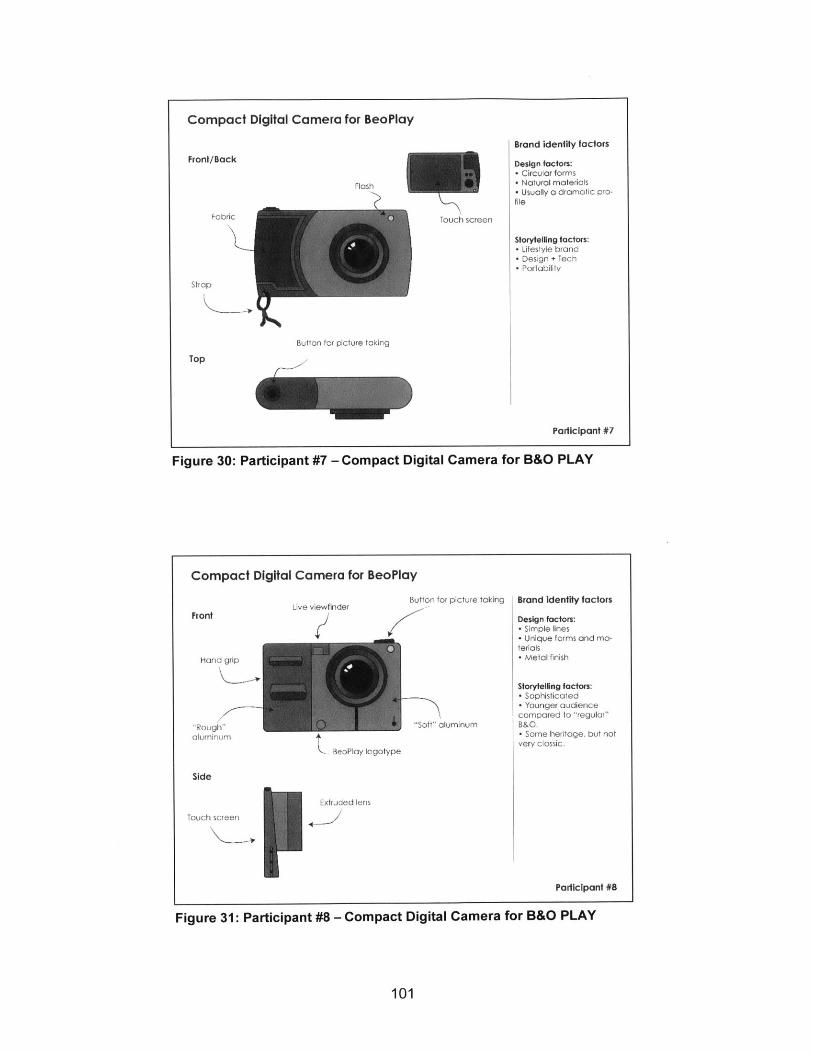
Compact Digital Camera for BeoPlay
Brand identity factors
Front/Back Design factors:- Circular forms
Flash - Natural materials- Usually a dramatic pro-file
Fabric Touch screen
Storytelling factors:- Lifestyle brand- Design + Tech" Portability
Strop
Button for picture toking
Top
Participant #7
Figure 30: Participant #7 - Compact Digital Camera for B&O PLAY
Compact Digital Camera for BeoPlay
Button for picture taking Brand identity factorsLive viewfinder
Front Design factors:- Simple lines- Unique forms and ma-terials
Hand grip * Metal finish
Storytellng factors:- Sophisticated- Younger audiencecompared to "regular"
"Roug " "Soft" aluminum B&O.aluminum * Some heritage, but not
very classic.BeoPlay logotype
Side
Extruded lensTouch screen
Participant #8
Figure 31: Participant #8 - Compact Digital Camera for B&O PLAY
101
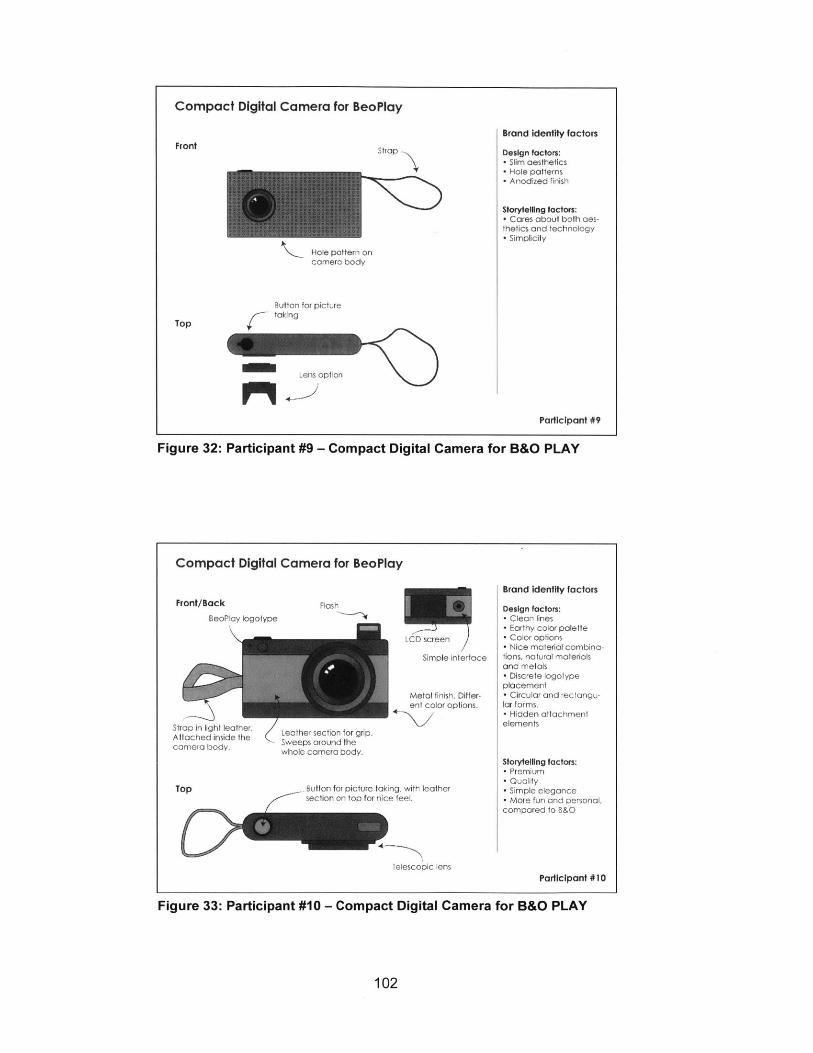
Compact Digital Camera for BeoPlay
Strap
Hole pattern oncamera body
Lens option
Brand identity factors
Design factors:- Slim oesthetics- Hole patterns- Anodized finish
Storytelling factors:- Cares about both aes-thetics and technologye Simplicity
I Participant #9
Figure 32: Participant #9 - Compact Digital Camera for B&O PLAY
Compact Digital Camera for BeoPlay
Front/BackBeoPlay log
Strap in light leather.Attached inside thecamera body.
Top
Flashotype
LCD screen
Simple interface
Metal finish. Differ-ent color options.
Leather section for grip.Sweeps around thewhole camera body.
-Button for picture taking, with leathersection on top for nice feel.
Telescopic lens
Brand identity factors
Design factors:- Clean lines- Earthy color palette" Color options" Nice material combino-tions, natural materialsand metals- Discrete logotypeplacement- Circular and rectangu-lar forms.- Hidden attachmentelements
Storytelling factors:" Premiume Quality- Simple elegance- More fun and personal,compared to B&O
Participant #10
Figure 33: Participant #10 - Compact Digital Camera for B&O PLAY
102
Front
Top
Button for picturetaking
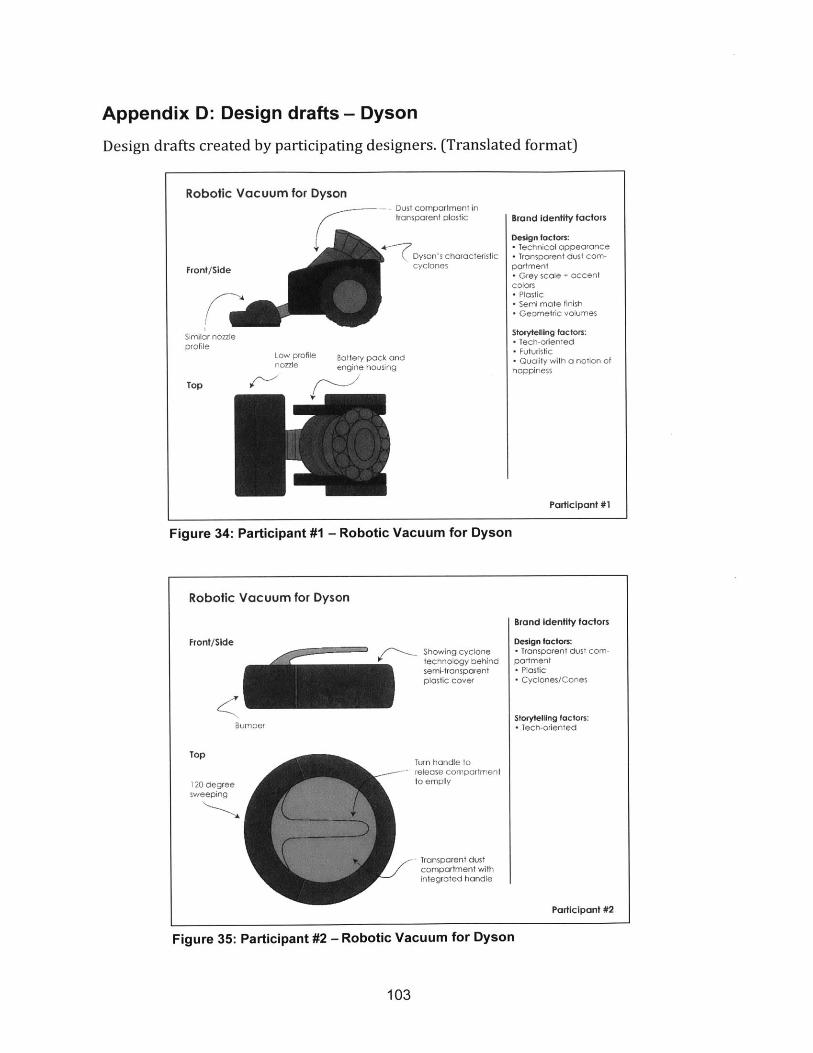
Appendix D: Design drafts - Dyson
Design drafts created by participating designers. (Translated format)
Robotic Vacuum for Dyson
Front/Side
Similar nozzleprofile
Low profilenozzle
Top
Dust compartment intransparent plastic
Dyson's characteristiccyclones
Battery pack andengine housing
Brand identity factors
Design factors:- Technical appearance" Transparent dust com-partment- Grey scale + accentcolors" Plastic- Semi mate finish- Geometric volumes
Storytelling factors:- Tech-oriented" Futuristic" Quality with a notion ofhappiness
Participant #1
Figure 34: Participant #1 - Robotic Vacuum for Dyson
Robotic Vacuum for Dyson
Brand identity factors
Front/Side Design factors:Showing cyclone - Transparent dust com-technology behind partmentsemi-transparent - Plasticplastic cover - Cyclones/Cones
Storytelling factors:Bumper T lech-oriented
TopTurn handle torelease compartment
120 degree to emplysweeping
- Transparent dustcompartment withintegrated handle
Participant #2
Figure 35: Participant #2 - Robotic Vacuum for Dyson
103
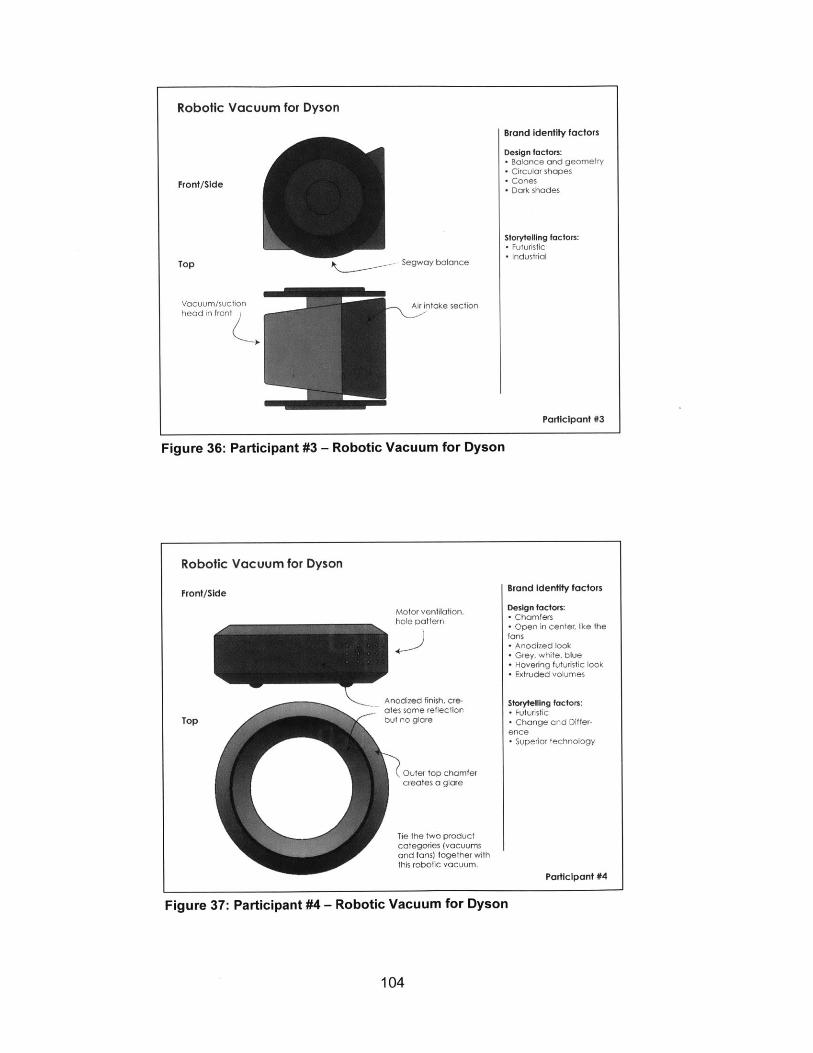
Robotic Vacuum for Dyson
Brand identity factors
Design factors:- Balance and geometry" Circular shapes
Front/Side - Cones*Dark shades
Storytelling factors:- Futuristic
Top Segway balance - Industrial
Vacuum/suction Air intake sectionhead in front
Participant #3
Figure 36: Participant #3 - Robotic Vacuum for Dyson
Robotic Vacuum for Dyson
Front/Side
Top
Motor ventifatian.
Motor ventilation,hole pattern
Anodized finish, cre-ates some reflectionbut no glare
Outei top chamfercreates a glare
Tie the two productcategories (vacuumsand fans) together withthis robotic vacuum.
Brand Identity factors
Design factors:- Chamfers- Open in center, like thefans" Anodized look" Grey, white, blue* Hovering futuristic look- Extruded volumes
Storytelling factors:" Futuristic" Change and Differ-ence- Superior technology
Participant #4
Figure 37: Participant #4 - Robotic Vacuum for Dyson
104
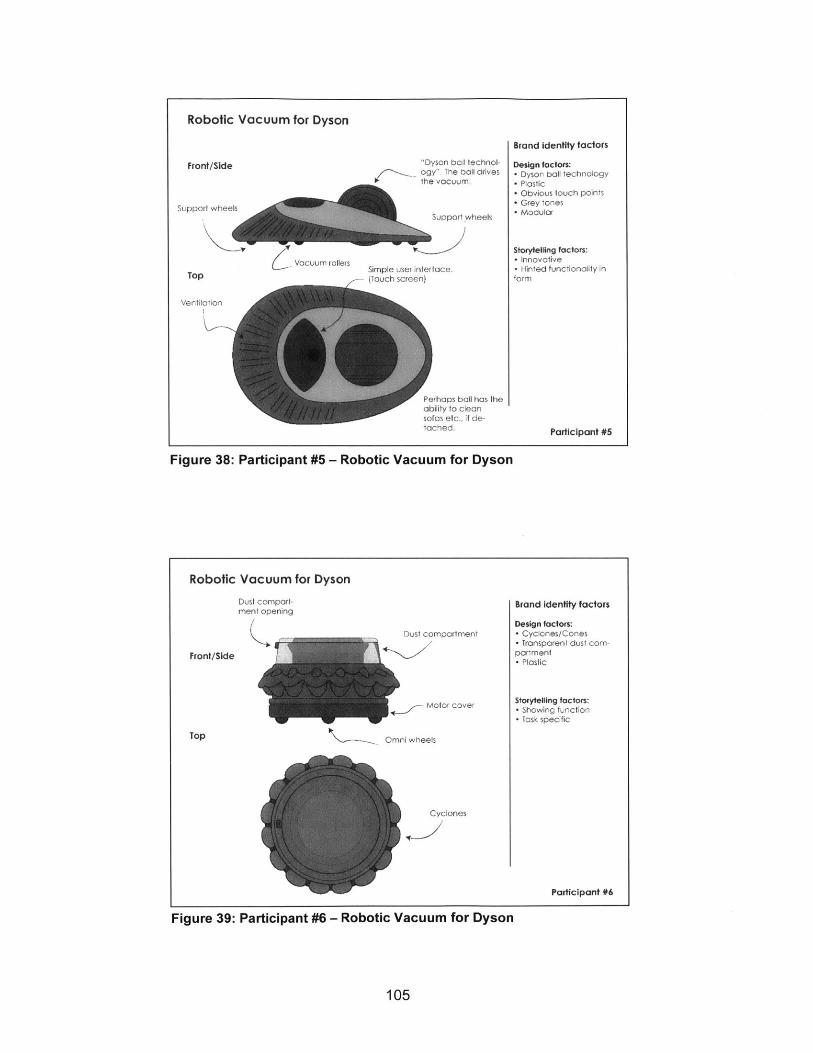
Robotic Vacuum for Dyson
"Dyson boll technol-ogy". The ball drivesthe vacuum.
Support wheels
Simple user interface.(Touch screen)
Perhaps ball has theability to cleansofas etc., if de-tached.
Brand Identity factors
Design factors:" Dyson ball technology- Plastic" Obvious touch points" Grey tones" Modular
Storytelling factors:" Innovative" Hinted functionality inform
Participant #5
Figure 38: Participant #5 - Robotic Vacuum for Dyson
Robotic Vacuum for Dyson
Dust comport-ment opening
Dust compartment
I Motor cover
Omni wheels
Cyclones
Brand identity factors
Design factors:- Cyclones/Cones- Transparent dust com-partment- Plastic
Storytelling factors:* Showing function- Task specific
Participant #6
Figure 39: Participant #6 - Robotic Vacuum for Dyson
105
Front/Side
Support wheels
Top
Ventilation
Vacuum rollers
Front/Side
Top
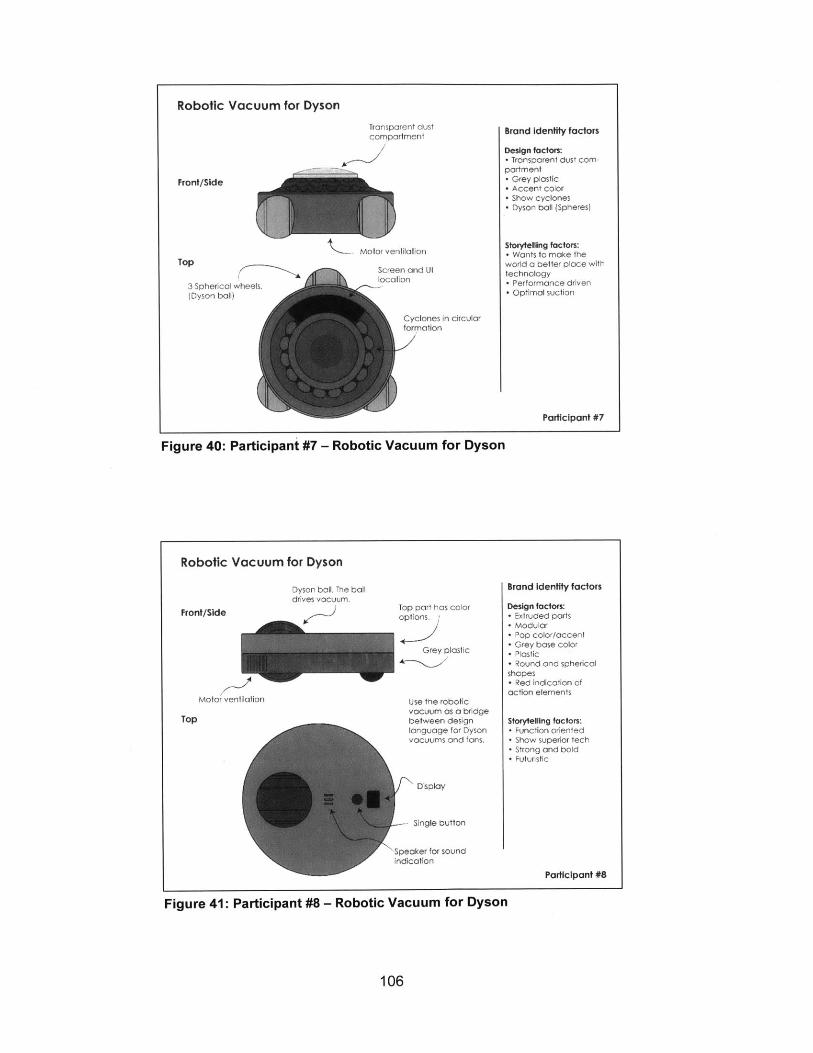
Robotic Vacuum for Dyson
Transparent dustcompartment
Front/Side
Top
3 Spherical wheels.(Dyson ball)
Motor ventilation
Screen and Utlocalion
Cyclones in circularformation
Brand identity factors
Design factors:- Transparent dust com-portment" Grey plostic" Accent color" Show cyclones* Dyson ball (Spheres)
Storytelling factors:- Wants to make theworld a better place withtechnology" Performance driven- Optimal suction
Participant #7
Figure 40: Participant #7 - Robotic Vacuum for Dyson
Robotic Vacuum for Dyson
Dyson boll. The balldrives vacuum.
Front/Side
Motor ventilation
Top
Top part has coloroptions.
Grey plastic
Use the roboticvacuum as a bridgebetween designlanguage for Dysonvacuums and fans.
Display
Single button
-Speaker for soundindication
Brand Identity factors
Design factors:" Extruded parts- Modular" Pop color/accent" Grey base color- Plastic- Round and sphericalshapes- Red indication ofaction elements
Storytelling factors:- Function oriented" Show superior tech- Strong and bold" Futuristic
Participant #8
Figure 41: Participant #8 - Robotic Vacuum for Dyson
106
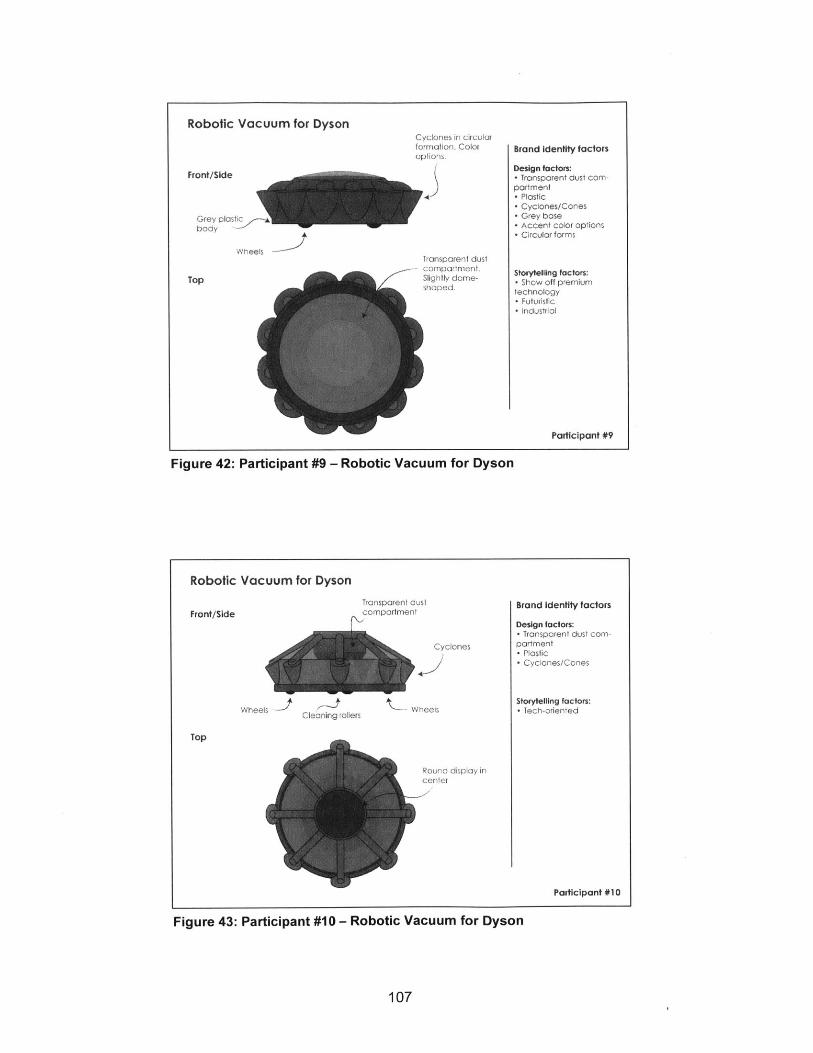
Robotic Vacuum for Dyson
Front/Side
Grey plasticbody
Wheels
Top
Cyclones in circularformation. Coloroptions.
Transparent dust-compartment.
Slightly dome-shaped.
Brand identity factors
Design factors:- Transparent dust com-portment" Plastic- Cyclones/Cones- Grey base- Accent color options" Circular forms
Storytelling factors:- Show oft premiumtechnology" Futuristic* Industrial
Participant #9
Figure 42: Participant #9 - Robotic Vacuum for Dyson
Robotic Vacuum for Dyson
Transparent dustcomportmentFront/Side
Cyclones
Wheels *-~ Cleaning rollers
Top
Wheels
Round display incenter
Brand Identity factors
Design factors:- Transparent dust com-partment* Plastic- Cyclones/Cones
Storytelling factors:- Tech-oriented
Participant #10
Figure 43: Participant #10 - Robotic Vacuum for Dyson
107
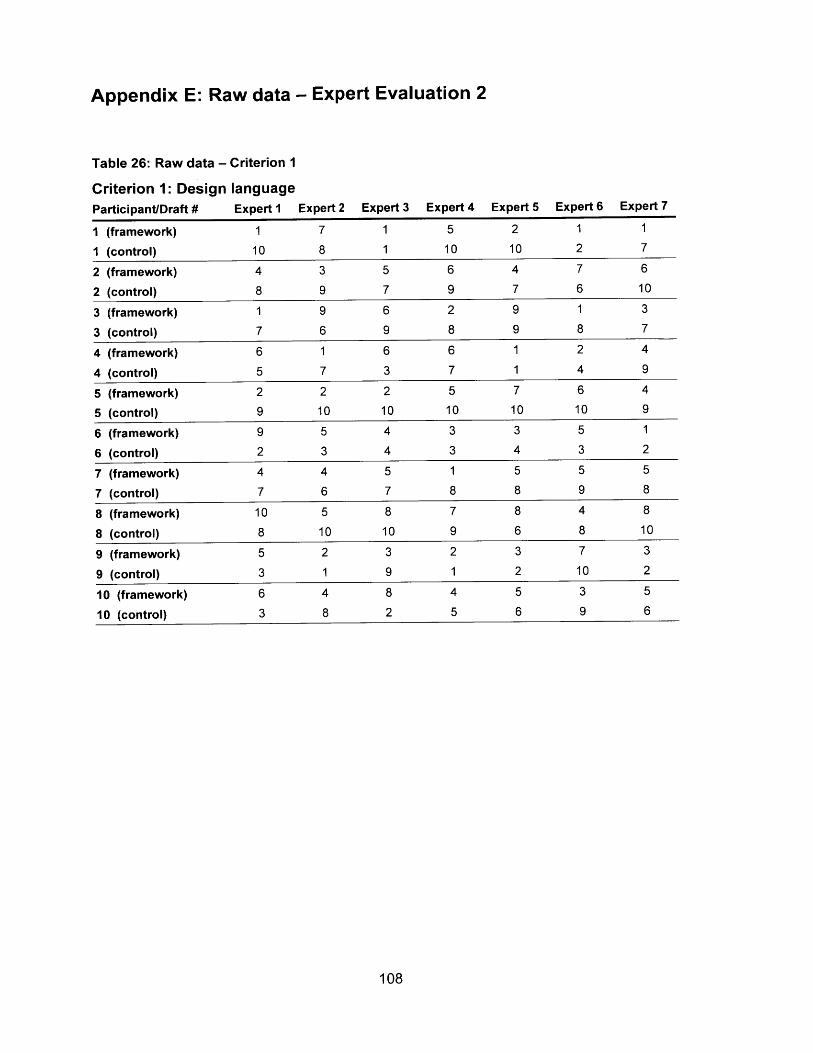
Appendix E: Raw data - Expert Evaluation 2
Table 26: Raw data - Criterion 1
Criterion 1: Design languageParticipant/Draft # Expert 1 Expert 2 Expert 3 Expert 4 Expert 5 Expert 6 Expert 7
1 (framework) 1 7 1 5 2 1 1
1 (control) 10 8 1 10 10 2 7
2 (framework) 4 3 5 6 4 7 6
2 (control) 8 9 7 9 7 6 10
3 (framework) 1 9 6 2 9 1 3
3 (control) 7 6 9 8 9 8 7
4 (framework) 6 1 6 6 1 2 4
4 (control) 5 7 3 7 1 4 9
5 (framework) 2 2 2 5 7 6 4
5 (control) 9 10 10 10 10 10 9
6 (framework) 9 5 4 3 3 5 1
6 (control) 2 3 4 3 4 3 2
7 (framework) 4 4 5 1 5 5 5
7 (control) 7 6 7 8 8 9 8
8 (framework) 10 5 8 7 8 4 8
8 (control) 8 10 10 9 6 8 10
9 (framework) 5 2 3 2 3 7 3
9 (control) 3 1 9 1 2 10 2
10 (framework) 6 4 8 4 5 3 5
10 (control) 3 8 2 5 6 9 6
108
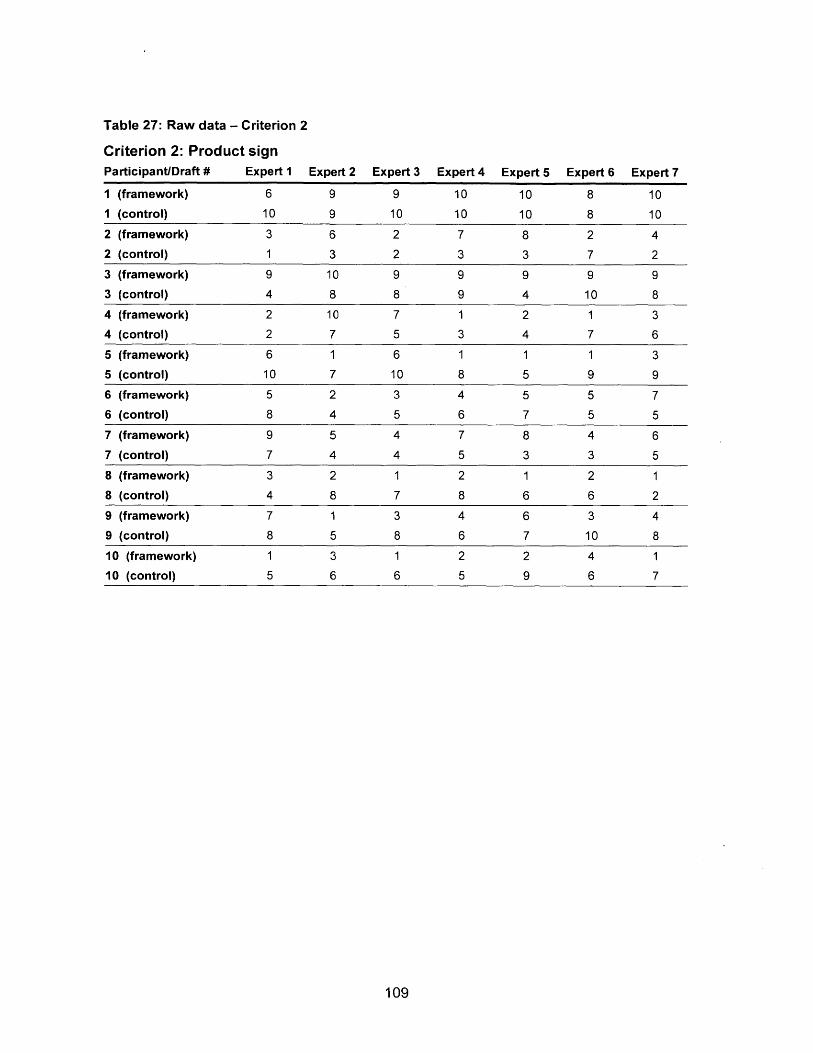
Table 27: Raw data - Criterion 2
Criterion 2: Product signParticipant/Draft # Expert 1 Expert 2 Expert 3 Expert 4 Expert 5 Expert 6 Expert 7
1 (framework) 6 9 9 10 10 8 101 (control) 10 9 10 10 10 8 10
2 (framework) 3 6 2 7 8 2 42 (control) 1 3 2 3 3 7 2
3 (framework) 9 10 9 9 9 9 9
3 (control) 4 8 8 9 4 10 8
4 (framework) 2 10 7 1 2 1 34 (control) 2 7 5 3 4 7 6
5 (framework) 6 1 6 1 1 1 35 (control) 10 7 10 8 5 9 96 (framework) 5 2 3 4 5 5 76 (control) 8 4 5 6 7 5 57 (framework) 9 5 4 7 8 4 67 (control) 7 4 4 5 3 3 58 (framework) 3 2 1 2 1 2 18 (control) 4 8 7 8 6 6 2
9 (framework) 7 1 3 4 6 3 49 (control) 8 5 8 6 7 10 8
10 (framework) 1 3 1 2 2 4 1
10 (control) 5 6 6 5 9 6 7
109
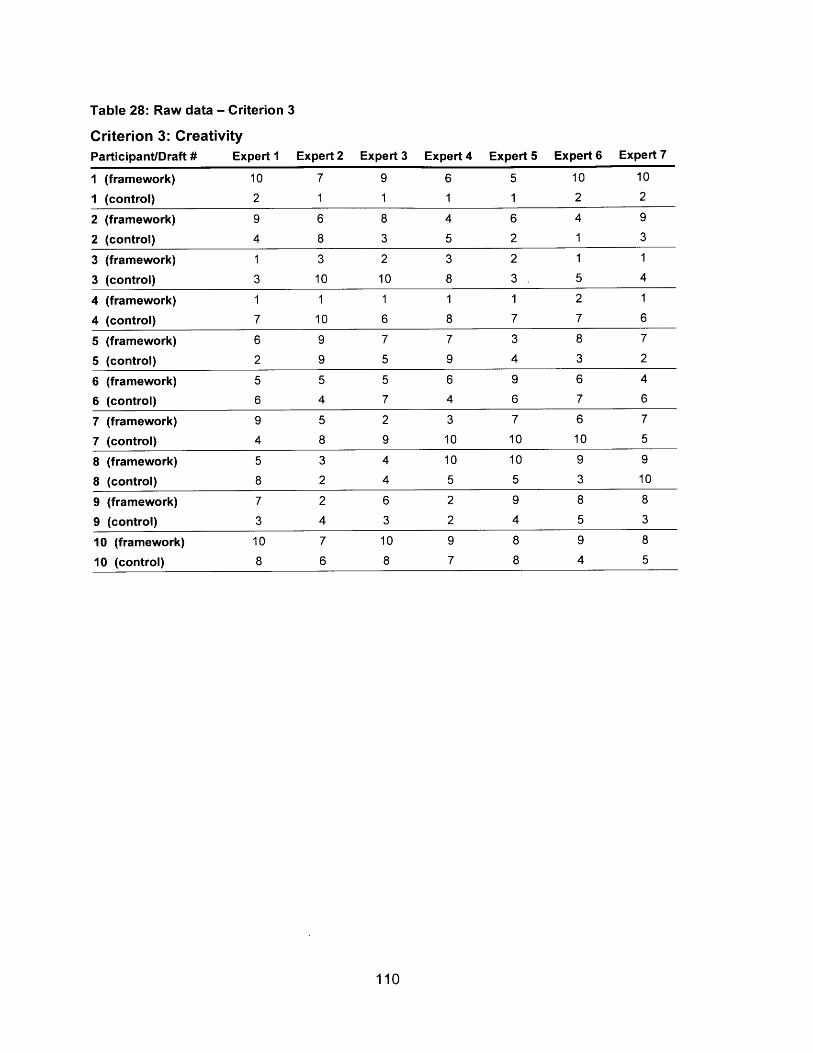
Table 28: Raw data - Criterion 3
Criterion 3: CreativityParticipant/Draft # Expert 1 Expert 2 Expert 3 Expert 4 Expert 5 Expert 6 Expert 7
1 (framework) 10 7 9 6 5 10 10
1 (control) 2 1 1 1 1 2 2
2 (framework) 9 6 8 4 6 4 9
2 (control) 4 8 3 5 2 1 3
3 (framework) 1 3 2 3 2 1 1
3 (control) 3 10 10 8 3 5 4
4 (framework) 1 1 1 1 1 2 1
4 (control) 7 10 6 8 7 7 6
5 (framework) 6 9 7 7 3 8 7
5 (control) 2 9 5 9 4 3 2
6 (framework) 5 5 5 6 9 6 4
6 (control) 6 4 7 4 6 7 6
7 (framework) 9 5 2 3 7 6 7
7 (control) 4 8 9 10 10 10 5
8 (framework) 5 3 4 10 10 9 9
8 (control) 8 2 4 5 5 3 10
9 (framework) 7 2 6 2 9 8 8
9 (control) 3 4 3 2 4 5 3
10 (framework) 10 7 10 9 8 9 8
10 (control) 8 6 8 7 8 4 5
110
This page intentionally left blank
111