a financially sustainable power sector: developing ......a financially sustainable power sector:...
TRANSCRIPT
A Financially Sustainable Power Sector: Developing assessment methodologies Tu Chi Nguyen, Richard Bridle and Peter Wooders
March 2014
IISD
REP
ORT
www.iisd.org © 2014 The International Institute for Sustainable Development
RESEARCH REPORT MARCH 2014A Financially Sustainable Power Sector: Developing assessment methodologies iiii
© 2014 The International Institute for Sustainable DevelopmentPublished by the International Institute for Sustainable Development.
About IISDThe International Institute for Sustainable Development (IISD) contributes to sustainable development by advancing policy recommendations on international trade and investment, economic policy, climate change and energy, and management of natural and social capital, as well as the enabling role of communication technologies in these areas. We report on international negotiations and disseminate knowledge gained through collaborative projects, resulting in more rigorous research, capacity building in developing countries, better networks spanning the North and the South, and better global connections among researchers, practitioners, citizens and policy-makers.
IISD’s vision is better living for all—sustainably; its mission is to champion innovation, enabling societies to live sustainably. IISD is registered as a charitable organization in Canada and has 501(c)(3) status in the United States. IISD receives core operating support from the Government of Canada, provided through the International Development Research Centre (IDRC), from the Danish Ministry of Foreign Affairs and from the Province of Manitoba. The Institute receives project funding from numerous governments inside and outside Canada, United Nations agencies, foundations and the private sector.
Head Office161 Portage Avenue East, 6th Floor, Winnipeg, Manitoba, Canada R3B 0Y4 Tel: +1 (204) 958-7700 | Fax: +1 (204) 958-7710 | Website: www.iisd.org Geneva Office International Environment House 2, 9 chemin de Balexert, 1219 Châtelaine, Geneva, Switzerland Tel: +41 22 917-8373 | Fax: +41 22 917-8054
A Financially Sustainable Power Sector: Developing assessment methodologies March 2014
Prepared by Tu Chi Nguyen, Richard Bridle and Peter Wooders.
RESEARCH REPORT MARCH 2014A Financially Sustainable Power Sector: Developing assessment methodologies iii
Table of ContentsIntroduction .........................................................................................................................................................................................................1
1.0 Cost Recovery ............................................................................................................................................................................................4
2.0 bility to Reliably Meet Demand ...................................................................................................................................................... 10
3.0 Ability to Make Investments .............................................................................................................................................................. 14
4.0 Ability to Operate According to Social and Environmental Norms ....................................................................................... 16
5.0 Implications for Policy-Making .......................................................................................................................................................... 24
References .........................................................................................................................................................................................................25
Annex A. Summary of Indicators ..............................................................................................................................................................27
Annex B. Summary of Available Data across Regions and Income Groups ............................................................................... 31
Figure 1. Indicators of Power Sector Financial Viability ........................................................................................................................3
Figure 2. Power Costs in Select African Countries (U.S. cents/kWh)............................................................................................5
Figure 3. Electricity Transmission and Distribution Losses as Share of Total Supply in 2010 ................................................6
Figure 4. Overview of Electricity Tariffs for G-20 and Next-11 Countries in 2010 ......................................................................7
Figure 5. Pre-tax Subsidies for Electricity as Percentage of GDP in 2011 .......................................................................................8
Figure 6. Ratio of Installed Capacity to Demand and Capacity Factor 2009............................................................................. 10
Figure 7. Power Intensity and GDP per capita in 2010 ........................................................................................................................ 11
Figure 8. Net Electricity Imports as Share of Total Electricity Use in 2010 ................................................................................. 12
Figure 9. Number and Value of Outages (latest available year) ..................................................................................................... 13
Figure 10. Installed Capacity Annual Growth and Capacity vs. Demand Growth 2005–2009 .......................................... 14
Figure 11. Access to Electricity .................................................................................................................................................................... 17
Figure 12. Share of Electricity Expenditure in Household Budget ................................................................................................... 18
Figure 13. Share of Average Urban Household Budget Required to Purchase Subsistence Amounts of Piped Water and Electricity .................................................................................................................................................................. 19
Figure 14. Electricity Generation from Fossil Fuels (Oil, Gas, and Coal) and Renewables in 2010 ..................................... 21
Figure 15. Renewable Power Capacity in 2009 ....................................................................................................................................22
Figure 16. Emissions Factor in 2010 .........................................................................................................................................................23
List of Figures
List of TablesTable 1. Costs and Affordability of Consuming 50 KWh per Month ...........................................................................................20
Table 2. Indicators of Power Sector Financial Viability and Data Sources ...................................................................................27
Table 3. Summary of Indicator’s World and Regional Averages ..................................................................................................... 31
Table 4. Summary of Indicator’s Averages across Income Groups ...............................................................................................32
RESEARCH REPORT MARCH 2014A Financially Sustainable Power Sector: Developing assessment methodologies 1
IntroductionThe power sector is a key driver of any economy: it is not only a major contributor of gross domestic product (GDP), but also provides key inputs for most industries and supplies the basic needs for the residential sector. To fulfill these functions, the sector must be financially sustainable. This paper explores the concept of financial sustainability and proposes a framework to analyze electricity sectors based on this concept. Financial sustainability, as defined here, includes assessment of factors that directly present a cost—such as pricing electricity below the cost of production—in addition to those which may lead to additional costs in the future, such as an inability to make investments to respond to changes in demand.
This paper aims to provide a methodology to assess the financial performance of the electricity sector to identify challenges and examples of good practice which influence the ability of the sector to meet the needs and expectations of consumers. This assessment will highlight areas where reform is needed and allow comparison across countries. The absence of a financially sustainable sector in a country indicates that the power sector may not be able to meet the needs of the economy and thus may impose a burden on society, especially the government budget. Financial sustainability is also one aspect that influences the performance and impact of the sector, together with other factors such as governance (institutions), endowment (resources), and market concentration.
The methodology outlined in this paper is useful for many purposes, including the ability: (i) to benchmark the performance of one country against that of others to help countries develop priorities for reform if necessary; (ii) to highlight how an unsustainable sector could result from unfavourable arrangements resulting from historical conditions, or political and economic constraints (e.g., keeping electricity tariffs below the cost of supply, leading the system to accumulate losses); and (iii) to provide an analysis that highlights potential challenges by considering factors that may not currently have a financial cost but may lead to future costs.
This analytical framework consists of multiple indicators reflecting different aspects of the sector, from effectiveness and efficiency to technical sufficiency and coverage, all of which are critical to assess the ability of the sector (and the country), to finance its operations and investments. The analysis is designed to initiate a discussion on electricity performance and possible reform priorities. Assessments based on this methodology should select these or other indicators depending on local circumstances (areas of interest, data availability, etc.) as well as the segments of the supply chain in focus (generation, transmission, or distribution). The taxonomy that the framework introduces would also allow for cross-time and cross-country comparisons. Tracking these indicators systematically and consistently would guide policy-makers to resolve any shortcomings undermining the sector’s viability and promote good decision making.
There have been few efforts to capture the financial health of the power sector. Empirical studies tend to focus on the performance of the power sector in the context of reforms and use narrow measures of performance to estimate whether reform has improved the situation of the sector (Foster, 2000; Jamasb, 2005; Wamukonya, 2003). Ebinger (2006) looked at the performance of one sector (infrastructure) through the lenses of “hidden costs,” i.e., the burden on the government to cover a sector’s inefficiency. Tallapragada et al. (2009) developed a performance-benchmarking approach to assess the impact of reforms and motivate management to achieve better outcomes. The World Bank (2011) built a taxonomy of different market structures that can be used to identify the most viable system depending on the country’s context, but the performance indicators are also limited.

RESEARCH REPORT MARCH 2014A Financially Sustainable Power Sector: Developing assessment methodologies 2
This paper builds upon the existing literature and the accumulation of research by the International Institute for Sustainable Development’s (IISD’s) Global Subsidies Initiative (GSI)1 in its ongoing research program on fossil fuel subsidies. In developing this framework, GSI aims to provide operational guidance on assessing the power sector financial viability based on relevant criteria and in a broader context. The paper has two components. The first is a set of indicators to capture the financial performance of the power sector. The second is the presentation of the values of these indicators for some countries, where data are available, to illustrate the variance of the financial status of the power sector across the world. In selecting the relevant indicators, this paper focuses on three key criteria. First, the indicators have to be specific, that is, they must be explicit about what they capture, and there must be a clear link between them and the sector’s financial performance. Second, they must be measurable, or quantifiable, and their data must realistically be collected at relatively low cost and capacity. Third, they should be comparable to allow for comparisons across times and countries.
A power sector is considered financially sustainable if it is able to provide sufficient electricity and make investments to meet changing future demand while generating adequate revenues to cover costs and operating according to environmental and social norms. To measure this, four criteria are proposed:
1. Ability to recover investment and operating costs net operating profit
2. Ability to reliably meet demand
3. Ability to make investments
4. Ability to operate according to environmental and social norms
These linked elements, which all influence the sector’s financial performance, are summarized in Figure 1. These criteria reflect the overall performance of the sector, but not that of the internal and external stakeholders that may influence the sector, such as end-consumers, generators, transmission and distribution companies, regulators, appellate tribunals, other government agencies, fuel suppliers, technology/equipment providers and developers, etc. Nevertheless, some of the indicators may be used as proxies for their performance because their activities direct impact on the viability of the sector as a whole. The paper is organized along these four criteria, with each section outlining the proposed indicators to assess each criterion and presenting the available data corresponding to the indicators.
1 The GSI was established in 2005 and is an entirely independent, research-driven initiative, focused on researching how subsidies can undermine or support sustainable development. Through technical analyses, policy dialogues and communication with stakeholders, the GSI’s aim is to bring about transformative change in the implementation of subsidy reform.
RESEARCH REPORT MARCH 2014A Financially Sustainable Power Sector: Developing assessment methodologies 3
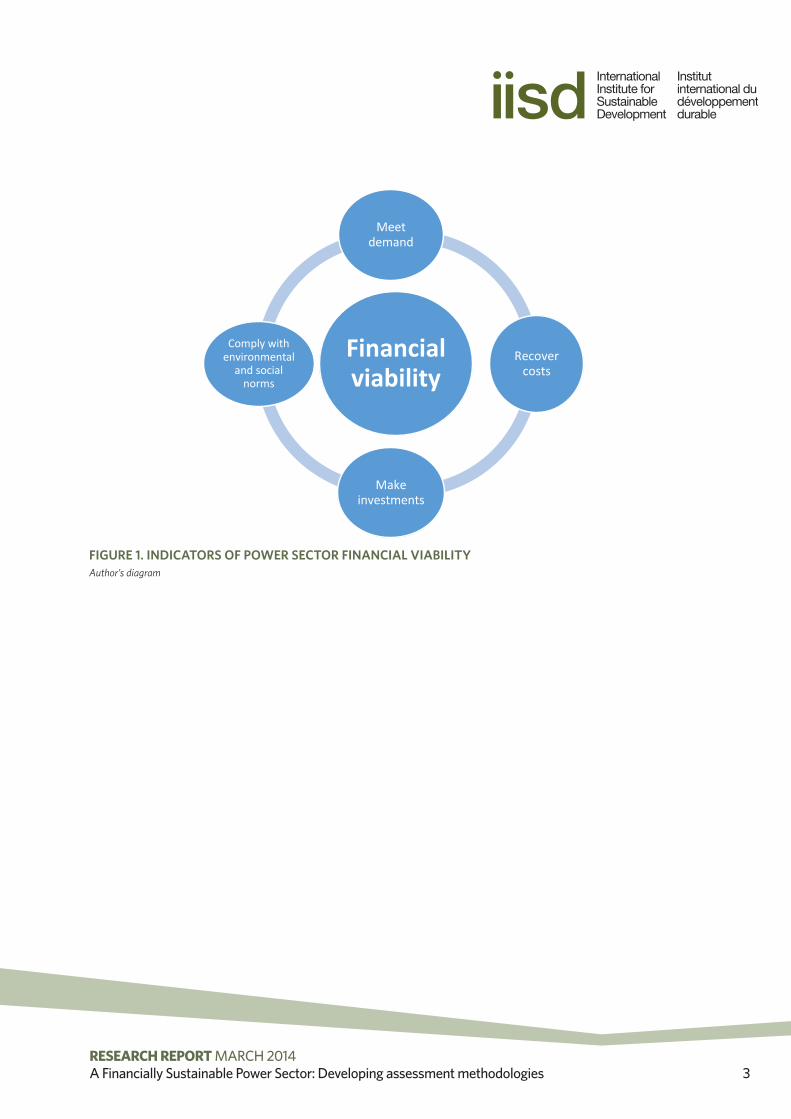
FIGURE 1. INDICATORS OF POWER SECTOR FINANCIAL VIABILITYAuthor’s diagram
Financial viability
Meet demand
Recover costs
Make investments
Comply with environmental
and social norms

RESEARCH REPORT MARCH 2014A Financially Sustainable Power Sector: Developing assessment methodologies 4
1.0 Cost RecoveryThe ability to recover costs requires any sector to at least balance its costs and revenues. Information on costs for generation, transmission and distribution is generally available from the financial accounts of public and private electricity companies. In the absence of data, it may be possible to approximate costs from benchmark values, but the accuracy of such estimates may be low due to nationally and regionally specific factors such as variations in technology and infrastructure constraints. In addition, policies and charges, such as import taxes, value-added taxes (VATs), environmental taxes (e.g., on carbon dioxide), and subsidies, would also affect the final costs.
Costs can be expressed as electricity generation unit costs for each fuel type (gas, coal, oil, hydro, or renewable) and are calculated by dividing the costs associated with each generation type by the total amount of electricity generated from each source. Alternatively, one can also calculate the levelized cost of electricity (LCOE)—“the per-kilowatt hour cost (in real terms) of building and operating a generating plant over an assumed financial life and duty cycle”—which is the sum of overnight capital, fixed and variable operation and management (O&M), financing, an assumed risk-adjusted rate of return, and possibly any applicable charges or benefits (e.g., emission charges, taxes, and subsidies) (Energy Information Administration [EIA], 2013). Overnight capital is the total lifetime cost discounted back to a common year using a discount rate that reflects the weighted average cost of capital. Variable operating costs are in turn calculated from the fuel costs (including a carbon dioxide price where relevant) and the efficiency rate of plant using that fuel to generate power (e.g., thermal power plant using coal). These fuel costs may also be adjusted for hedging costs, which are the costs of the strategies that the utilities use to protect themselves against the volatility of fuel prices.
Furthermore, there are certain risks associated with the variability of power generation that system planners need to take into account. For example, output can fluctuate depending on the availability of energy sources and demand varies over time, creating challenges for grid management. These risks are considered integration costs, which include profile costs (due to the fluctuation of output according to production time), balancing costs (due to demand and supply forecast errors), and grid-related costs (due to the difference in the quality of energy sources across locations). Incorporating these costs, which yields the system LCOE, may better reflect the true economic costs of each technology (Edenhofer et al, 2013).
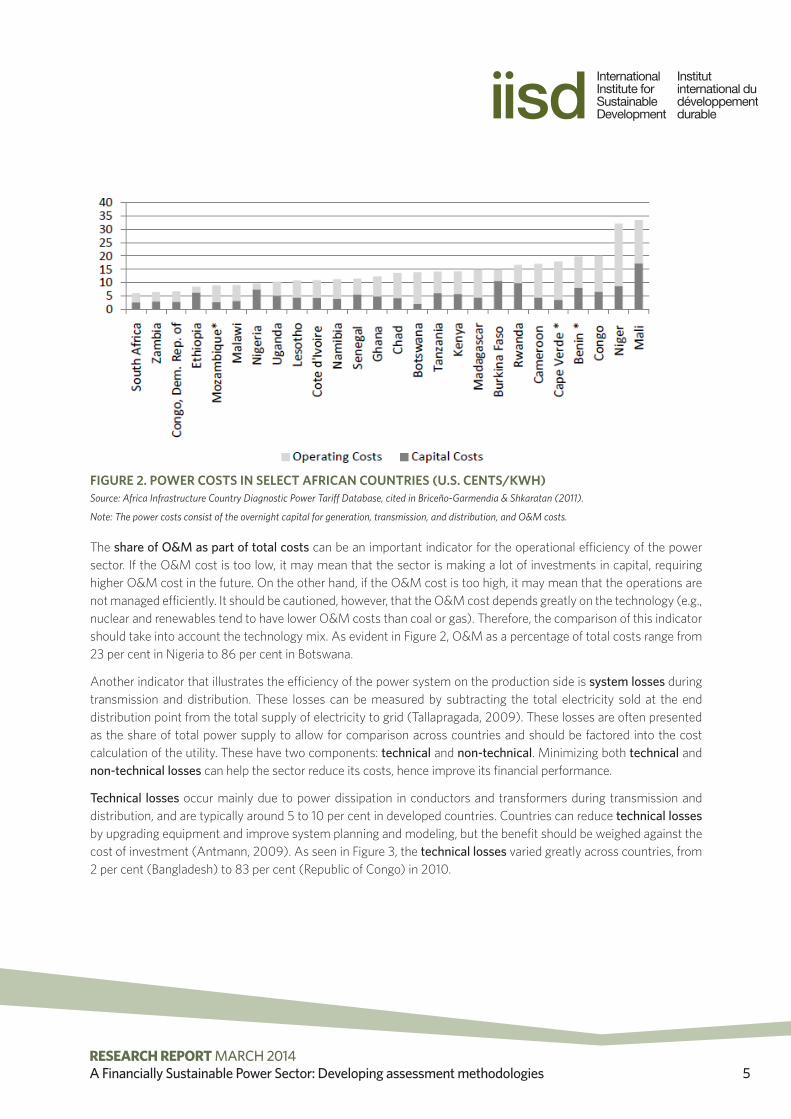
It should be noted that the LCOE is a plant- or technology-specific calculation. To measure the overall electricity generation unit costs, one can take the weighted average of the electricity generation unit costs for all fuel types based on the share of electricity generated from each fuel type in the country’s power portfolio, including both the costs of power generated internally and procured externally by the utility (if applicable) (Tallapragada, 2009). On top of generation costs, the costs of transmission and distribution should also be known. These costs can then be added with taxes and other charges, if applicable, to calculate the final retail unit costs. Because of the different sector structures and fuel mixes, the unit costs of electricity can vary greatly across countries. For example, as Figure 2 indicates, the difference can be more than five fold in Africa, from US$0.06 per kilowatt hour (kWh) in South Africa to US$0.34 per kWh in Mali.
RESEARCH REPORT MARCH 2014A Financially Sustainable Power Sector: Developing assessment methodologies 5
FIGURE 2. POWER COSTS IN SELECT AFRICAN COUNTRIES (U.S. CENTS/KWH)Source: Africa Infrastructure Country Diagnostic Power Tariff Database, cited in Briceño-Garmendia & Shkaratan (2011).
Note: The power costs consist of the overnight capital for generation, transmission, and distribution, and O&M costs.
The share of O&M as part of total costs can be an important indicator for the operational efficiency of the power sector. If the O&M cost is too low, it may mean that the sector is making a lot of investments in capital, requiring higher O&M cost in the future. On the other hand, if the O&M cost is too high, it may mean that the operations are not managed efficiently. It should be cautioned, however, that the O&M cost depends greatly on the technology (e.g., nuclear and renewables tend to have lower O&M costs than coal or gas). Therefore, the comparison of this indicator should take into account the technology mix. As evident in Figure 2, O&M as a percentage of total costs range from 23 per cent in Nigeria to 86 per cent in Botswana.
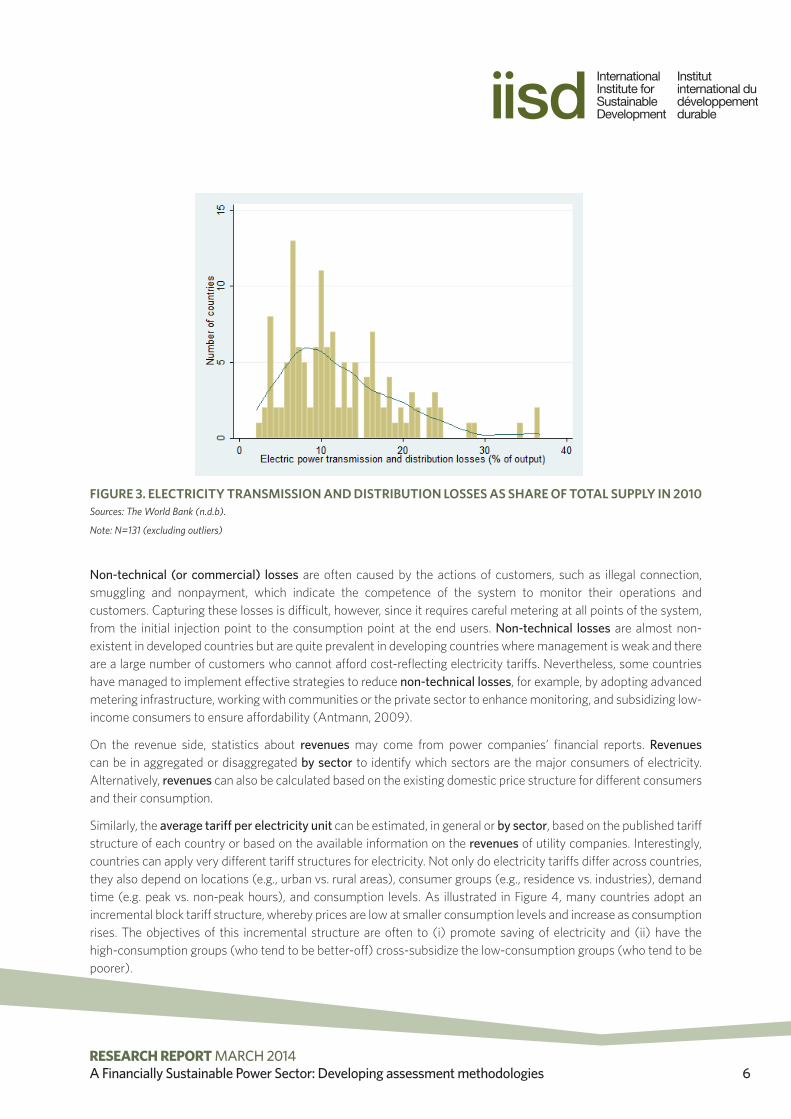
Another indicator that illustrates the efficiency of the power system on the production side is system losses during transmission and distribution. These losses can be measured by subtracting the total electricity sold at the end distribution point from the total supply of electricity to grid (Tallapragada, 2009). These losses are often presented as the share of total power supply to allow for comparison across countries and should be factored into the cost calculation of the utility. These have two components: technical and non-technical. Minimizing both technical and non-technical losses can help the sector reduce its costs, hence improve its financial performance.
Technical losses occur mainly due to power dissipation in conductors and transformers during transmission and distribution, and are typically around 5 to 10 per cent in developed countries. Countries can reduce technical losses by upgrading equipment and improve system planning and modeling, but the benefit should be weighed against the cost of investment (Antmann, 2009). As seen in Figure 3, the technical losses varied greatly across countries, from 2 per cent (Bangladesh) to 83 per cent (Republic of Congo) in 2010.
RESEARCH REPORT MARCH 2014A Financially Sustainable Power Sector: Developing assessment methodologies 6
FIGURE 3. ELECTRICITY TRANSMISSION AND DISTRIBUTION LOSSES AS SHARE OF TOTAL SUPPLY IN 2010Sources: The World Bank (n.d.b).
Note: N=131 (excluding outliers)
Non-technical (or commercial) losses are often caused by the actions of customers, such as illegal connection, smuggling and nonpayment, which indicate the competence of the system to monitor their operations and customers. Capturing these losses is difficult, however, since it requires careful metering at all points of the system, from the initial injection point to the consumption point at the end users. Non-technical losses are almost non-existent in developed countries but are quite prevalent in developing countries where management is weak and there are a large number of customers who cannot afford cost-reflecting electricity tariffs. Nevertheless, some countries have managed to implement effective strategies to reduce non-technical losses, for example, by adopting advanced metering infrastructure, working with communities or the private sector to enhance monitoring, and subsidizing low-income consumers to ensure affordability (Antmann, 2009).
On the revenue side, statistics about revenues may come from power companies’ financial reports. Revenues can be in aggregated or disaggregated by sector to identify which sectors are the major consumers of electricity. Alternatively, revenues can also be calculated based on the existing domestic price structure for different consumers and their consumption.
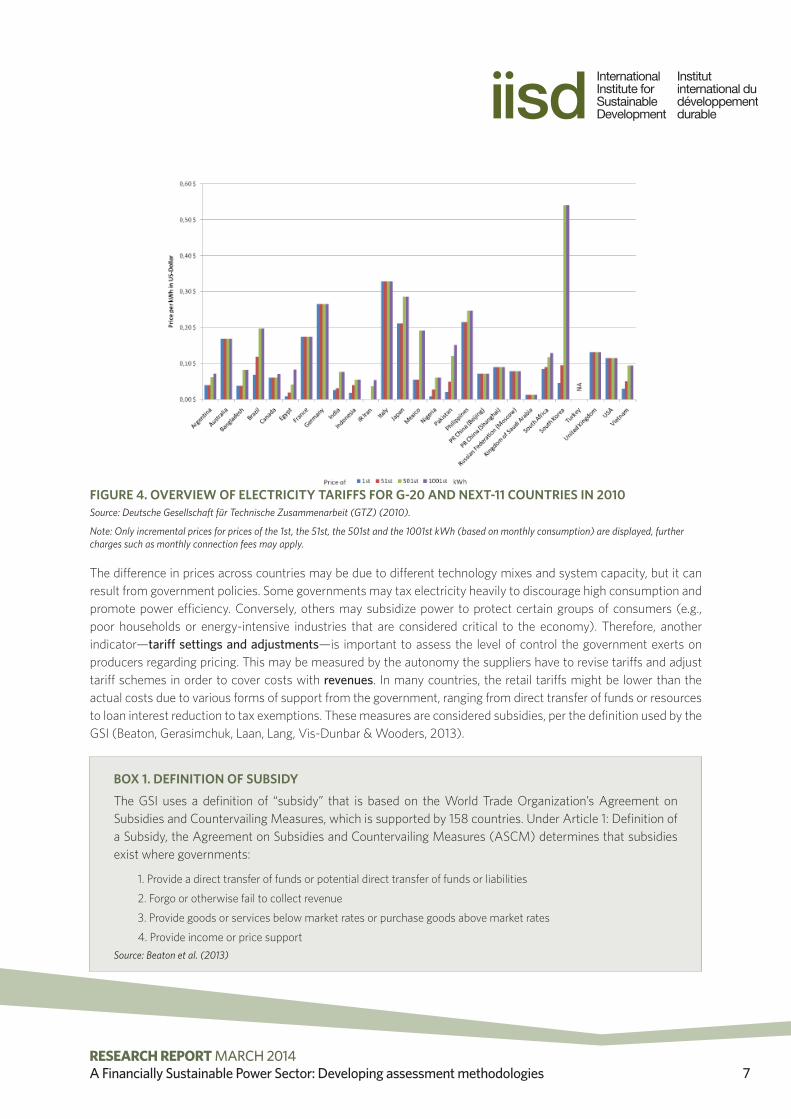
Similarly, the average tariff per electricity unit can be estimated, in general or by sector, based on the published tariff structure of each country or based on the available information on the revenues of utility companies. Interestingly, countries can apply very different tariff structures for electricity. Not only do electricity tariffs differ across countries, they also depend on locations (e.g., urban vs. rural areas), consumer groups (e.g., residence vs. industries), demand time (e.g. peak vs. non-peak hours), and consumption levels. As illustrated in Figure 4, many countries adopt an incremental block tariff structure, whereby prices are low at smaller consumption levels and increase as consumption rises. The objectives of this incremental structure are often to (i) promote saving of electricity and (ii) have the high-consumption groups (who tend to be better-off) cross-subsidize the low-consumption groups (who tend to be poorer).
RESEARCH REPORT MARCH 2014A Financially Sustainable Power Sector: Developing assessment methodologies 7
FIGURE 4. OVERVIEW OF ELECTRICITY TARIFFS FOR G-20 AND NEXT-11 COUNTRIES IN 2010Source: Deutsche Gesellschaft für Technische Zusammenarbeit (GTZ) (2010).
Note: Only incremental prices for prices of the 1st, the 51st, the 501st and the 1001st kWh (based on monthly consumption) are displayed, further charges such as monthly connection fees may apply.
The difference in prices across countries may be due to different technology mixes and system capacity, but it can result from government policies. Some governments may tax electricity heavily to discourage high consumption and promote power efficiency. Conversely, others may subsidize power to protect certain groups of consumers (e.g., poor households or energy-intensive industries that are considered critical to the economy). Therefore, another indicator—tariff settings and adjustments—is important to assess the level of control the government exerts on producers regarding pricing. This may be measured by the autonomy the suppliers have to revise tariffs and adjust tariff schemes in order to cover costs with revenues. In many countries, the retail tariffs might be lower than the actual costs due to various forms of support from the government, ranging from direct transfer of funds or resources to loan interest reduction to tax exemptions. These measures are considered subsidies, per the definition used by the GSI (Beaton, Gerasimchuk, Laan, Lang, Vis-Dunbar & Wooders, 2013).
BOX 1. DEFINITION OF SUBSIDY
The GSI uses a definition of “subsidy” that is based on the World Trade Organization’s Agreement on Subsidies and Countervailing Measures, which is supported by 158 countries. Under Article 1: Definition of a Subsidy, the Agreement on Subsidies and Countervailing Measures (ASCM) determines that subsidies exist where governments:
1. Provide a direct transfer of funds or potential direct transfer of funds or liabilities
2. Forgo or otherwise fail to collect revenue
3. Provide goods or services below market rates or purchase goods above market rates
4. Provide income or price supportSource: Beaton et al. (2013)
RESEARCH REPORT MARCH 2014A Financially Sustainable Power Sector: Developing assessment methodologies 8
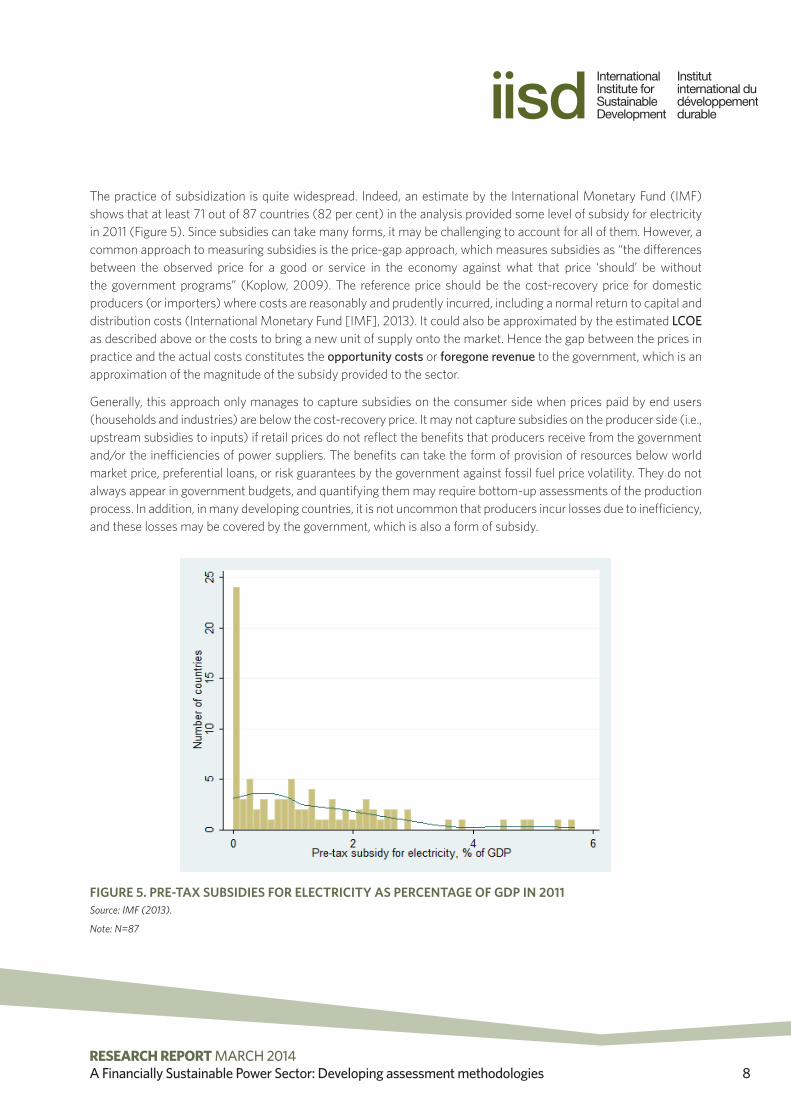
The practice of subsidization is quite widespread. Indeed, an estimate by the International Monetary Fund (IMF) shows that at least 71 out of 87 countries (82 per cent) in the analysis provided some level of subsidy for electricity in 2011 (Figure 5). Since subsidies can take many forms, it may be challenging to account for all of them. However, a common approach to measuring subsidies is the price-gap approach, which measures subsidies as “the differences between the observed price for a good or service in the economy against what that price ‘should’ be without the government programs” (Koplow, 2009). The reference price should be the cost-recovery price for domestic producers (or importers) where costs are reasonably and prudently incurred, including a normal return to capital and distribution costs (International Monetary Fund [IMF], 2013). It could also be approximated by the estimated LCOE as described above or the costs to bring a new unit of supply onto the market. Hence the gap between the prices in practice and the actual costs constitutes the opportunity costs or foregone revenue to the government, which is an approximation of the magnitude of the subsidy provided to the sector.
Generally, this approach only manages to capture subsidies on the consumer side when prices paid by end users (households and industries) are below the cost-recovery price. It may not capture subsidies on the producer side (i.e., upstream subsidies to inputs) if retail prices do not reflect the benefits that producers receive from the government and/or the inefficiencies of power suppliers. The benefits can take the form of provision of resources below world market price, preferential loans, or risk guarantees by the government against fossil fuel price volatility. They do not always appear in government budgets, and quantifying them may require bottom-up assessments of the production process. In addition, in many developing countries, it is not uncommon that producers incur losses due to inefficiency, and these losses may be covered by the government, which is also a form of subsidy.
FIGURE 5. PRE-TAX SUBSIDIES FOR ELECTRICITY AS PERCENTAGE OF GDP IN 2011Source: IMF (2013).
Note: N=87
RESEARCH REPORT MARCH 2014A Financially Sustainable Power Sector: Developing assessment methodologies 9
Having tariffs set below cost-recovery rates can imply hidden losses (Ebinger, 2006). If producers are not compensated for the resulting losses, a loss is generated for the system, and the longer the price-control period, the larger the accumulated deficits. Even if producers are compensated in the case of a subsidy as explained above, this would increase the burden on the government budget, and as demand for power increases, the subsidy may become unaffordable. Therefore, losses will affect the financial situation of not only the sector but also the public sector in general. Government interventions to keep prices low also have a negative impact on fuel supply and encourage inefficient fuel consumption, which sends the system into a vicious cycle of decreasing viability (Kojima, 2013). For instance, low prices affect the financially viability of downstream businesses and discourage investments in upstream businesses, such as generation.
The calculation of the difference between total costs and revenues will allow for an estimation of net profits/losses, which is a proxy for cost recovery, or the ability of the sector to have cost-reflective tariffs. The ratio of net profits/losses over revenues will also provide an idea of the profit margin of the sector. However, it is not always appropriate to compare profit margins across countries. The business cycles of the economy will affect economic activities, which in turn affect the demand for and investment in electricity, as well as the profit margins of the sector. Furthermore, a high profit margin may be a result of the producers’ monopolistic power and imply overly high tariffs and/or expose the companies to political pressure to impose windfall taxes. A profit margin that is too low will make it difficult for the sector to attract investment. Although there is no rule of thumb to determine the right profit margin, consistently negative margins or decreasing margins over time would suggest the financial unsustainability of the sector.
Two additional indicators can help gauge the financial sustainability of the power companies. The debt ratio, or the proportion of debt a firm has relative to its assets, indicates the risks it faces. A high debt ratio means that the company finances a lot of its assets via debt and has low borrowing capacity, which may hinder its ability to finance its future investments. The current ratio, or the proportion of current liquid assets a firm has relative to its current liabilities, measures the company’s ability to pay its short-term obligations with its existing resources. A ratio of less than 1 means that the company may have difficulty meeting creditors’ demands if they are due, unless it has good long-term prospects against which it can borrow.
RESEARCH REPORT MARCH 2014A Financially Sustainable Power Sector: Developing assessment methodologies 10
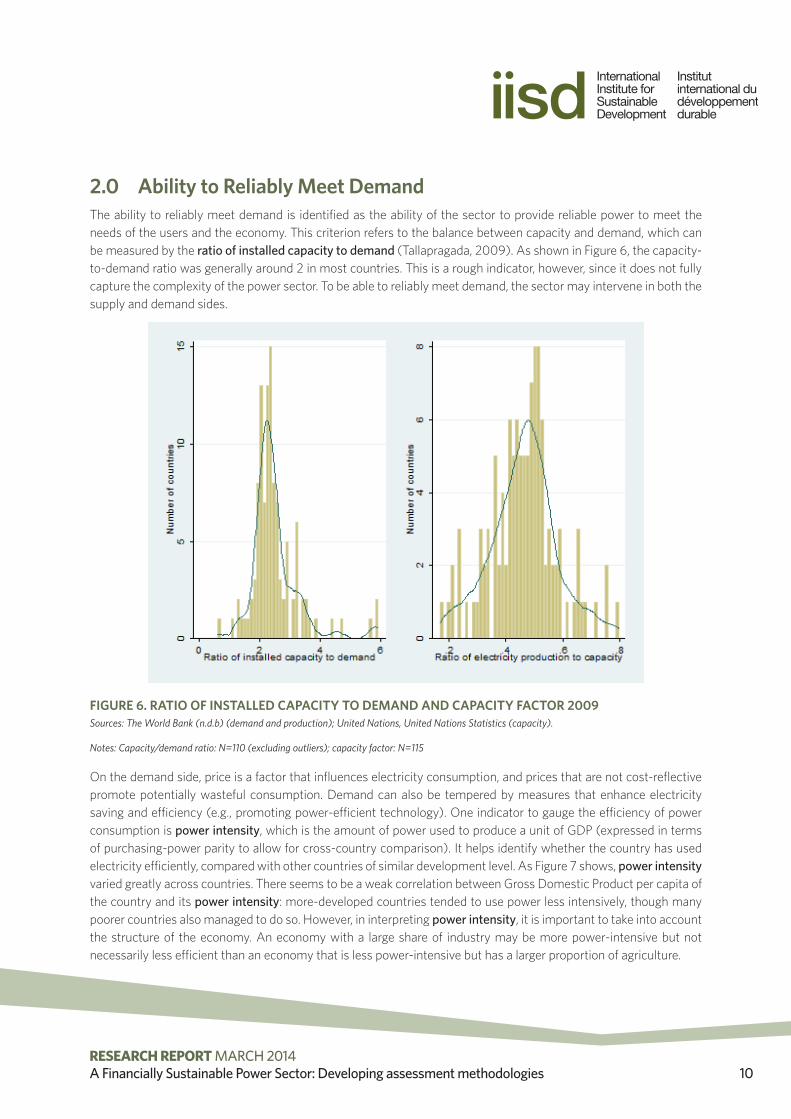
2.0 Ability to Reliably Meet Demand The ability to reliably meet demand is identified as the ability of the sector to provide reliable power to meet the needs of the users and the economy. This criterion refers to the balance between capacity and demand, which can be measured by the ratio of installed capacity to demand (Tallapragada, 2009). As shown in Figure 6, the capacity-to-demand ratio was generally around 2 in most countries. This is a rough indicator, however, since it does not fully capture the complexity of the power sector. To be able to reliably meet demand, the sector may intervene in both the supply and demand sides.
FIGURE 6. RATIO OF INSTALLED CAPACITY TO DEMAND AND CAPACITY FACTOR 2009Sources: The World Bank (n.d.b) (demand and production); United Nations, United Nations Statistics (capacity).
Notes: Capacity/demand ratio: N=110 (excluding outliers); capacity factor: N=115
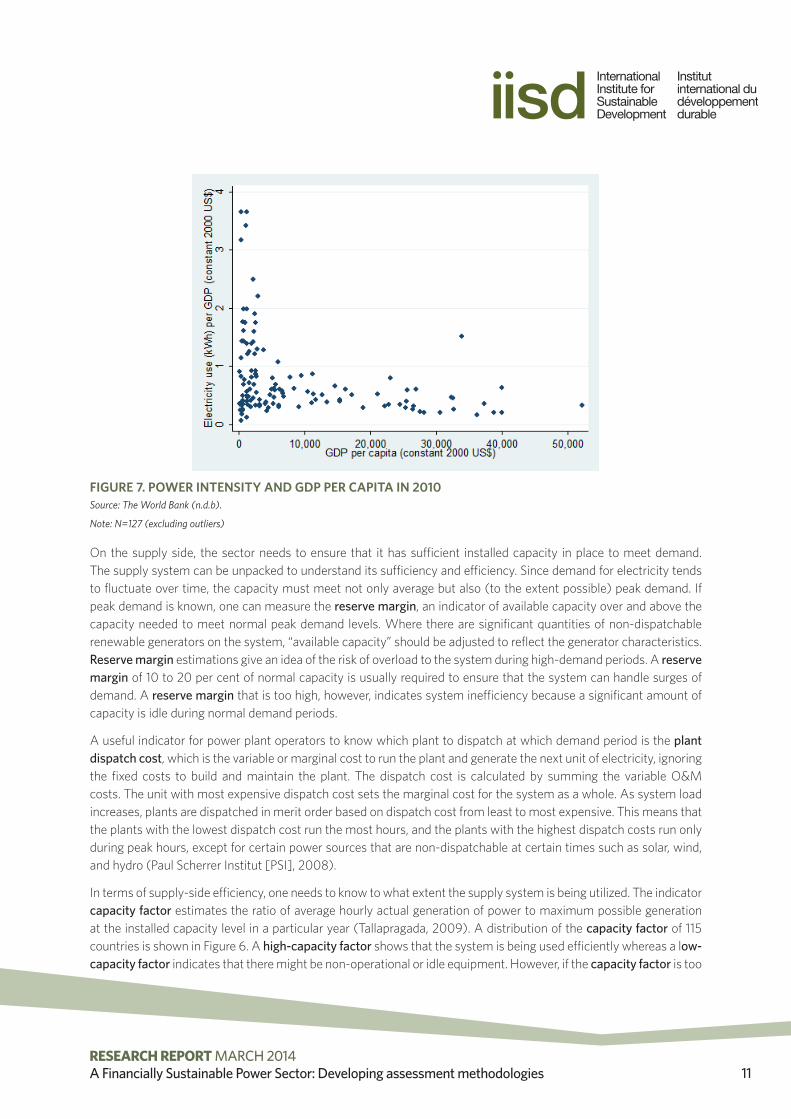
On the demand side, price is a factor that influences electricity consumption, and prices that are not cost-reflective promote potentially wasteful consumption. Demand can also be tempered by measures that enhance electricity saving and efficiency (e.g., promoting power-efficient technology). One indicator to gauge the efficiency of power consumption is power intensity, which is the amount of power used to produce a unit of GDP (expressed in terms of purchasing-power parity to allow for cross-country comparison). It helps identify whether the country has used electricity efficiently, compared with other countries of similar development level. As Figure 7 shows, power intensity varied greatly across countries. There seems to be a weak correlation between Gross Domestic Product per capita of the country and its power intensity: more-developed countries tended to use power less intensively, though many poorer countries also managed to do so. However, in interpreting power intensity, it is important to take into account the structure of the economy. An economy with a large share of industry may be more power-intensive but not necessarily less efficient than an economy that is less power-intensive but has a larger proportion of agriculture.
RESEARCH REPORT MARCH 2014A Financially Sustainable Power Sector: Developing assessment methodologies 11
FIGURE 7. POWER INTENSITY AND GDP PER CAPITA IN 2010Source: The World Bank (n.d.b).
Note: N=127 (excluding outliers)
On the supply side, the sector needs to ensure that it has sufficient installed capacity in place to meet demand. The supply system can be unpacked to understand its sufficiency and efficiency. Since demand for electricity tends to fluctuate over time, the capacity must meet not only average but also (to the extent possible) peak demand. If peak demand is known, one can measure the reserve margin, an indicator of available capacity over and above the capacity needed to meet normal peak demand levels. Where there are significant quantities of non-dispatchable renewable generators on the system, “available capacity” should be adjusted to reflect the generator characteristics. Reserve margin estimations give an idea of the risk of overload to the system during high-demand periods. A reserve margin of 10 to 20 per cent of normal capacity is usually required to ensure that the system can handle surges of demand. A reserve margin that is too high, however, indicates system inefficiency because a significant amount of capacity is idle during normal demand periods.
A useful indicator for power plant operators to know which plant to dispatch at which demand period is the plant dispatch cost, which is the variable or marginal cost to run the plant and generate the next unit of electricity, ignoring the fixed costs to build and maintain the plant. The dispatch cost is calculated by summing the variable O&M costs. The unit with most expensive dispatch cost sets the marginal cost for the system as a whole. As system load increases, plants are dispatched in merit order based on dispatch cost from least to most expensive. This means that the plants with the lowest dispatch cost run the most hours, and the plants with the highest dispatch costs run only during peak hours, except for certain power sources that are non-dispatchable at certain times such as solar, wind, and hydro (Paul Scherrer Institut [PSI], 2008).
In terms of supply-side efficiency, one needs to know to what extent the supply system is being utilized. The indicator capacity factor estimates the ratio of average hourly actual generation of power to maximum possible generation at the installed capacity level in a particular year (Tallapragada, 2009). A distribution of the capacity factor of 115 countries is shown in Figure 6. A high-capacity factor shows that the system is being used efficiently whereas a low-capacity factor indicates that there might be non-operational or idle equipment. However, if the capacity factor is too
RESEARCH REPORT MARCH 2014A Financially Sustainable Power Sector: Developing assessment methodologies 12
high, there is a risk of system overload. Similarly, the utilization rate of the power system can be presented through the indicator operating ratio, which is the ratio of operating to installed capacity. While the capacity factor reflects the overall (in)utility of the system, the operating ratio can help identify if the low operation of the sector is due to physical assets or other reasons (Tallapragada, 2009).
Power plants can be idle when demand is low and operators choose to dispatch lower-cost generating units, as explained above, or because they are unavailable. Although all power plants would require some time for planned maintenance, the more available they are the better. An indicator that captures their availability is equivalent availability factor, which gives the fraction of time that a generating unit is in principle available for service at full power (when it is not undergoing maintenance or repair). It forms an upper bound to the capacity factor and is measured by the possible annual generation divided by the peak capacity (PSI, 2008).
If domestic capacity is not sufficient to meet demand (or cheaper sources of electricity are available) the power sector may import from other countries. Interconnection with other countries can help the system stabilize (especially during demand surge) and improve cost-effectiveness (if imports are cheaper than domestic generation). Regional power integration can also help countries to optimize electricity supplies across the region, which improves efficiency and, owing to economies of scale, lowers generation costs. Therefore, available interconnection capacity can be an indicator for system integration and security (in case of internal shortages). This reflects the sector’s access to markets and to the cheapest power sources. This capacity may also be added to the domestic installed capacity to calculate the overall capacity of the sector to meet demand. This indicator should be considered in parallel with the dependence of a power sector on imports, estimated through net power imports—the ratio of net electricity import to total electricity consumed. Another indicator of this exposure is the value of net power imports, which the ratio of the value of net power imports to GDP. As Figure 8 shows, only 19 out of 134 countries with available data (14 per cent) imported some of their electricity. However, this figure does not take into account the fact that many countries import the inputs for electricity generation, such as coal, gas, uranium, lignite, and oil.
FIGURE 8. NET ELECTRICITY IMPORTS AS SHARE OF TOTAL ELECTRICITY USE IN 2010Source: The World Bank (n.d.b).Note: N=132 (excluding outliers)
RESEARCH REPORT MARCH 2014A Financially Sustainable Power Sector: Developing assessment methodologies 13
Finally, it is important that the sector not only can meet demand but also provide services reliably. The quality of power services is reflected through the extent to which customers can access power consistently and reliably. A reliability index can be constructed by asking consumers what amount of the time they are able to obtain electricity (Foster, 2010). Such an index might be difficult to obtain, however, since it requires surveys of all, or at least a sample of, customers. A simpler variable that can capture the quality of power supply is the number of outages (both those which were scheduled and informed to customers and those which were not. Outages often reflect inadequate generation (or import) capacity or transmission or distribution failures. Outages have detrimental effects on customers, especially businesses, which rely on electricity for production and services. Frequent outages would cause disruption and uncertainty in business planning and also drive customers away to obtain their own power generators.
Figure 9 presents the reported number of outages occurring to firms in a typical month and the value lost as a result. It shows that outages were indeed a serious problem in many countries, with more than 46 per cent (64 out of 138 countries) reported more than 20 outages in a month. Due to outages, firms suffered a loss of 19 per cent of their annual sales on average.
FIGURE 9. NUMBER AND VALUE OF OUTAGES (LATEST AVAILABLE YEAR)Source: The World Bank (n.d.a).
Notes: Number of outages: N=137; Value lost due to outages: N=133 (excluding outliers)
RESEARCH REPORT MARCH 2014A Financially Sustainable Power Sector: Developing assessment methodologies 14
3.0 Ability to Make InvestmentsThe indicators described in Section 2 reflect the ability of the power sector to meet current demand, but as demand changes over time, the sector needs to continuously make investments to ensure that it can meet future needs as well. Necessary investments include capital expenditure for generation, transmission and distribution, and investment in renewables to reduce the dependence on fossil fuels. Investments can be evaluated based on relative increases in capacity and expenditure. Capacity growth captures the changes in installed capacity over a certain period and investment expenditure growth reflects the changes over time in the spending for new assets and replacing depreciating ones. Since investments may not happen every year, one can measure these changes over a longer period of time, such as, for example, five years. Figure 10 illustrates the compound annual growth rate (CAGR) of installed capacity during the period 2005 to 2009. Although capacity was decreasing in some countries (25 countries), it grew at an annual rate of 4.6 per cent on average in most others (68 per cent, or 153 out of 225 countries).
The growth in capacity needs to sufficiently meet the growth of demand. The ratio of the growth of generating capacity to the growth of demand stands in for the speed at which capacity catches up with the changing needs of the economy over a period. The increase in production investment should also be met with investments in transmission and distribution grids. The results of the generating capacity and demand growth balance are presented in Figure 10. Despite the growth in capacity, in many cases it was not adequate to meet the high growth in demand, which averaged 5 per cent in 2005–2009 among the 90 countries with positive demand growth. Indeed, the ratio of capacity to demand growth was higher than 1 in only 27 per cent (24 out of 90) of the countries where the demand growth was positive. At the same time, as explained in the previous section, the high growth in demand should also be a sign of caution for the sector to examine the sources of growth and intervene accordingly, especially if demand increase is due to inefficiency or over-investment in power-intensive industries.
FIGURE 10. INSTALLED CAPACITY ANNUAL GROWTH AND CAPACITY VS. DEMAND GROWTH 2005–2009Sources: The World Bank (n.d.b) (demand); United Nations, United Nations Statistics, (capacity).Notes: Capacity growth: N=225; capacity/demand growth ratio: N=111 (excluding outliers)
RESEARCH REPORT MARCH 2014A Financially Sustainable Power Sector: Developing assessment methodologies 15
The projection of demand will help estimate the investments needed to meet changing demand. The forecast of demand could be based on an econometric panel model that regresses historic demand over variables that have been tested to be significantly correlated with demand, such as GDP per capita, population, fuel prices, urbanization, industrialization, and poverty levels. The projection of demand can also be based on an assumption that each person in the economy consumes a minimum amount of power and/or with an assumption of an increasing consumption level over time. The assessment of resources and investments required to meet demand will then be based on the gap between projected demand and existing capacity (domestic and regional), taking into consideration system losses, own use, and retirements of current assets. In calculating the needed capacity, one should also account for sufficient capacity to meet peak demand and ensure minimum outages or breakdowns. An example of such model is presented in Box 2.
It should also be noted that the investments required can depend greatly on the country context. For example, some countries may rely more on imports than domestic capacity. Countries with more hydro potential can focus on building dams and hydropower plants, whereas gas-exporting countries may use gas for electricity generation. Investments in transmission and distribution grids to integrate renewables into the system are needed if countries aim to increase the shares of renewables. More sparsely populated countries may have to invest more in transmission and distribution infrastructure and may employ alternative models of electrification, including mini-grids and distributed generation. Lower population densities generally translate into higher distribution costs. When costs are high, it may not be viable to recover infrastructure investment through user fees alone. In this case private investors may struggle to finance schemes without public subsidies.
In addition, given that many risks can affect the supply and demand sides of the sector, the investment assessment can also take these factors into account. These risks may pertain to three areas: (i) macroeconomic risks (e.g., GDP growth, fiscal balance, inflation, foreign exchange, foreign aid and investment); (ii) political and regulatory risks (e.g., country political structure, regulatory authority, laws related to power markets and investments, decisions on taxes, charges, subsidies and price controls); and (iii) sector-specific risks (e.g., market concentration, contract risks, fuel supply, technology advancement).
BOX 2. WORLD ENERGY MODELThe International Energy Agency (IEA) has developed the World Energy Model (WEM) to project medium- to long-term various indicators related to the power markets. Using global data on fuel supply, power generation, demand, and prices, the model can produce such outputs as trends in demand, supply availability and constraints, international trade and power balances as well as investment requirements in the fuel supply chain needed to satisfy projected power demand to 2035. The model determines how much new generation capacity is required annually in each region by considering the change in peak demand compared to the previous year, retirements of generation capacity during the year, and any increase in renewable capacity built as the result of government policy. Installed generating capacity must exceed peak demand by a security-of-supply margin; if this margin is not respected after changes in demand, retirements, and renewable additions, then the model adds new capacity in the region. In making this calculation, the model takes into account losses in transmission and distribution networks and electricity used by generation plants themselves. For transmission and distribution networks, the model calculates investments required based on three elements. The first is the cost of new infrastructure required to meet growth in demand. This is estimated from historic relationships between network growth and demand growth. The second is investment required to replace aging infrastructure, which is estimated using data on the age profile of networks in each region. The third is the additional cost associated with integrating renewables to the transmission and distribution networks (these can be higher than other technologies because renewable resources can be located relatively far from demand and the capacity factor of renewable generators can be low). This is based on industry and academic studies that have sought to estimate the network costs associated with renewable technologies.
Source: IEA (2013).
RESEARCH REPORT MARCH 2014A Financially Sustainable Power Sector: Developing assessment methodologies 16
4.0 Ability to Operate According to Social and Environmental NormsThe systemic performance of the electricity sector is also important and should cover both its social and environmental performance. Specifically, if the electricity sector fails to meet social and environmental norms it may face higher costs in the future as pressure to conform to social and environmental expectations mounts. For example, power generators that do not apply modern technologies or processes to meet environmental requirements e.g., to address emissions of particulates that cause local air pollution detrimental to human health may be forced to retrofit with expensive equipment in the future. At the global level, sectors with high carbon emissions may eventually come under international carbon-reduction agreements. In addition, the social indicators also assess the obligation on the power sector to meet the needs of the users.
Since consumers are the source of revenue for the power sector, its ability to meet the customers’ needs should therefore be an important aspect of performance. The main dimensions of customer service should include (1) access and (2) affordability.
These indicators can be disaggregated by areas (urban and rural), income groups and economic sectors to understand if some groups of customers are served better than others.
Because electricity is increasingly considered to be part of human basic needs, access to electricity should be an important indicator of the performance of the power sector in particular, and a country’s human development in general. Increasing access to electricity may enhance the growth of the economy and help resolve many health and environmental issues caused by traditional biomass (Sovacool, 2012). At the same time, it also shows how advanced the sector is in reaching households and businesses and the potential customers that have not yet been covered. Indeed, the UN General Assembly in 2011 established universal access to modern energy services (including electricity and clean, modern cooking solutions) as one of the three global power objectives to be accomplished by 2030. This initiative—Sustainable Energy for All (SE4ALL)—has been formally embraced by more than 70 countries. To track and promote the achievement of the SE4ALL initiative, the World Bank/Energy Sector Management Assistance Program (ESMAP) and IEA constructed the Global Tracking Framework. The data mostly come from household surveys that show the percentage of the population with an electricity connection. The framework covers up to 212 countries over the period 1990–2010 (World Bank, 2013).
The definition of access to electricity involves not just connection to electricity but also consumption of a specified minimum level of electricity (IEA, 2012). The IEA calculates the amount for rural households to be 250 kWh per year, and for urban households to be 500 kWh per year, based on an assumption of five people per household. In rural areas, this level of consumption is estimated to cover the use of a floor fan, a mobile telephone and two compact fluorescent light bulbs for about five hours per day. In urban areas, consumption might also include an efficient refrigerator, a second mobile telephone per household and another appliance, such as a small television or a computer.
The measure of electricity access therefore includes the indicator of household electrification rate, which is the percentage of households in the population having connection of some sort, through the main grid, a local grid, or a local utility distributor, as well the indicator of household electricity consumption, which is the average amount of electricity that each household consumes. Not surprisingly, both electricity access indicators were positively correlated with GDP per capita (Figure 11). As countries developed, more people in the population had access to electricity, and they consumed more electricity on average. Many countries, especially less affluent ones, fell short of providing universal access to electricity to their populations.

RESEARCH REPORT MARCH 2014A Financially Sustainable Power Sector: Developing assessment methodologies 17
FIGURE 11. ACCESS TO ELECTRICITYSource: IEA (2012) – electrification rate; The World (n.d.b)—electricity consumption and GDP per capita.
Notes: Electrification rate: N=77, data of 2011; Average consumption: N=61, data of 2010 (excluding outliers)
4.1 AffordabilityA variable indicative of the commercial viability of the power sector is its affordability. This measure helps quantify the implications of the tariff structure on the purchasing power and well-being of consumers. Perhaps a more useful way of thinking about the affordability of electricity is to examine whether households are able to purchase enough electricity to meet subsistence requirements. However, it is often unclear what threshold should be considered subsistence level. One method is to measure the minimum amount of electricity needed to fulfill basic cooking and lighting needs (and heating, if necessary). This is similar to the IEA’s specification of the minimum level of electricity as explained above (250 kWh per year for rural households and 500 kWh per year for urban households). Another is to look at the amount of electricity the poorest people use. For example, Foster and Tre (2000) suggest that the household power subsistence threshold be based on the average total net electricity consumption of those households whose overall consumption levels fall within plus or minus 10 per cent of the US$1.5 (PPP-adjusted) extreme poverty line. This threshold would then be country-specific since it depends on the power consumption pattern of the country. For both methods, the threshold should be expressed in per capita terms to take into account differences in household size.
An affordability index could then be defined as the share of households whose electricity consumption per capita exceeds the subsistence threshold. This shows the percentage of the population that consume insufficient electricity for their basic needs, hence are considered “power poor.” To complement the affordability index, the affordability ratio measures the average ratio of household’s effective power consumption to the subsistence threshold. Beyond the
RESEARCH REPORT MARCH 2014A Financially Sustainable Power Sector: Developing assessment methodologies 18
power poverty headcount, the affordability ratio can reflect the depth of power poverty. To determine the economic burden that the prices of fuel place on consumers, another indicator can be estimated. The subsistence burden measures the share of total household expenditure needed to meet the subsistence threshold. If the percentage is too high, it means that the pricing structure of power makes it unaffordable to customers.
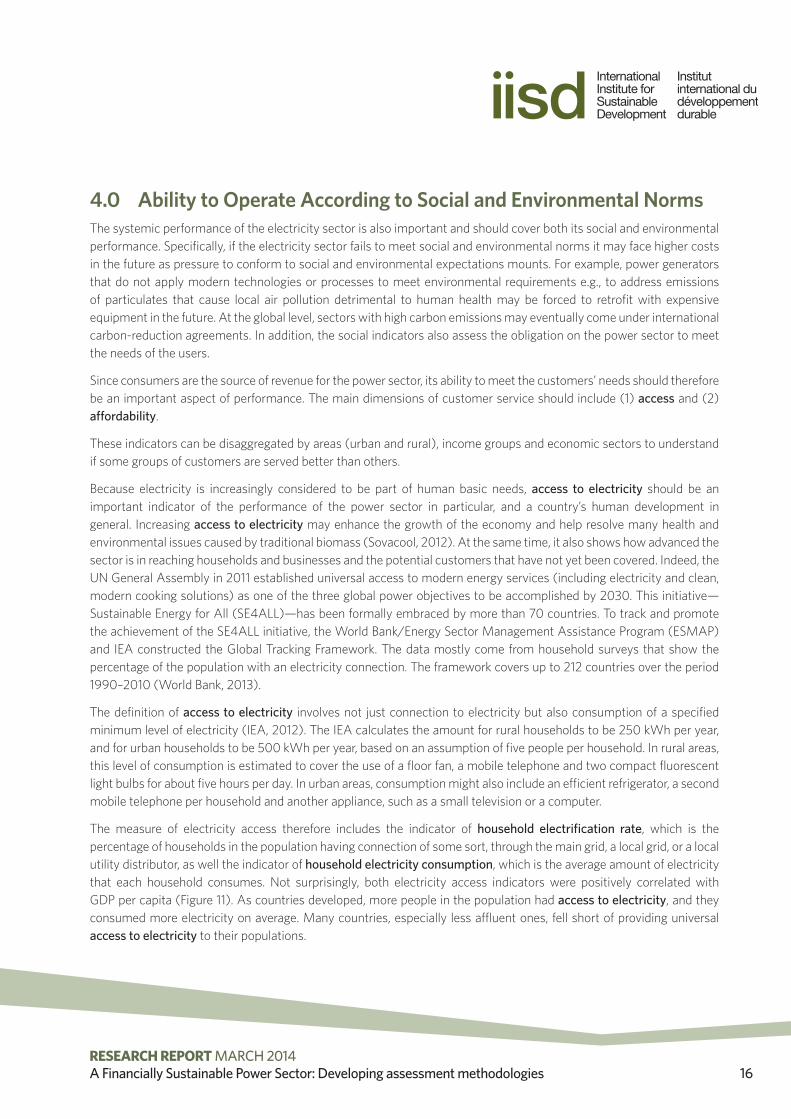
Figure 12 shows the share of the budget that households spent on electricity in various African countries. The share seems quite similar across quintiles, except in some cases where the lowest quintile tended to spend a much larger percentage (Burkina Faso, Nigeria), which is a sign that consuming sufficient electricity imposed a large burden on the poor.
FIGURE 12. SHARE OF ELECTRICITY EXPENDITURE IN HOUSEHOLD BUDGETSource: Africa Infrastructure Country Diagnostic Power Tariff Database, adopted from Banerjee et al. (2008).
Indeed, if one pools all African households together, as in Figure 13, one can see that poorer households generally spend a significant share of their budget to afford sufficient amount of electricity for their basic needs, and, as tariffs rise, electricity can become unaffordable for most poor households.
0
5
10
15
20
25
Q1 Q2 Q3 Q4 Q5

RESEARCH REPORT MARCH 2014A Financially Sustainable Power Sector: Developing assessment methodologies 19
FIGURE 13. SHARE OF AVERAGE URBAN HOUSEHOLD BUDGET REQUIRED TO PURCHASE SUBSISTENCE AMOUNTS OF PIPED WATER AND ELECTRICITYSource: Africa Infrastructure Country Diagnostic Power Tariff Database, adopted from Banerjee et al. (2008).
These measures of affordability would therefore be useful to take into account when considering price adjustment policies. Any increase in electricity prices can reduce households’ ability to afford it. This may in turn lead to many negative effects, including reducing their purchasing power, making them substitute away from other important investments such as health and education, driving them into poverty, and forcing them to cut power consumption and/or switch to other, less efficient and more harmful, sources of energy for cooking and lighting (e.g., coal, firewood, kerosene).
The issue of affordability needs to be weighed against the need for cost recovery. Table 1 illustrates the percentage of households in different African countries that could afford 50 kWh per month at the existing tariff compared with the case where the tariff was set at full cost recovery. Since tariffs were set lower than cost recovery in many countries, raising electricity prices to unit costs would reduce the number of households that can afford the subsistence level of electricity, in some cases to lower than 50 per cent (Ethiopia, Malawi, and Niger). This then raises the need to potentially provide support to low-income households so that they can consume the needed amount of electricity, possibly through such policy measures as cash transfers, lifeline tariffs, cross-subsidization, or electricity vouchers. The adoption of any such measure would need to balance the benefits to the targeted population against the costs imposed on the system or other customers.

RESEARCH REPORT MARCH 2014A Financially Sustainable Power Sector: Developing assessment methodologies 20
TABLE 1. COSTS AND AFFORDABILITY OF CONSUMING 50 KWH PER MONTH
COUNTRY 50 KWH/MONTH (U.S. CENTS) % OF HOUSEHOLDS THAT CAN AFFORD 50KWH/MONTH
Effective tariff Unit cost Effective tariff Unit cost
Benin 6.31 9.92 95 68
Burkina Faso 10.29 7.53 51 69
Cameroon 4.3 8.56 100 100
Cape Verde 11.81 8.95 100 100
Congo, Dem. Rep. of 1.99 3.38 100 63
Côte d’Ivoire 4.81 5.47 100 99
Ethiopia 1.97 4.23 60 12
Ghana 4.36 6.18 97 93
Kenya 4.21 7.1 99 87
Madagascar 2.98 7.49 92 55
Malawi 2.39 4.54 92 43
Niger 7.25 16.07 55 7
Nigeria 1.25 4.84 97 84
Senegal 9.31 5.77 100 100
South Africa — 2.98 100 100
Tanzania 1.6 7.04 99 59
Uganda 9.74 5.19 20 66
Zambia 2.09 3.26 100 97
Source: Africa Infrastructure Country Diagnostic Power Tariff Database, cited in Briceño-Garmendia & Shkaratan (2011).
Note: It is assumed that the tariff is affordable if it is below 5 per cent of the household budget.
A shift towards sustainable energy sources is important to the sustainability of a power sector. A power sector that relies heavily on fossil fuels would lead to depletion of these resources, hence undermining its sustainability in the future. Extracting and producing fossil fuels also place a high burden on the environment, which in turn affects human welfare and other areas of the economy. The environmental impact of the power sector, therefore, is a critical component of its financial performance, and can be divided into two sub-criteria: (1) dependence on fossil fuels; and (2) environmental impact.
Since fossil fuels such as crude oil, natural gas and coal are non-renewable, their consumption would lead to their steady depletion. Increasing scarcity of these resources may undermine the ability of the power sector to meet demand and/or raise their prices, which will threaten the financial viability of the sector. As a result, governments are shifting electricity generation to renewable sources to enhance power security and reduce environmental impacts. Many countries also choose to diversify their electricity sources (with a mixture of coal, hydro, gas, nuclear and renewable) to cater to different needs (on-grid and off-grid, peak and non-peak hours).
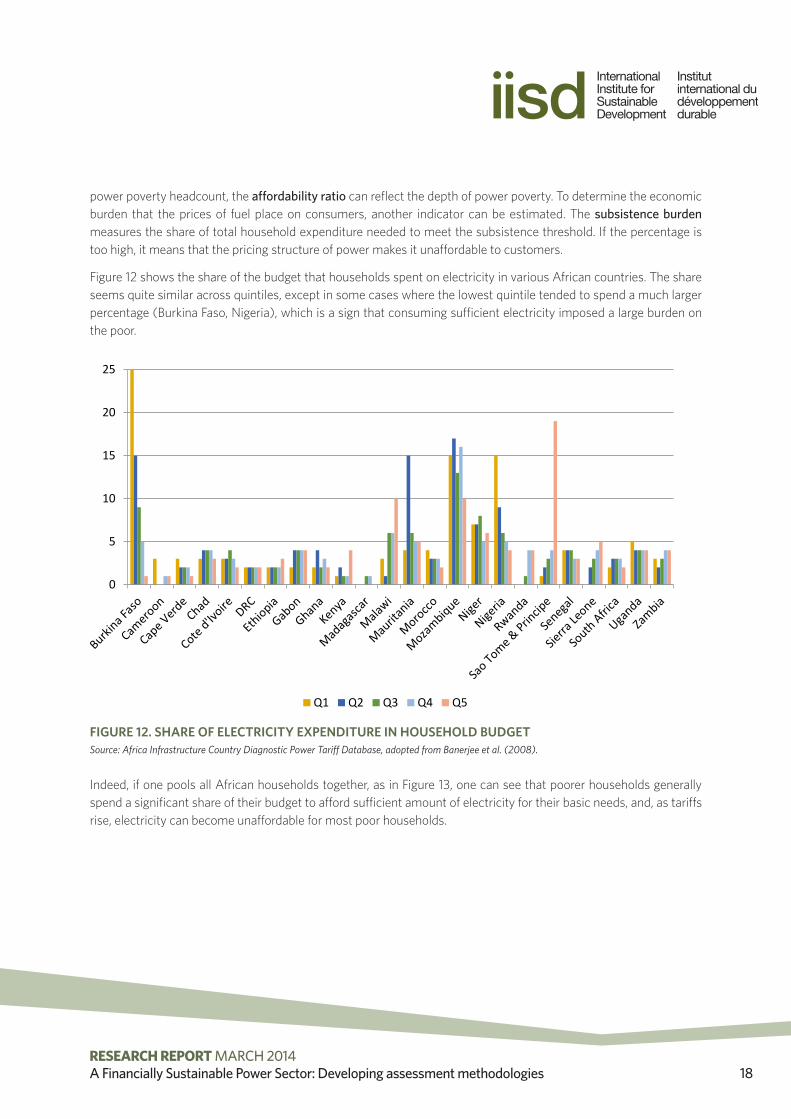
There are several indicators that can capture the dependence on fossil fuels (oil, gas, and coal). One is the total fossil fuel consumption, which quantifies the total fossil fuel-derived primary energy consumed on average for the production of each unit of electricity (PSI, 2008). Similarly, indicators such as proportion of electricity generated
RESEARCH REPORT MARCH 2014A Financially Sustainable Power Sector: Developing assessment methodologies 21
from fossil fuels and proportion of electricity generated from renewables (hydro, wind, solar, tidal, and geothermal sources) reflect the diversification of the power sector between renewable and non-renewable sources. The results of these indicators are displayed in Figure 14. Many countries remain dependent on fossil fuels for their electricity production. Indeed, 61 per cent (83 out of 136) derive more than 50 per cent of their electricity from fossil fuels. Conversely, among the 123 countries which produce some electricity from renewables, the average renewable power generation is about 37 per cent of total electricity generated.
FIGURE 14. ELECTRICITY GENERATION FROM FOSSIL FUELS (OIL, GAS, AND COAL) AND RENEWABLES IN 2010Source: The World Bank (n.d.b).
Notes: N=136
RESEARCH REPORT MARCH 2014A Financially Sustainable Power Sector: Developing assessment methodologies 22
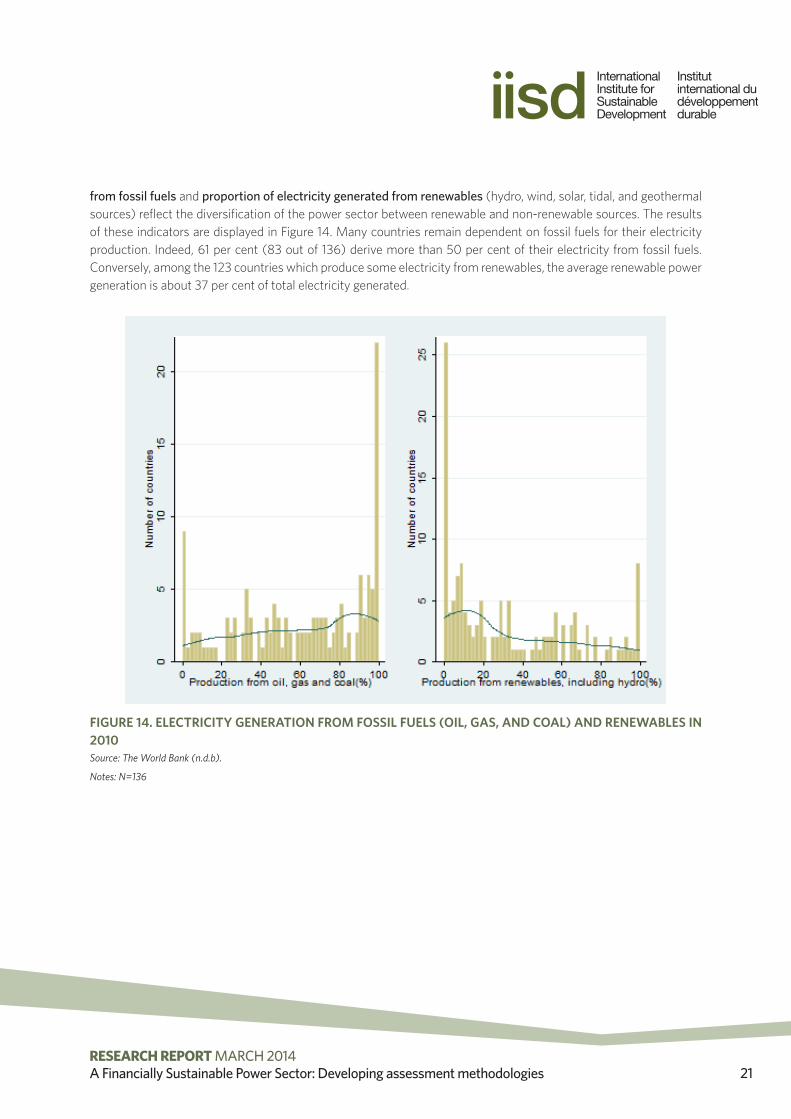
The low proportion of electricity generated from renewables is understandable given that the renewable power capacity in many countries remains low. As shown in Figure 15, among the 168 countries with some renewable capacity this accounted for only 36 per cent of their total installed capacity.
FIGURE 15. RENEWABLE POWER CAPACITY IN 2009Source: United Nations, United Nations Statistics.
Notes: N=225; renewables include hydro, solar, wind, tidal, and geothermal sources.
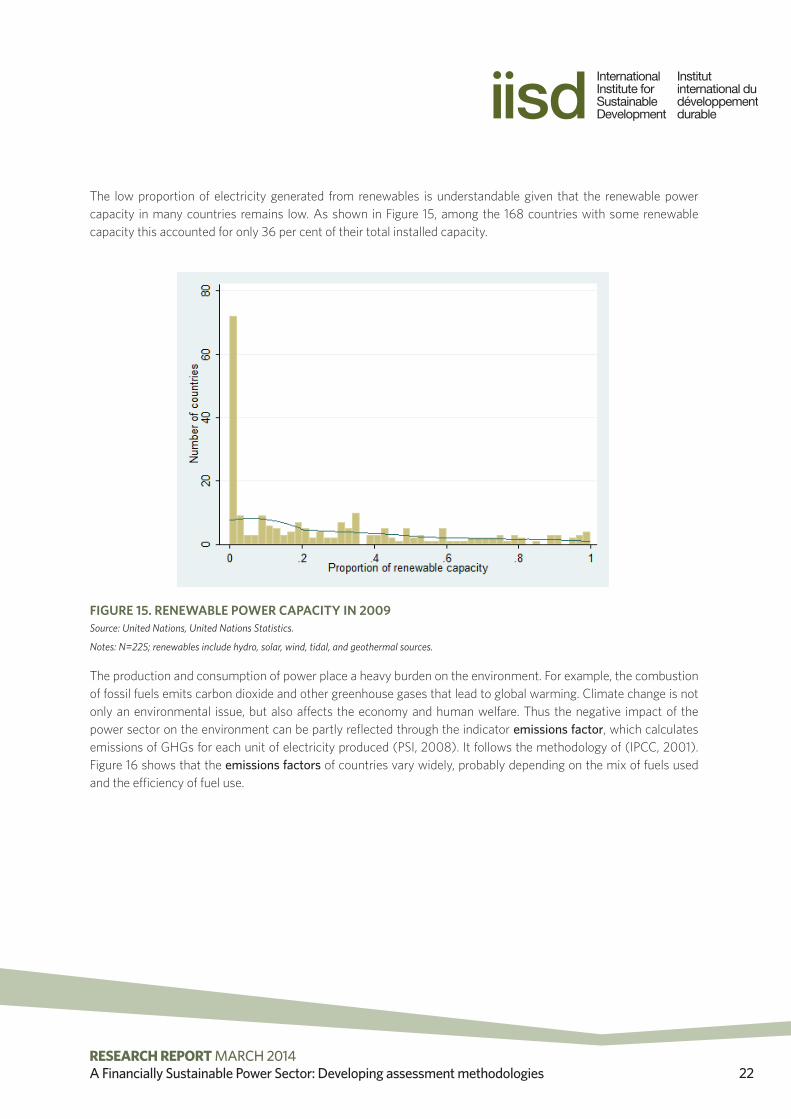
The production and consumption of power place a heavy burden on the environment. For example, the combustion of fossil fuels emits carbon dioxide and other greenhouse gases that lead to global warming. Climate change is not only an environmental issue, but also affects the economy and human welfare. Thus the negative impact of the power sector on the environment can be partly reflected through the indicator emissions factor, which calculates emissions of GHGs for each unit of electricity produced (PSI, 2008). It follows the methodology of (IPCC, 2001). Figure 16 shows that the emissions factors of countries vary widely, probably depending on the mix of fuels used and the efficiency of fuel use.
RESEARCH REPORT MARCH 2014A Financially Sustainable Power Sector: Developing assessment methodologies 23
FIGURE 16. EMISSIONS FACTOR IN 2010Source: The World Bank (n.d.b).
Note: N=134 (excluding outliers)
To go further into the environmental impact of the power sector, one can also measure the actual damage the sector causes to the ecosystems, although attribution can be difficult. This can include the loss of biodiversity due to land use, ecotoxicity (presence of toxic substances) and acidification and/or eutrophication (emission of substances to air, water and soil). These indicators quantify the loss of species (flora & fauna) for the production of one unit of electricity in terms of “Potentially Disappeared Fraction (of species), PDF” (PSI, 2008). Other environmental effects may also be the negative impact that the power infrastructure has on the quality of the landscape and residential areas (e.g., noise and traffic).
RESEARCH REPORT MARCH 2014A Financially Sustainable Power Sector: Developing assessment methodologies 24
5.0 Implications for Policy-MakingThis paper lays out the methodology to evaluate the financial viability of the power sector based on a set of four criteria: (1) ability to recover costs; (2) ability to reliably meet demand; (3) ability to make investments; and (4) ability to operate according to environmental and social norms. Each criterion is then judged through a range of variables that are selected based on their relevance to the financial health of the system and the possibility that they can be captured with existing data. It should be noted, however, that the list is in no way exhaustive. Rather, it initiates a discussion for policy-makers to identify which indicators they find most appropriate to assess the performance of the power sector in their countries. The effort to identify and measure these indicators will help draw out conclusions about the sector and highlight areas that require attention. There should also be awareness that these indicators may be reflected differently for countries due to the differences in their development level, endowments, and technical competence.
More importantly, these indicators not only provide a snapshot of the situation of the power sector at one point in time but also show progress of the sector, if consistently tracked over time. The dynamic trend is just as important to judge the success (or potential success) of the power sector. By showcasing these indicators, this paper also hopes to underline the importance of collecting data on the performance of the power sector. Only through regular monitoring can countries identify any distortions in their power sector and make informed decisions to improve its efficiency and impact, hence assuring the sector’s financial sustainability.
RESEARCH REPORT MARCH 2014A Financially Sustainable Power Sector: Developing assessment methodologies 25
ReferencesAntmann, P. (2009). Reducing technical and non-technical losses in the power sector (Background Paper for the World Bank Group Energy Sector Strategy). Washington, DC: World Bank. Retrieved from http://siteresources.worldbank.org/EXTESC/Resources/Background_paper_Reducing_losses_in_the_power_sector.pdf
Banerjee, S. Wodon, Q., Diallo, A. Pushak,T., Uddin,H., Tsimpo, C., & Foster, V. (2008). Access, affordability, and alternatives: Modern infrastructure services in Africa (Background Paper 2, Africa Infrastructure Sector Diagnostic). Washington, DC: The World Bank. Retrieved from http://www.eu-africa-infrastructure-tf.net/attachments/library/aicd-background-paper-2-hhs-summary-en.pdf
Beaton, C., Gerasimchuk, I., Laan, T., Lang, K., Vis-Dunbar, D., & Wooders, P. (2013). A guidebook to fossil-fuel subsidy reform for policy-makers in Southeast Asia. Geneva: International Institute for Sustainable Development. Retrieved from http://www.iisd.org/publications/pub.aspx?id=2801
Briceño-Garmendia, C., & Shkaratan, M. (2011). Power tariffs: Caught between cost recovery and affordability (World Bank Policy Research Working Paper 5904). Washington, DC: The World Bank. Retrieved from http://elibrary.worldbank.org/doi/book/10.1596/1813-9450-5904
Deutsche Gesellschaft für Technische Zusammenarbeit (GTZ) (2010). Power in G-20 and N-11 countries – At what cost? Overview of electricity tariffs. Bonn: German Technical Corporation.
Ebinger, J. O. (2006). Measuring financial performance in infrastructure: An application to Europe and Central Asia (World Bank Policy Research Working Paper 3992). Washington, DC: The World Bank. Retrieved from https://openknowledge.worldbank.org/handle/10986/9295
Edenhofer, O., Hirth, L., Knopf, B., Pahle, M., Schlömer, S., Schmid, E., & Ueckerdt, F. (2013). On the economics of renewable energy. Energy Economics, 40, S12–S23.
Energy Information Administration (EIA). (2013). “Levelized cost of new generation resources.” In Annual Energy Outlook 2013. Washington, DC: U.S. Energy Information Administration. Retrieved from http://www.eia.gov/forecasts/aeo/pdf/0383(2013).pdf
Foster, V. (2000). Measuring the impact of power reform: Practical options (Public Policy for the Private Sector Note 210). Washington, DC: The World Bank. Retrieved from http://siteresources.worldbank.org/EXTFINANCIALSECTOR/Resources/282884-1303327122200/210foste.pdf
Foster, V. & Tre, J.-P. (2000). Measuring the impact of power interventions on the poor: An illustration from Guatemala. London: Infrastructure for Development: Private Solutions and the Poor. Retrieved from http://siteresources.worldbank.org/INTPSIA/Resources/490023-1120845825946/guatemala_impact_of_energy_reform.pdf
International Energy Agency (IEA). (2012). World energy outlook - Methodology for power access analysis. Paris: International Energy Agency, OECD.
IEA. (2013). World Energy Model. Retrieved from http://www.worldenergyoutlook.org/weomodel/worldenergymodel/
International Monetary Fund (IMF). (2013). Energy subsidy reform: Lessons and implications. Washington, DC: International Monetary Fund.

RESEARCH REPORT MARCH 2014A Financially Sustainable Power Sector: Developing assessment methodologies 26
Intergovernmental Panel on Climate Change (IPCC). (2001). The scientific basis: Contribution of Working Group I to the Third Assessment Report of the Intergovernmental Panel on Climate Change. J. T. Houghton, Y. Ding, D.J. Griggs, M. Noguer, P.J. van der Linden, X. Dai, K. Maskell, & C.A. Johnson (Eds.). Cambridge and New York: Cambridge University Press.
Jamasb, T., Mota, R., Newbery, D. & Pollitt, M. (2005). Electricity sector reform in developing countries: A survey of empirical evidence on determinants and performance (World Bank Policy Research Working Paper 3549). Washington, DC: The World Bank.
Kojima, M. (2013, April). Petroleum product pricing and complementary policies: Experience of 65 developing countries since 2009. Washington, DC: The World Bank. Retrieved from http://elibrary.worldbank.org/doi/pdf/10.1596/1813-9450-6396
Koplow, D. (2009). Measuring energy subsidies using the price-gap approach: What does it leave out? Geneva: The International Institute for Sustainable Development.
Paul Scherrer Institut (PSI). (2008). Final set of sustainability criteria and indicators for assessment of electricity supply options. Deliverable n° D3.2 – RS 2b, Project NEEDS - New Power Externalities Developments for Sustainability. Villigen: Paul Scherrer Institut.
Sovacool, Benjamin K. (2012). The political economy of energy poverty: A review of key challenges. Power for Sustainable Development, 16, 272–282.
Tallapragada, P., Shkaratan, M., Izaguirre, A.K., Helleranta, J., Rahman, S., & Bergman, S. (2009). Monitoring performance of electric utilities: Indicators and benchmarking in Sub-Saharan Africa. Washington, DC: The World Bank. Retrieved from http://www.esmap.org/sites/esmap.org/files/P099234_AFR_Monitoring%20Performance%20of%20Electric%20Utilities_Tallapragada_0.pdf
Wamukonya, N. (2003). Power sector reform in developing countries: Mismatched agendas. Power Policy, 31, 1273–1289.
World Bank. (n.d.a). Enterprise surveys. Retrieved from http://data.worldbank.org/data-catalog/enterprise-surveys
World Bank. (n.d.b). World development indicators. Retrieved from http://data.worldbank.org/data-catalog/world-development-indicators
World Bank (2011). Revisiting policy options on the market structure in the power sector. Washington, DC: The World Bank. Retrieved from http://www.esmap.org/sites/esmap.org/files/study%20on%20energy%20sector.pdf
World Bank (2013). Global tracking framework: Sustainable energy for all, Vol. 1. Washington DC: The World Bank.

RESEARCH REPORT MARCH 2014A Financially Sustainable Power Sector: Developing assessment methodologies 27
Annex A. Summary of IndicatorsTABLE 2. INDICATORS OF POWER SECTOR FINANCIAL VIABILITY AND DATA SOURCES
CRITERION INDICATOR DEFINITION FORMULADATA REQUIRED
ENTERPRISE DATA HOUSEHOLD SURVEYS MACRO DATA
Ability to cover costs
Electricity generation unit costs
Costs of producing one unit of electricity for each type of fuel (US$/kWh)
Total generation costsi / electricity generatedi
(For each “i,” where “i” is a fuel type)
– Total costs for each fuel type (US$)– Electricity generated for each fuel type (kWh)
Levelized Cost of Electricity (LCOE)
Average costs of each unit of electricity produced over the lifetime of a plant (US$/kWh)
Levelized capital costs + fixed and variable O&M costs + financing costs
Cost structure of power plants
Fuel costs Costs of fuel per unit of electricity for each type of fuel (US$/kWh)
Total fuel costsi/ electricity generatedi
(For each “i,” where “i” is a fuel type)
– Fuel costs for each fuel type (US$)– Electricity generated for each fuel type (kWh)
Fuel costs adjusted for hedging costs
Costs of fuel per unit of electricity for each type of fuel, adjusted for hedging costs (US$/kWh)
(Total fuel costsi + hedging costsi)/ electricity generatedi
(For each “i,” where “i” is a fuel type)
– Fuel costs for each fuel type (US$)– Hedging costs (US$)– Electricity generated for each fuel type (kWh)
System LCOE Average costs of each unit of electricity produced, adjusted for integration risks (US$/kWh)
LCOE + profile costs + balancing costs + grid-related costs
Cost structure of power plants
Overall electricity generation unit costs
Costs of producing one unit of electricity (US$/kWh)
Generation unit cost i * electricity generatedi / total electricity generated(For each “i,” where “i” is a fuel type)
– Total costs for each fuel type (US$)– Electricity generated for each fuel type (kWh)
Retail unit costs Costs of supplying one unit of electricity (US$/kWh)
Overall generation unit costs + transmission and distribution unit costs + taxes (if applicable)
Generation, transmission and distribution unit costs (US$/kWh)
O&M as part of total costs
O&M as part of total costs (%)
Total O&M costs/total costs
Generation, transmission, distribution and O&M costs (US$)
System losses Losses of electricity during transmission and distribution (%)
(Electricity generated–electricity sold) /electricity generated
– Electricity generated (MWh)– Electricity sold (MWh)
Technical losses Losses due to power dissipation (%)
(Electricity generated– electricity distributed) /electricity generated
– Electricity generated (MWh) – Electricity distributed (MWh)

RESEARCH REPORT MARCH 2014A Financially Sustainable Power Sector: Developing assessment methodologies 28
CRITERION INDICATOR DEFINITION FORMULADATA REQUIRED
ENTERPRISE DATA HOUSEHOLD SURVEYS MACRO DATA
Ability to cover costs
Non-technical losses Foregone revenue due to illegal connections or nonpayment (%)
((Electricity consumed – electricity billed)*average tariff – bad debt provision)/total sale revenues
– Power consumed (kWh) – Electricity billed (kWh) – Average tariff (US$/kWh) – Total sale revenues (US$)
Revenues Total revenues from power sales (US$)
Unit price * power consumed
– Domestic prices (US$/kWh)– Total fuel consumption (kWh)
Revenues by sector Total revenues from power sales by sector (US$)
Unit pricej * power consumedj
(For each “j,” where “j” is a sector)
– Domestic prices by sector (US$/kWh)– Total fuel consumption by sector (kWh)
Average tariff End-user price for each unit of electricity (US$/kWh)
Revenue from total power sales/total power sales
– Revenue from power sales (US$)– Total power sales (kWh)
Average tariffs by sector
End-user prices for each unit of electricity by sector (US$/kWh)
Revenue from sector power salesj/sector power salesi
(For each j, where j is a sector)
– Revenue from power sales by sector (US$)– Total power sales by sector (kWh)
Tariff settings and adjustments
The autonomy the suppliers have on tariffs and tariff structure
Government regulations
Opportunity costs Difference between reference and actual prices (US$/kWh)
End-user domestic price – reference price
Domestic and reference fuel prices (US$/kWh)
Net profits/losses Difference between total costs and revenues (US$)
Total revenues – total costs
– Total revenues (US$)– Total costs (US$)
Profit margin Ratio of net profits/losses over revenues
(Total revenues – total costs)/ total revenues
– Total revenues (US$)– Total costs (US$)
Debt ratio Proportion of debt relative to assets
Total debts/total assets
– Total debts (US$)– Total assets (US$)
Current ratio Proportion of current assets relative to current liabilities
Current assets/current liabilities
– Current assets (US$)– Current liabilities (US$)
Ability to reliably meet demand
Ratio of installed capacity to demand
The extent to which installed capacity meets demand
Total installed capacity*8,766 (hours/year) /total demand
Total installed capacity (MW)
Total demand (MWh)
Power intensity Amount of electricity needed per each unit of GDP (kWh/US$)
Total power consumed/ GDP
– GDP– Total power consumed (kWh)
Reserve margin Available capacity above the capacity needed to meet peak demand (%)
(Max capacity*8766 (hours/year) -max demand) / (max capacity*8766 (hours/year))
– Total installed capacity (MW)
– Peak demand (MWh)
Plant dispatch cost The variable cost to run a power plant (US$/kWh)
Variable O&M costs + fuel costs
– Variable O&M costs (US$/kWh)- Fuel costs (US$/kWh)
RESEARCH REPORT MARCH 2014A Financially Sustainable Power Sector: Developing assessment methodologies 29
CRITERION INDICATOR DEFINITION FORMULADATA REQUIRED
ENTERPRISE DATA HOUSEHOLD SURVEYS MACRO DATA
Ability to reliably meet demand
Capacity factor Ratio of actual production over installed capacity
Actual generation/ (total installed capacity*8,766 (hours/year))
– Total generation (MWh)– Total installed capacity (MW)
Equivalent availability factor
Fraction of time a power plant is in principle available for service
Possible generation/(total installed capacity*8,766 (hours/year))
– Possible generation (MWh) – Total installed capacity (MW)
Operating ratio Ratio of operating to installed capacity
Operating capacity/installed capacity
– Total operating capacity (MW)– Total installed capacity (MW)
Net power imports Power imports as a share of consumption (%)
Total power imported/total power consumed
– Total power imported (MWh)– Total power consumed (MWh)
Value of net power imports
Ratio of the value of net power imports to GDP
Value of net power imports/GDP
– Value of power imports (US$)– GDP (US$)
Reliability index Share of the time consumers can access power (%)
Amount of time power is accessible/amount of time power is needed
– Hours of power access– Hours of power needed
Number of outages Number of outages caused by generation or network failures
Number of outages per month
– Number of outages per month
Ability to make investments
Capacity growth Changes in installed capacity (%)
(Installed capacityt
– Installed capacityt-1)/ Installed capacityt-1
(Where t is the year)
– Installed capacity by year (MW)
Investment expenditure growth
Changes in investment expenditure (%)
(Expenditure for investmentt - investment expenditure t-1)/ investment expenditure t-1
(Where t is the year)
– Expenditure for investment (US$)
Ratio of installed capacity to demand growth
The extent to which installed capacity grows meets demand increase
Total installed capacity growth/total demand growth
Installed capacity by year (MW)
Total demand by year (MWh)
Social performance
Access to electricity Proportion of the population having connection to electricity and consumption of a specified minimum level of electricity (%)
Number of households with access to electricity /total population
Number of households with access to electricity
Population
Household electrification rate
Proportion of the population with access to electricity (%)
Number of households connected to electricity/total population
Number of households with access to electricity
Population
Household electricity consumption
Average amount of electricity consumed by households (kWh)
Total electricity consumption/ number of households with electricity
– Household electricity consumption (kWh)– Number of households with access to electricity
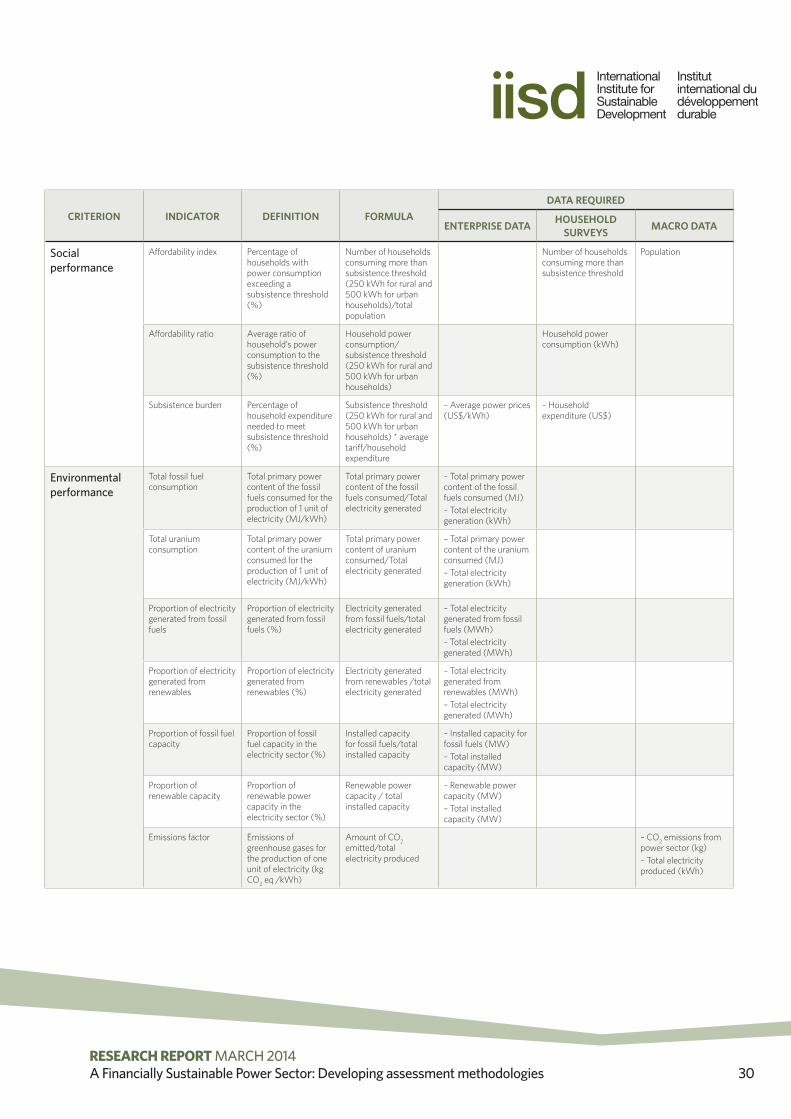
RESEARCH REPORT MARCH 2014A Financially Sustainable Power Sector: Developing assessment methodologies 30
CRITERION INDICATOR DEFINITION FORMULADATA REQUIRED
ENTERPRISE DATA HOUSEHOLD SURVEYS MACRO DATA
Social performance
Affordability index Percentage of households with power consumption exceeding a subsistence threshold (%)
Number of households consuming more than subsistence threshold (250 kWh for rural and 500 kWh for urban households)/total population
Number of households consuming more than subsistence threshold
Population
Affordability ratio Average ratio of household’s power consumption to the subsistence threshold (%)
Household power consumption/subsistence threshold (250 kWh for rural and 500 kWh for urban households)
Household power consumption (kWh)
Subsistence burden Percentage of household expenditure needed to meet subsistence threshold (%)
Subsistence threshold (250 kWh for rural and 500 kWh for urban households) * average tariff/household expenditure
– Average power prices (US$/kWh)
– Household expenditure (US$)
Environmental performance
Total fossil fuel consumption
Total primary power content of the fossil fuels consumed for the production of 1 unit of electricity (MJ/kWh)
Total primary power content of the fossil fuels consumed/Total electricity generated
– Total primary power content of the fossil fuels consumed (MJ)– Total electricity generation (kWh)
Total uranium consumption
Total primary power content of the uranium consumed for the production of 1 unit of electricity (MJ/kWh)
Total primary power content of uranium consumed/Total electricity generated
– Total primary power content of the uranium consumed (MJ)– Total electricity generation (kWh)
Proportion of electricity generated from fossil fuels
Proportion of electricity generated from fossil fuels (%)
Electricity generated from fossil fuels/total electricity generated
– Total electricity generated from fossil fuels (MWh)– Total electricity generated (MWh)
Proportion of electricity generated from renewables
Proportion of electricity generated from renewables (%)
Electricity generated from renewables /total electricity generated
– Total electricity generated from renewables (MWh)– Total electricity generated (MWh)
Proportion of fossil fuel capacity
Proportion of fossil fuel capacity in the electricity sector (%)
Installed capacity for fossil fuels/total installed capacity
– Installed capacity for fossil fuels (MW)– Total installed capacity (MW)
Proportion of renewable capacity
Proportion of renewable power capacity in the electricity sector (%)
Renewable power capacity / total installed capacity
– Renewable power capacity (MW)– Total installed capacity (MW)
Emissions factor Emissions of greenhouse gases for the production of one unit of electricity (kg CO2 eq /kWh)
Amount of CO2 emitted/total electricity produced
– CO2 emissions from power sector (kg)– Total electricity produced (kWh)
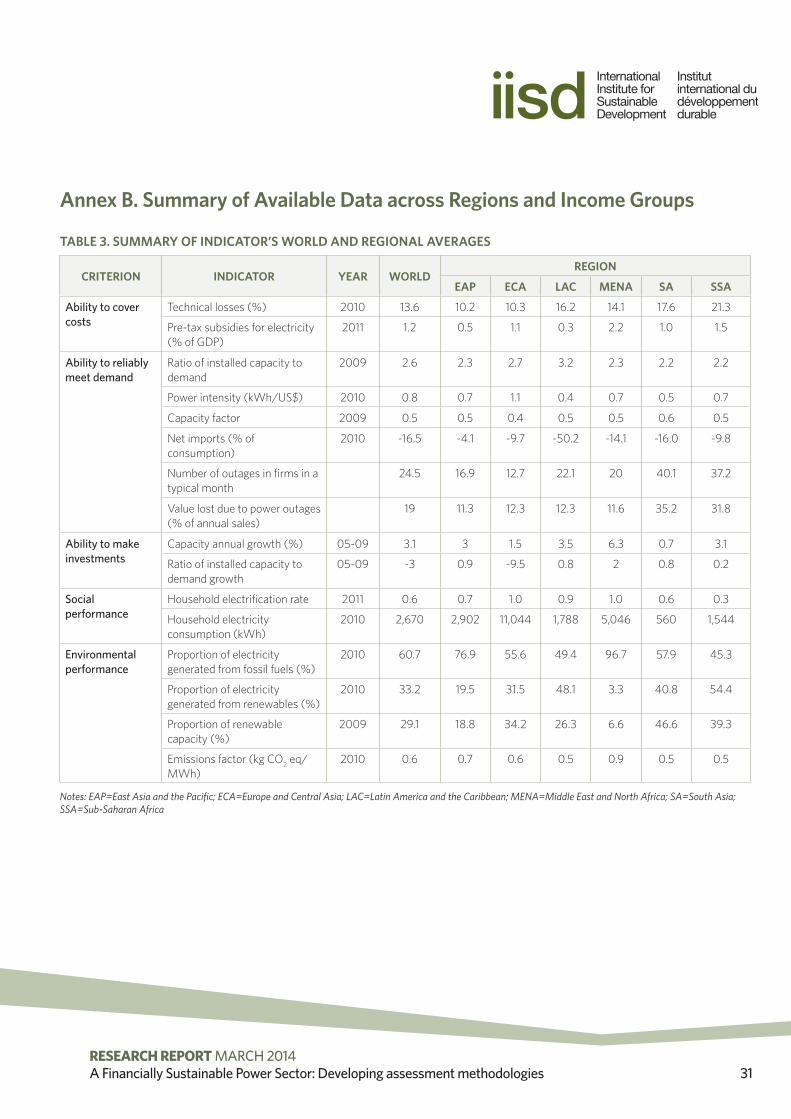
RESEARCH REPORT MARCH 2014A Financially Sustainable Power Sector: Developing assessment methodologies 31
Annex B. Summary of Available Data across Regions and Income Groups
TABLE 3. SUMMARY OF INDICATOR’S WORLD AND REGIONAL AVERAGES
CRITERION INDICATOR YEAR WORLDREGION
EAP ECA LAC MENA SA SSA
Ability to cover costs
Technical losses (%) 2010 13.6 10.2 10.3 16.2 14.1 17.6 21.3
Pre-tax subsidies for electricity (% of GDP)
2011 1.2 0.5 1.1 0.3 2.2 1.0 1.5
Ability to reliably meet demand
Ratio of installed capacity to demand
2009 2.6 2.3 2.7 3.2 2.3 2.2 2.2
Power intensity (kWh/US$) 2010 0.8 0.7 1.1 0.4 0.7 0.5 0.7
Capacity factor 2009 0.5 0.5 0.4 0.5 0.5 0.6 0.5
Net imports (% of consumption)
2010 -16.5 -4.1 -9.7 -50.2 -14.1 -16.0 -9.8
Number of outages in firms in a typical month
24.5 16.9 12.7 22.1 20 40.1 37.2
Value lost due to power outages (% of annual sales)
19 11.3 12.3 12.3 11.6 35.2 31.8
Ability to make investments
Capacity annual growth (%) 05-09 3.1 3 1.5 3.5 6.3 0.7 3.1
Ratio of installed capacity to demand growth
05-09 -3 0.9 -9.5 0.8 2 0.8 0.2
Social performance
Household electrification rate 2011 0.6 0.7 1.0 0.9 1.0 0.6 0.3
Household electricity consumption (kWh)
2010 2,670 2,902 11,044 1,788 5,046 560 1,544
Environmental performance
Proportion of electricity generated from fossil fuels (%)
2010 60.7 76.9 55.6 49.4 96.7 57.9 45.3
Proportion of electricity generated from renewables (%)
2010 33.2 19.5 31.5 48.1 3.3 40.8 54.4
Proportion of renewable capacity (%)
2009 29.1 18.8 34.2 26.3 6.6 46.6 39.3
Emissions factor (kg CO2 eq/MWh)
2010 0.6 0.7 0.6 0.5 0.9 0.5 0.5
Notes: EAP=East Asia and the Pacific; ECA=Europe and Central Asia; LAC=Latin America and the Caribbean; MENA=Middle East and North Africa; SA=South Asia; SSA=Sub-Saharan Africa
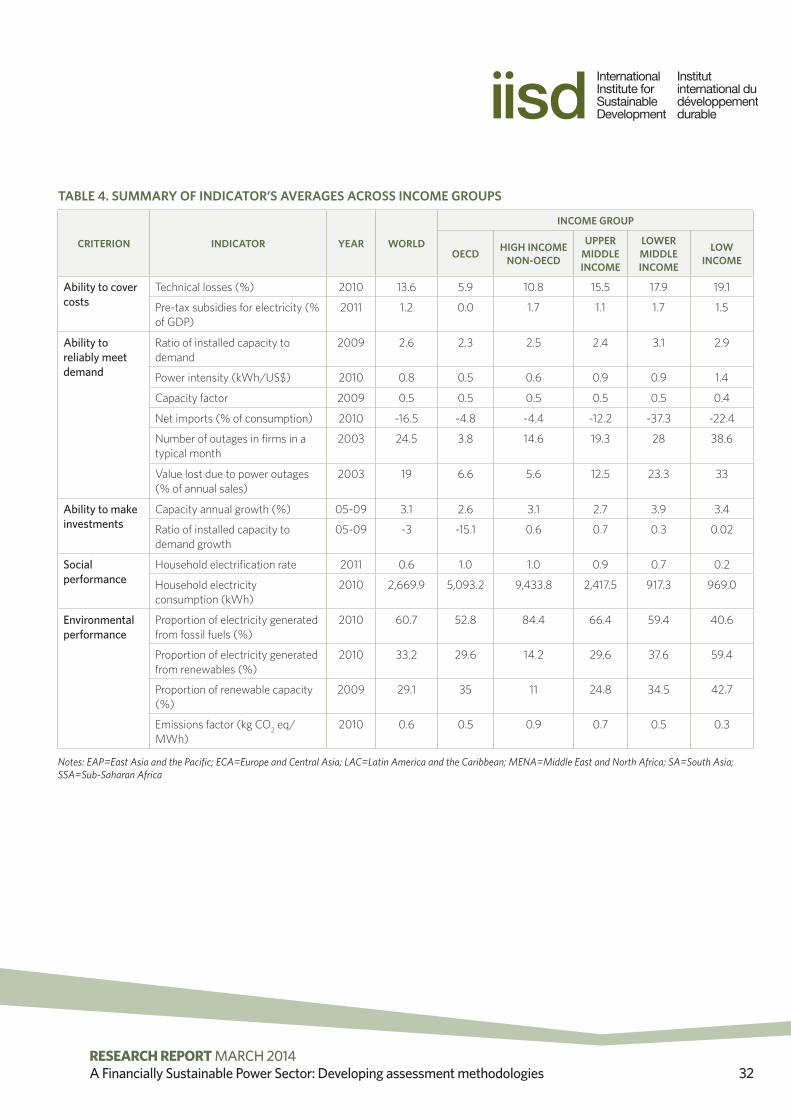
RESEARCH REPORT MARCH 2014A Financially Sustainable Power Sector: Developing assessment methodologies 32
TABLE 4. SUMMARY OF INDICATOR’S AVERAGES ACROSS INCOME GROUPS
CRITERION INDICATOR YEAR WORLD
INCOME GROUP
OECD HIGH INCOME NON-OECD
UPPER MIDDLE INCOME
LOWER MIDDLE INCOME
LOW INCOME
Ability to cover costs
Technical losses (%) 2010 13.6 5.9 10.8 15.5 17.9 19.1
Pre-tax subsidies for electricity (% of GDP)
2011 1.2 0.0 1.7 1.1 1.7 1.5
Ability to reliably meet demand
Ratio of installed capacity to demand
2009 2.6 2.3 2.5 2.4 3.1 2.9
Power intensity (kWh/US$) 2010 0.8 0.5 0.6 0.9 0.9 1.4
Capacity factor 2009 0.5 0.5 0.5 0.5 0.5 0.4
Net imports (% of consumption) 2010 -16.5 -4.8 -4.4 -12.2 -37.3 -22.4
Number of outages in firms in a typical month
2003 24.5 3.8 14.6 19.3 28 38.6
Value lost due to power outages (% of annual sales)
2003 19 6.6 5.6 12.5 23.3 33
Ability to make investments
Capacity annual growth (%) 05-09 3.1 2.6 3.1 2.7 3.9 3.4
Ratio of installed capacity to demand growth
05-09 -3 -15.1 0.6 0.7 0.3 0.02
Social performance
Household electrification rate 2011 0.6 1.0 1.0 0.9 0.7 0.2
Household electricity consumption (kWh)
2010 2,669.9 5,093.2 9,433.8 2,417.5 917.3 969.0
Environmental performance
Proportion of electricity generated from fossil fuels (%)
2010 60.7 52.8 84.4 66.4 59.4 40.6
Proportion of electricity generated from renewables (%)
2010 33.2 29.6 14.2 29.6 37.6 59.4
Proportion of renewable capacity (%)
2009 29.1 35 11 24.8 34.5 42.7
Emissions factor (kg CO2 eq/MWh)
2010 0.6 0.5 0.9 0.7 0.5 0.3
Notes: EAP=East Asia and the Pacific; ECA=Europe and Central Asia; LAC=Latin America and the Caribbean; MENA=Middle East and North Africa; SA=South Asia; SSA=Sub-Saharan Africa
www.iisd.org © 2014 The International Institute for Sustainable Development
Published by the International Institute for Sustainable Development
International Institute for Sustainable DevelopmentHead Office161 Portage Avenue East, 6th Floor, Winnipeg, Manitoba, Canada R3B 0Y4Tel: +1 204 958-7700 | Fax: +1 204 958-7710 | Website: www.iisd.org
IISD Geneva OfficeInternational Environment House 2, 9 chemin de Balexert, 1219 Châtelaine, Geneva SwitzerlandTel: +41 22 917-8683 | Fax: +41 22 917-8054 |