a distributed dynamic model of a monolith hydrogen membrane reactor
TRANSCRIPT

Energy Conversion and Management 67 (2013) 160–170
Contents lists available at SciVerse ScienceDirect
Energy Conversion and Management
journal homepage: www.elsevier .com/locate /enconman
A distributed dynamic model of a monolith hydrogen membrane reactor
Finn Are Michelsen a,⇑, Øivind Wilhelmsen b, Lei Zhao c, Knut Ingvar Åsen d
a SINTEF ICT, Applied Cybernetics, NO-7491 Trondheim, Norwayb SINTEF Energy Research, NO-7465 Trondheim, Norwayc NTNU, Department of Engineering Cybernetics, NO-7491 Trondheim, Norwayd Statoil, Forskningsparken, NO-3908 Porsgrunn, Norway
a r t i c l e i n f o
Article history:Received 18 January 2011Received in revised form 6 November 2012Accepted 7 November 2012Available online 23 December 2012
Keywords:Dynamic modelNatural gas processingSteam methane reformingHydrogen membrane reforming
0196-8904/$ - see front matter � 2012 Elsevier Ltd. Ahttp://dx.doi.org/10.1016/j.enconman.2012.11.001
⇑ Corresponding author. Tel.: +47 93059361.E-mail addresses: [email protected] (F.A. M
sintef.no (Ø. Wilhelmsen), [email protected] (L. Zhao), knas
a b s t r a c t
This paper describes a distributed mechanistic dynamic model of a hydrogen membrane reformer unit(HMR) used for methane steam reforming. The model is based on a square channel monolith structureconcept, where air flows adjacent to a mix of natural gas and water distributed in a chess pattern of chan-nels. Combustion of hydrogen gives energy to the endothermic steam reforming reactions. The model isused for both steady state and dynamic analyses. It therefore needs to be computationally attractive, butstill include enough complexity to study the important steady state and dynamic features of the process.Steady-state analysis of the model gives optimum for the steam to carbon and steam to oxygen ratios,where the conversion of methane is 92% and the hydrogen used as energy for the endothermic reactionsis 28% at the nominal optimum. The dynamic analysis shows that non-linear control schemes may benecessary for satisfactory control performance.
� 2012 Elsevier Ltd. All rights reserved.
1. Introduction
This paper describes a distributed mechanistic dynamic modelfor a hydrogen membrane reformer (HMR) using a square channelmonolith structure concept.
The model is used for two purposes. First, a thorough under-standing of the HMR-unit is essential for the proceeding studywhich will involve operability analysis. Secondly, the model willbe used for model reduction for the purpose of that operabilityanalysis. For these purposes it is important that the model reflectsthe dynamic and steady state behavior of the process well, is com-putationally attractive and that the model is causal (i.e. describescause and effect relationships dependent on past input values).We describe a dynamic two-dimensional mathematical modelbased on first principles. The model has been validated with thein-house steady state Aspen Plus simulations based on studies atStatoil ASA and a steady-state model by Mejdell and Morud [1].The model has then been used for subsequent analysis.
HMR units belong to a class of chemical reactors known as cat-alytic membrane reactors. These process-units use natural gas(NG) as energy source, with methane as the main component.The desired product is hydrogen, which can either be used as anenergy carrier, for subsequent manufacturing or for clean powerproduction. This work is based on the HMR concept proposed by
ll rights reserved.
ichelsen), oivind.Wilhelmsen@@statoil.com (K.I. Åsen).
Aasen et al. [2]. The reactor performs steam methane reforming(SMR) where necessary heat to the endothermic SMR reactions issupplied by a H2 separating membrane and a combustion chamberwhich burns the separated H2 with supplied air. Complete conver-sion of methane and high yield of hydrogen can be achieved withthese processes [3]. Application of these reactors in power pro-cesses is new concept that has emerged with the need to captureand store CO2 to prevent global warming. These processes areknown as a pre-combustion decarbonization type, which meansthat CO2 is separated before combustion and the remaining fuelis a H2 rich gas.
Models of tubular HMR-units have been published in the liter-ature previously. Johannessen and Jordal [4] presented a onedimensional steady-state model of a three-channel unit includingheat exchange with the exhaust gas. Their objective was to inves-tigate its behavior at operating conditions which could be relevantfor power processes with CO2 capture. Wilhelmsen et al. included adetailed membrane-reactor in simulations of a power process [5].Aasen et al. [2] studied a steady state model of the present process,while Zhao et al. [6] studied a simplified dynamic model of thisunit integrated with a power process with CO2 capture. Many stud-ies have focused at the steady-state behavior of one-dimensionalHMR-reactor, for instance Marigliano et al. [7], Basile et al. [8]and Patel and Sunol [9], but few papers have dealt with two-dimensional transfer across the membrane in membrane reactorsBarbieri et al. [10], or investigated the dynamic behavior of thesesystems such as Fu and Wu [11]. This work adds to the previousknowledge in that a dynamic analysis is presented of the novel
F.A. Michelsen et al. / Energy Conversion and Management 67 (2013) 160–170 161
square channel monolith structure concept where two dimen-sional phenomena across the membrane are taken into account.
The paper is structured as follows. Section 2 describes the HMRunit. Section 3 outlines the model. Numerical issues are describedin Section 4, and parameter values are given in Appendix. Steady-state characteristics are shown in Section 5. In Section 6 the impor-tant dynamic qualities are shown based on step response simula-tions. In Section 7, the main results are discussed and concludingremarks are given in Section 8.
x N2, O2Sweep gas bulk layer
Reaction front for HC
2. Process description
In the present process to produce synthesis gas (syngas), the NGis first saturated with steam and pre-reformed at about 500 �C inorder to convert all the heavier hydrocarbons to methane. Theresulting process gas, consisting of H2O, CO, CO2, H2, and CH4, isthen further heated and reformed to convert as much methaneto hydrogen as possible in the HMR unit. This is made at the reten-tate side of the hydrogen conducting membranes by SMR at about1000 �C.
Compressed air is supplied to the permeate side of the HMRreactor as sweep gas. Permeated hydrogen is combusted, consum-ing approximately all oxygen in the air stream. This gives ‘‘CO2
free’’ heat for the endothermic SMR reactions. The main reactionsare given by:
CH4 þH2O ¼ COþ 3H2 ðSMRÞ
COþH2O ¼ CO2 þH2 ðWGSÞ
CH4 þ 2H2O ¼ CO2 þ 4H2 ðSMR þWGSÞ
2H2 þ O2 ¼ 2H2O ðH2 combustion ðHCÞÞ
The syngas is generated with high concentrations of H2, CO2 andCO. The outlet gas (exhaust gas) from the permeate side containsnormally mainly H2O and N2.
Reformer temperatures and pressures must be kept at a safe le-vel such that the reformer catalyst and membrane layers are notdamaged. Specifically, it is essential that the pressure differencebetween the two sides of the membrane is as low as possible in or-der to reduce the risk for any leakage. Slightly sweep gas overpres-sure is advantageous to avoid carbon leakage and thus reduced CO2
capture capability. This is controlled by the inlet pressures.The HMR reactor concept is based on a square channel monolith
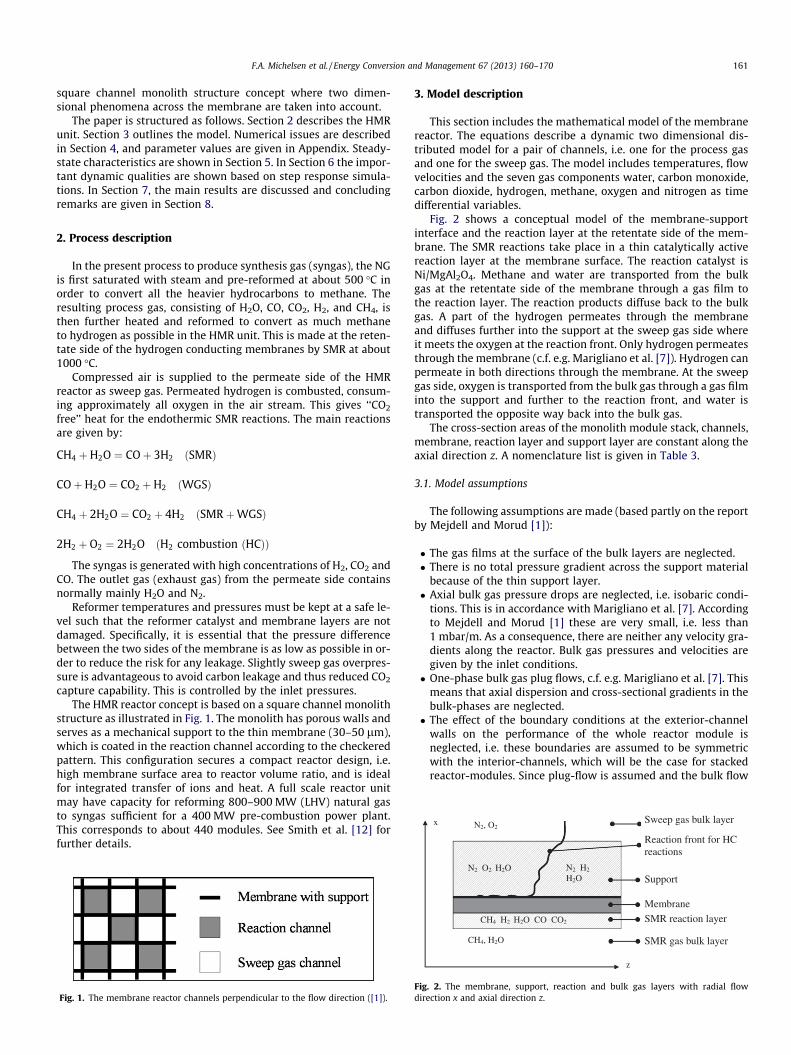
structure as illustrated in Fig. 1. The monolith has porous walls andserves as a mechanical support to the thin membrane (30–50 lm),which is coated in the reaction channel according to the checkeredpattern. This configuration secures a compact reactor design, i.e.high membrane surface area to reactor volume ratio, and is idealfor integrated transfer of ions and heat. A full scale reactor unitmay have capacity for reforming 800–900 MW (LHV) natural gasto syngas sufficient for a 400 MW pre-combustion power plant.This corresponds to about 440 modules. See Smith et al. [12] forfurther details.
Fig. 1. The membrane reactor channels perpendicular to the flow direction ([1]).
3. Model description
This section includes the mathematical model of the membranereactor. The equations describe a dynamic two dimensional dis-tributed model for a pair of channels, i.e. one for the process gasand one for the sweep gas. The model includes temperatures, flowvelocities and the seven gas components water, carbon monoxide,carbon dioxide, hydrogen, methane, oxygen and nitrogen as timedifferential variables.
Fig. 2 shows a conceptual model of the membrane-supportinterface and the reaction layer at the retentate side of the mem-brane. The SMR reactions take place in a thin catalytically activereaction layer at the membrane surface. The reaction catalyst isNi/MgAl2O4. Methane and water are transported from the bulkgas at the retentate side of the membrane through a gas film tothe reaction layer. The reaction products diffuse back to the bulkgas. A part of the hydrogen permeates through the membraneand diffuses further into the support at the sweep gas side whereit meets the oxygen at the reaction front. Only hydrogen permeatesthrough the membrane (c.f. e.g. Marigliano et al. [7]). Hydrogen canpermeate in both directions through the membrane. At the sweepgas side, oxygen is transported from the bulk gas through a gas filminto the support and further to the reaction front, and water istransported the opposite way back into the bulk gas.
The cross-section areas of the monolith module stack, channels,membrane, reaction layer and support layer are constant along theaxial direction z. A nomenclature list is given in Table 3.
3.1. Model assumptions
The following assumptions are made (based partly on the reportby Mejdell and Morud [1]):
� The gas films at the surface of the bulk layers are neglected.� There is no total pressure gradient across the support material
because of the thin support layer.� Axial bulk gas pressure drops are neglected, i.e. isobaric condi-
tions. This is in accordance with Marigliano et al. [7]. Accordingto Mejdell and Morud [1] these are very small, i.e. less than1 mbar/m. As a consequence, there are neither any velocity gra-dients along the reactor. Bulk gas pressures and velocities aregiven by the inlet conditions.� One-phase bulk gas plug flows, c.f. e.g. Marigliano et al. [7]. This
means that axial dispersion and cross-sectional gradients in thebulk-phases are neglected.� The effect of the boundary conditions at the exterior-channel
walls on the performance of the whole reactor module isneglected, i.e. these boundaries are assumed to be symmetricwith the interior-channels, which will be the case for stackedreactor-modules. Since plug-flow is assumed and the bulk flow
z
CH4, H2O SMR gas bulk layer
N2 O2 H2O N2 H2
H2O
CH4 H2 H2O CO CO2 SMR reaction layer
reactions
Membrane
Support
Fig. 2. The membrane, support, reaction and bulk gas layers with radial flowdirection x and axial direction z.

162 F.A. Michelsen et al. / Energy Conversion and Management 67 (2013) 160–170
channels are distributed in a chess-pattern, the mean-tempera-ture at a position, z, is identical for each interior-channel wall.This simplifies the analysis of the reactor module to an analysisof two interacting bulk fluids as in Fig. 2.� The gas and air behave like ideal gasses.� The process is adiabatic.
3.2. Model derivation
The mass balances include component balances for each layeras depicted in Fig. 2. From these, the densities of the various spe-cies are calculated. Three phenomena are considered; convection,chemical reaction, and diffusion. In the membrane layer, the masstransport is at steady state.
The energy balances include overall balances for each layerexpressing the local mean temperature for all components in thelayer as state variables. Three phenomena are considered; heatconvection, heat conduction, heat from chemical reactions andheat transferred with mass diffusion.
Only axial density and temperature gradients in the bulk gas,reaction and support layers are considered. The reforming reactionlayer dxr is so thin (10 lm) that radial concentration and tempera-ture gradients are neglected. Any thermal radiation and heat trans-fer due to mass diffusion in the support is neglected since theseeffects are small compared to heat conduction.
The heat transfer mechanism between the layers is described bya combination of heat conduction and mass flow. Heat conductionis described by the thermal conductivity coefficient k. The massflow is a combination of convection and diffusion. The combinedmechanism of heat conduction and convective mass flow is calledheat convection, and is described by the convective heat transfercoefficient h for the heat flux between the layers. Thus, from thebulk gas, there is heat convection to the layer boundary, followedby heat conduction and mass diffusion through the boundary.The heat convection and heat conduction flows are parallel to eachother and to the surface normal of the boundary surface, and are allperpendicular to the axial bulk gas flow.
3.2.1. Mass balancesThe bulk gas layers:
@ql;i
@t¼ �v l;z
@ql;i
@z� a � Jl;i; i ¼ 1; . . . ; nl ð1Þ
The reaction layer:
@qrl;i
@t¼ �a � Jrl;i þ Rrl;i þ Drl;z;i
@2qrl;i
@z2 ; i ¼ 1; . . . ; nrl ð2Þ
Support layer:
@qsl;i
@t¼ �a � Jsl;i þ Rsl;i; i ¼ 1; . . . ; nsl ð3Þ
Furthermore, the boundary conditions used for the bulk gas lay-ers are given by the inlet densities. The densities at the inlets qi;j;in
are calculated by the state equation for ideal gases:
ql;i;in ¼ 100 �Mi � Pl;in=ðR � Tl;inÞ ð4Þ
Pl,in is the inlet pressure and Tl,i inlet temperature. Note that the fac-tor 100 has dimension (N/m2 kg)/(bar g). Furthermore, the inletflow rates give the bulk gas velocities:
v l ¼wl;in
ql;in � d2ch
ð5Þ
Zero flux conditions are imposed at boundary conditions in thesupport, membrane and reaction layers.
3.2.2. Energy balancesThe bulk gas layers:
@Tl
@t¼�v l
@Tl
@z� a � hl � ðTl� TblÞþ
Xi
ðbl;i � Jl;i � ðhiðTlÞ� hiðTblÞÞÞ ! !
Xi
ðql;i � cp;iÞ,
ð6Þ
The reaction layer:
@Trl
@t¼ a � hr � ðTr � TrlÞ þ
Xi
ðbr;i � Jr;i � ðhiðTrÞ � hiðTrlÞÞÞ !
þa � hm � ðTm � TrlÞ þX
i
ðbm;i � Jm;i � ðhiðTsl;bl2Þ � hiðTrlÞÞÞ !
þg � qcat
Xj
�DHrl;j � rrl;j
� �þ kc;rl
@2Trl
@z2
!
=X
i
ðqrl;i � cp;iÞ þ qcat � cp;cat
!ð7Þ
The support layer:
@Tsl
@t¼
Xi
a � ðhp � ðTp � Tsl;bl1Þ þX
i
ðbp;i � Jp;i � ðhiðTpÞ � hiðTsl;bl1ÞÞÞÞ
þa � ðhm � ðTm � Tsl;bl2Þ þX
i
ðbm;i � Jm;i � ðhiðTrlÞ � hiðTsl;bl2ÞÞÞÞ!
þDHsl � rsl þ kc;sl;z@2Tsl
@z2
! Xi
ðqsl;i � cp;iÞ þ qsup � cp;sup
!,ð8Þ
The membrane:
@Tm
@t¼ a � hm � DTm þ kc;m;z
@2Tm
@z2
!= qmem � cp;mem� �
ð9Þ
The temperature difference across the membrane is expressedas:
DTm ¼ ðTrl � TmÞ þ ðTsl;b � TmÞ ¼ Trl þ Tsl;b � 2Tm:
Heat of reaction DHj is given by:
DHjðTÞ ¼X
i
v i;jhiðTÞ ð10Þ
Standard enthalpy data based on data by Perry and Green [13]are used to calculate the enthalpy hiðTÞ. The specific molar enthal-pies [J/mol] for each of the nrl components are given by:
hiðTÞ ¼ hiðT0Þ þZ T
T0
cpðTÞdT; T0 ¼ 298K ð11Þ
The inlet temperatures are given as boundary conditions to thebulk layers and zero flux conditions are imposed in the support,membrane and reaction layers.
3.2.3. Gas diffusionBecause the pores in the support are relatively large (diameter
5–20 lm), Knudsen diffusion [14] and the dusty gas model [15]are disregarded. The diffusion term Jr,i for the retentate (r) side isgiven by:
Jr;i ¼ Dr;c;iðqr;i � qrl;iÞ ð12Þ
for the permeate (p) side:
Jp;i ¼ Dp;c;iðqp;i � qsl;i;bl1Þ ð13Þ
and for the reaction layer:

F.A. Michelsen et al. / Energy Conversion and Management 67 (2013) 160–170 163
Jrl;i ¼�Jr;i þ Jm; for i ¼ H2
�Jr;i; else
(ð14Þ
where D is the diffusion coefficient. The diffusion flux of each com-ponent i in the axial direction z for the support layer is given byFick’s law of diffusion [14]:
Jsl;i ¼ �Jslm;i � Jp;i �Dsl;i � ea � s �
@2qsl;i
@z2 ¼ �Jslm;i � Jp;i � Jsl;z;i ð15Þ
Jslm;i is given by:
Jslm;i ¼Jm; for i ¼ H2
0; else
�ð16Þ
The flux of hydrogen Jm through the membrane is studied inMejdell and Morud [1]:
Jm ¼Q H
dxm
1kH
ffiffiffiffiffiffiffiffiffiffiffipsl;H2p þ 1
� 1kH
ffiffiffiffiffiffiffiffiffiffiffiprl;H2p þ 1
" #�MH2 ð17Þ
Jm is positive when prl,H2 > psl,H2.The partial pressures are expressed by Dalton’s law (see e.g.
Reid et al. [16]):
prl;H2 ¼ krl;H2 � Prl; psl;H2 ¼ ksl;H2 � Psl; Pl ¼Xn
i¼1
pl;i; l ¼ rl; sl ð18Þ
QH and the constant kH depend on the temperature by theArrhenius coefficients:
Q H ¼ 2AHe�EHRT kH ¼ e
SHR e�
HHRT ð19Þ
3.2.4. Reaction kineticsThe rate equation of the SMR reactions for each component is:
Rrl;i ¼ g � qcat �Mi �X3
j
ðmrl;i;j � rrl;jÞ ð20Þ
The reaction kinetics of the SMR reactions accompanied bywater–gas shift is described by Xu and Froment [17,18]. This reac-tion scheme has been used in many earlier models (see e.g. Johann-essen and Jordal [4] and Rusten et al. [19]). An effectiveness factorfor the reactions g is included to adapt to the actual activity [20].The equations are of Langmuir–Hinshelwood type and can be gen-erally expressed as:
rrl;j ¼ jj;f � f ðprl;i;Kj;eq;KiÞ; j ¼ 1;2;3 ð21Þ
where jj;f is the forward velocity constant and f is a function of thepartial pressures prl,i of all components, Kj,eq equilibrium constantfor reaction j and Ki adsorption equilibrium constant for componenti. These coefficients depend on temperature according to the Arrhe-nius equation. Xu and Froment [17,18] give details on the kineticmodel parameters.
The hydrogen combustion (HC) is strongly exothermic and thereaction rate is fast compared to other dynamics in the process.The reaction rate for each component i is:
Rsl;i ¼ msl;i � rsl �Mi ð22Þ
The kinetic expression for the reaction is:
rsl ¼ psl;O2psl;H2
jsl ð23Þ
jsl is the forward velocity constant which depends on temperatureaccording to the Arrhenius equation. The stoichiometric coefficientstsl,i give consistency for the component balances. More complexcombustion models exist, see e.g. Li et al. [21], including many com-ponents that are not considered in this study. Hence, a simplifiedapproach is used here.
3.3. Scaling of the model
Scaling of model variables is made by normalizing them withinthe range [01] to reduce numerical errors in the simulations byreducing the artificial stiffness in the model. The model is madedimensionless by scaling the variables by the characteristic quan-tities given in Table 5 and the stack length dcl as described in theappendix. As a consequence, the model parameters are lumpedinto fewer parameters as dimensionless groups.
4. Numerical solution
The model has been implemented in Simulink/Matlab�. Spatialdiscretization (also known as the method of lines) is made usingthe Euler difference method. The discretization grid elements areevenly distributed along the reactor, and all layers are discretizedwith 40 grid elements. The number of grid points is based onextensive simulation trails and is believed to represent a reason-able balance compared with model accuracies introduced by themodel assumptions. This means that this is found to be an ade-quate refinement for predicting trends in the behavior of the gas,which is the object of the modeling. The implicit Matlab methodode15s is used for time integration. The results were comparedwith the in-house steady state Aspen Plus simulations based onstudies at Statoil ASA and the steady-state model by Mejdell andMorud [1]. The results at different operating conditions and stea-dy-state were similar, which confirms that the present dynamicmodel is consistent with previous modeling.
5. Steady state characteristics
In this section, steady state characteristics are discussed. Theseare important for model validation as well as for a fundamentalprocess understanding. First, a sensitivity analysis is given to illus-trate the degree of non-linearity between important process vari-ables, which may be used for control of the process. These arethe steam-to-carbon ratio (S/C), defined as the number of mole-cules of water per atoms of carbon, the oxygen-to-carbon ratio(O/C), defined as the ratio of the number of oxygen atoms to thenumber of carbon atoms, the syngas temperature and hydrogenconcentration. The S/C and O/C ratios have been varied withinthe realistic operating range. The model has been simulated tosteady state for a set of operating points within this region. Totalmass and enthalpy balances have been verified at various steadystate conditions. Next, some important profiles are shown to givesome insight into the internal physical mechanisms in the reactorat the optimum operation with respect to hydrogen production.
Comparing the terms in the energy balances, some effects aresmall compared to others. The enthalpy fluxes across the boundarylayers related to the bulk layers account for less than 1% of the con-vective energy transfer in the respective bulk layer. Further, the ax-ial heat conduction in the reaction layer, support and membraneare negligible compared to the other terms in the respective energybalances.
Temperatures above 1200 �C are detrimental for the HMR mod-ule. Hence, an objective for the process operation is to convert allthe methane with temperature below this constraint. Tables 1and 2 show data for the inlet streams as applied in the simulations.A flow regime where the retenate bulk gas flow is co-current withthe permeate bulk flow has been used.
5.1. Sensitivity analysis
Figs. 3 and 4 show the steady state syngas temperature andhydrogen concentration as functions of the O/C ratio and S/C ratio.

Table 1Data for inlet process gas to the retentate side.
Variable Value Dimension
H2O 52.0 mole%CO 0.6 mole%CO2 6.0 mole%H2 15.7 mole%CH4 25.7 mole%Temperature 750 �CPressure 25 bar
Table 2Data for inlet air to the permeate side.
Variable Value Dimension
H2O 1.0 mole%H2 0.0 mole%O2 20.7 mole%N2 77.3 mole%Temperature 750 �CPressure 24 bar
Table 4Physical dimensions of a unit for full scale applications.
Number of monolith module stacks 440Weight 32120 kgTotal volume 17.32 m3
Total membrane area 15240 m2
164 F.A. Michelsen et al. / Energy Conversion and Management 67 (2013) 160–170
The air and steam flows are varied while the natural gas flow iskept constant. These results differ somewhat from the results byZhao et al. [6] as the surfaces are smoother and there is an opti-mum within the operating range for the hydrogen concentrationat low S/C and O/C values. The optimum is due to higher perme-ation of hydrogen through the membrane in the last section ofthe reformer. Within the operating window as shown in Fig. 6,the optimal hydrogen production is given at S/C = 2.5, O/C = 1.0.
Table 3Nomenclature list.
Variable Description
a Specific membrane areabl,i Boolean parameter for enthalpy flux. bi = 1 for components entering a layecp,i Specific heat capacity for component i at constant pressurecp,cat Specific heat capacity for the catalystcp,mem Specific heat capacity for the membrane materialcp,sup Specific heat capacity for the capacity of the support materialD Diffusion coefficientdch Side height of channeldH Hydraulic diameterDHrl,j Heat reaction for each of the three (j = 1, 2 ,3) SMR reactionsDHsl Heat reaction for the HC reactionJ Diffusion fluxMi Mole weight of component iMl Total mole weight for layer lNl,i Number of mole for component i in layer lNl Total number of mole of components in layer lnl Number of components in layer lpl,i Partial pressure in layer l for component iPl Total bulk pressuresQH Permeability of hydrogenRl,i Reaction rate in layer l for component irrl,j Reaction rate of SMR reaction jrsl HC reaction rateT TemperatureV Volumev Average gas velocity, also known as superficial velocityx Axial positionz Radial positione Porosity, defined as the volume fraction of void space in the porous mediukl;i The mole fraction of component i in layer lql,i Mass density in layer l for component iqcat Mass density of the catalyst materialqmem Mass density of the membrane material including the poresqsup Mass density of the support material including the poresj Forward velocity constant for Arrhenius coefficientss Tortuosity, defined as the ratio of the diffusivity in the free space to the dml,i,,j Stoichiometric coefficient for component i in reaction j in layer l
This is given at about 92% conversion of methane while 28% ofthe hydrogen used as energy for the endothermic reactions. Fur-ther, the S/C ratio should be less than 2.5 to give more than 92%conversion of methane. A higher S/C ratio means shorter residencetime for the gas, which gives lower conversion of methane. Con-sumed hydrogen for the SMR reactions vary between 18 and 52within this operating range, and increases with the O/C-rate.Hence, 28% is a good compromise. These results are relevant forthe implementation and operation of the reactor unit.
5.2. Internal profiles
Figs. 5 and 6 show steady state profiles at the optimal hydrogenproduction S/C = 2.5, O/C = 1.0. This corresponds to 3.2 kmol/s pro-cess gas and 2.3 kmol/s air to the reformer. The inlet streams enterat the axial position 0 m. The temperatures increase along the reac-tor, and the maximum temperature of about 1020 �C is achievedclose to the outlet due to the strongly exothermic HC reaction.The maximum temperature is limited by the SMR reactions, whichare endothermic, and the flow rate of air. Furthermore, the steadystate temperature difference between the two bulk gasses varieswithin 3–13 K inside the reactor.
Dimension
m2 membrane area/m3 channelr, and zero for components leaving a layer –
J/(kg K)J/(kg K)J/(kg K)J/(kg K)m2/smmJ/kgJ/kgkg/(m2 s)g/molg/mol–––barbarkmol/(m s)kg/(m3 s)kmol/(kg cat s)kmol/(m3 s)Km3
m/smm
m of the support –mole i/mole totalkg/m3
kg catalyst/m3 catalystkg membrane/m3 membranekg support/m3 supportkg/(m3 s)
iffusivity in the porous medium of the support –kmol component/kmol reaction

Table 5Model parameter values. NR means No Reference found or adapted parameter.
Symbol Description Value Dimension Reference
dxm Membrane thickness 50 � 10�6 m [1]drl Reaction layer thickness g�dch m NRAH Pre-exponential factor for the Arrhenius coefficient for QH 1.9 � 10�4 kmol/(m s) Correspondence with
StatoilEH Activation energy for the Arrhenius coefficient for QH 65.9 � 103 J/mol Correspondence with
StatoilSH Exponential parameter for kH �82.0 J/(mol K) Correspondence with
StatoilHH Exponential parameter for kH �40.0 � 103 J/mol Correspondence with
Statoilg Catalyst reaction efficiency factor (constant through the reactor), g = 1 means ideal
catalyst0.05 m3 catalyst/
m3 channel[4]
Dr,c,i Mass diffusion coefficient for retentate bulk gas and reaction layer 107�Di m/s [1]Dp,c,i Mass diffusion coefficient for permeate bulk gas and support 107�Di m/s [1]Drl,z,i Mass diffusion coefficient for reaction layer 107�Di m2/s [1]Dsl,i Mass diffusion coefficient for the support material 104�Di m2/s [1]e/s Porosity/tortuosity for the support material 0.1 – [1]hr Heat convection coefficient for retentate bulk gas and reaction layer (a) J/(m2 s K) [1]hp Heat convection coefficient for permeate bulk gas and support (a) J/(m2 s K) [1]hm Coefficient of total heat convection across the membrane 2000 J/(m2 s K) NRkc,sl Heat conduction coefficient for support layer 0.05 J/(m s K) [1]kc,m,z Axial heat conduction coefficient for membrane 5 J/(m s K) [1]R Molar gas constant 8.3144 J/(mol K)qcat Catalyst density 2355.2 kg cat/m3 [4]cp,cat Catalyst heat capacity 700 J/(kg K) [24]qmem Membrane density 6000 kg/m3 Correspondence with
Statoilcp,mem Membrane heat capacity 1070 J/(kg K) [25] for porcelainqsup Support density 3000 kg/m3 Correspondence with
Statoilcp,sup Support heat capacity 1070 J/(kg K) [25] for porcelain
Characteristic scaling quantitiesq0 Reference density 100.0 kg/m3 –v0 Reference velocity 20.0 m/s –T0 Reference temperature 2273.15 K –t0 =dcl/v0 Characteristic time 3 � 10�3 s –
(a) These are given by the Nusselt numbers (see e.g. Bird et al. [26]):Nul ¼ hl �dch
kl¼ 3:091; ) hl ¼ 3:091�kl
dch; l ¼ r;p ð24Þ
Fig. 3. Syngas temperature as function of O/C ratio and S/C ratio.
F.A. Michelsen et al. / Energy Conversion and Management 67 (2013) 160–170 165

Fig. 4. Syngas hydrogen concentration as function of O/C ratio and S/C ratio.
Fig. 5. Temperature profiles.
166 F.A. Michelsen et al. / Energy Conversion and Management 67 (2013) 160–170
Since the HC reaction is fast, almost all of the hydrogen that per-meates through the membrane reacts with the oxygen in thesweep gas. The position of the O2/H2-reaction front depends onthe temperature and the diffusion resistances of O2 and H2. Thereis practically no O2 or H2 in the exhaust gas at the outlet. Thismeans that all the supplied oxygen from the air is consumed andthe operating condition is satisfactory adapted to the reactorlength. At high diffusion rates or high temperatures, more hydro-gen permeates through the membrane (not shown here).
In accordance with the requirement as stated above, the mole%of H2 in the syngas is about 48. This is achieved at about 2 mol%CH4 in the syngas.
6. Dynamic simulations
In order for the control system to handle variations in the inputdisturbances at various operating points, knowledge of the re-
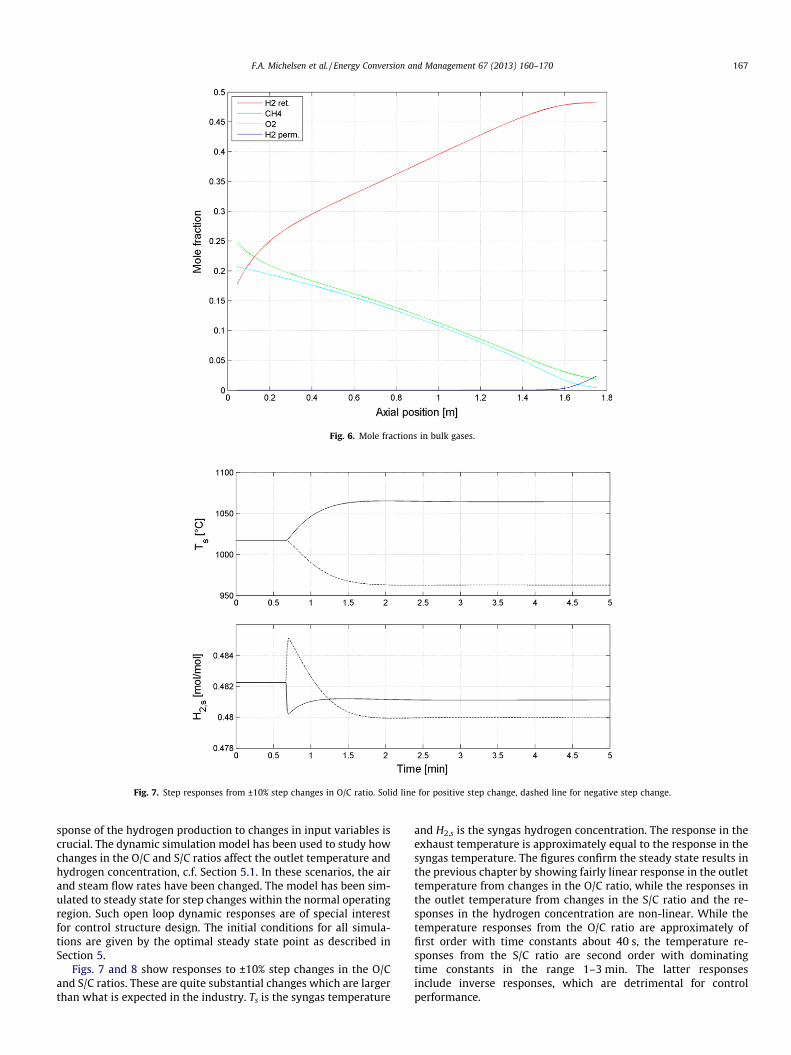
Fig. 6. Mole fractions in bulk gases.
Fig. 7. Step responses from ±10% step changes in O/C ratio. Solid line for positive step change, dashed line for negative step change.
F.A. Michelsen et al. / Energy Conversion and Management 67 (2013) 160–170 167
sponse of the hydrogen production to changes in input variables iscrucial. The dynamic simulation model has been used to study howchanges in the O/C and S/C ratios affect the outlet temperature andhydrogen concentration, c.f. Section 5.1. In these scenarios, the airand steam flow rates have been changed. The model has been sim-ulated to steady state for step changes within the normal operatingregion. Such open loop dynamic responses are of special interestfor control structure design. The initial conditions for all simula-tions are given by the optimal steady state point as described inSection 5.
Figs. 7 and 8 show responses to ±10% step changes in the O/Cand S/C ratios. These are quite substantial changes which are largerthan what is expected in the industry. Ts is the syngas temperature
and H2,s is the syngas hydrogen concentration. The response in theexhaust temperature is approximately equal to the response in thesyngas temperature. The figures confirm the steady state results inthe previous chapter by showing fairly linear response in the outlettemperature from changes in the O/C ratio, while the responses inthe outlet temperature from changes in the S/C ratio and the re-sponses in the hydrogen concentration are non-linear. While thetemperature responses from the O/C ratio are approximately offirst order with time constants about 40 s, the temperature re-sponses from the S/C ratio are second order with dominatingtime constants in the range 1–3 min. The latter responsesinclude inverse responses, which are detrimental for controlperformance.
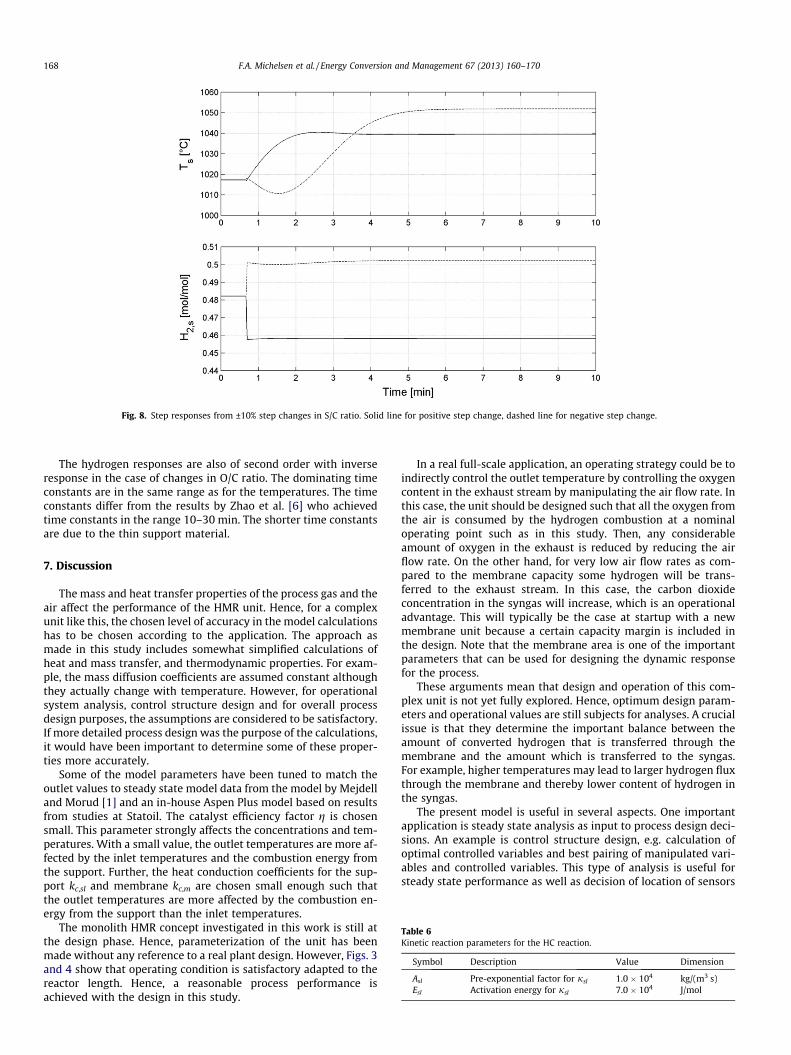
Fig. 8. Step responses from ±10% step changes in S/C ratio. Solid line for positive step change, dashed line for negative step change.
Table 6Kinetic reaction parameters for the HC reaction.
Symbol Description Value Dimension
Asl Pre-exponential factor for jsl 1.0 � 104 kg/(m3 s)Esl Activation energy for jsl 7.0 � 104 J/mol
168 F.A. Michelsen et al. / Energy Conversion and Management 67 (2013) 160–170
The hydrogen responses are also of second order with inverseresponse in the case of changes in O/C ratio. The dominating timeconstants are in the same range as for the temperatures. The timeconstants differ from the results by Zhao et al. [6] who achievedtime constants in the range 10–30 min. The shorter time constantsare due to the thin support material.
7. Discussion
The mass and heat transfer properties of the process gas and theair affect the performance of the HMR unit. Hence, for a complexunit like this, the chosen level of accuracy in the model calculationshas to be chosen according to the application. The approach asmade in this study includes somewhat simplified calculations ofheat and mass transfer, and thermodynamic properties. For exam-ple, the mass diffusion coefficients are assumed constant althoughthey actually change with temperature. However, for operationalsystem analysis, control structure design and for overall processdesign purposes, the assumptions are considered to be satisfactory.If more detailed process design was the purpose of the calculations,it would have been important to determine some of these proper-ties more accurately.
Some of the model parameters have been tuned to match theoutlet values to steady state model data from the model by Mejdelland Morud [1] and an in-house Aspen Plus model based on resultsfrom studies at Statoil. The catalyst efficiency factor g is chosensmall. This parameter strongly affects the concentrations and tem-peratures. With a small value, the outlet temperatures are more af-fected by the inlet temperatures and the combustion energy fromthe support. Further, the heat conduction coefficients for the sup-port kc,sl and membrane kc,m are chosen small enough such thatthe outlet temperatures are more affected by the combustion en-ergy from the support than the inlet temperatures.
The monolith HMR concept investigated in this work is still atthe design phase. Hence, parameterization of the unit has beenmade without any reference to a real plant design. However, Figs. 3and 4 show that operating condition is satisfactory adapted to thereactor length. Hence, a reasonable process performance isachieved with the design in this study.
In a real full-scale application, an operating strategy could be toindirectly control the outlet temperature by controlling the oxygencontent in the exhaust stream by manipulating the air flow rate. Inthis case, the unit should be designed such that all the oxygen fromthe air is consumed by the hydrogen combustion at a nominaloperating point such as in this study. Then, any considerableamount of oxygen in the exhaust is reduced by reducing the airflow rate. On the other hand, for very low air flow rates as com-pared to the membrane capacity some hydrogen will be trans-ferred to the exhaust stream. In this case, the carbon dioxideconcentration in the syngas will increase, which is an operationaladvantage. This will typically be the case at startup with a newmembrane unit because a certain capacity margin is included inthe design. Note that the membrane area is one of the importantparameters that can be used for designing the dynamic responsefor the process.
These arguments mean that design and operation of this com-plex unit is not yet fully explored. Hence, optimum design param-eters and operational values are still subjects for analyses. A crucialissue is that they determine the important balance between theamount of converted hydrogen that is transferred through themembrane and the amount which is transferred to the syngas.For example, higher temperatures may lead to larger hydrogen fluxthrough the membrane and thereby lower content of hydrogen inthe syngas.
The present model is useful in several aspects. One importantapplication is steady state analysis as input to process design deci-sions. An example is control structure design, e.g. calculation ofoptimal controlled variables and best pairing of manipulated vari-ables and controlled variables. This type of analysis is useful forsteady state performance as well as decision of location of sensors

F.A. Michelsen et al. / Energy Conversion and Management 67 (2013) 160–170 169
and actuators for control. Another important application is dy-namic analysis of operability in order to decide how easy the plantis to operate in a given operating range for a certain design andprocess disturbances. An example of this is the influence of hotareas due to membrane leakage as studied by Michelsen et al.[22]. Moreover, dynamic model analyses are also important forcontroller tuning. The dynamic analysis shows that the model isnon-linear within the normal operating range. This means thatadvanced non-linear control schemes may be necessary for satis-factory control performance. Zhao [23] made a study of this topic.
8. Conclusions
A rigorous distributed dynamic two-dimensional model of aHMR unit has been developed. The model is based on a squarechannel monolith structure concept, where air flows adjacent toa mix of natural gas and water distributed in a chess pattern ofchannels. Combustion of hydrogen gives energy to the endother-mic steam reforming reactions. The model includes sufficient com-plexity for steady-state and dynamic analysis. The steady-stateanalysis shows that the optimal hydrogen production is given atsteam to carbon ratio 2.5 and oxygen to carbon ratio 1.0. Withthese inlet characteristics, the conversion of methane was 92%,and 28% of the hydrogen was used as energy for the endothermicreactions. The dynamic analysis shows that the model is non-linearwithin the normal operating range.
Acknowledgements
This work was financed by the BigCO2 project and the CCRETproject, performed under the strategic Norwegian research pro-gram Climit. The author(s) acknowledge the partners: Statoil, GEGlobal Research, Statkraft, Aker Clean Carbon, Shell, TOTAL, Cono-coPhillips, ALSTOM, the Research Council of Norway (178004/I30and 176059/I30) and Gassnova (182070) for their support.
Appendix A. Model parameter values
Tables 4 and 5 give the values of model parameters as used inthe simulations. Some of these parameters are constants or simpli-fied functions although they generally are functions of composi-tion, pressure and temperature. For example, heat capacity issimplified as function of composition and temperature. It is calcu-lated by a polynomial of the temperature for each component. Themolecular fractions of the gas components are then used to calcu-late the overall heat capacity for the gas. Polynomial coefficientsare given by Perry and Green [13]. The values of Dr,c,i and Dp,c,i
are approximated by using m/s as dimension for Di.The model describes one pair of channels in a monolith module
stack. One stack consists of three monolith modules stacked to-gether in series. It has the following characteristics:
� Channel width and height dch 1.5 mm.� Support layer thickness dsl 0.35 mm.� Length of single monolith module 58.33 cm.� Length of monolith module stack dcl (3 � 58.33 cm) 175 cm.� Cross section width of monolith dcsm 15 cm.� Specific membrane surface area 880 m2/m3 module� Volume of monolith module stack 15 � 15 � 175 cm3 =
0.0394 m3.� Volume per stack incl. distribution plates 0.048 m3.� Weight per stack 73 kg.
This gives the number of channels in a stackNc = (dcsm/(dch + dsl))2 = (15 cm/(1.5 + 0.35) mm)2 = 6574 and mem-
brane area pr stack Ams = 15240 m2/440 stacks = 34.6 m2. Thespecific membrane area pr channel is:
a ¼ 4=dch ¼ 2667 m2 membrane=m3 channel
Thermal conductivities are calculated according Reid et al.[16]:
kl;i ¼ C1;i þ C2;iT þ C3;iT2 þ C4;iT
3 ð25Þ
where Cj,i are their tabulated coefficients which is valid at about1 bar. They refer literature which indicates that the thermal con-ductivity increases about 1% or less pr bar. Based on this, the bulkgas thermal conductivity [W/(m K)] is estimated as:
kl ¼ ð1þ Pl=100ÞX
i
kl;ikl;i ð26Þ
where Pl is given in bar and kl,i is the mole fraction of component i.Mass diffusion coefficients are found from Reid et al. [16] (the
components are here ordered as [H2 CO H2O CO2 CH4 N2 O2]):
Di ¼ ½3:349 1:0287 1:243 0:84066 1:0415 1:0198 1:0367�
� 10�9 ð27Þ
Heat capacity for gas components cp,i and specific molar enthal-pies hiðTÞ are calculated from thermodynamic tables, see e.g. Perryand Green [13]. Kinetic parameters are shown in Table 6.
For a square channel with side height dch, the specific mem-brane area a is given by:
a ¼ 4dch
ð28Þ
according to the ideal gas law assumption.
References
[1] Mejdell T, Morud J. MATLAB model for a hydrogen mixed conductingmembrane reactor. Sintef report SFT 66F03026; 2003.
[2] Aasen K, Vigeland B, Norby T, Larring Y, Mejdell T. Development of a hydrogenmembrane reformer based CO2 emission free gas fired power plant GHGT 7;2004.
[3] Saracco G, Neomagus HWJP, Versteeg GF, van Swaaij WPM. High-temperaturemembrane reactors: potential and problems. Chem Eng Sci 1999;54:1997–2017.
[4] Johannessen E, Jordal K. Study of a H2 separating membrane reactor formethane steam reforming at conditions relevant for power processes with CO2
capture. Energy Conver Manage 2005;46:1059–71.[5] Wilhelmsen Ø, Anantharaman R, Berstad D, Jordal K. Multiscale modelling of a
membrane reforming power-cylce with CO2-capture. Comput Aided Chem Eng2011;29:6–11.
[6] Zhao L, Michelsen FA, Foss B, Aasen KI. Dynamic behaviour of an HMR pre-combustion gas power cycle. In: Proceedings from DYCOPS 2010, Leuven,Belgum; 2010.
[7] Marigliano G, Barbieri G, Drioli E. Effect of energy transport on a palladium-based membrane reactor for methane steam reforming process. Catal Today2001;67:85–99.
[8] Basile A, Chiappetta G, Tosti S, Violante V. Experimental and simulation of bothPd and Pd/Ag for a water gas shift membrane reactor. Sep Purif Technol2001;25:549–71.
[9] Patel KS, Sunol AK. Modeling and simulation of methane steam reforming in athermally coupled membrane reactor. Int J Hydrogen Energy 2007;32:2344–58.
[10] Barbieri G, Scura F, Brunetti A. Mathematical modeling of Pd-alloy membranereactors. Membr Sci Technol 2008;13:325–400.
[11] Fu C-H, Wu JCS. A transient study of double-jacketed membrane reactor viamethanol steam reforming. Int J Hydrogen Energy 2008;33:7435–43.
[12] Smith JB, Aasen KI, Wilhelmsen K, Käck D, Risdal T, Berglund A, et al. Recentdevelopment in the HMR pre-combustion gas power cycle. Energy Procedia2009;1:343–51.
[13] Perry RH, Green DW. Perry’s chemical engineers’ handbook, 7th ed. 1997. p. 2-195–2-9.
[14] Malek K, Coppens MO. Knudsen self- and Fickian diffusion in roughnanoporous media. J Chem Phys 2003;119:2801–11.
[15] Mason EA, Malinauskas AP. Gas transport in porous media: the dusty-gasmodel. Elsevier; 1983.

170 F.A. Michelsen et al. / Energy Conversion and Management 67 (2013) 160–170
[16] Reid, Prausnitz, Poling. The properties of gases and liquids. 4th ed. NewYork: App A McGraw-Hill; 1987.
[17] Xu J, Froment GF. Methane steam reforming: methanation and water–gas-shift: I. Intrinsic kinetics. AIChE J 1989;35:88–96.
[18] Xu J, Froment GF. Methane steam reforming, methanation and water gas shift:II. Diffusional limitations and reactor simulation. AIChE J 1989;35:97–103.
[19] Rusten HK, Ochoa-Fernndez E, Chen D, Jakobsen HA. Numerical investigationof sorption enhanced steam methane reforming using Li2ZrO3 as CO2-acceptor. Ind Eng Chem Res 2007;46:4435–43.
[20] De Groote AM, Froment GF. Simulation of the catalytic partial oxidation ofmethane to synthesis gas. Appl Catal A: Gen 1996;138:245–64.
[21] Li J, Zhao Z, Kazakov A, Dryer FL. An updated comprehensive kinetic model ofhydrogen combustion. Int J Chem Kinet 2004;36:566–75.
[22] Michelsen FA, Zhao L, Foss B. Operability analysis and control design of an IRCCHMR unit with membrane leakage. Energy Procedia 2012;23:171–86.
[23] Zhao L. Modelling and simulation of HMR pre-combustion gas power cyclePhD thesis, NTNU; 2012.
[24] Wikipedia. Heat capacity; 2010. <http://enwikipediaorg/wiki/Heat_capacity>.[25] Toolbox TE. Heat capacity; 2010. <http://wwwengineeringtoolboxcom/
specific-heat-solids-d_154html>.[26] Bird R, Steward W, Lightfoot E. Transport phenomena. Wiley International
Editions; 1960.