a device for measurement of capillary refilling time
TRANSCRIPT
A Device for Measurement
of Capillary Refilling Time
Nebil Muaied Shamsudin
2012-09-03
LiTH-IMT/MASTER-EX--12/017--SE

A Device for Measurement
of Capillary Refilling Time
Nebil Muaied Shamsudin
2012-09-03
LiTH-IMT/MASTER-EX--12/017--SE
Supervisor: Malcolm Latorre, Research Engineer
Department of Biomedical Engineering, Linköping University
Examiner: Gert Nilsson, Professor
Department of Biomedical Engineering, Linköping University

Abstract
The main objective of this project is to design, construct and validate a portable prototype of a
device that is capable of performing a test to accurately measure Capillary Refilling Time (CRT),
and to analyze the results with defined parameters; force, area, pressure (compression) and time.
This prototype is dedicated to study and evaluate CRT readouts for different pressure values,
collected from healthy subjects.
The presented prototype of this study is capable of producing skin compressing and to measure
the refilling time of capillaries following this compression. This prototype introduces accuracy,
mechanical reproducibility and controlling options for the applied pressure and compression
time. The presented prototype is non-invasive, portable and it can be used to conduct more CRT
tests and other capillary refilling studies.
CRT measurement is done by calculating time interval starting from the first point when the
applied pressure is released; ending with the recording point at the time when the concentration
of red blood cells has reached the level of its pre-occlusion values.
Based on the calculated CRT values and the number of iterations of the test in CRT tables, one
can observe that given the same applied pressure value, CRT values do not significantly vary
when the test is repetitively conducted on the same subject and on the same site.

Acknowledgement
I would like to take the opportunity to express my appreciation for all the people who helped me
throughout this thesis work. At first I am grateful to my supervisor Malcolm Latorre for giving
me the opportunity to work under his supervision and also for his professional guidance and
support throughout this thesis work.
I would also like to acknowledge Prof. Gert Nilsson for his acceptance to be my examiner and to
evaluate my thesis work; this means a lot to me to be evaluated by a professional biomedical
engineer expert as Prof. Nilsson. Also, many thanks to Prof. Göran Salerud, director of studies in
Biomedical Engineering department, for his continuous help and support from the first day in
this master program.
Finally, I would like to express my deepest gratitude to my family, to my friends and to my wife,
for their unconditional love, motivation and support during this master’s program and in every
step in my life.

Contents Page
1. – Introduction 1
1.1. – Project Goal 1
2. – Physiology and Anatomy 2
2.1. – Cardio Vascular System (CVS) 3
2.1.1. – Blood Circulatory System 3
2.1.2. – Tissue Perfusion 5
2.1.3. – Capillaries 5
2.1.4. – Capillary Size 5
2.1.5. – Capillary Types 6
2.1.6. – Characteristics Signs of Shock 7
3. – Methodology and Design 8
3.1. – Mechanical Parts 9
3.1.1. – Lever System 9
3.1.2. – Weights Used 12
3.1.3. – Frame 13
3.1.4. – Pneumatic Piston 13
3.1.5. – Valve 14
3.1.6. - Cam Disc 14
3.1.7. - Motor Selection 14
3.1.8. - Motor Rotation Speed 16
3.1.9. - Motor Specifications 17
3.2. - Electronic Parts 17
3.2.1. - Power Supply 17
3.2.2. - Power Board 18
3.2.3. - Pulse Width Modulator (PWM) 18
3.2.4. - Timing Circuit 21
3.2.5. - Pulse Shaper 24

3.2.6. - Inverter 25
3.2.7. - Motor Controlling Switches 25
3.2.8. - Power Battery Specifications 27
3.2.9. - Detection Part 28
4. – Measurement and Evaluation 28
4.1. – Results 29
4.1.1. – Subject (1) 32
4.1.2. – Subject (2) 33
4.1.3. – Subject (3) 35
4.1.4. – Subject (4) 36
5. – Discussion 38
5.1. – Comparison with Previous Studies 39
5.2. –Factors to Consider 39
6. – Conclusion 40
6.1. Future Work 40

1
1. – Introduction
The refilling response of capillaries is a potentially important clinical indicator in critical care
medicine. Capillaries Refilling Time (CRT) assesses the time it takes for the capillaries to refill
after introducing a localized uniform compression (1) (2) (3).
CRT can be defined as the estimated time for capillaries to refill after being subjected to a minor
pressure to expel all the blood away for a short time period causing skin blanching then releasing
that pressure abruptly to permit the flow of blood back into the capillaries, allowing the skin to
regain its normal color. CRT may be important to evaluate in clinical conditions such as chock
and cardiovascular disease (1) (2) (3).
Many studies deal with the capillaries and their functions and how they contribute to medical
shock conditions. These studies focus on the evaluation of capillary blood pressure, while few
studies handle the CRT measuring techniques (4) (5) Nevertheless Shani’s study devoted for
CRT measuring purpose using an instrument based on change in skin color. There was, however,
no clear explanation for the methodology of the applied compression and the main mechanical
parameters that contribute in this process (5).
1.1 Project Goal
The main goal of this project is to design, construct and validate a portable prototype of a device
that is capable of performing a test to accurately measure CRT, and to analyze the results with
defined parameters; force, area, pressure (compression) and time.
This prototype is dedicated to study and evaluate CRT readouts for different pressure values,
collected from healthy subjects.
Potentially, the device can be an assisting tool in early detection of shock and shock-related
conditions, using a non-invasive method. It can further assist in patient’s recovery from these
conditions by monitoring changes in capillary flow in skin areas of peripheral body organs.
In this project, the detection part will be a digital camera. Changes in skin color will be observed
where the captured image and/or video will be processed with computer software.

2
2. –Physiology and Anatomy
Why is it Important?
Shock is a clinical syndrome; one of its common clinical indications is based on the presence of
inadequate blood flow (perfusion), to organs and tissues.In normal cases shock condition is
reversible which means that blood perfusion settles back to its normal status (5). However, in
some other cases, it may last longer, which can lead to an irreversible damage to the tissue and
even death in severe cases. Hypovolemic shock is one of the most common types of shock; it
results from volume loss such as massive blood loss (hemorrhage) or loss of body fluids due to
severe dehydration, diarrhea or vomiting. (5)
Vasoconstriction is considered an early compensatory mechanism in hypovolemic shock in
which the resistance of the skin tissue arterioles increases in order to reduce blood perfusion by
constricting the arteriolar walls and reducing vessel diameter (6). While it enables adequate
perfusion to the vital organs (heart, brain and kidneys) vasoconstriction of the skin tissue
arterioles and the reduction of the arteriolar blood flow lead to a reduction in the capillaries
blood flow, i.e.: poor skin perfusion (5) (6).
Poor skin perfusion is an important clinical sign which can potentially be estimated by CRT.
When a minor pressure applied firmly on a specific area of the skin, capillaries under that area
collapse and the blood is forced to be expelled from that area. This causes the change in skin
color from red-pink to white (blanched) under the compressed area. Upon releasing the pressure
abruptly, blood flows back into the capillaries and the original skin color returns (5) (6).
CRT is described as the estimated time for the capillaries to refill with blood after being expelled
when blanching is the color sign. Arteriolar vasoconstriction increases even more if the shock
condition continues, thereby prolonging CRT. Accurate measuring of CRT is considered a direct
non-invasive method to evaluate perfusion in the shock condition, according to the physiological
principle of hemodynamic compensation in hypovolemic shock.
The other known non-invasive methods to evaluate shock are:
- Blood pressure measurement: it is an indirect parameter of shock (does not evaluate
perfusion) and it identifies shock only in late stages.
- Heart rate: an indirect parameter of shock, it does not evaluate perfusion. The specificity
of this measurement is low because heart rate also increases in other common
physiological conditions such as pain and anxiety (5).
Consequently there is a need for a non-invasive portable device to measure capillary refilling
time as a response to a well defined skin compression (5).

3
What is the state of art and what has been done so far?
Until today most of CRT clinical tests are still performed manually, by applying a pressure on
patient´s wrist or forearm by hand (usually physicians use the thumb to press with) for a short
time period -few seconds- and then release this compression and record the time it takes for the
underneath skin to regain its normal color. This manual procedure is subjected to many unknown
parameters which in turn will make test results inaccurate. Undefined force and unknown area of
the compressed skin and thus the applied pressure that causes skin compression cannot be
accurately defined. Therefore the applied pressure varies for each test as well as for each patient.
Also the time of applying that pressure to the skin is yet not well unified (estimated between 4-6
seconds). Change in skin color is still being observed by naked eye, which gives an additional
possibility for inaccurate test results for CRT evaluation.
There are many clinical studies regarding shock conditions and capillary refilling assessment.
Yet there is no clear clarification about the set up of the main parameters. For instance Shani’s
patent (5), smartly dealt with the problem by inventing a device that does the capillary refilling
test and computes the time for the capillaries to refill by assessing the changes in skin color from
white (blanching) when the pressure-compression-is applied, until obtaining a pink skin color
(i.e. capillaries are refilled with blood) when the pressure is released. Shani’s device uses color
sensors and timing circuits to get the signal based on skin color changes. However, Shani’s
patent doesn’t have an explicit explanation regarding the methodology of the applied pressure
parameters, which are highly valuable factors that may change the result of the entire test (5).
2.1. - Cardio Vascular System (CVS)
The Cardio Vascular System is one of the major systems in the living body. It takes the role of
delivering blood to all organs and every single part in the body to sustain its activity and life.
This function is based on many parts working together in a well synchronized circulatory system.
The heart (cardiac muscle), blood vessels (arteries and veins) and their smallest branches
(capillaries) are the functional units of the cardio vascular system (6).
2.1.1. - Blood Circulatory System
Body organs and tissues need a continuous supplement of fresh oxygenated blood, to last their
metabolic activities. Blood circulation in the human body starts after the collection of the
deoxygenated blood from all body parts by the venous system, followed by the contraction of the
heart´s atria. The contraction of the right atrium causes pumping the blood into the right ventricle
passing through the tricuspid valve then ventricles contraction causes the right ventricle to pump
the blood to the lungs. Process of gas exchange will take place in the lungs to replace carbon
dioxide by oxygen, this circulation known as (Pulmonary circulation) (6).

4
Meanwhile, the left atrium receives oxygenated blood via pulmonary veins and empties itself
into the left ventricle through the bicuspid valve (also known as mitral valve). The left ventricle
is the strongest chamber of the cardiac muscle. It has a thick muscular wall enabling this
chamber to force its blood contents (during systole) to all body parts and organs via the arterial
system and its sub-branches until reaching the capillary level where the exchange processes of
oxygen and carbon dioxide and other nutrient substances will take place providing living tissue
cells with nutrients and oxygenated blood and to carry carbon dioxide with other waste products
back to the right atrium of the heart via the venous system and so the next heart beat will then
take place on the same sequence in what is known as (Systemic circulation) (6).

5
2.1.2. - Tissue Perfusion Tissue perfusion is the process when a certain amount of blood flows in a specific unit of volume
of a tissue delivering nutritive substances and removing waste products from that tissue. Tissue perfusion is a crucial clinical indication that represents the healthiness state of the tissue.
Since the blood flow is involved in delivering nutrients and removing waste products from the
body, it will affect the tissue state directly if there is any dysfunction in tissue perfusion (6).
After tissue perfusion capillaries join and get wider to become venules and widen more to
become veins which will return blood to the heart. The exchange of nutritive substances between
the capillaries and the body tissues takes place at the capillary bed level.
2.1.3. - Capillaries
Blood flows from the heart to the arteries which branch out into narrower and smaller arterioles
and then branch further into capillaries. Capillaries are the smallest blood vessels in the
cardiovascular system located within body tissues and organs. Capillaries play an important role
in blood microcirculation; it is a part of the blood circulation in which blood is circulated from
the heart to arteries through smaller arterioles, then to capillaries and finally goes back to the
heart via the venous system (7) (8) (9).
The capillary bed is the fundamental site that interweaves the capillary network supplying a
tissue or an organ. Body tissue cells have different functions and therefore their metabolic
activities will vary. The more metabolically active the cells of the tissue, the greater amount of
capillaries exist in that tissue. Muscle tissues and kidneys for example have more capillaries than
connective tissue in order to sustain oxygen and nutrients supply and eliminate waste products in
a process known as “Tissue perfusion” (7) (8) (9).
2.1.4. - Capillary Size
Capillaries are so small that red blood cells can only travel through them in single file.
Capillaries measure in size from about 5-10 microns in diameter. Capillary walls are thin and are
composed of endothelium and may only be one endothelial cell thick (10). Oxygen, carbon
dioxide, nutrients and wastes are exchanged through the thin walls of the capillaries.
6
2.1.5.- Capillary Types:
1. Continuous Capillaries:
The circumference of the continuous capillaries consists of a ring of one to three endothelial
cells surrounded by a continuous basement membrane. They are found in skin and muscles,
myocardium, skin, lung, connective tissue and fat (11).
2. Fenestrated Capillaries:
The endothelial cell of the fenestrated capillaries has pores and openings to allow greater
permeability to water and small lipid insoluble solutes than are continuous capillaries. They
are found in tissues that specialize in fluid exchange (kidneys, exocrine glands, intestinal
mucosa, synovial lining of joints, choroid plexus, ciliary body of the eye) and in endocrine
glands (11).
3. Sinusoidal (Discontinuous) Capillaries: Discontinuous or Sinusoidal capillaries have endothelial gaps (over 100nm.) wide, with
corresponding discontinuity in the basal lamina. They are leaky, highly permeable capillaries
even to plasma proteins. They can be found in organs where red cells and/or white cells need
to migrate between the blood and tissue, namely in the bone morrow, spleen and liver (11).
The blood flow in capillaries is controlled by rings structures known as pre-capillary sphincters.
These structures, located between the arterioles and capillaries, contain muscle fibers that allow
them to contract. Blood flows freely to the capillary beds when the sphincters are open. When
sphincters are closed, blood is not allowed to flow through the capillary beds. The fluid exchange
process takes place at the capillary bed (10).
A capillary bed consists of two types of vessels; true capillaries and vascular shunts. The first
(true capillaries) branches mainly from metarterioles and provides exchange between cells and
the circulation. A vascular shunt is a short vessel that directly connects the arteriole and venule at
opposite ends of the bed (10).
Capillary blood pressure causes fluids to filter slowly across the capillary wall into the interstitial
space. Thereby the fluid drains into the lymphatic system, which returns it to the bloodstream.
Although this fluid turnover is usually very slow, the cumulative turnover over many hours is
substantial. In fact the entire plasma volume completes an extra vascular circulation in less than
one day, except for the plasma proteins. Consequently, the distribution of fluid between the
plasma and interstitial compartment can be distorted relatively quickly by changes in capillary or
lymphatic function. For example; increased capillary or lymphatic filtration during prolonged
standing or exercise reduces the plasma volume by up to 20% and increased capillary filtration
during cardiac failure drives an excess of water in the tissues, (i.e. odemea) (6).
Capillary blood pressure is a variable pressure in the circulation of fluid between plasma,
interstitial and lymph and it is the only factor under nervous control. It is affected by arterial and
venous pressures, vascular resistance, gravity and distance along the capillary axis (6).

7
Clinically the term “shock” means; a potentially fatal, pathophysiological disorder characterized
by acute failure of the cardiovascular system to perfuse the tissues of the body adequately.
2.1.6.-Characteristic Signs of Shock
- Pale, cold, sweaty and venoconstrictive skin.
- The pulse is rapid and weak, due to tachycardia and reduced stroke volume.
- Mean arterial pressure may be reduced or normal, but pulse pressure is always reduced.
- Breathing is rapid and shallow.
- Urine output is reduced.
- There may be reduced mental awareness or confusion, muscular weakness and collapse
(6).
Haemorrhagic shock triggers compensatory reflexes; A 10% blood loss (standard blood
donation) is not a significant threat to the circulation. A rapid 20-30% blood loss causes clinical
shock, but given prompt treatment it is not usually life-threatening. A 30-40% blood loss reduces
arterial pressure to 50-70mmHg and causes severe, sometimes irreversible shock, with anuria
and impaired cerebral and coronary perfusion (6).

8
3.Methodology and Design
The presented project is an implemented design of a functional prototype for Capillary Refilling
Time measurement. The presented prototype provides controlled mechanical pressure parameters
and skin compression time; it performs skin compression automatically throughout the entire
process. It also conducts the test non-invasively by applying external pressure on the skin.
There are three main phases representing the compression process. The first one is dropping the
arm of the device in a smooth slow motion. The second one is holding the arm down in position
during skin compression with a controlled time (1, 2, 4 or 6 seconds) with an option of
combining a summation of these time intervals, giving a total skin compression time up to 13
seconds. The third and last phase of the cycle is a quick revert of the arm to its starting position.
The design of the presented Capillary Refilling Time device consists of a combination of
electronics and mechanical parts in addition to the detection part. In this chapter the design and
the main parts of the device will be explained in details.
A Device for Measurement of Capillary Refilling Time
Fig.1 General Diagram of the project.

9
Fig.2 Main parts of the constructed device..
3.1.– Mechanical Parts:
3.1.1 – Lever System
A number of fundamental mechanical principles will be considered in the design and
construction of the parts of this device. A class one lever system is used consisting of a
mechanical arm, where a fulcrum point is located in the middle: the effort (input force) is applied
on one side of the fulcrum while the resistance (load) is situated on the other side. Figure 3]
shows a basic lever system, class one.

10
Fig.3 Class one lever system
The weight range can be estimated from the pressure at the desired skin point where the
plunger’s foot will be applied
“Weight-Force is a gravitational metric unit of force; it is equal to the magnitude of the force
exerted by one unit of mass in a 9.806 m/s2 gravitational field” (12).
“-force" is added to distinguish units of force from units of mass.
According to some studies, capillary blood pressure in the forearm (under resting condition and
forearm at the heart level) is around 17 to 23 mmHg. (2).
Other studies recorded blood pressure in finger nail fold capillary between 18-25 mmHg. (both
normal and hypertensive cases). (13)
In this project, 25 mmHg will be considered as the maximum capillary blood pressure value in
the forearm. 25mmHg equals 33.9877 gram-force/cm2 (14) .
Therefore, the minimum amount of pressure that can be applied to equalize the pressure on the
capillary walls will be 33.9877 gram-force/cm2. This pressure can be taken as the minimum
pressure acting against the blood pressure that is generated on the capillary wall, giving a
resultant as zero reference.
A solid transparent plastic bar is used as a plunger foot; it has a circular cross section with 2 cm
diameter. It is used to apply the pressure by holding a foot of the piston down towards the
patient’s arm, while the scaled weights are applied from the top of this plunger.

11
Plunger foot diameter = 2 cm, and so cross sectional area for plunger’s foot can be calculated:
Thereby: A=3.14 cm
2.
From pressure formula in equation [1]:
= 106.721 gram-force.
This represents the force originated by the capillary blood pressure at that point.
In a lever system:
The pivot point is located at 30 cm from the plunger end (where the weight force is applied)
From Torque formula in equation [4]:
,
This amount of torque is generated by the weight force of the capillary pressure.
Plunger foot should always be directed vertically from the top to deliver the desired pressure.
Due to variations in patients’ arms size, there will be a change in plunger verticality, because the
plunger end of the arm with the weight load on top tends to rotate around the furculum in a
circular motion. Therefore, when applying pressure plunger’s foot will act with an oblique angle.
In order to avoid that, a pantograph principle is used.

12
A pantograph consists of two parallel bars (upper and lower each one has 1 cm square section) in
the lever system instead of one bar, connected with four pivots; two on each side, this keeps the
upper and lower bars always in parallel and so the plunger will always be vertically directed
when compression is applied on skin. (See figure [4]).
In this way the plunger will always press vertically towards the skin regardless the difference in
patients arm sizes. Nevertheless this device can be used on other body parts like hands, fingers
and nail beds of the hands.
Fig.4 shows the pantograph arm and the cam disc of the device.
3.1.2. - Weights Used
Costume made scale weights have been shaped and scaled according to need.
Weights are made from iron, scaled as
- 1000 gr. (1 piece)
- 500 gr. (1 piece)
- 200 gr. (2 pieces)
- 100 gr. (1 piece)
- 50 gr. (1 piece)

13
3.1.3. - Frame
A flat rectangle shape wood board of (75cmx 28cm) dimensions is used as a base floor for the
device. An aluminum metal frame has been designed with (63cmx28cmx20cm) dimensions and
mounted on the flat board by 4 columns with 20cm height each, forming 3 open sides, with a
forth side which has a fully open inlet to provide a sufficient space for patient’s arm access and
to rest inside on a custom made platform. A plastic (Acrylonitrile - Butadiene – Styrene, ABS)
plumbing pipe of 15.5 cm diameter was cut in U-shape and used as a platform for patient’s arm
to rest on.(see figure [5]).
Fig.5 shows the front side of the device and the U-shape arm platform.
The system fulcrum point is located on the centre point of the frame sharing the same central line
of the U-shape arm platform; one of the main advantages of this central line alignment is to
localize the field of the image which will be captured by the camera for the targeted skin area.
3.1.4. - Pneumatic Piston:
A pneumatic piston is used in the prototype. The Pneumatic piston also known as a dashpot is a
device used for damping shocks and vibration. It is needed in the design of the device in order to:

14
- Support and strengthen the lever arm.
- It provides safe and slow damping motion of the lever when moving down towards the
skin. The component used is a Airperl Model: M24D 150.0 D (i.e. 150 mm stroke).
3.1.5. – Valve
A unidirectional air valve was custom made to match the mechanism process of the pneumatic
dashpot to provide a slow dropping motion of the lever arm, with a quick lift when retracting
lever arm to quickly leave the targeted skin area and clear the site for photo capturing. However
the major part of the lever motion is controlled mechanically by a cam disc technique.
3.1.6. – Cam Disc
Cam disc is a mechanical name for a machinery part which consists of a rotating disc that can
drive a follower by direct contact to generate a prescribed follower motion. A Cam disc is used
to control dropping, compression time and flipping up the piston. The follower in this case is the
lever arm and the cam disc will be rotated by a motor (15).
The motion of the lever arm (the follower) is designed, generated and controlled with respect to
the cam rotation angle. Therefore, the cam disc shape is the key point behind this mechanical
process to run a cycle providing the following phases:
a- A gradual dropping; moving the piston down towards the skin to cause compression. Note
that the desired compression is adjusted by selecting the desired amount of pressure using
the scaled weights.
b- Holding the compression at that point for a short period of time (dwell), clinically desired 5
seconds in which blood will be expelled (4).
c- Releasing the piston with a quick lift up of the lever arm back to its starting point to give a
good field of view for the camera to capture a photo or a video of the targeted skin area.
3.1.7. – Motor Selection
The upcoming step in prototype design is to automate the arm and plunger movements by
rotating a cam disc that is tangent to the lever arm at point B using an electrical motor. Therefore
determination of motor type and its specifications are fundamentals.
The motor should have a minimum torque to withstand the entire torque that is introduced by the
lever system with a total mass weight of (2kg) situated at arm point A, as s shown in figure [6].

15
Fig.6 A sketch of the arm design as class one lever system.
This minimum motor torque can be found from the lever system with an arm total length = 45cm
(from A point to B point), mass weight=2kg at A point and the pivot point is situated at 30cm
from A point.
According to equation [4]:
At Point B:
[5]
(Used materials are Acrylic and Teflon, Friction coefficient of Acrylic is 0.4, and for Teflon is
0.04) (16).
(Cam disc diameter is 10 cm, i.e.: radius = 0.05m)

16
3.1.8. – Motor Rotation Speed
Each proposed test time takes about 20 seconds, and that means the cam disc needs 20 seconds to
complete one cycle;
, Motor rotation speed.
Statically, when no external forces are applied and the system is steady with no movement, cam
disc motor at point B will experience a high load from the entire system when there is no
rotation. This means that the system is static, and the torque can be calculated by applying
equation [4]:
The motor shaft and the cam disc are very well mounted and supported by metal plates which are
also strongly attached with the device metal frame bars. The motor is also held and kept in place
by three M6 20 screws. This strong support provides a high resistivity for the motor shaft that
enables the cam disc to hold the device arm with a full load of weights upwards. This is the
starting position before turning the device on.
Dynamically, loads can present a high torque in systems resulting in resistive forces against the
motor when the motor is rotating. In this prototype, the cam will experience large dynamic forces
at the instant when arm lifting is initiated. These forces tend to push the arm back against the
rotation direction of the cam.
Assuming the total displacement of the mass at point A will be 20cm. which makes the lever arm
rise up half the distance with a θ angle from horizontal line (i.e. 20cm/2)
Mass (m) will have two force components when it is raised up with θ =12.5255 degree. These
two force components come from the mass weight analysis into one parallel and one
perpendicular component, as shown in figure [7]:
m*g*cos θ (perpendicular) and m*g*sin θ (parallel which is neglected in this case)

17
Fig.7 Analysis of force components
The maximum torque (T) the motor should overcome when the movement is initiated (Starting
Torque), can be calculated from:
3.1.9. – Motor Specifications
A 12 volts D.C motor is used. It needs to be a gear motor which means it has a motor shaft and
mounting points to ease the process of mounting the motor and attaching it to the frame of the
device. The motor that is used in this device has a rotation speed of 30 rpm (Round per Minute)
with a torque of 9 N.m. and a starting torque of 50 N.m.
3.2. – Electronic Parts
3.2.1. – Power Supply
Once motor data became available, it is now possible to design the power supply needed to drive
the motor in order to produce the desired speed for rotation, output voltage and power.
The desired power supply should be capable of driving the motor and to handle the total weights
of the device arm and scaled weights. A 12 volts D.C. source rechargeable battery is used to run
the power board and the control circuits of the device.

18
3.2.2. – Power Board
For safety reasons, high voltage and high power parts of the circuit were mounted on a separate
circuit board. The Power board contains a MOSFET, Metal Oxide Semiconductor Field Effect
Transistor that acts as a switching component for the circuit.
A big value capacitor (3300 µF) is used over the motor to reduce the overshoot. One over-
voltage protection diode is used across the motor power supply; the used diode is 1N4004 type.
This diode becomes forward-biased (conducting) in case the voltage rises above the normal
range.
Fig.8 Electronic part shows Pulse Width Modulation and Power Board circuits
3.2.3. – Pulse Width Modulator (PWM):
In this device the arm is required to move to different positions. The movement sequence is as
follow: gradual (smooth) dropping, hold the arm down for a period of time (dwell) and finally a
quick lift up movement. The shape of the cam disc together with the motor rotation speed will
control the positions and movements of the device arm.

19
Thus, the motor is required to be driven at different speeds in order to provide this movements
sequence for the device arm; the input power signal should therefore be controlled to provide
different rotation speeds. Once the motor starts rotating the cam disc will consequently rotate
since the cam disc is directly connected to the motor shaft.
A Pulse Width Modulator (PWM) circuit is used in this device to control motor speed. Pulse
Width Modulation is a commonly used technique to control the power fed to the device. Pulse
Width Modulatoion is basically to control the fed average voltage and current by turning the
switch between the supply and the load on and off at fast pace (i.e. a high frequency).
In the Pulse Width Modulator (PWM) circuit; the proportion of 'ON' time to the regular period of
time; a low duty cycle corresponds to low power because the power is OFF most of the time; this
is described by the (Duty Cycle) term. Duty cycle is expressed in percent, 100% being fully on
(17).
Pulse Width Modulator (PWM) circuit consists of:
- One NE555-IC component.
- Two diodes- 1N41 series.
- Two resistors on each diode to limit the potentiometer’s range.
- Two capacitors of 10 nF have been connected between pin number 5 and the ground
(GND), also pin number 6 and the ground (GND).
- R1=1.2 Kohm
- R2= 68 ohm connected between pin number 3 and the gate of the MOSFET at the power
circuit board.
- R4 = 100 k Ohm.
- The potentiometer is connected directly to pin number 3.
- Pulse Width modulator circuit was connected as shown:

20
Fig.9 Pulse Width Modulation circuit (PWM) (18)
Another two resistors were connected in series with the potentiometer; each resistor is
connected at an end, to lower the maximum and the minimum range of the
potentiometer’s sweep, thus lowering the range of the potentiometer into the desired
speed (19).
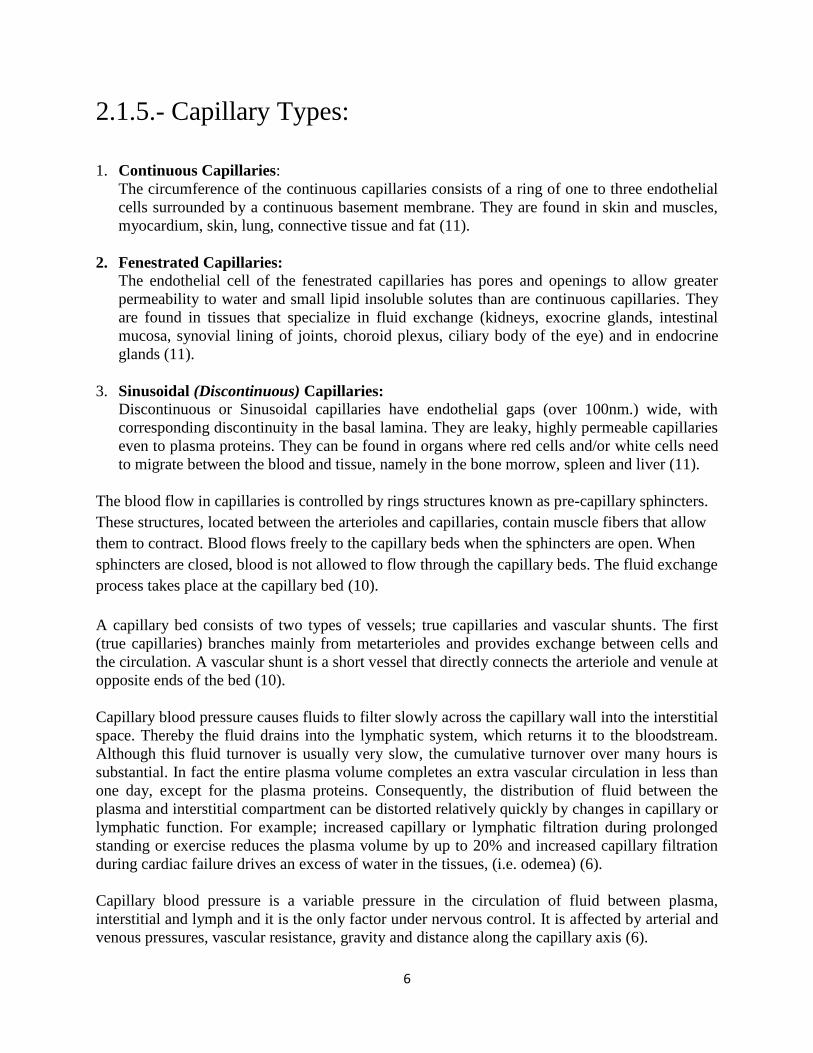
NE555 IC Pins Configuration:
- PIN 1 – Ground, DC Ground.
- PIN 2 – Trigger; When LOW, it causes the Output pin to go HIGH. Activated when
voltage fall below 1/3 of +V.
- PIN 3 – Output; Output is HIGH when Trigger pin is LOW. Output is LOW when
Threshold pin is HIGH. Output is LOW when reset pin is LOW. Output pin is able to
source or sink
current.
- PIN 4 – Reset; Short to +V when not in use.
- PIN 5: The control voltage pin allows the input of external voltages to affect the timing
of the 555 chip. When not used, it should be bypassed to ground through an 0.01uF
capacitor.
- PIN 6 – Threshold: When voltage reaches 2/3 of +V, this pin will cause Output to be
driven LOW.
- PIN 7 – Discharge; Grounded when Output pin goes HIGH.
- PIN 8 - +V, DC Power.
21
Fig.10 Pin configuration of NE555 (20)
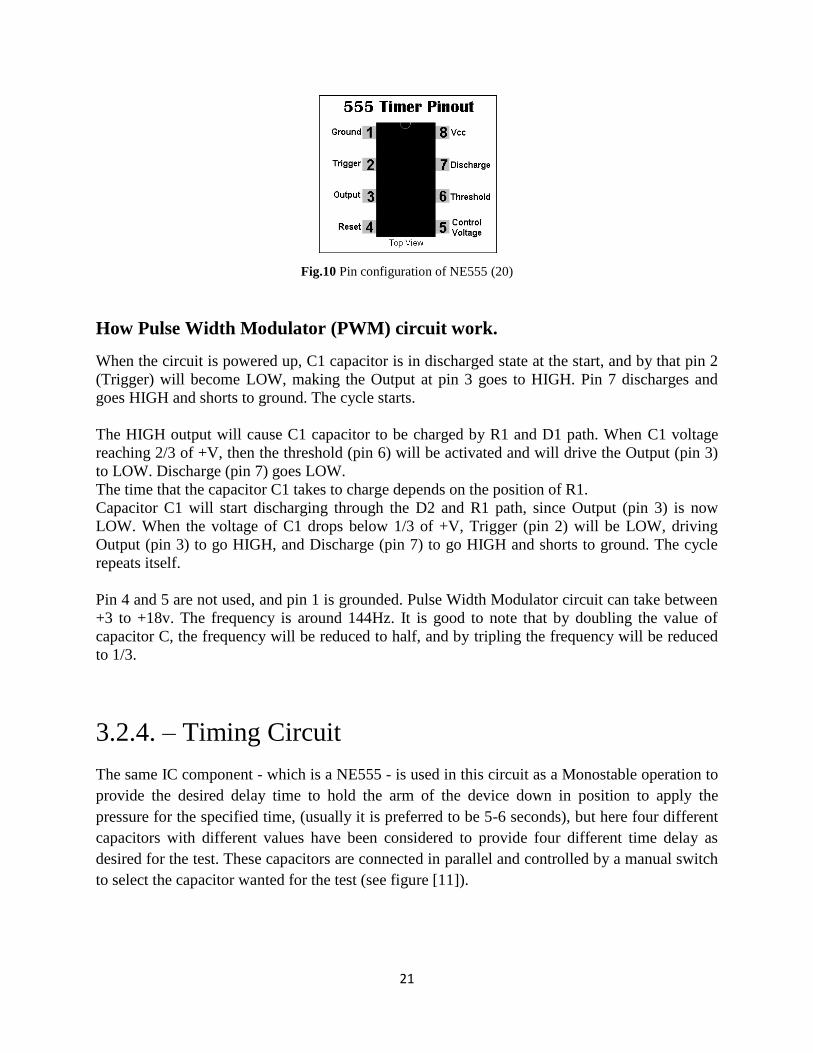
How Pulse Width Modulator (PWM) circuit work.
When the circuit is powered up, C1 capacitor is in discharged state at the start, and by that pin 2
(Trigger) will become LOW, making the Output at pin 3 goes to HIGH. Pin 7 discharges and
goes HIGH and shorts to ground. The cycle starts.
The HIGH output will cause C1 capacitor to be charged by R1 and D1 path. When C1 voltage
reaching 2/3 of +V, then the threshold (pin 6) will be activated and will drive the Output (pin 3)
to LOW. Discharge (pin 7) goes LOW.
The time that the capacitor C1 takes to charge depends on the position of R1.
Capacitor C1 will start discharging through the D2 and R1 path, since Output (pin 3) is now
LOW. When the voltage of C1 drops below 1/3 of +V, Trigger (pin 2) will be LOW, driving
Output (pin 3) to go HIGH, and Discharge (pin 7) to go HIGH and shorts to ground. The cycle
repeats itself.
Pin 4 and 5 are not used, and pin 1 is grounded. Pulse Width Modulator circuit can take between
+3 to +18v. The frequency is around 144Hz. It is good to note that by doubling the value of
capacitor C, the frequency will be reduced to half, and by tripling the frequency will be reduced
to 1/3.
3.2.4. – Timing Circuit
The same IC component - which is a NE555 - is used in this circuit as a Monostable operation to
provide the desired delay time to hold the arm of the device down in position to apply the
pressure for the specified time, (usually it is preferred to be 5-6 seconds), but here four different
capacitors with different values have been considered to provide four different time delay as
desired for the test. These capacitors are connected in parallel and controlled by a manual switch
to select the capacitor wanted for the test (see figure [11]).

22
The circuit consists of the following components:
- One NE555-IC component.
- RA at pin number 7
- A 10µF capacitor at pin number 5.
- A 10 k Ohm pull-up resistor at pin number 2.
- A 10 nF capacitor at pin number 1.
- at pin number 6 different capacitor values have been connected in parallel to add up the
desired delay timing:
1.5 µF to produce a 1 second time delay.
3.3 µF to produce a 2 seconds time delay.
6.8 µF to produce a 4 seconds time delay.
10 µF to produce a 6 seconds time delay.
Fig.11 Timing Delay circuit (21).
These delay capacitor values have been calculated as follow:
For a 6 seconds delay and let R= 1M ohm and then substitute in [6]

23
If RA= 5M ohm:
C
A standard capacitor value is 1.0 µF.
Using equation [6], If
A standard resistor value is 5.6 M ohm.
Now using the exact standard values for R, one can find the exact required value for C at each
time delay interval; the results will be referred to the nearest standard value:
For a 1 second time delay;
µF
A standard capacitor value is µF.
For a 2 seconds time delay:
µF
A standard capacitor value is 3.3 µF.

24
For a 4 seconds time delay:
A standard capacitor value is 6.8 µF.
For a 6 seconds time delay:
A standard Capacitor value is 10 µF.
An extra delay time option is considered in the design, thus by selecting more than one capacitor
at the same time, the delay time will be the sum of each capacitor’s time, so if all of the delay
capacitors were set ON, then the total delay time becomes:
3.2.5. – Pulse Shaper A pulse shaper (also known as a wave shaper) circuit is added to the timing circuit from pin
number 2, to control the triggering process of the time delay circuit. Pulse shaper circuit consists
of:
- Two diodes- 1N41 series. - Two resistors of 10 k Ohm. - A 10 nF capacitor.

25
Fig.12 Wave shaper (Pulse shaper) circuit
3.2.6. – Inverter An inverter circuit elements have been also added to the board to invert the triggering signal, so
when the input is high (+V) the output is low (0V), and when the input is low (0V) the output
becomes high (+V). The inverting circuit components are the following (see figure [13]).
- A one BC 337 Transistor.
- A resistor of 10 k Ohm
- A resistor of 1 K Ohm.
Fig.13 Inverter Circuit (22).
3.2.7. – Motor Controlling Switches
All of the previously mentioned circuits are controlled with four switches; these four switches
are photo electric components. Each switch consists of an Infra-red Light Emitting Diode
(LED), and a Photo-transistor. The principle of work of these switches is by aligning each infra-
red LED facing a photo transistor on a close distance and by powering up the infra-red LED, the

26
LED will start emitting light in the infra-red range, and the photo transistor will be switched ON
once it senses the emitted light from the infra-red LED. Thus as long as there is no blockage in
between each infra-red LED and the Photo Transistor, the circuit is ON. (See figure[14]).
Fig.14 Photo electric switches.
A very thin transparent disc is designed and mounted to pass in between the infra-red LED’s and
the photo transistors with black and clear slots arranged in circular patterns to act as ON-OFF
blockages for the photo electric switches. This disc with the circular patterns is directly mounted
on the motor shaft so it will always be synchronized with the motor rotation and so with the arm
positions of the device. (See figure [15]).
Fig.15 A transparent disc works a switch controller.
The four switches are used to control the process of the test when the device is used. These four
switches are set in a specific manner in order to run the entire test automatically with only one

27
single start push button providing all the desired movements and timing. Figure [16] shows
switches circuit diagram and their connections.
Fig.16 Switches circuit diagram.
3.2.8. – Power Battery Specifications
A D.C. power supply battery is the most suitable option to be used for this device, since the
motor is A D.C. motor, and since the test cycle takes a short time. In addition to that, a D.C.
battery is more convenient and portable which provides more mobility for this prototype. D.C.
battery is also preferred in clinical environments and tests since it is better in terms of safety
measures compared to A.C. power sources.
There are different battery types, sizes and powers. In order to determine the most suitable
battery option for this prototype, some calculation is required here. If a 1.5C Ah (Ampere-Hour)
rechargeable D.C. battery is considered with a 5A current, number of test cycles can be
calculated with these battery specifications.
Number of test cycles:
28
Assuming that each test cycle takes about 20 seconds,
This means 54 test cycles can be performed for each fully charged battery. One can observe that
this battery can be useful for this prototype.
3.2.9. – Detection Part
As stated before, the designed device is constructed and built to control the mechanical
parameters of capillary refilling test and measurements. However, this device is not capable of
performing detection part of the test. Therefore the detection will be captured using a Canon
EOS 550D digital camera to capture videos of the test process. Then video picture frames will be
analyzed using pre-made software known as Tissue Viability Imager (TiVi) (23).
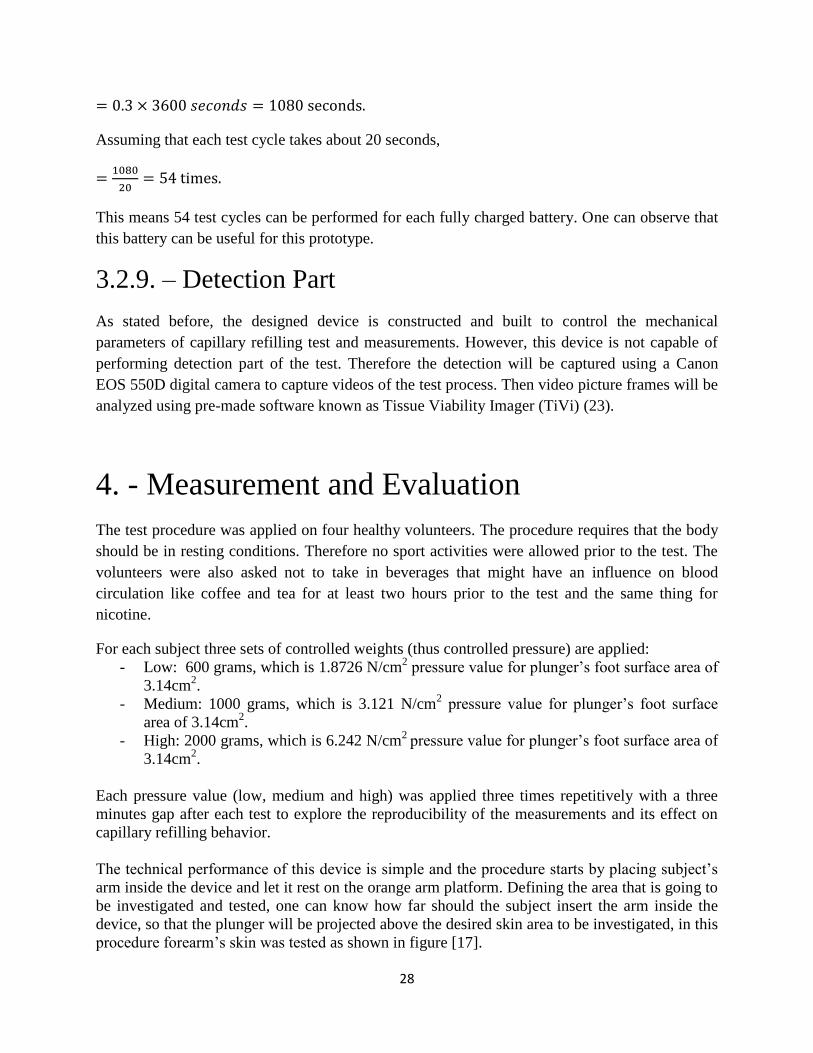
4. - Measurement and Evaluation
The test procedure was applied on four healthy volunteers. The procedure requires that the body
should be in resting conditions. Therefore no sport activities were allowed prior to the test. The
volunteers were also asked not to take in beverages that might have an influence on blood
circulation like coffee and tea for at least two hours prior to the test and the same thing for
nicotine.
For each subject three sets of controlled weights (thus controlled pressure) are applied:
- Low: 600 grams, which is 1.8726 N/cm2 pressure value for plunger’s foot surface area of
3.14cm2.
- Medium: 1000 grams, which is 3.121 N/cm2 pressure value for plunger’s foot surface
area of 3.14cm2.
- High: 2000 grams, which is 6.242 N/cm2
pressure value for plunger’s foot surface area of
3.14cm2.
Each pressure value (low, medium and high) was applied three times repetitively with a three
minutes gap after each test to explore the reproducibility of the measurements and its effect on
capillary refilling behavior.
The technical performance of this device is simple and the procedure starts by placing subject’s
arm inside the device and let it rest on the orange arm platform. Defining the area that is going to
be investigated and tested, one can know how far should the subject insert the arm inside the
device, so that the plunger will be projected above the desired skin area to be investigated, in this
procedure forearm’s skin was tested as shown in figure [17].

29
Fig.17 Shows subject’s arm in the device when the test is performed.
After setting up the device and the desired mass weights on top of the plunger (i.e.: the applied
pressure value), and after adjusting subject’s arm site for testing, the subject is asked to stay still
while the test is being conducted to ensure that the measurement and readings are accurate.
Selecting the desired time for skin compression (occlusion), in this experiment the micro switch
in time delay circuit was set to operate the 6.8 µF capacitor which gives a delay time of 4
seconds occlusion time. The camera is adjusted in a position that allows a clear site to capture a
video for the entire process. The device is then started by clicking a start push-button located on
the far end of the device’s frame near the motor side, thereafter the device will conduct the whole
test process automatically since photoelectric switches will take control of motor rotation speed,
skin compression time, and the fast release of the applied pressure.
4.1. - Results
The resultant data were converted using TiVi software (23). Red blood cell concentration,
occlusion and refilling slope in capillaries are displayed in graphs for each subject and for every
pressure value test, giving a total of nine tests per each subject. (See appendix).
Y-axis represents a magnitude value for red blood cell concentration in the skin while x-axis
represents time units. Every TiVi value is separated with 0.04 seconds (25 frames per second);
figure [18] represents one recording explaining the main parts of the curve. Data sequence of
time when the pressure was applied is removed for all subjects since all the readings of red blood
cells concentration are zero during occlusion time (i.e. 4 seconds).

30
Fig.18 Represents a graph of red blood cell concentration in capillaries and the different parts of the curve.
CRT measurement is done by calculating time interval starting from the first point when the
applied pressure is released; ending with the recording point at the time when TiVi value of red
blood cells concentration has reached the level of its pre-occlusion values. (See CRT tables). An
average TiVi value has been calculated to indicate the normal level of red blood cells
concentration prior to occlusion. With respect to this average TiVi value one can determine at
which time point TiVi value has again reached the normal level after occlusion. The data
sequence when the pressure was applied (i.e. during occlusion) is removed for all subjects since
the concentration of red blood cells was zero during occlusion.
The following tables summarize CRT values for each test of each subject.
Table -1- Shows CRT values for each test performed on subject 1.
Subject 1
Pressure (N/cm
2)
Test 1 Test 2 Test 3
1.8726 CRT= 9.76 - 5.96 = 3.8 sec CRT= 9.92 - 6.56 =3.36 sec
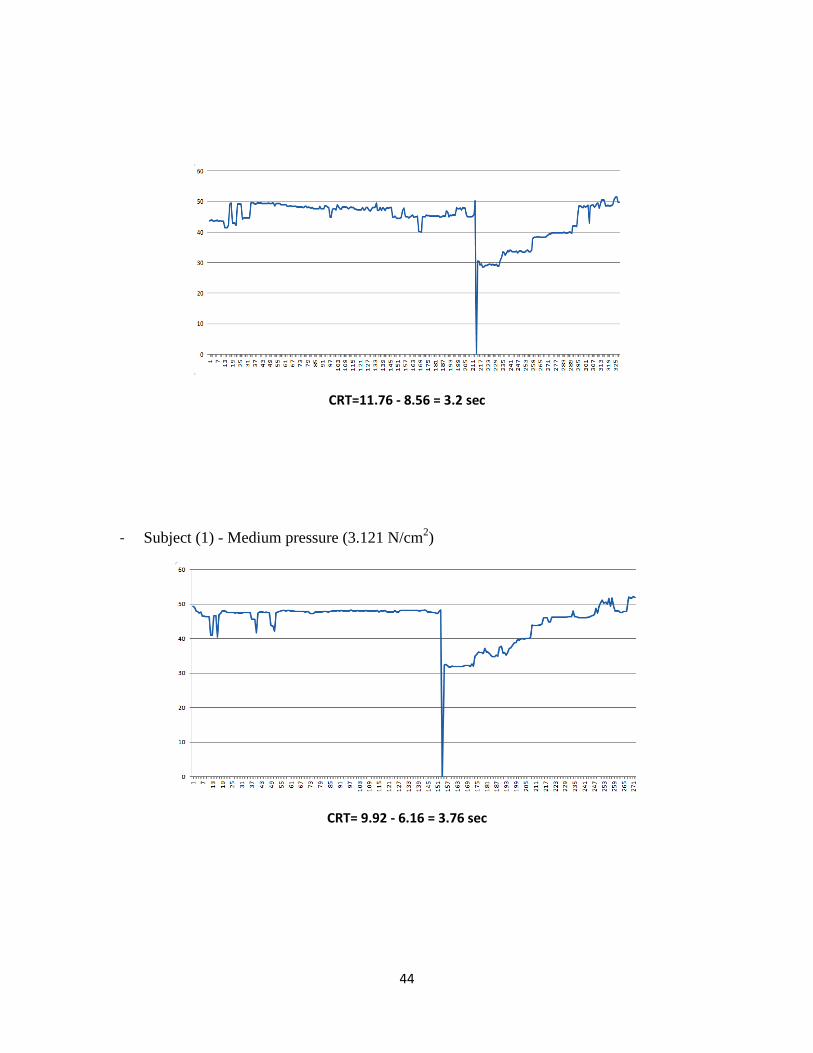
CRT=11.76 - 8.56 = 3.2 sec
3.121 CRT= 9.92 - 6.16 = 3.76 sec
CRT= 8.8 - 6.4 = 2.4 sec CRT= 4.56 - 1.88 = 2.68 sec
6.242 CRT= 4.68 - 1.92 = 2.76 sec
CRT= 8.8 - 5.6 = 3.2 sec CRT= 9.88 - 6.4 = 3.48 sec

31
Table -2- Shows CRT values for each test performed on subject 2.
Table -3- Shows CRT values for each test performed on subject 3.
The following tables summarize the different measurements for each individual test. The point
when occlusion occurs and red blood cell concentration dropped down to zero is presented in
red. Prior to occlusion red blood cell concentration is recorded at one TiVi segment (i.e. 0.04
second). Directly following occlusion, another red blood cell concentration record is taken after a
0.04 second. These values are highlighted in grey. Starting from these time instants, other red
Subject 2
Pressure (N/cm
2)
Test 1 Test 2 Test 3
1.8726 CRT= 10.88 - 5.64 = 5.24 sec
CRT= 9 - 5.48 = 3.52 sec CRT= 9.48 - 5.4 = 4.08 sec
3.121 CRT= 9.6 - 5.72 = 3.88 sec CRT= 8.36 - 4.88 = 3.48 sec
CRT= 8.32 - 4.88 = 3.44 sec
6.242 CRT= 8.76- 5.8 = 2.96 sec CRT= 6.76 - 5.48 =1.28 sec
CRT= 7 - 4.8 = 2.2 sec
Subject 3
Pressure (N/cm
2)
Test 1 Test 2 Test 3
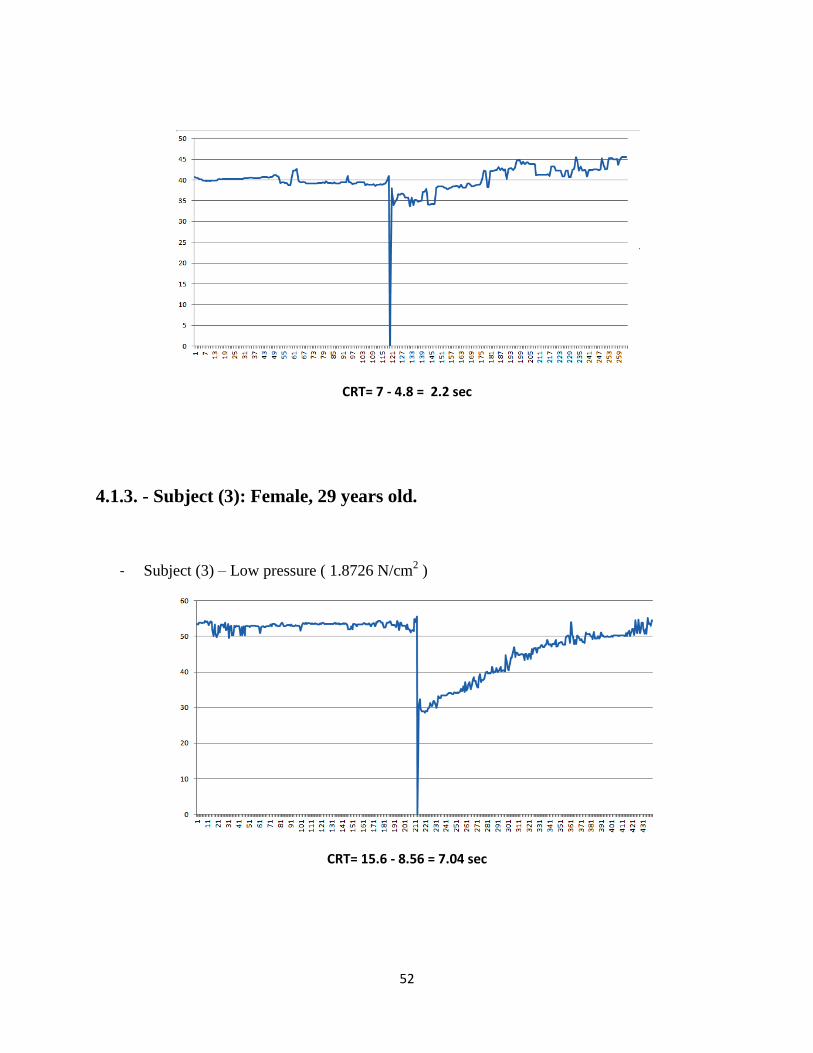
1.8726 CRT= 15.6 - 8.56 = 7.04 sec
CRT= 10.08 - 5.28 = 4.8 sec
CRT= 10.52 - 5.52 = 5 sec
3.121 CRT= 10.44 - 5.52 = 4.92 sec
CRT= 11.08 - 5.64 = 5.44 sec
CRT= 11.44 - 7.2 = 4.24 sec
6.242 CRT= 10.44 - 5.64 = 4.8 sec
CRT= 9.12 - 5.36 = 3.76 sec
CRT= 8.32 - 5.24 = 3.08 sec
Subject 4
Pressure (N/cm
2)
Test 1 Test 2 Test 3
1.8726 CRT= 11.52 - 5.8 = 5.72 sec
CRT= 11 - 5.92 = 5.08 sec CRT= 9.72 - 6.24 = 3.48 sec
3.121 CRT= 11.64 - 6.08 = 5.56 sec
CRT= 10.48 - 5.36 = 5.12 sec
CRT= 11.6 - 6.4 = 5.2 sec
6.242 CRT= 11.4 - 5.48 = 5.92 sec
CRT= 11 - 5.56 = 5.44 sec CRT= 10.96 - 5.4 = 5.56 sec
Table -4- Shows CRT values for each test performed on subject 4.

32
blood cells concentration values are evaluated both prior and after occlusion with a 1 second
time interval based on the data provided by TiVi record. The percentage of change per second is
calculated for each record to indicate changing rate of red blood cell concentration and thereby
the blood that is being refilled in capillaries with respect to the applied pressure.
4.1.1. - Subject (1): Male, 24 years old. - Subject (1) - Low pressure ( 1.8726 N/cm
2 )
Table -5- Shows the percentage change of red blood cells concentration per second. Numbers in red color represent
data during occlusion. Numbers shown in bold represent data prior and after occlusion with 0.04 second time
division.
- Subject (1) - Medium pressure (3.121 N/cm2)
Table -6- Shows the percentage change of red blood cells concentration per second. Numbers in red color represent
data during occlusion. Numbers shown in bold represent data prior and after occlusion with 0.04 second time
division.

33
- Subject (1) - High pressure (6.242 N/cm2)
Table -7- Shows the percentage change of red blood cells concentration per second. Numbers in red color represent
data during occlusion. Numbers shown in bold represent data prior and after occlusion with 0.04 second time
division.
4.1.2. - Subject (2): Male, 28 years old - Subject (2) - Low pressure ( 1.8726 N/cm
2 )
Table -8- Shows the percentage change of red blood cells concentration per second. Numbers in red color represent
data during occlusion. Numbers shown in bold represent data prior and after occlusion with 0.04 second time
division.

34
- Subject (2) - Medium pressure (3.121 N/cm2)
Table -9- Shows the percentage change of red blood cells concentration per second. Numbers in red color represent
data during occlusion. Numbers shown in bold represent data prior and after occlusion with 0.04 second time
division.
- Subject (2) - High pressure (6.242 N/cm2)
Table -10- Shows the percentage change of red blood cells concentration per second. Numbers in red color
represent data during occlusion. Numbers shown in bold represent data prior and after occlusion with 0.04 second
time division.

35
4.1.3. - Subject (3): Female, 29 years old. Subject (3) - Low pressure (1.8726 N/cm
2)
Table -11- Shows the percentage change of red blood cells concentration per second. Numbers in red color
represent data during occlusion. Numbers shown in bold represent data prior and after occlusion with 0.04 second
time division.
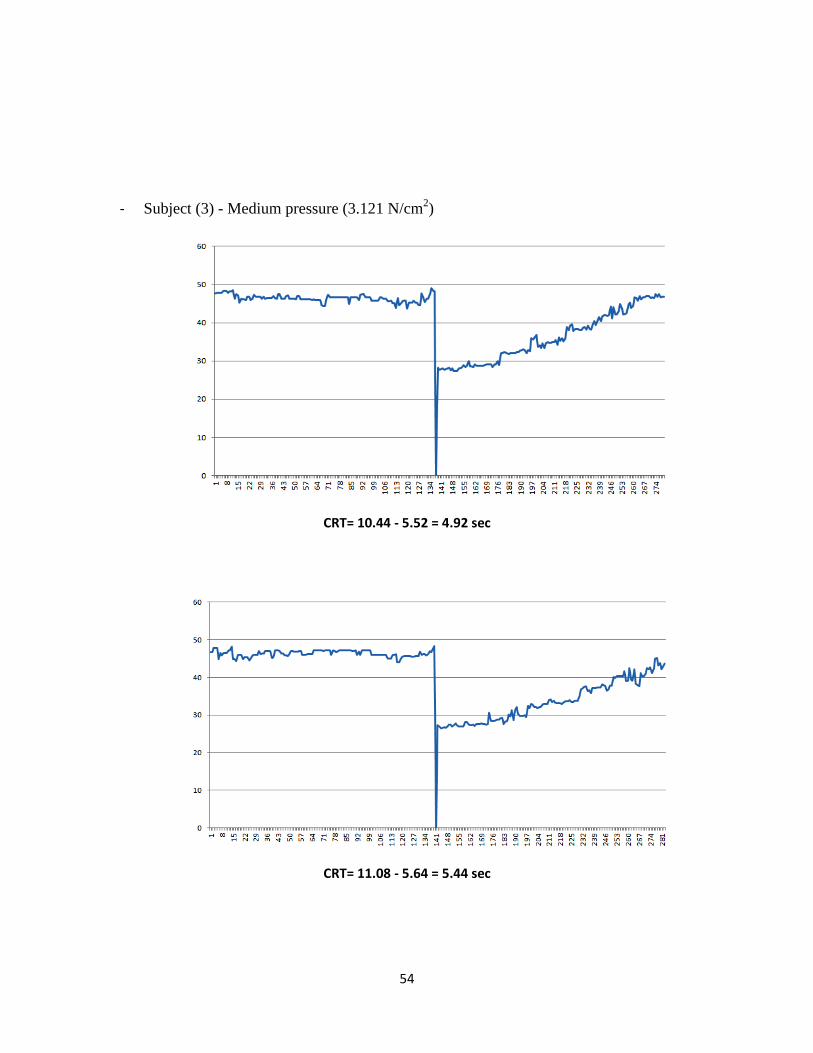
- Subject (3) - Medium pressure (3.121 N/cm2)
Table -12- Shows the percentage change of red blood cells concentration per second. Numbers in red color
represent data during occlusion. Numbers shown in bold represent data prior and after occlusion with 0.04 second
time division.
36
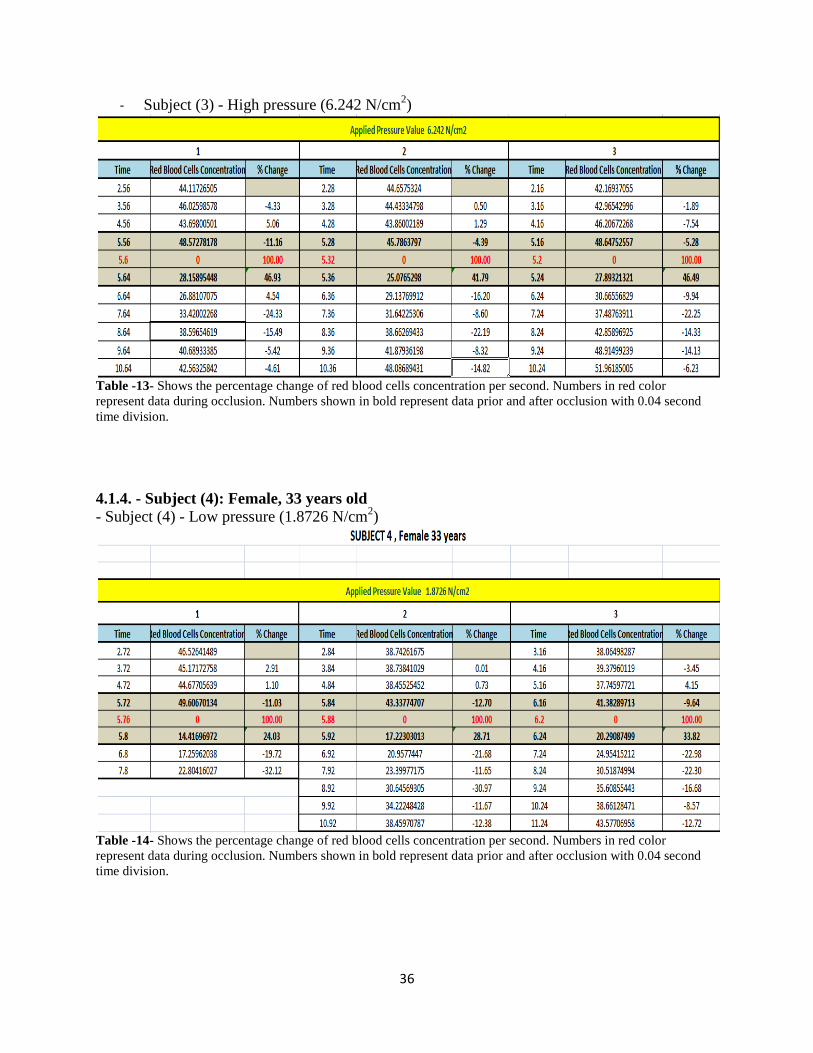
- Subject (3) - High pressure (6.242 N/cm2)
Table -13- Shows the percentage change of red blood cells concentration per second. Numbers in red color
represent data during occlusion. Numbers shown in bold represent data prior and after occlusion with 0.04 second
time division.
4.1.4. - Subject (4): Female, 33 years old
- Subject (4) - Low pressure (1.8726 N/cm2)
Table -14- Shows the percentage change of red blood cells concentration per second. Numbers in red color
represent data during occlusion. Numbers shown in bold represent data prior and after occlusion with 0.04 second
time division.

37
- Subject (4) - Medium pressure (3.121 N/cm2)
Table -15- Shows the percentage change of red blood cells concentration per second. Numbers in red color
represent data during occlusion. Numbers shown in bold represent data prior and after occlusion with 0.04 second
time division.
- Subject (4) - High pressure (6.242 N/cm2)
Table -16- Shows the percentage change of red blood cells concentration per second. Numbers in red color
represent data during occlusion. Numbers shown in bold represent data prior and after occlusion with 0.04 second
time division.
38
5. - Discussion
With adjustable pressure values and controlled skin compression time, the present prototype is
effectively capable of controlling mechanical parameters and capillaries occlusion time in which
blood in microcirculation is being expelled from the site non-invasively. The device can also be
used for other body sites which can be investigated clinically for capillary refilling measurement
tests such as: hands, fingers and nail beds of the hands.
This device has controlled mechanical pressure and skin compression time; it performs skin
compression automatically throughout the entire process. The compression cycle consists of
three main phases: dropping the arm in a smooth slow motion, holding the arm down in position
during skin compression with a controlled time (1, 2, 4 or 6 seconds) with an option of
combining a summation of these time intervals, giving a total skin compression time up to 13
seconds, (i.e.: 1+2+4+6 =13 seconds.). The third and last phase of the cycle is a quick revert of
the arm to its starting position.
Based on the calculated CRT values and the number of iterations of the test in CRT tables, one
can observe that given the same applied pressure value, CRT values do not significantly vary
when the test is repetitively conducted on the same subject and on the same site. However, there
is some CRT readings (underlined) showing higher variation for the same pressure value that is
used on the same subject. This variation can be due to physiological variability like heart rate,
blood pressure or body temperature.
It was also observed that in subject 1, red blood cells concentration is decreasing when the
pressure value is increased; this can be noted by the percentage change of red blood cell
concentration at the first time segment that follows occlusion. When 1.8726 N/cm2
is applied at
time 5.96 sec. 57.51% of the blood was refilled and for 3.121 N/cm2
pressure is applied at time
6.16 sec. 53.85% of the blood was refilled and on the other hand whereas 6.242 N/cm2 is applied
at time 1.92 sec. 46.02% of the blood is being refilled, at the first test iteration for all of them.
Subject 2 showed an inverse relation between the applied pressure and CRT values, i.e. when the
applied pressure value was increased, CRT values decreased for each test.
Capillary Refilling Time (CRT) and responses may vary due to the differences in skin thickness,
skin color shades, heart rate and blood pressure. Ambient temperature is also an essential factor
that can influence the concentration of red blood cells and thereby refilling time. The results
show that most of the CRT values are within the same range of other test iterations. However, in
some readings CRT values may slightly vary between each test iterations compared to other
measurements of the same test and for the same subject. This could be an error during the set-up
of the test or during detection process. In this study only two males and two females were tested
so no statistical conclusions can be drawn from these limited sets of data.

39
5.1. - Comparison with Previous Studies
Comparing this non-invasive prototype to previously made studies in Capillary Refilling Time,
as Shani’s patent, (5) which does capillary refilling test and computes the time for the capillaries
to refill by assessing the changes in skin color from white (blanching) when the pressure-
compression-is applied, until obtaining a pink skin color (i.e. capillaries are refilled with blood)
when the pressure is released. Shani’s device uses a good detection method based on color
sensors and timing circuits to get the signal based on skin color changes. However, it doesn’t
have an explicit explanation regarding the methodology of the applied pressure parameters,
which are highly valuable factors that may change the result of the entire test and the only
defined parameter is skin compression time. While the presented prototype has both of
compression time and the applied pressure defined and both of them are controllable.
In terms of usage and reproducibility, the present prototype device guarantees the same value of
applied pressure for every test iteration since the pressure is controlled and measureable. This is
an essential mechanical parameter in CRT test that Shani’s device lacks, and therefore, in
Shani’s device, test iterations do not guarantee the same pressure value which makes the CRT
result inaccurate.
In the present prototype, CRT calculation is done by computing the time interval starting from
the point when the applied pressure was released, ending with the recording point at the time
when TiVi value of red blood cells concentration has reached the level of its pre-occlusion
values.
5.2. - Factors to Consider
There are number of factors that can have an influence on CRT test and its results. For instance
body site where CRT tests are being performed. As stated earlier, in this experiment the CRT test
was performed on the forearm of the four subjects. There are other locations in the human body
where physicians are also interested to study CRT, for instance hand fingers, hand palm, nail bed
and the also the forehead. CRT results may differ in each location depending on the anatomical
and physiological orientation of that site and most importantly depending on tissue compositions
like fatty tissues and bones.
Ambient temperature is also an essential factor that can influence the refilling responses and
thereby the refilling time can be affected due to vasoconstriction phenomena. So when the
ambient temperature is relatively cold, the refilling response will be slower and so the capillaries
take longer time to refill.
In electronic design of the time delay circuit that controls skin compression time, timing
capacitor values have been calculated accurately but then chosen to accommodate the nearest
available standard of capacitor values. This can results in a difference of in
occlusion time.

40
6. - Conclusion
The present prototype has met its main goal which is to design and to construct a device that is
capable of performing CRT tests with defined mechanical parameters. With this prototype
device, the mechanical parameters and compression time for CRT tests are completely
measurable and adjustable.
The present prototype device is non-invasive, portable and can be used easily by the designated
personnel. At the time being this prototype is very helpful to conduct more studies about CRT
and other capillary refilling studies due to the fact that this prototype device introduced accuracy,
reducibility and controlling options for the applied pressure and compression time.
This prototype device can be also used for other body sites like hand, fingers, nail bed.
One of the main achievements in this prototype device is that, CRT tests are now controlled and
standardized from the methodology side since both mechanical parameters and detection
techniques are well defined. The only variability left can be claimed depending on patient’s
criteria, skin color, skin thickness, body size, weight, blood pressure…etc.
6.1. - Future Work
Even if the major goals of the project have been fulfilled, some beneficial ideas raised gradually
during work process of this project. The following potential ideas can be considered for future
research work and development.
Modifying the existing prototype device to accommodate other body parts like the
forehead and other parts in which physicians and researchers are interested in
investigating CRT and capillary refilling responses.
Investigate the possibilities of applying other mechanical principles to generate controlled
and measurable pressure values like spring loaded pistons and/or air pressure piston for
more compatibility and to reduce the size of the current prototype device to make it more
portable.
To combine the detection part with the device, by using a smaller size camera that can be
attached to the plunger of the device.
It would be very interesting to investigate the potentials of combining an advanced
detection technique of microcirculation such as Laser Doppler Flow meter (LDF)
together with this prototype device.

41
7. - References
1. The effect of rapid local cooling on human finger nailfold. Shore, Martin Hahn and Angela C. 1994,
Journal of Physiology, pp. 109-114.
2. M. A. PERRY, J. G. COLEBATCH, W. E. GLOVER, AND I. C. RODDIE. Measurement of capillary pressure
in humans. Sydney : School of Physiology and Pharmacology, University of New South Wales, Sydney
2033, Australia;, 1985.
3. L. W. EICHNA AND JAMES BORDLEY, III. CAPILLARY BLOOD PRESSURE IN MAN. COMPARISON OF. s.l. :
Department of Medicine, The Johns Hopkins University School of Medicine,, Received for publication
July 10, 1939.
4. Krzysztof S Strozik, Clarissa H Pieper, Jacques Roller. Capillary refilling time in newborn babies:
normal. s.l. : Archives of Disease in Childhood 1997;76:F193–F196, 1997.
5. Haim SHANI, Ittai SHAVIT. AN IMPROVED METHOD AND APPARATUS FOR THE DIAGNOSIS OF ACTUAL
OR PRE-SHOCK STATE. Israel , August 1, 2000. Apparatus.
6. Levick, J. Rodney. An Introduction to Cardiovascular Physiology, 5th Edition.
7. Maton, Anthea and Jean Hopkins, Charles William McLaughlin, Susan Johnson, Maryanna Quon
Warner, David LaHart, Jill D. Wright. Human Biology and Health. New Jersey: Prentice Hall : Englewood
Cliffs , 1993. ISBN 0-13-981176-1.
8. Penn, John S. Retinal and Choroidal Angiogenesis. s.l. : Springer, 2008. ISBN 978-1-4020-6779-2.
9. Gilbert, Scott F. Endoderm -- Developmental Biology -- NCBI Bookshelf". . Sunderland : Swarthmore
College, 2000. ISBN-10: 0-87893-243-7.
10. Bailey, Regina. www.about.com. www.biology.about.com. [Online] Part of The New York Times
Company. [Cited: 8 31, 2012.] http://biology.about.com/od/anatomy/ss/capillary.htm.
11. Pavelka, Margit and Roth, Jürgen. Functional Ultrastructure: An Atlas of Tissue Biology and
Pathology. s.l. : Springer. p. 232, 2005.
12. U.S. DEPARTMENT OF COMMERCE, Carlos M. Gutierrez, Secretary. THE INTERNATIONAL SYSTEM OF
UNITS (SI). WASHINGTON : NATIONAL INSTITUTE OF STANDARDS AND TECHNOLOGY, James Turner,
Acting Director, 2008.
13. LUDWIG W. EICHNA AND JAMES BORDLEY, III. CAPILLARY BLOOD PRESSURE IN MAN. DIRECT
MEASUREMENTS IN THE. s.l. : Department of Medicine, The Johns Hopkins University School of
Medicine,, Received for publication June 1, 1942.

42
14. Fogt., Robert. www.onlineconversion.com. www.onlineconversion.com. [Online] Copyright 1997-
2010. [Cited: 7 2, 2012.] http://www.onlineconversion.com/license.htm.
15. 2002-2006, V. Ryan ©. www.technologystudent.com. www.technologystudent.com. [Online] 2002-
2006. [Cited: 8 30, 2012.] http://www.technologystudent.com/cams/cam11.htm.
16. eMachineShop.com, © 2012. www.emachineshop.com. www.emachineshop.com. [Online] [Cited: 8
30, 2012.] http://www.emachineshop.com/machine-shop/Coefficient-of-Friction/page531.html.
17. Barr, Michael. www.barrgroup.com. www.barrgroup.com. [Online] BARR GROUP, 2007. [Cited: 8 30,
2012.] http://www.barrgroup.com/Embedded-Systems/How-To/PWM-Pulse-Width-Modulation.
18. Chein. www.instructables.com. www.instructables.com. [Online] [Cited: 8 30, 2012.]
http://www.instructables.com/id/Simple-and-dirty-Pulse-Width-Modulation-PWM-Wi/.
19. www.allaboutcircuits.com. www.allaboutcircuits.com. [Online] [Cited: 8 30, 2012.]
http://www.allaboutcircuits.com/vol_6/chpt_3/9.html.
20. Semiconductor, National. LM555 Data Sheet. 2006.
21. Lab, ECE. www.ecelab.com. www.ecelab.com. [Online] ECE Lab, 2006. [Cited: 8 30, 2012.]
http://ecelab.com/circuit-astable-555.htm.
22. © John Hewes 2011, The Electronics Club. Transistor Circuits. www.kpsec.freeuk.com. [Online]
Electronics Club, 2011. [Cited: 8 30, 2012.] http://www.kpsec.freeuk.com/trancirc.htm.
23. AB, WheelsBridge. Wheels Bridge. www.wheelsbridge.se. [Online] WheelsBridge AB. [Cited: 8 30,
2012.] http://www.wheelsbridge.se/.

43
Appendix
4.1.1. - Subject (1): Male, 24 years old.
- Subject (1) - Low pressure ( 1.8726 N/cm2 )
CRT= 9.76 - 5.96 = 3.8 sec
CRT= 9.92 - 6.56 =3.36 sec
44
CRT=11.76 - 8.56 = 3.2 sec
- Subject (1) - Medium pressure (3.121 N/cm2)
CRT= 9.92 - 6.16 = 3.76 sec

45
CRT= 8.8 - 6.4 = 2.4 sec
CRT= 4.56 - 1.88 = 2.68 sec

46
- Subject (1) - High pressure (6.242 N/cm2)
CRT= 4.68 - 1.92 = 2.76 sec
CRT= 8.8 - 5.6 = 3.2 sec

47
CRT= 9.88 - 6.4 = 3.48 sec

48
4.1.2. - Subject (2): Male, 28 years old
- Subject (2) - Low pressure ( 1.8726 N/cm2 )
CRT= 10.88 - 5.64 = 5.24 sec
CRT= 9 - 5.48 = 3.52 sec

49
CRT= 9.48 - 5.4 = 4.08 sec
- Subject (2) - Medium pressure (3.121 N/cm2)
CRT= 9.6 - 5.72 = 3.88 sec

50
CRT= 8.36 - 4.88 = 3.48 sec
CRT= 8.32 - 4.88 = 3.44 sec

51
- Subject (2) - High pressure (6.242 N/cm2)
CRT= 8.76- 5.8 = 2.96 sec
CRT= 6.76 - 5.48 =1.28 sec
52
CRT= 7 - 4.8 = 2.2 sec
4.1.3. - Subject (3): Female, 29 years old.
- Subject (3) – Low pressure ( 1.8726 N/cm2 )
CRT= 15.6 - 8.56 = 7.04 sec

53
CRT= 10.08 - 5.28 = 4.8 sec
CRT= 10.52 - 5.52 = 5 sec
54
- Subject (3) - Medium pressure (3.121 N/cm2)
CRT= 10.44 - 5.52 = 4.92 sec
CRT= 11.08 - 5.64 = 5.44 sec

55
CRT= 11.44 - 7.2 = 4.24 sec
- Subject (3) - High pressure (6.242 N/cm2)
CRT= 10.44 - 5.64 = 4.8 sec

56
CRT= 9.12 - 5.36 = 3.76 sec
CRT= 8.32 - 5.24 = 3.08 sec

57
4.1.4. - Subject (4): Female, 33 years old
- Subject (4) – Low pressure ( 1.8726 N/cm2 )
-
CRT= 11.52 - 5.8 = 5.72 sec
CRT= 11 - 5.92 = 5.08 sec

58
CRT= 9.72 - 6.24 = 3.48 sec
- Subject (4) - Medium pressure (3.121 N/cm2)
CRT= 11.64 - 6.08 = 5.56 sec
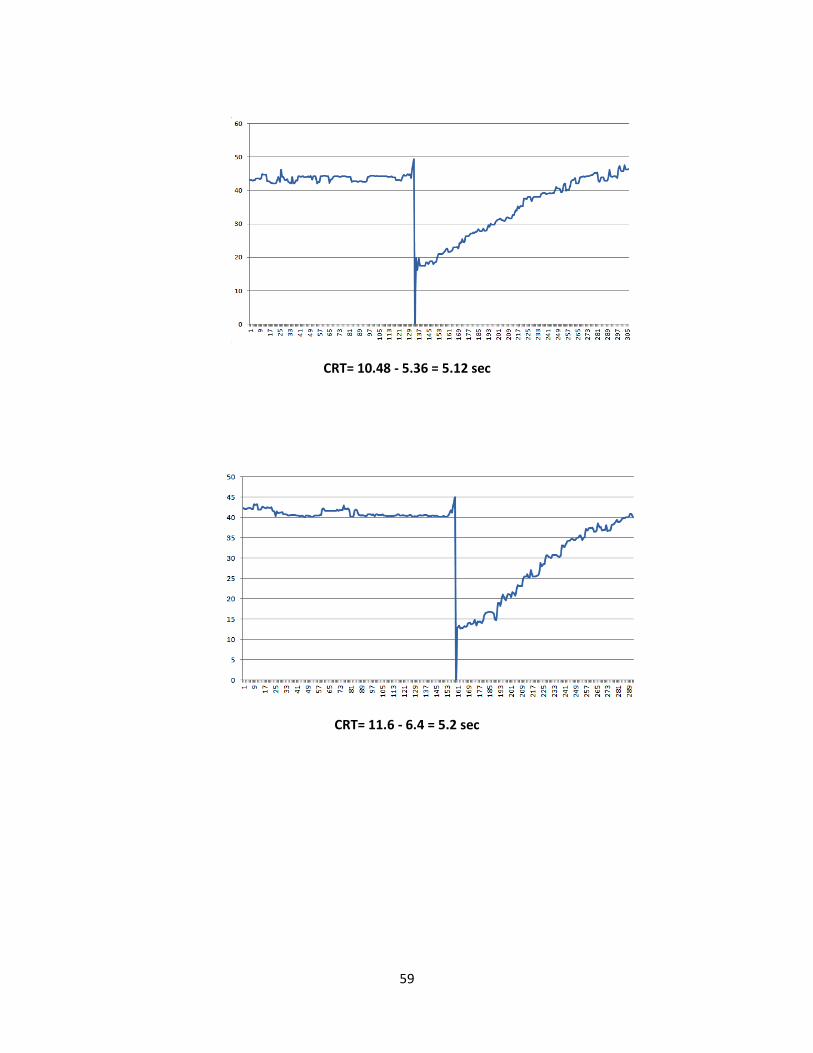
59
CRT= 10.48 - 5.36 = 5.12 sec
CRT= 11.6 - 6.4 = 5.2 sec

60
- Subject (4) - High pressure (6.242 N/cm2)
CRT= 11.4 - 5.48 = 5.92 sec
CRT= 11 - 5.56 = 5.44 sec

61
CRT= 10.96 - 5.4 = 5.56 sec