a crisis of trust: the rise of protest politics in australia · a crisis of trust: the rise of...
TRANSCRIPT
A crisis of trust: The rise of protest politics in Australia
Grattan Institute Support
Founding members Endowment Supporters
The Myer Foundation
National Australia Bank
Susan McKinnon Foundation
Affiliate Partners
Medibank Private
Susan McKinnon Foundation
Senior Affiliates
Maddocks
PwC
McKinsey & Company
The Scanlon Foundation
Wesfarmers
Affiliates
Ashurst
Corrs
Deloitte
GE ANZ
Jemena
Urbis
Westpac
Woodside
Grattan Institute Report No. 2018-05, March 2018
This report was written by Danielle Wood, John Daley, and CarmelaChivers. Hugh Parsonage and Lucy Percival provided extensiveresearch assistance and made substantial contributions to the report.
We would like to thank the members of Grattan Institute’s Public PolicyCommittee for their comments. We also thank Judith Brett, GabrielleChan, Raphaella Crosby, Royce Kurmelovs, Aaron Martin, JenniferRayner, Tony Ward, The Regional Australia Institute and a number oforganisations and individuals in Emerald, Mildura and Whyalla for theirhelpful input.
The opinions in this report are those of the authors and do notnecessarily represent the views of Grattan Institute’s foundingmembers, affiliates, individual board members reference groupmembers or reviewers. Any remaining errors or omissions are theresponsibility of the authors.
Grattan Institute is an independent think-tank focused on Australianpublic policy. Our work is independent, practical and rigorous. We aimto improve policy outcomes by engaging with both decision-makers andthe community.
For further information on the Institute’s programs, or to join our mailinglist, please go to: http://www.grattan.edu.au/.
This report may be cited as: Wood, D., Daley, J., and Chivers, C. (2018). A crisis of
trust: The rise of protest politics in Australia. Grattan Institute.
ISBN: 978-0-6482307-5-5
All material published or otherwise created by Grattan Institute is licensed under aCreative Commons Attribution-NonCommercial-ShareAlike 3.0 Unported License
Grattan Institute 2018 2
A crisis of trust: The rise of protest politics in Australia
Overview
Australian voters are seeking change. The vote share of minor partieshas been rising since 2007. At the 2016 election it reached its highestlevel since the Second World War. More than one-in-four Australiansvoted for someone other than the Liberals, Nationals, ALP or theGreens in the Senate, and more than one-in-eight in the House ofRepresentatives.
The major parties are particularly on the nose in the regions. Thefurther you travel from a capital city GPO the higher the minor partyvote and the more it has risen.
The minor party vote is mostly a protest vote against the major parties:a vote for ‘anyone but them’. Voter disillusionment with the politicalestablishment is not just an Australian phenomenon. ‘Outsider politics’is also on the rise across other developed nations. The Brexit vote inthe UK and Donald Trump’s win in the 2016 US presidential electionare just two recent examples.
So why are Australian voters angry? And why are they particularlyangry in the regions?
Falling trust in government explains much of the dissatisfaction. Minorparty voters have much lower trust in government than those whovote for the majors. And since the minor party vote began to rise in2007 there has been a significant increase in the share of people whobelieve politicians look after themselves and government is run by a fewbig interests. More than 70 per cent of Australians think our system ofgovernment needs reform. Voters are choosing parties that promise to‘drain the swamp’.
Economics alone is less important. The largest increase in supportfor minor parties in Australia came during a period of strong wages
growth and stable inequality. And economic insecurity can’t explain thewidening city/regional voting divide: the regions are keeping pace onmost indicators of individual economic well-being.
But the overall loss of economic and cultural power in the regionslooms large in regional dissatisfaction. Regions hold a falling shareof Australia’s population, and consequently their share of the nation’seconomy is shrinking. Australia’s cultural symbols are becoming morecity-centric – from mateship to multiculturalism, Man from Snowy Riverto Masterchef, what it means to be an Australian is changing. Concernsthat ‘the world is changing too fast’ are higher among regional voters,as are concerns about immigration.
But cultural anxiety is not restricted by geography: there are a swatheof minor party voters in the cities and regions who are unhappy withthe way the world is changing. These voters place more emphasis ontradition and ‘the Australian way of life’. The rhetoric and policies ofsome minor parties tap into these values.
Politicians seeking to stem the flow of votes to minor parties need torespond to these push factors. Rebuilding trust will be a slow process.A period of leadership stability and policy delivery could go a long way.But improving political institutions – reforming political donations lawsand improving the regulation of lobbying activities, for example – couldhelp reassure the public that the system is working for them.
Politicians should also seek to dampen rather than inflame culturaldifferences. Language and symbols matter in these debates. Politicianscan take a positive leadership role in stressing the common groundbetween city and country and between communities with differentbackgrounds.
Grattan Institute 2018 3
A crisis of trust: The rise of protest politics in Australia
Table of contents
Overview . . . . . . . . . . . . . . . . . . . . . . . . . . . . . . . . 3
1 Introduction . . . . . . . . . . . . . . . . . . . . . . . . . . . . . 7
2 The growing minor party vote . . . . . . . . . . . . . . . . . . . 14
3 Policy or protest? . . . . . . . . . . . . . . . . . . . . . . . . . . 24
4 Does economic insecurity explain the rising minor party vote? . . 29
5 Does the minor party vote reflect growing cultural divides? . . . . 49
6 Does distrust in government and politicians help drive theminor party vote? . . . . . . . . . . . . . . . . . . . . . . . . . . 69
7 What should governments do? . . . . . . . . . . . . . . . . . . . 83
A The data used in this report . . . . . . . . . . . . . . . . . . . . 90
Grattan Institute 2018 4
A crisis of trust: The rise of protest politics in Australia
List of Figures
1.1 The minor party vote at federal elections has risen over time . . . . . . . . . . . . . . . . . . . . . . . . . . . . . . . . . . . . . . . . . . . . . . . . 81.2 Understanding the growing minor party vote: a framework . . . . . . . . . . . . . . . . . . . . . . . . . . . . . . . . . . . . . . . . . . . . . . . . . 11
2.1 The vote for minor parties is higher, and the difference between inner-city and remote is increasing . . . . . . . . . . . . . . . . . . . . . . . . . . 142.2 The rising minor party vote has come at the expense of Liberals/Nationals and Labor . . . . . . . . . . . . . . . . . . . . . . . . . . . . . . . . . . 152.3 The vote for minor parties was lower in 2004 and less obviously regional . . . . . . . . . . . . . . . . . . . . . . . . . . . . . . . . . . . . . . . . . 162.4 The vote for minor parties increases further from the capital cities . . . . . . . . . . . . . . . . . . . . . . . . . . . . . . . . . . . . . . . . . . . . . 162.5 In Queensland, Pauline Hanson’s vote is strongly regional; other minor parties less so . . . . . . . . . . . . . . . . . . . . . . . . . . . . . . . . . 172.6 Small minor parties gained most of the minor party vote . . . . . . . . . . . . . . . . . . . . . . . . . . . . . . . . . . . . . . . . . . . . . . . . . . 182.7 The vote for traditional parties is falling across advanced economies . . . . . . . . . . . . . . . . . . . . . . . . . . . . . . . . . . . . . . . . . . . 192.8 The vote share for populist right wing parties has been rising for a long time, and the radical left had a recent resurgence . . . . . . . . . . . . . . 192.9 The vote for Brexit was higher in areas more remote from large cities . . . . . . . . . . . . . . . . . . . . . . . . . . . . . . . . . . . . . . . . . . . 212.10 US politics is strongly defined by geography . . . . . . . . . . . . . . . . . . . . . . . . . . . . . . . . . . . . . . . . . . . . . . . . . . . . . . . . 212.11 The minor party vote-share correlates with tertiary education, income, and migration rates . . . . . . . . . . . . . . . . . . . . . . . . . . . . . . . 222.12 Minor party voters are more likely to be religious, and to not have a university degree . . . . . . . . . . . . . . . . . . . . . . . . . . . . . . . . . . 23
3.1 The micro party vote has also been growing . . . . . . . . . . . . . . . . . . . . . . . . . . . . . . . . . . . . . . . . . . . . . . . . . . . . . . . . 243.2 ‘Brand name’ candidates boost the minor party vote . . . . . . . . . . . . . . . . . . . . . . . . . . . . . . . . . . . . . . . . . . . . . . . . . . . . 253.3 The number of registered parties is also rising . . . . . . . . . . . . . . . . . . . . . . . . . . . . . . . . . . . . . . . . . . . . . . . . . . . . . . . 28
4.1 The minor party vote increased most when wages growth was strong . . . . . . . . . . . . . . . . . . . . . . . . . . . . . . . . . . . . . . . . . . . 314.2 Australians were more optimistic in 2013 . . . . . . . . . . . . . . . . . . . . . . . . . . . . . . . . . . . . . . . . . . . . . . . . . . . . . . . . . . 324.3 Income inequality rose before the GFC but hasn’t changed much since . . . . . . . . . . . . . . . . . . . . . . . . . . . . . . . . . . . . . . . . . . 334.4 The minor party vote share is more closely aligned with unemployment . . . . . . . . . . . . . . . . . . . . . . . . . . . . . . . . . . . . . . . . . . 344.5 Minor party voters are more likely to be concerned about the state of the economy . . . . . . . . . . . . . . . . . . . . . . . . . . . . . . . . . . . 35
Grattan Institute 2018 5
A crisis of trust: The rise of protest politics in Australia
4.6 Minor party voters are less confident about their job prospects than voters for some major parties . . . . . . . . . . . . . . . . . . . . . . . . . . . 364.7 Minor party voters have similar views on redistribution as ALP voters . . . . . . . . . . . . . . . . . . . . . . . . . . . . . . . . . . . . . . . . . . . 374.8 Major cities grew faster than regional areas, except in mining states . . . . . . . . . . . . . . . . . . . . . . . . . . . . . . . . . . . . . . . . . . . . 414.9 Incomes are higher in Brisbane; growth in income was higher in regional Queensland . . . . . . . . . . . . . . . . . . . . . . . . . . . . . . . . . . 424.10 Cities and regions both have pockets of high unemployment . . . . . . . . . . . . . . . . . . . . . . . . . . . . . . . . . . . . . . . . . . . . . . . . 434.11 Wealth has also grown strongly in the regions . . . . . . . . . . . . . . . . . . . . . . . . . . . . . . . . . . . . . . . . . . . . . . . . . . . . . . . 434.12 Regional areas report higher well-being . . . . . . . . . . . . . . . . . . . . . . . . . . . . . . . . . . . . . . . . . . . . . . . . . . . . . . . . . . . 444.13 Economic sentiments in the cities and regions have moved together . . . . . . . . . . . . . . . . . . . . . . . . . . . . . . . . . . . . . . . . . . . 464.14 Costs of providing many government services are higher in the regions . . . . . . . . . . . . . . . . . . . . . . . . . . . . . . . . . . . . . . . . . . 47
5.1 Australian attitudes are becoming more liberal . . . . . . . . . . . . . . . . . . . . . . . . . . . . . . . . . . . . . . . . . . . . . . . . . . . . . . . 515.2 Minor party voters have similar views to major party voters on social liberalism questions . . . . . . . . . . . . . . . . . . . . . . . . . . . . . . . . 525.3 Support for same-sex marriage correlates with religious attitudes more than party support or distance to the city . . . . . . . . . . . . . . . . . . . 535.4 People in regional Australia have similar views to those in the cities on many social issues . . . . . . . . . . . . . . . . . . . . . . . . . . . . . . . 555.5 Most regional electorates voted for same-sex marriage . . . . . . . . . . . . . . . . . . . . . . . . . . . . . . . . . . . . . . . . . . . . . . . . . . . 555.6 One Nation voters are passionate about maintaining Australia’s culture and way of life . . . . . . . . . . . . . . . . . . . . . . . . . . . . . . . . . . 585.7 One Nation voters are particularly averse to migration . . . . . . . . . . . . . . . . . . . . . . . . . . . . . . . . . . . . . . . . . . . . . . . . . . . 605.8 Most immigrants settle in the cities . . . . . . . . . . . . . . . . . . . . . . . . . . . . . . . . . . . . . . . . . . . . . . . . . . . . . . . . . . . . . . 625.9 Asian migrants are very concentrated in the cities . . . . . . . . . . . . . . . . . . . . . . . . . . . . . . . . . . . . . . . . . . . . . . . . . . . . . 635.10 Regional Australians are more worried about the cultural impact of social and economic change . . . . . . . . . . . . . . . . . . . . . . . . . . . . 645.11 Negative attitudes towards immigration set the regions apart from the cities . . . . . . . . . . . . . . . . . . . . . . . . . . . . . . . . . . . . . . . 64
6.1 Cynicism about politics has risen strongly since 2007 . . . . . . . . . . . . . . . . . . . . . . . . . . . . . . . . . . . . . . . . . . . . . . . . . . . 696.2 Trust is falling in politicians, business and the press but not in other institutions . . . . . . . . . . . . . . . . . . . . . . . . . . . . . . . . . . . . . . 706.3 Voters more readily associate the major parties with negative attributes than positive ones . . . . . . . . . . . . . . . . . . . . . . . . . . . . . . . 716.4 Party allegiance is falling . . . . . . . . . . . . . . . . . . . . . . . . . . . . . . . . . . . . . . . . . . . . . . . . . . . . . . . . . . . . . . . . . . . 726.5 Dissatisfaction with democracy correlates with the minor party vote . . . . . . . . . . . . . . . . . . . . . . . . . . . . . . . . . . . . . . . . . . . . 736.6 Minor party voters are particularly disillusioned . . . . . . . . . . . . . . . . . . . . . . . . . . . . . . . . . . . . . . . . . . . . . . . . . . . . . . . 746.7 Low trust distinguishes minor party voters more than their left-right attitudes . . . . . . . . . . . . . . . . . . . . . . . . . . . . . . . . . . . . . . . 746.8 Trust is falling across the board, not just in the regions . . . . . . . . . . . . . . . . . . . . . . . . . . . . . . . . . . . . . . . . . . . . . . . . . . . 76
7.1 High minor party votes have historically coincided with major realignment in political parties . . . . . . . . . . . . . . . . . . . . . . . . . . . . . . . 84
Grattan Institute 2018 6
A crisis of trust: The rise of protest politics in Australia
1 Introduction
This report examines the rising support for minor parties in Australia,and the parallels to the rise of ‘outsider’ parties in other developednations. It also investigates geographic shifts in voting in Australia: theshare of votes for minor parties is higher and is rising faster in regionsfurther from the big cities.
The goal is not just to document but to explain the rise of outsiderparties. Many explanations have been advanced as to why the voteshare of minor parties is growing and why major parties are particularlyon the nose in regional areas. But no Australian study has yet used thefull range of economic, attitudinal and voting data to understand thephenomenon. Without an empirically grounded sense of ‘what’s goingon’, it is difficult to work out the best policy response, if indeed any isrequired.
Our analysis focuses on recent political history: we analyse changes inSenate voting behaviour in the 12 years (5 elections) from 2004. Thisperiod was characterised by a very large increase in the minor partyvote. However, it should be seen within the context of a longer-termtrend of increased voting for minor parties since the Second World War(Box 1 on the following page).
There are also similarities with voting patterns in other developednations (Chapter 2). This suggests that rising disillusionment with themajor parties reflects forces beyond the policies and personalitiesof individual election contests, and the varying economic fortunes ofindividual countries.
This chapter briefly explains the framework we use for trying tounderstand the rise of minor parties in Australia.
1.1 Why should policy makers care about the rising minor party
vote?
The growing minor party vote is democracy at work. Changes in votingpatterns are clearly of interest to political scientists and politicians, butwhy should policy makers care if Australians increasingly choose tosupport minor parties at the ballot box?
The most commonly cited reason is it can make legislating policychange more complex. It is rare for parties that form governmentto control the Senate. Indeed, for most of the period since 1955,governments have had to gain the support of one or more independentor minor party senators to pass measures through the Senate.1 Inthe House of Representatives that is much rarer: prior to the hungparliament in 2010, the previous minority government was in 1940.2
But minor parties holding the balance of power is not necessarilybad for policy making. Minor parties can improve or hinder the policymaking process, depending on the circumstances and the approach ofthe parties involved.3 At the very least, minor parties can give a voiceto issues that are important to the public but have been overlooked ormarginalised by major parties (Box 4 on page 27).
And despite constant media handwringing about ‘chaotic hung parlia-ments’ and the ‘dysfunctional Senate’, Australians are voting with openeyes: the previous record-high vote for minor parties in 2013 came after
1. Sharman (1999).2. Horne (2010).3. Prosser and Denniss (2015, Chapter 5) present a framework for understanding
influence of ‘marginal members’. This spans the policy contributions of ‘con-struction’, ‘improvement’, ‘extension’, ‘diversion’, ‘destabilisation’, ‘aversion’ and‘destruction’, which they illustrate with case studies of behaviour of independentsand minor parties in major policy debates.
Grattan Institute 2018 7
A crisis of trust: The rise of protest politics in Australia
Box 1: A short history of the rising minor party vote
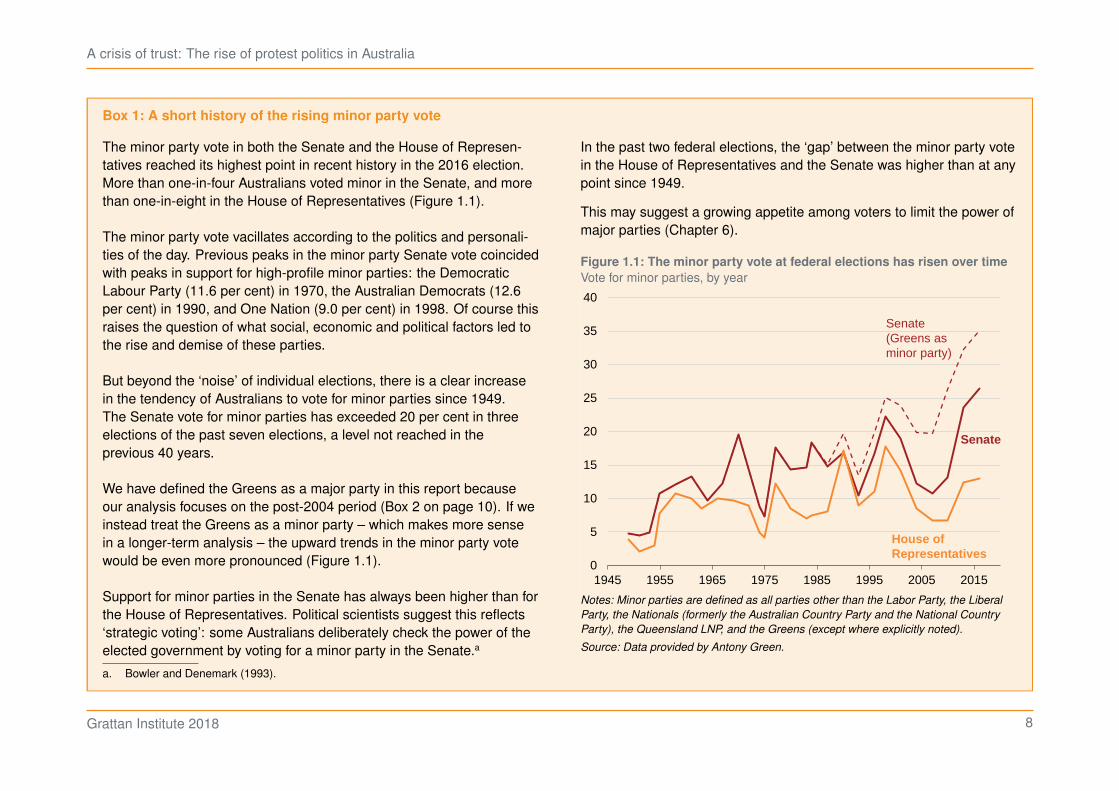
The minor party vote in both the Senate and the House of Represen-tatives reached its highest point in recent history in the 2016 election.More than one-in-four Australians voted minor in the Senate, and morethan one-in-eight in the House of Representatives (Figure 1.1).
The minor party vote vacillates according to the politics and personali-ties of the day. Previous peaks in the minor party Senate vote coincidedwith peaks in support for high-profile minor parties: the DemocraticLabour Party (11.6 per cent) in 1970, the Australian Democrats (12.6per cent) in 1990, and One Nation (9.0 per cent) in 1998. Of course thisraises the question of what social, economic and political factors led tothe rise and demise of these parties.
But beyond the ‘noise’ of individual elections, there is a clear increasein the tendency of Australians to vote for minor parties since 1949.The Senate vote for minor parties has exceeded 20 per cent in threeelections of the past seven elections, a level not reached in theprevious 40 years.
We have defined the Greens as a major party in this report becauseour analysis focuses on the post-2004 period (Box 2 on page 10). If weinstead treat the Greens as a minor party – which makes more sensein a longer-term analysis – the upward trends in the minor party votewould be even more pronounced (Figure 1.1).
Support for minor parties in the Senate has always been higher than forthe House of Representatives. Political scientists suggest this reflects‘strategic voting’: some Australians deliberately check the power of theelected government by voting for a minor party in the Senate.a
In the past two federal elections, the ‘gap’ between the minor party votein the House of Representatives and the Senate was higher than at anypoint since 1949.
This may suggest a growing appetite among voters to limit the power ofmajor parties (Chapter 6).
Figure 1.1: The minor party vote at federal elections has risen over time
Vote for minor parties, by year
0
5
10
15
20
25
30
35
40
1945 1955 1965 1975 1985 1995 2005 2015
Senate
House of Representatives
Senate (Greens as minor party)
Notes: Minor parties are defined as all parties other than the Labor Party, the Liberal
Party, the Nationals (formerly the Australian Country Party and the National Country
Party), the Queensland LNP, and the Greens (except where explicitly noted).
Source: Data provided by Antony Green.
a. Bowler and Denemark (1993).
Grattan Institute 2018 8
A crisis of trust: The rise of protest politics in Australia
the 2010 hung parliament in which the Gillard government controlledneither the House of Representatives nor the Senate. A 2014 poll forthe Australian Institute found 48 per cent of voters considered that thegovernment not holding a majority in the Senate was ‘a good thing’, 30per cent were neutral, and only 22 per cent thought it a ‘bad thing’.4
Another possible downside of the rising minor party vote is that it maybe less clear to Australians precisely what they are voting for. Policystatements from minor parties tend to be very brief or focused on asmall number of issues that are of special interest to the party. Forexample, most minor parties had almost nothing to say on educationpolicy leading up to the 2016 election, but were instrumental insupporting the government’s education funding changes in 2017. Morevotes going to minor parties may mean less policy being formed with aclear voter mandate.
Another risk is that poor policies are introduced by the major partiesin the name of appeasing disillusioned voters. Of course, politicallyexpedient policy making is nothing new. But it is a bigger worry ifit is based on a misdiagnosis of voter concerns. Without a betterunderstanding of what is driving voters away, the major parties riskmaking increasingly expensive policy offers to an underwhelmedelectorate. We risk both bad policy and bad politics.
1.2 The framework used in this report
There are two threshold issues in seeking to understand the growingminor party vote.
First, is it a vote for the minor parties or a vote against the majorparties? In other words, do minor party policies/ideologies better reflectthe preferences of their voters? Or are their voters simply seeking to
4. Australia Institute poll of 1400 Australians cited in Prosser and Denniss (2015,Table 5.1).
express their displeasure at the political establishment? Of course,voting choices are complex and may be informed by a combinationof social context, party loyalty and assessments of self interest.5
Ultimately we assume that voters casting a ‘vote for’ a minor party doso because that party offers one or more policies that better match theirpreferences than those of the alternative parties.
A ‘vote for’ minor parties and a ‘vote against’ major parties may notbe mutually exclusive: a voter might choose to protest by supporting aminor party, but choose which minor party based on policy or ideology.However, this report is primarily interested in the threshold question ofwhat drives a person to choose to vote for a minor party.
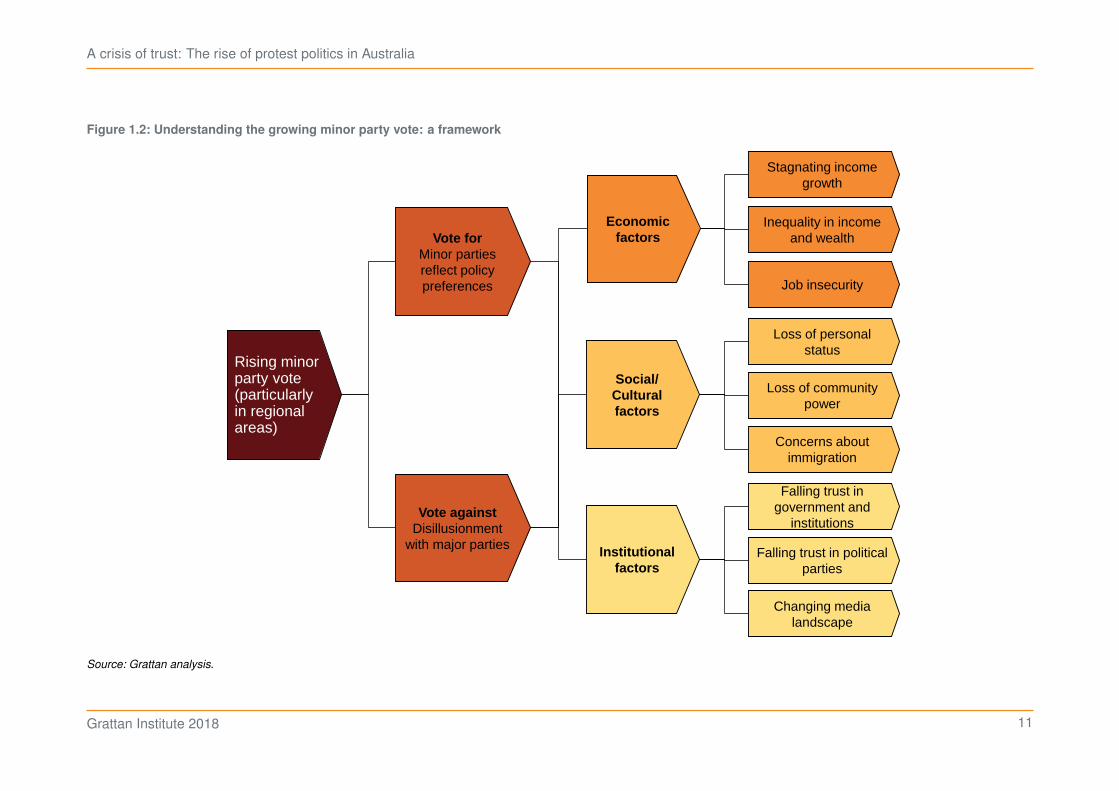
Second, what are the root causes of the rise? What are the economic,social/cultural, and institutional factors that explain growing disillusion-ment and fragmentation? Figure 1.2 on page 11 summarises thesethreshold questions along with some of the causes that are commonlydiscussed when seeking to explain the rise.
In assessing which of these factors might count as a good explanationfor the rise in minor party vote we use several criteria:
5. Political science offers many theories of voter behaviour which might describe thetrigger to vote for a minor party as either ‘push’ factors (vote against majors) or‘pull’ factors (vote for minors).
Michigan theory emphasises the role of party identification: party structuresprovide a political ideology, values and rituals that engender loyalty amongstvoters. Campbell Angus and E.Donald (1980). On this theory, as trust in partiesfalls and party allegiance weakens, voters are pushed to vote for minor parties, asdiscussed in Chapter 6.
Sociological theory emphasises the importance of the social context of theindividual: social status, political persuasion of friends and family. Berelson et al.(1954). The role of culture and group identification in pulling people to vote forminor parties is discussed in Chapter 5.
Rational voter theory posits that voters are motivated by their personalinterest: they compare the expected return for voting for the incumbent with theexpected return for voting for the opposition. Downs (1957). The role of economicfactors in pulling people to vote for minor parties is discussed in Chapter 4.
Grattan Institute 2018 9
A crisis of trust: The rise of protest politics in Australia
• Does the explanation correlate with the rise in the minor party vote(over time and across geography)?
• Does it align with the views of the voters who are choosing to votefor the minor parties?
• Is it a concern reflected in the policy platforms or the voting historyof the minor parties?
In other words, a good explanation for the general rise in the minorparty vote would align shifts in public attitudes with the big jump in theminor party vote in 2013, would be a prominent issue in many minorparty platforms, and would be a more significant issue for minor partyvoters than for others.
Similarly, a good explanation for the widening regional-city divide in thevote for minor parties would correlate with the steady increase in theminor party vote in the regions from 2010, would be a prominent issuein minor party platforms, particularly those with a strongly regionalvote, and would be a more significant issue for regional voters than forothers.
As the remainder of this report will show, some of the commonlyadvanced theories for the rising minor party vote fail to meet any ofthese criteria.
1.3 The language of politics and political scientists
In any survey of the electoral landscape it is impossible to avoid someof the lingo of the political scientists.
Many of the terms, such as ‘elites’, ‘cosmopolitanism’ and ‘populism’,are hard to define and are used differently by different commentators.For the uninitiated, we have set out some brief explainers in Box 3 onpage 13. Where these terms are used in the report, we have tried to beconsistent with these definitions.
Box 2: The Greens: major or minor party?
In Australia, the Liberals, Nationals and Labor are almost alwaysdefined as major parties. The Greens are more debatable butgiven the focus of this report – understanding the rise in the minorparty vote since 2004 – it is more illuminating to group the Greenswith the major parties.
Since the 2004 election the Greens have maintained a strongnational presence: they have received at least 7 per cent of theSenate vote across Australia and held at least four Senate seats.And while traditionally a protest party, the Greens do not seem tobe tapping into the broader discontent which we document in thisreport. Indeed, their first-preference Senate vote was only slightlyhigher in the 2016 election than in 2004 (Figure 1.1).
Further, the economic, cultural and trust issues that we identifyas activating voters for the other minor parties do not appeal somuch to Greens voters who are typically motivated by a differentset of concerns. Drilling down into these is beyond the scope ofthis report.
Nonetheless, when defining the Greens as a minor party wouldmake a substantive difference to the analysis (for example, thegeographic analysis of the minor party vote) we note this in thetext.
Grattan Institute 2018 10
A crisis of trust: The rise of protest politics in Australia
Figure 1.2: Understanding the growing minor party vote: a framework
Rising minor party vote (particularly in regional areas)
Stagnating income growth
Changing media landscape
Loss of community power
Concerns about immigration
Loss of personal status
Falling trust in political parties
Institutional factors
Economic factors
Social/ Cultural factors
Falling trust in government and
institutions
Inequality in income and wealthVote for
Minor parties reflect policy preferences
Vote against Disillusionment
with major parties
Job insecurity
Source: Grattan analysis.
Grattan Institute 2018 11
A crisis of trust: The rise of protest politics in Australia
1.4 The data used in this report
To examine the rise in the minor party vote we use a range of surveyand polling data, as well as economic and demographic data andmaterial from focus groups, and our own regional consultations.
In order to understand the attitudes of minor party voters and how theymight be different from voters for the major parties we draw particularlystrongly on data from the Australian Election Study (AES) and theScanlon Foundation Social Cohesion Surveys. We also use data fromEssential Research, the Political Persona Project, the ABC’s VoteCompass, and the ABS Australian Marriage Law Postal Survey. For adescription of the sampling and methods used by these studies, seeAppendix A.
Sample size issues limit the extent to which we can identify attitudesof voters for particular minor parties and comparisons between them.Because of these issues we place more more weight on findings thatappear to be consistent between the surveys listed above.
1.5 The structure of this report
The rest of this report is structured as follows:
Chapter 2 establishes the trend of a growing minor party vote inAustralia and overseas, and highlights that the minor party vote ishigher and is rising faster in regions further from big cities.
Chapter 3 explores whether the growing minor party vote reflectspolicy preferences or disillusionment with the major parties.
Chapter 4 examines whether economic factors such as slow incomegrowth or rising inequality are likely to explain the increase in the minorparty vote.
Chapter 5 considers the role of societal change and social attitudes inshaping voting behaviour.
Chapter 6 looks at voter views on Australia’s system of governmentand institutions, and how these align with the rise in the minor partyvote.
Chapter 7 discusses the implications for policy makers.
Grattan Institute 2018 12
A crisis of trust: The rise of protest politics in Australia
Box 3: Political science terminology: an explainer
Cosmopolitanism – Cosmopolitans see themselves as ‘citizens of theworld’.a They believe in universal human values and value diversity.b
Cosmopolitanism embraces responsibility to all humans, not merely tothose in the same social groups.c
Elites – Elites are small groups of people viewed as wielding dispro-portionate amounts of power. Like beauty, elitism is in the eye of thebeholder. Those on the right often label people in the media/culturalindustries ‘elite’, whereas those on the left focus on business and thosewith extreme wealth – the so-called ‘1 per cent’.
Minor parties – Minor parties are parties that attract a relatively smallshare of the vote. There is no hard-and-fast rule as to the vote-share ornumber of seats before a minor party crosses the line into major partystatus. In Australia, the Liberals, Nationals and Labor are almost alwaysdefined as major parties. This report defines the Greens as a majorparty unless explicitly noted (Box 2 on page 10). All other parties andindependents are defined as minor parties.
Nationalism – Nationalism is a commitment to one’s nation and to itspeople, culture, and values. Nationalists see patriotism as a virtue,d
and believe in promoting the interests of fellow citizens ahead ofthe interests of foreigners. Nationalists tend to favour protectionisteconomic policies and strictly controlled immigration.e
Political correctness – Political correctness (PC) refers to the useof deliberately ‘soft’ or euphemistic language to avoid giving offence.Those who criticise political correctness also tend to define it aspolitical ‘spin’, aversion to offence, or a departure from frank and honestdialogue.f Populist figures often position themselves as anti-PC, fightingagainst a growing wave of victimhood and offence-taking.g
Populism – Populists claim to speak for ‘the people’ or the silentmajority.h Populists reject the political establishment/elites: they wantto ‘drain the swamp’. Populist parties can sit on the left or right of themainstream. Individuals within the mainstream parties sometimesadopt the populist communication style: simple solutions to complexproblems, direct language, an appeal to common sense, and identifica-tion of ‘enemies’.i
Social liberalism – Social liberalism is a political philosophy thatembraces the market economy and individual liberty, but supports arole for government (including redistributive taxation) in addressingeconomic and social issues. In this report, we focus on social liberalismin the context of demands for expansion of civil and political rights – forexample, same-sex marriage.
a. Kleingeld (2013).b. Beck (2007).c. Cabrera (2010).d. Lind (1994).e. Haidt (2016a).f. Krugman (2012).g. Fingerhut (2016); and Latham (2002).h. Akkerman et al. (2013).i. Crosby (2017).
Grattan Institute 2018 13
A crisis of trust: The rise of protest politics in Australia
2 The growing minor party vote
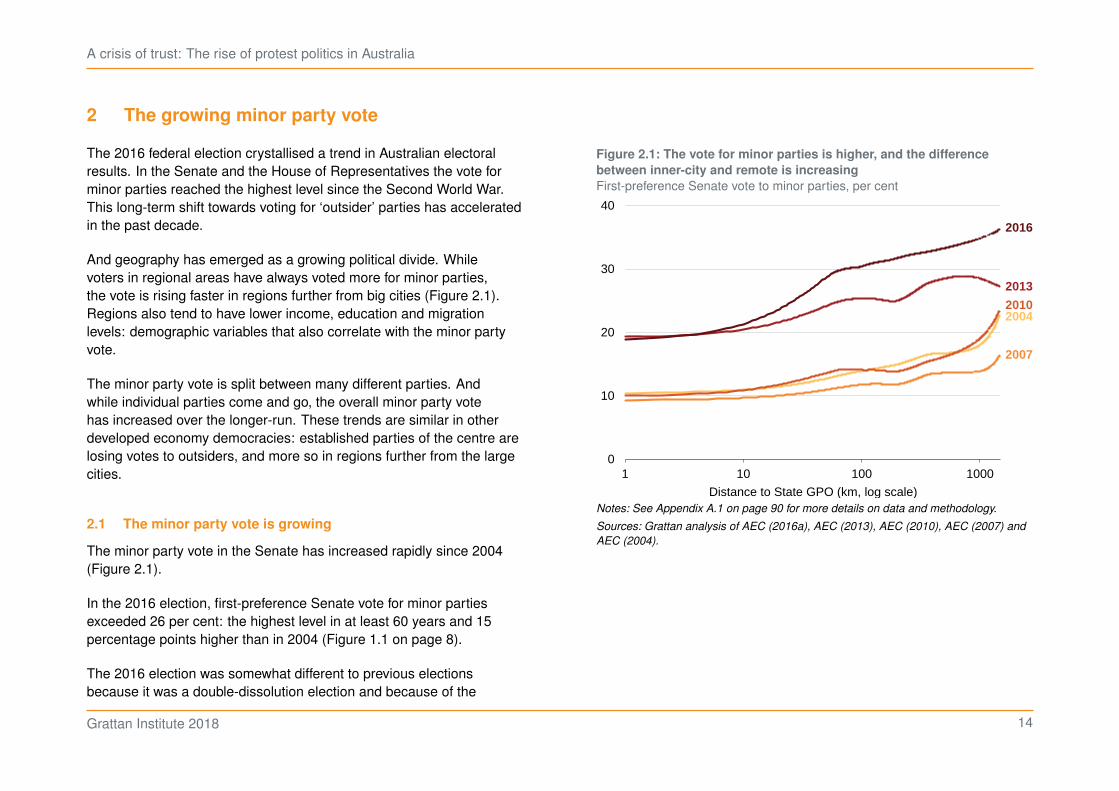
The 2016 federal election crystallised a trend in Australian electoralresults. In the Senate and the House of Representatives the vote forminor parties reached the highest level since the Second World War.This long-term shift towards voting for ‘outsider’ parties has acceleratedin the past decade.
And geography has emerged as a growing political divide. Whilevoters in regional areas have always voted more for minor parties,the vote is rising faster in regions further from big cities (Figure 2.1).Regions also tend to have lower income, education and migrationlevels: demographic variables that also correlate with the minor partyvote.
The minor party vote is split between many different parties. Andwhile individual parties come and go, the overall minor party votehas increased over the longer-run. These trends are similar in otherdeveloped economy democracies: established parties of the centre arelosing votes to outsiders, and more so in regions further from the largecities.
2.1 The minor party vote is growing
The minor party vote in the Senate has increased rapidly since 2004(Figure 2.1).
In the 2016 election, first-preference Senate vote for minor partiesexceeded 26 per cent: the highest level in at least 60 years and 15percentage points higher than in 2004 (Figure 1.1 on page 8).
The 2016 election was somewhat different to previous electionsbecause it was a double-dissolution election and because of the
Figure 2.1: The vote for minor parties is higher, and the difference
between inner-city and remote is increasing
First-preference Senate vote to minor parties, per cent
0
10
20
30
40
1 10 100 1000
Distance to State GPO (km, log scale)
2016
2004
2007
2010
2013
Notes: See Appendix A.1 on page 90 for more details on data and methodology.
Sources: Grattan analysis of AEC (2016a), AEC (2013), AEC (2010), AEC (2007) and
AEC (2004).
Grattan Institute 2018 14
A crisis of trust: The rise of protest politics in Australia
introduction of partial preferential voting for the Senate. But thesechanges are unlikely to have materially changed first-preference votes.6
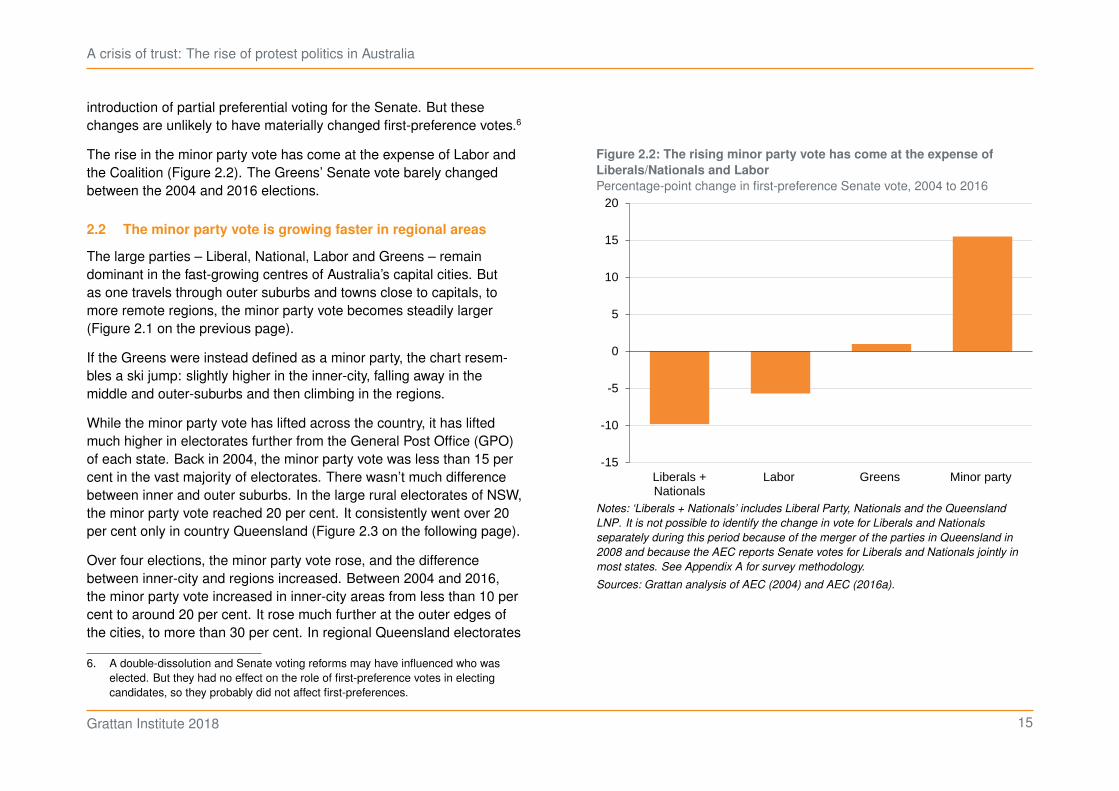
The rise in the minor party vote has come at the expense of Labor andthe Coalition (Figure 2.2). The Greens’ Senate vote barely changedbetween the 2004 and 2016 elections.
2.2 The minor party vote is growing faster in regional areas
The large parties – Liberal, National, Labor and Greens – remaindominant in the fast-growing centres of Australia’s capital cities. Butas one travels through outer suburbs and towns close to capitals, tomore remote regions, the minor party vote becomes steadily larger(Figure 2.1 on the previous page).
If the Greens were instead defined as a minor party, the chart resem-bles a ski jump: slightly higher in the inner-city, falling away in themiddle and outer-suburbs and then climbing in the regions.
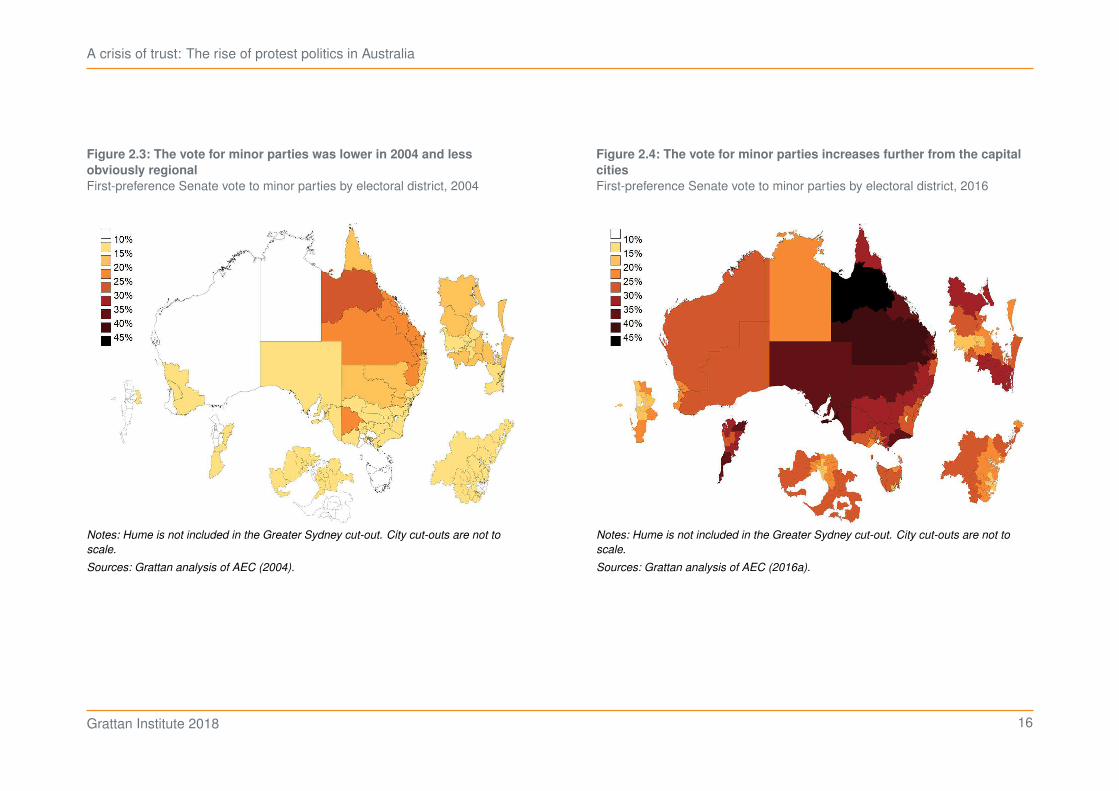
While the minor party vote has lifted across the country, it has liftedmuch higher in electorates further from the General Post Office (GPO)of each state. Back in 2004, the minor party vote was less than 15 percent in the vast majority of electorates. There wasn’t much differencebetween inner and outer suburbs. In the large rural electorates of NSW,the minor party vote reached 20 per cent. It consistently went over 20per cent only in country Queensland (Figure 2.3 on the following page).
Over four elections, the minor party vote rose, and the differencebetween inner-city and regions increased. Between 2004 and 2016,the minor party vote increased in inner-city areas from less than 10 percent to around 20 per cent. It rose much further at the outer edges ofthe cities, to more than 30 per cent. In regional Queensland electorates
6. A double-dissolution and Senate voting reforms may have influenced who waselected. But they had no effect on the role of first-preference votes in electingcandidates, so they probably did not affect first-preferences.
Figure 2.2: The rising minor party vote has come at the expense of
Liberals/Nationals and Labor
Percentage-point change in first-preference Senate vote, 2004 to 2016
-15
-10
-5
0
5
10
15
20
Liberals +Nationals
Labor Greens Minor party
Notes: ‘Liberals + Nationals’ includes Liberal Party, Nationals and the Queensland
LNP. It is not possible to identify the change in vote for Liberals and Nationals
separately during this period because of the merger of the parties in Queensland in
2008 and because the AEC reports Senate votes for Liberals and Nationals jointly in
most states. See Appendix A for survey methodology.
Sources: Grattan analysis of AEC (2004) and AEC (2016a).
Grattan Institute 2018 15
A crisis of trust: The rise of protest politics in Australia
Figure 2.3: The vote for minor parties was lower in 2004 and less
obviously regional
First-preference Senate vote to minor parties by electoral district, 2004
Notes: Hume is not included in the Greater Sydney cut-out. City cut-outs are not to
scale.
Sources: Grattan analysis of AEC (2004).
Figure 2.4: The vote for minor parties increases further from the capital
cities
First-preference Senate vote to minor parties by electoral district, 2016
Notes: Hume is not included in the Greater Sydney cut-out. City cut-outs are not to
scale.
Sources: Grattan analysis of AEC (2016a).
Grattan Institute 2018 16
A crisis of trust: The rise of protest politics in Australia
it was often over 35 per cent, and in Kennedy (centred on Carpentariaand Mount Isa) it was over 45 per cent (Figure 2.4 on the previouspage).
Overall, around 15 per cent of the increase in the vote for minor partiescan be explained by the regional preference shift and around 55 percent by the trend for more people to vote for minor parties (regardlessof location).7
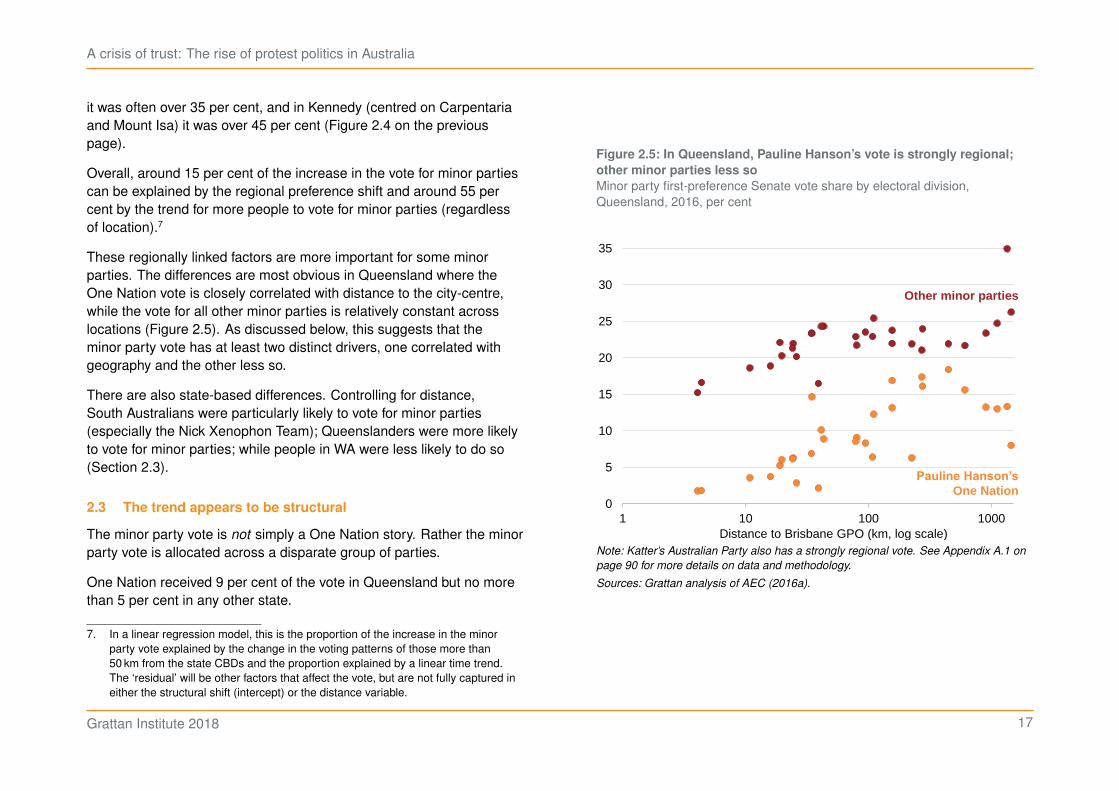
These regionally linked factors are more important for some minorparties. The differences are most obvious in Queensland where theOne Nation vote is closely correlated with distance to the city-centre,while the vote for all other minor parties is relatively constant acrosslocations (Figure 2.5). As discussed below, this suggests that theminor party vote has at least two distinct drivers, one correlated withgeography and the other less so.
There are also state-based differences. Controlling for distance,South Australians were particularly likely to vote for minor parties(especially the Nick Xenophon Team); Queenslanders were more likelyto vote for minor parties; while people in WA were less likely to do so(Section 2.3).
2.3 The trend appears to be structural
The minor party vote is not simply a One Nation story. Rather the minorparty vote is allocated across a disparate group of parties.
One Nation received 9 per cent of the vote in Queensland but no morethan 5 per cent in any other state.
7. In a linear regression model, this is the proportion of the increase in the minorparty vote explained by the change in the voting patterns of those more than50 km from the state CBDs and the proportion explained by a linear time trend.The ‘residual’ will be other factors that affect the vote, but are not fully captured ineither the structural shift (intercept) or the distance variable.
Figure 2.5: In Queensland, Pauline Hanson’s vote is strongly regional;
other minor parties less so
Minor party first-preference Senate vote share by electoral division,Queensland, 2016, per cent
0
5
10
15
20
25
30
35
1 10 100 1000Distance to Brisbane GPO (km, log scale)
Pauline Hanson’s One Nation
Other minor parties
Note: Katter’s Australian Party also has a strongly regional vote. See Appendix A.1 on
page 90 for more details on data and methodology.
Sources: Grattan analysis of AEC (2016a).
Grattan Institute 2018 17
A crisis of trust: The rise of protest politics in Australia
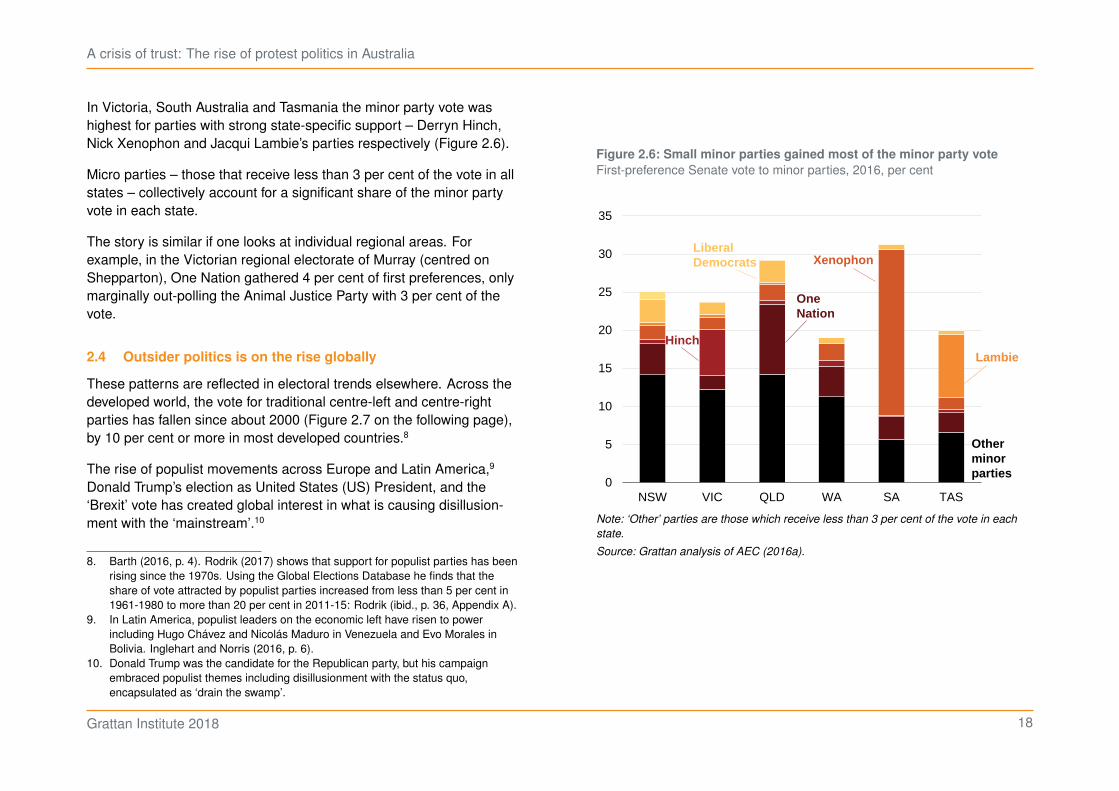
In Victoria, South Australia and Tasmania the minor party vote washighest for parties with strong state-specific support – Derryn Hinch,Nick Xenophon and Jacqui Lambie’s parties respectively (Figure 2.6).
Micro parties – those that receive less than 3 per cent of the vote in allstates – collectively account for a significant share of the minor partyvote in each state.
The story is similar if one looks at individual regional areas. Forexample, in the Victorian regional electorate of Murray (centred onShepparton), One Nation gathered 4 per cent of first preferences, onlymarginally out-polling the Animal Justice Party with 3 per cent of thevote.
2.4 Outsider politics is on the rise globally
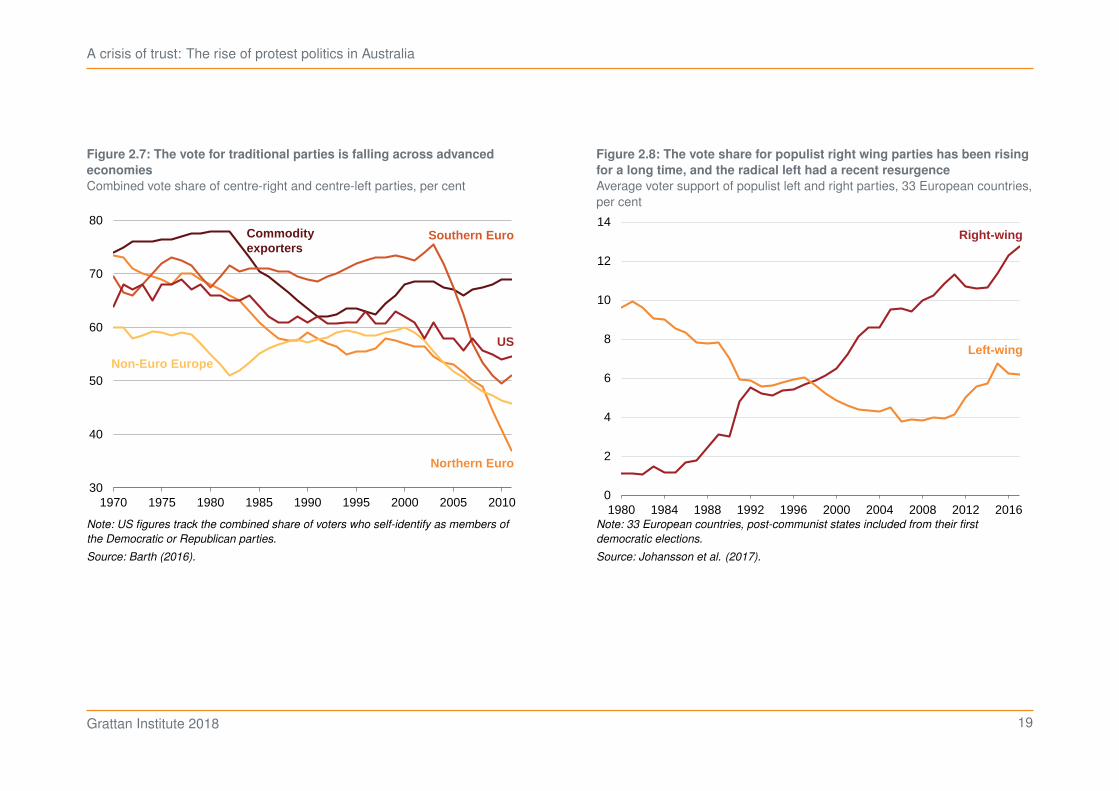
These patterns are reflected in electoral trends elsewhere. Across thedeveloped world, the vote for traditional centre-left and centre-rightparties has fallen since about 2000 (Figure 2.7 on the following page),by 10 per cent or more in most developed countries.8
The rise of populist movements across Europe and Latin America,9
Donald Trump’s election as United States (US) President, and the‘Brexit’ vote has created global interest in what is causing disillusion-ment with the ‘mainstream’.10
8. Barth (2016, p. 4). Rodrik (2017) shows that support for populist parties has beenrising since the 1970s. Using the Global Elections Database he finds that theshare of vote attracted by populist parties increased from less than 5 per cent in1961-1980 to more than 20 per cent in 2011-15: Rodrik (ibid., p. 36, Appendix A).
9. In Latin America, populist leaders on the economic left have risen to powerincluding Hugo Chávez and Nicolás Maduro in Venezuela and Evo Morales inBolivia. Inglehart and Norris (2016, p. 6).
10. Donald Trump was the candidate for the Republican party, but his campaignembraced populist themes including disillusionment with the status quo,encapsulated as ‘drain the swamp’.
Figure 2.6: Small minor parties gained most of the minor party vote
First-preference Senate vote to minor parties, 2016, per cent
0
5
10
15
20
25
30
35
NSW VIC QLD WA SA TAS
Other minorparties
Hinch
One Nation
XenophonLiberal Democrats
Lambie
Note: ‘Other’ parties are those which receive less than 3 per cent of the vote in each
state.
Source: Grattan analysis of AEC (2016a).
Grattan Institute 2018 18
A crisis of trust: The rise of protest politics in Australia
Figure 2.7: The vote for traditional parties is falling across advanced
economies
Combined vote share of centre-right and centre-left parties, per cent
30
40
50
60
70
80
1970 1975 1980 1985 1990 1995 2000 2005 2010
Southern Euro
US
Northern Euro
Non-Euro Europe
Commodity exporters
Note: US figures track the combined share of voters who self-identify as members of
the Democratic or Republican parties.
Source: Barth (2016).
Figure 2.8: The vote share for populist right wing parties has been rising
for a long time, and the radical left had a recent resurgence
Average voter support of populist left and right parties, 33 European countries,per cent
0
2
4
6
8
10
12
14
1980 1984 1988 1992 1996 2000 2004 2008 2012 2016
Right-wing
Left-wing
Note: 33 European countries, post-communist states included from their first
democratic elections.
Source: Johansson et al. (2017).
Grattan Institute 2018 19
A crisis of trust: The rise of protest politics in Australia
Anti-establishment parties are now a large political force in Europeanpolitics.11 These parties – defined by a common set of demands fromtheir voter base including a push for restrictions to immigration andgreater direct democracy – have increased their vote share fromabout 7 per cent in 2004 to around 19 per cent in 2017 in the EU-15countries.12 Their rise in support has come at the expense of bothcentre-left and centre-right parties (Figure 2.7 and Figure 2.8 on theprevious page).13
The resulting increase in seats held by anti-establishment parties hasenabled these parties to enter coalitions and help form governmentin a number of European countries.14 Populist parties can act as acatalyst for debate on issues that mainstream parties may otherwisehave avoided, such as Eurosceptism or anti-immigration policy.15
Populist support is growing most strongly in Western Europe.16 TheAlternative for Germany (AfD), which campaigned on a strongly anti-immigrant policy platform in the 2017 election, took 13 per cent of thenational vote and is now the third largest party in German politics.17
The election of centrist Emmanuel Macron as French President againstthe populist Marine Le Pen could appear to upset this trend. But both
11. Johansson et al. (2017).12. Johansson et al. (Ibid., p. 2). The estimates are produced by the Swedish free-
market think tank, TIMBRO. It combines results from general elections in the 15original European Union countries, and categorises them based on party ideology.Johansson et al. (Ibid.) find similar trends, but estimate support for populist partiesto be slightly lower, at 13.2 per cent.
13. Inglehart and Norris (2016, p. 2).14. Inglehart and Norris (2016); and Johansson et al. (2017).15. Mudde (2017a, pp. 13–14).16. With the exception of Hungary, Eastern European populist parties have garnered
lower support in recent years than they did in the 1990s, and they are less likelyto participate in national governments than in the past. Mudde (ibid., Table 19.1,19.2).
17. Chase (2017).
candidates ran for parties outside the political establishment. In thesubsequent National Assembly elections, Macron’s La République EnMarche! party – which didn’t exist 14 months before the poll – won 28per cent of first-round votes, more than any of the established parties.
Clearly, the political context in Europe is very different to Australia:European populism is underpinned by scepticism towards the EU,the lingering effects of the financial crisis and austerity policies, andthe Syrian refugee crisis. But there are lessons to be learned from theEuropean case – mainstream parties open themselves up for populistattack when they do not appear to offer a diversity of policy options, orwhen they fail to address the concerns of their electorate.18
On the other hand, Australia provides an interesting case studyfor the rest of the world on the origins of populist support. Politicalscientists have struggled to separate out the effects of cultural shiftsand poor economic outcomes (low wages and rising inequality) in manycountries because these shifts have occurred simultaneously. However,in Australia the relative health of the economy during the period ofrising minor party support (Chapter 4) shows that social changesand falling trust can be sufficient to support a rise in outsider parties’fortunes.
2.5 Regional areas are also more likely to reject the political
mainstream in other countries
Voting patterns in other countries are also increasingly cleaving alonggeographic lines.
Le Pen attracted around a third of the presidential vote in France, butshe won a majority in many regional areas.19
18. Mudde (2017b).19. The Economist (2017, pp. 9–10).
Grattan Institute 2018 20
A crisis of trust: The rise of protest politics in Australia
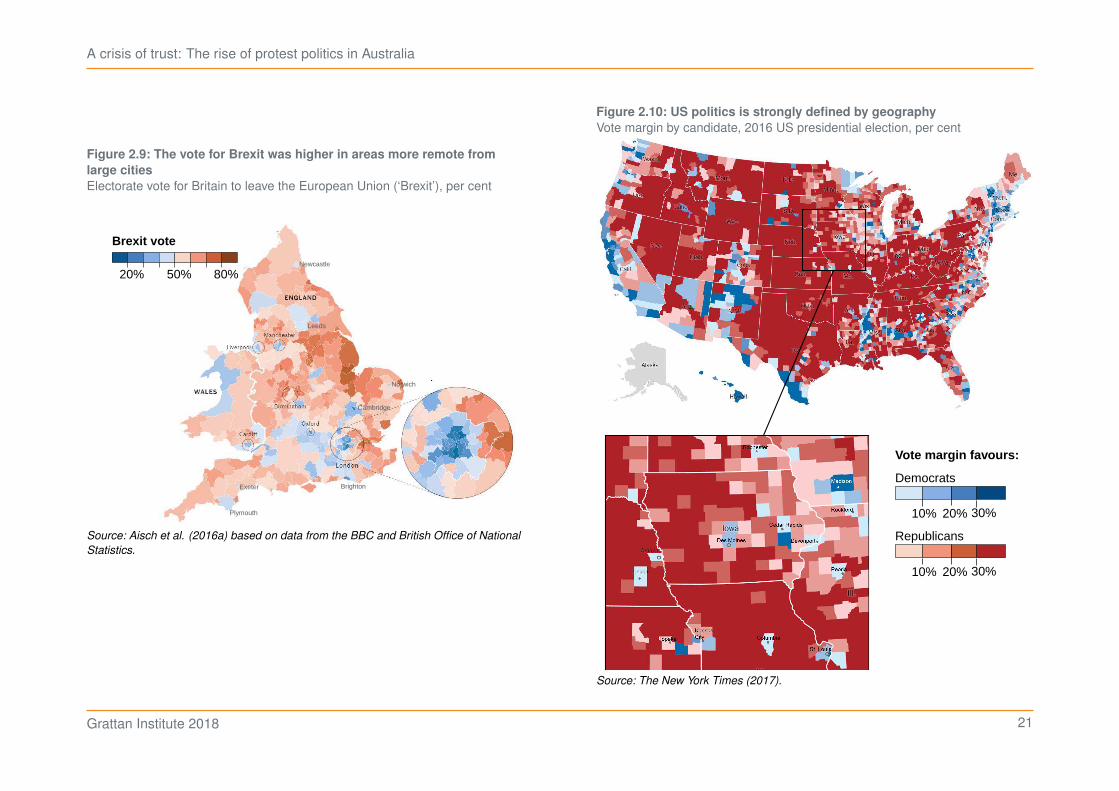
Figure 2.9: The vote for Brexit was higher in areas more remote from
large cities
Electorate vote for Britain to leave the European Union (‘Brexit’), per cent
80%20% 50%
Brexit vote
Leeds
Newcastle
Cambridge
Norwich
Plymouth
BrightonExeter
Source: Aisch et al. (2016a) based on data from the BBC and British Office of National
Statistics.
Figure 2.10: US politics is strongly defined by geography
Vote margin by candidate, 2016 US presidential election, per cent
30%10% 20%
30%10% 20%
Vote margin favours:
Democrats
Republicans
Source: The New York Times (2017).
Grattan Institute 2018 21
A crisis of trust: The rise of protest politics in Australia
The Brexit vote in 2015 also closely tracked higher population density.London voted to remain in the EU – and so did Bristol, Manchester,and almost every other large population centre in England and Wales(Figure 2.9). Regional areas are the power base of populist partiessuch as the United Kingdom Independence Party (UKIP).20
US politics has long been divided geographically, with the DemocraticParty stronger in the cities, and Republicans stronger elsewhere.21
Donald Trump’s presidential election in 2016 continued these trends,with cities swinging further to the Democrats, and smaller townsswinging further to the Republicans.22
These geographic divides are stark: Hillary Clinton dominated in themajor population centres such as Los Angles, New York, Chicago,Austin and Seattle, but also the smaller cities right across the country(Figure 2.10). In the Mid-West, for example, the major cities anduniversity towns appear as ‘lonely blue islands’23 in a sea of Republicanred (see inset in Figure 2.10).
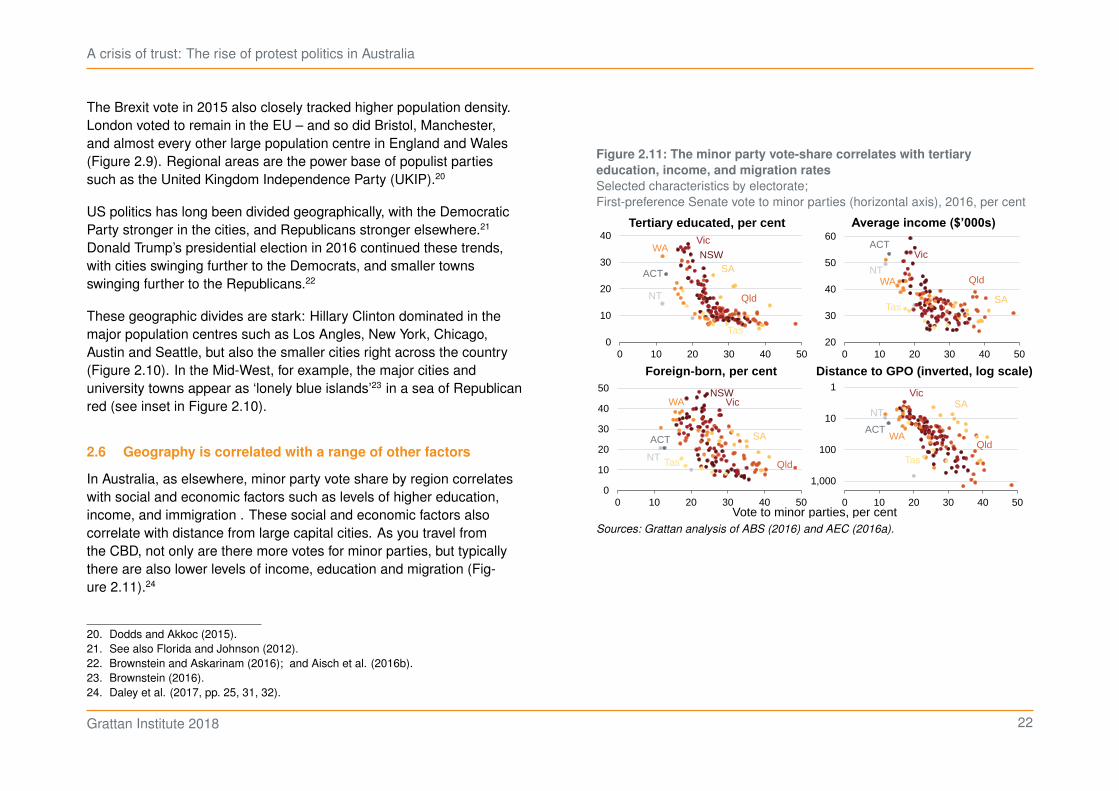
2.6 Geography is correlated with a range of other factors
In Australia, as elsewhere, minor party vote share by region correlateswith social and economic factors such as levels of higher education,income, and immigration . These social and economic factors alsocorrelate with distance from large capital cities. As you travel fromthe CBD, not only are there more votes for minor parties, but typicallythere are also lower levels of income, education and migration (Fig-ure 2.11).24
20. Dodds and Akkoc (2015).21. See also Florida and Johnson (2012).22. Brownstein and Askarinam (2016); and Aisch et al. (2016b).23. Brownstein (2016).24. Daley et al. (2017, pp. 25, 31, 32).
Figure 2.11: The minor party vote-share correlates with tertiary
education, income, and migration rates
Selected characteristics by electorate;First-preference Senate vote to minor parties (horizontal axis), 2016, per cent
0
10
20
30
40
50
0 10 20 30 40 50Vote to minor parties, per cent
1
10
100
1,000
0 10 20 30 40 50
0
10
20
30
40
0 10 20 30 40 50
Qld
SA
NT
ACT
Vic
Tas
WA
Qld
SANT
ACT
NSW
Vic
Tas
WA
Qld
SA
NT
ACT
NSWVic
Tas
WA
20
30
40
50
60
0 10 20 30 40 50
Qld
SA
NT
ACTVic
Tas
WA
Foreign-born, per cent
Tertiary educated, per cent
Distance to GPO (inverted, log scale)
Average income ($’000s)
Sources: Grattan analysis of ABS (2016) and AEC (2016a).
Grattan Institute 2018 22
A crisis of trust: The rise of protest politics in Australia
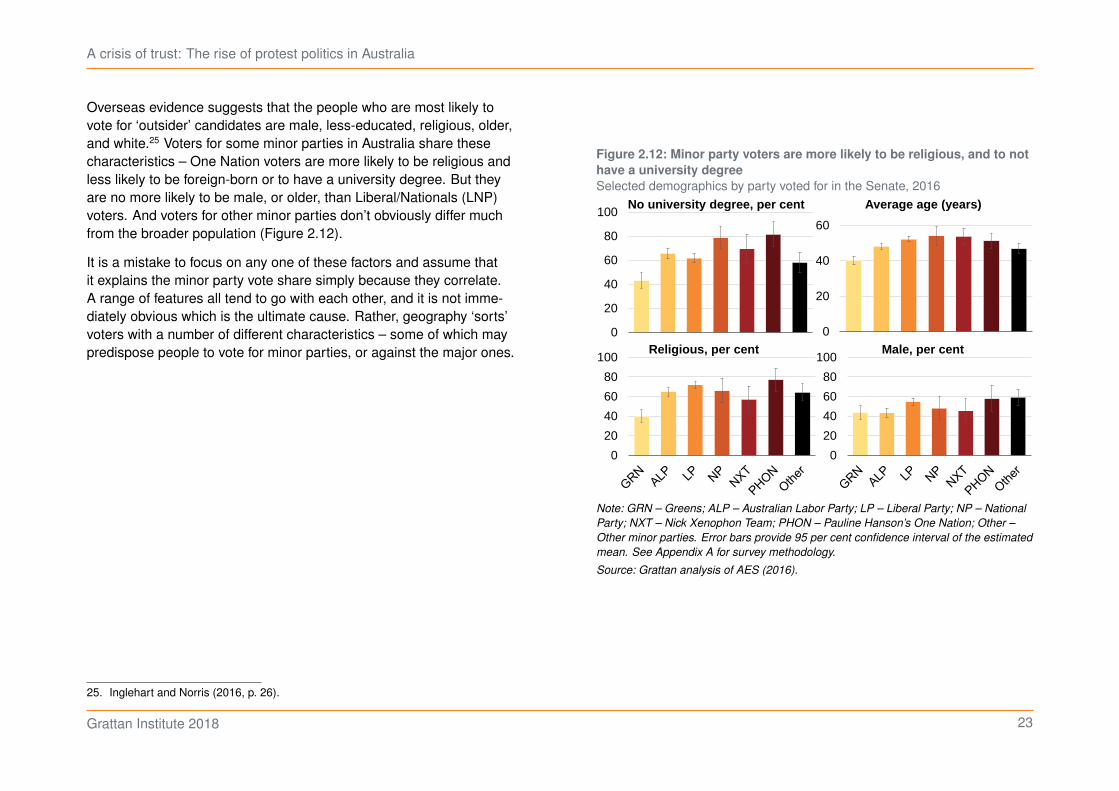
Overseas evidence suggests that the people who are most likely tovote for ‘outsider’ candidates are male, less-educated, religious, older,and white.25 Voters for some minor parties in Australia share thesecharacteristics – One Nation voters are more likely to be religious andless likely to be foreign-born or to have a university degree. But theyare no more likely to be male, or older, than Liberal/Nationals (LNP)voters. And voters for other minor parties don’t obviously differ muchfrom the broader population (Figure 2.12).
It is a mistake to focus on any one of these factors and assume thatit explains the minor party vote share simply because they correlate.A range of features all tend to go with each other, and it is not imme-diately obvious which is the ultimate cause. Rather, geography ‘sorts’voters with a number of different characteristics – some of which maypredispose people to vote for minor parties, or against the major ones.
25. Inglehart and Norris (2016, p. 26).
Figure 2.12: Minor party voters are more likely to be religious, and to not
have a university degree
Selected demographics by party voted for in the Senate, 2016
0
20
40
60
80
100
GRN ALP LP NP NXT HAN Other0
20
40
60
GRN ALP LP NP NXT HAN Other
0
20
40
60
80
100
0
20
40
60
80
100
Average age (years)No university degree, per cent
Religious, per cent Male, per cent
Note: GRN – Greens; ALP – Australian Labor Party; LP – Liberal Party; NP – National
Party; NXT – Nick Xenophon Team; PHON – Pauline Hanson’s One Nation; Other –
Other minor parties. Error bars provide 95 per cent confidence interval of the estimated
mean. See Appendix A for survey methodology.
Source: Grattan analysis of AES (2016).
Grattan Institute 2018 23
A crisis of trust: The rise of protest politics in Australia
3 Policy or protest?
What motivates voters decamping from the major parties? A vote fora minor party might reflect the attraction of its policy agenda (a ‘votefor’) or merely stem from disaffection with the major parties (a ‘voteagainst’).
This chapter examines the relative contributions of policy and protest asdrivers of the minor party Senate vote since 2004.
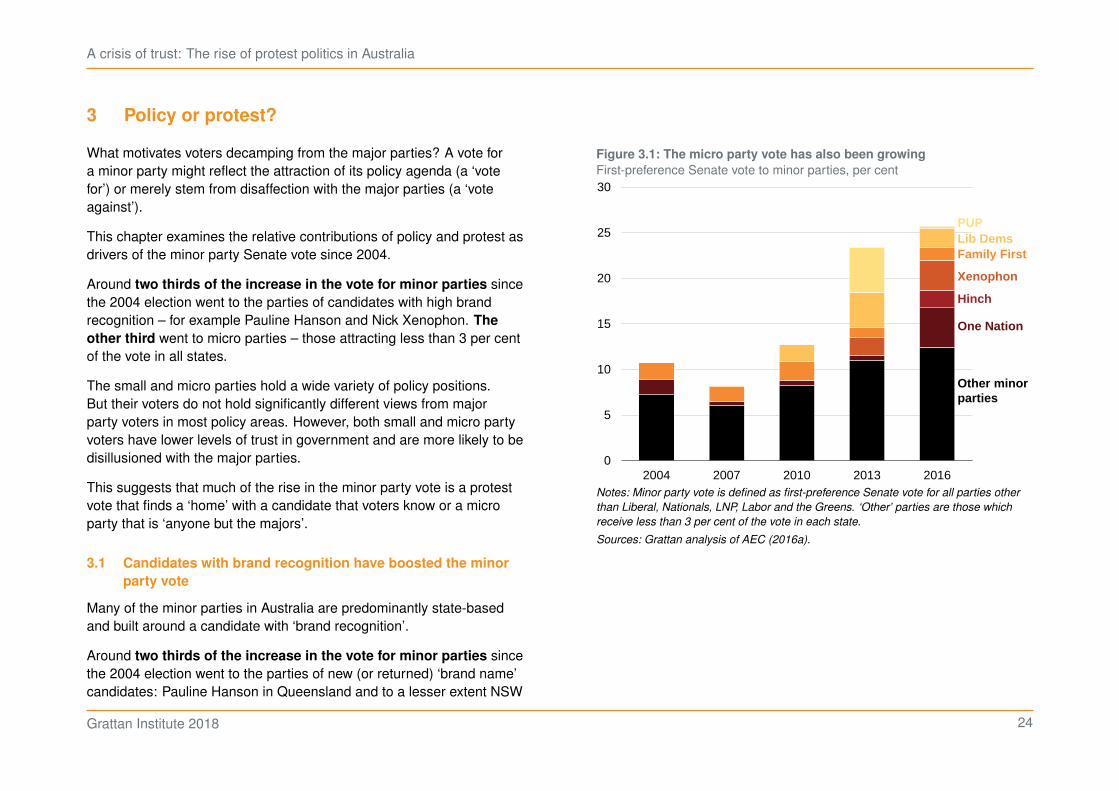
Around two thirds of the increase in the vote for minor parties sincethe 2004 election went to the parties of candidates with high brandrecognition – for example Pauline Hanson and Nick Xenophon. The
other third went to micro parties – those attracting less than 3 per centof the vote in all states.
The small and micro parties hold a wide variety of policy positions.But their voters do not hold significantly different views from majorparty voters in most policy areas. However, both small and micro partyvoters have lower levels of trust in government and are more likely to bedisillusioned with the major parties.
This suggests that much of the rise in the minor party vote is a protestvote that finds a ‘home’ with a candidate that voters know or a microparty that is ‘anyone but the majors’.
3.1 Candidates with brand recognition have boosted the minor
party vote
Many of the minor parties in Australia are predominantly state-basedand built around a candidate with ‘brand recognition’.
Around two thirds of the increase in the vote for minor parties sincethe 2004 election went to the parties of new (or returned) ‘brand name’candidates: Pauline Hanson in Queensland and to a lesser extent NSW
Figure 3.1: The micro party vote has also been growing
First-preference Senate vote to minor parties, per cent
0
5
10
15
20
25
30
2004 2007 2010 2013 2016
Other minorparties
Hinch
One Nation
Xenophon
Lib DemsFamily First
PUP
Notes: Minor party vote is defined as first-preference Senate vote for all parties other
than Liberal, Nationals, LNP, Labor and the Greens. ‘Other’ parties are those which
receive less than 3 per cent of the vote in each state.
Sources: Grattan analysis of AEC (2016a).
Grattan Institute 2018 24
A crisis of trust: The rise of protest politics in Australia
and WA, Nick Xenophon in South Australia, Derryn Hinch in Victoriaand Jacqui Lambie in Tasmania (Figure 3.1).
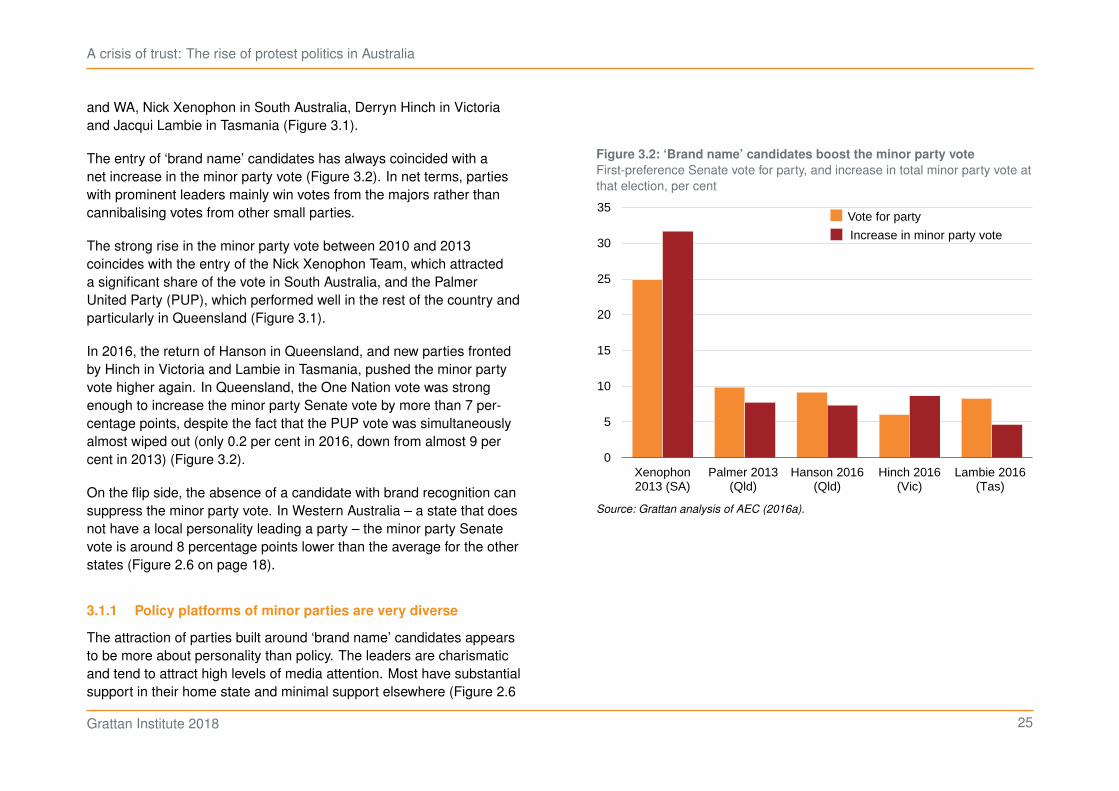
The entry of ‘brand name’ candidates has always coincided with anet increase in the minor party vote (Figure 3.2). In net terms, partieswith prominent leaders mainly win votes from the majors rather thancannibalising votes from other small parties.
The strong rise in the minor party vote between 2010 and 2013coincides with the entry of the Nick Xenophon Team, which attracteda significant share of the vote in South Australia, and the PalmerUnited Party (PUP), which performed well in the rest of the country andparticularly in Queensland (Figure 3.1).
In 2016, the return of Hanson in Queensland, and new parties frontedby Hinch in Victoria and Lambie in Tasmania, pushed the minor partyvote higher again. In Queensland, the One Nation vote was strongenough to increase the minor party Senate vote by more than 7 per-centage points, despite the fact that the PUP vote was simultaneouslyalmost wiped out (only 0.2 per cent in 2016, down from almost 9 percent in 2013) (Figure 3.2).
On the flip side, the absence of a candidate with brand recognition cansuppress the minor party vote. In Western Australia – a state that doesnot have a local personality leading a party – the minor party Senatevote is around 8 percentage points lower than the average for the otherstates (Figure 2.6 on page 18).
3.1.1 Policy platforms of minor parties are very diverse
The attraction of parties built around ‘brand name’ candidates appearsto be more about personality than policy. The leaders are charismaticand tend to attract high levels of media attention. Most have substantialsupport in their home state and minimal support elsewhere (Figure 2.6
Figure 3.2: ‘Brand name’ candidates boost the minor party vote
First-preference Senate vote for party, and increase in total minor party vote atthat election, per cent
0
5
10
15
20
25
30
35
Xenophon2013 (SA)
Palmer 2013(Qld)
Hanson 2016(Qld)
Hinch 2016(Vic)
Lambie 2016(Tas)
Vote for party
Increase in minor party vote
Source: Grattan analysis of AEC (2016a).
Grattan Institute 2018 25
A crisis of trust: The rise of protest politics in Australia
on page 18): a pattern more consistent with local celebrity than strongpolicy appeal.
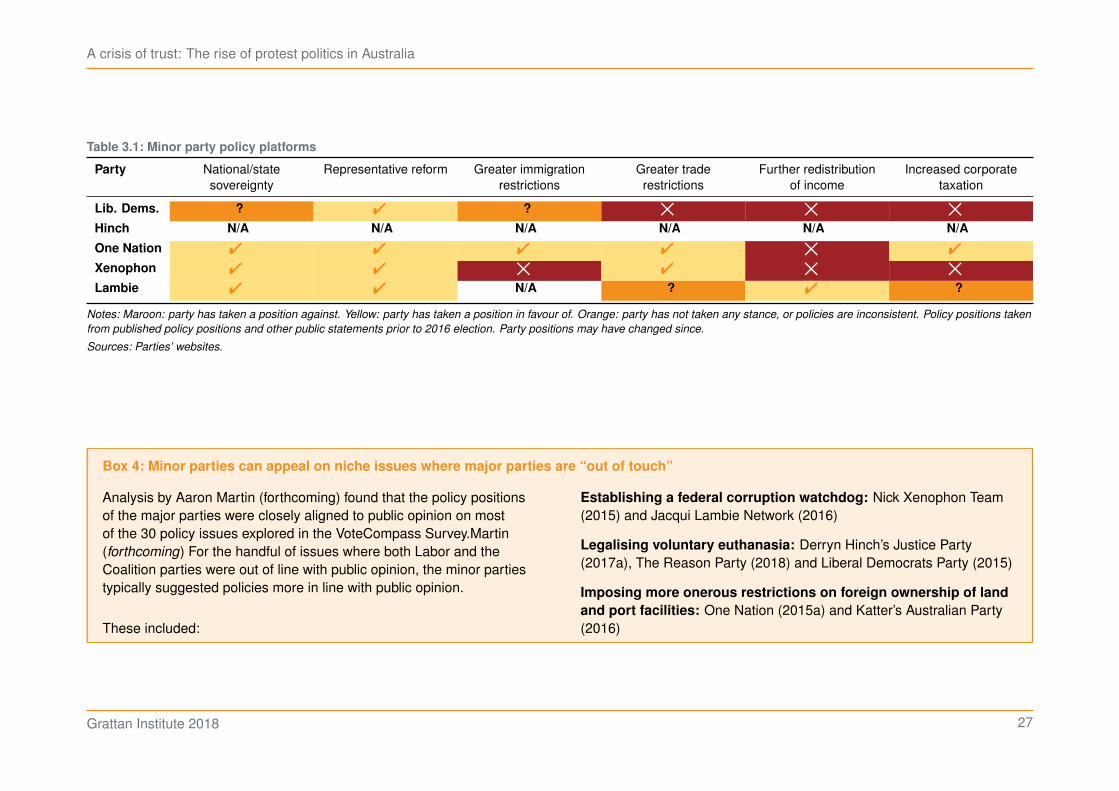
If voters are switching on policy grounds, the policy platforms of minorparties should tell us something about why Australians are movingaway from the majors.26 But the policies of minor parties vary widely(Table 3.1). In the main, minor parties have a mix of agendas, oftengrounded in political pragmatism or opportunism rather than a coherentideology.27 Minor parties’ agendas can afford to be more ‘aspirational’,because they do not have to make the difficult and unpopular trade-offsassociated with governing.28
The one area with more overlap is rhetoric about the need to ‘drain theswamp’. Minor parties typically promise to upset the existing powerstructures, and decry the self-interest of the major parties (Chapter 6).
These issues often translate into concerns about national/statesovereignty and the need for reform to the democratic process (rep-resentative reform) (Table 3.1).
In other developed countries, minor party platforms are similarlydiverse. A review by Barclays of the platforms of the key alternativeparties across Europe, the UK and the US found that immigrationand sovereignty were the issues that united most of these parties.On economic issues and questions of redistribution, agendas rangedfrom liberal (lower taxes and welfare spending) to socialist (increasedregulation, renationalisation of infrastructure, and growth of the welfarestate).29
26. Barth (2016, p. 13).27. The Liberal Democrats are clearly an exception. They actively champion their
values as classical liberal or libertarian, and their policy platform is generallyconsistent with these values.
28. Richards (2017) concludes that populists who actually gain power often findthemselves in a policy morass because they are forced to acknowledge thatpoliticians have limited means to address the problems they promised to fix.
29. Barth (2016, pp. 14–16).
3.1.2 Policy views of minor party voters aren’t distinct from
those of major party voters
Our analysis of minor party voters suggests their views on most areasof economic or social policy are not particularly different from the viewsof major party voters (Chapters 4 and 5). The key exception is OneNation voters, who on average view immigration much more negativelythan other voters (Chapter 5).
On the other hand, minor party voters do have significantly lower levelsof trust in government and business, and are more likely to feel thatpoliticians are out of touch (Chapter 7).
3.1.3 Protest reigns supreme but policy still matters
Together these factors point to an appeal based primarily on protestand personality rather than policy. Policies are diverse across minorparties and often sit at odds with the policy views of people who arevoting for those parties.
And lack of policy is no barrier to success: Hinch attracted 6 per cent ofthe Senate vote in Victoria despite registering his party less than threemonths before the election and having few policies in major areas suchas health, education, welfare, defence and tax.30
But this is not to say that policy doesn’t matter. Some protest votersmay choose the minor party that most closely aligns with their policyviews or philosophy. And minor parties have been strategic in pickingoff issues where the major parties’ platforms do not represent publicopinion well (Box 4 on the following page). This may be a strategicresponse given minor parties do not necessarily have the resources
30. The policies of Derryn Hinch’s Justice Party are mainly focussed on reform to thejustice system – sentencing, bail reform and parole reform, for example. DerrynHinch’s Justice Party (2017b).
Grattan Institute 2018 26
A crisis of trust: The rise of protest politics in Australia
Table 3.1: Minor party policy platforms
Party National/statesovereignty
Representative reform Greater immigrationrestrictions
Greater traderestrictions
Further redistributionof income
Increased corporatetaxation
Lib. Dems. ? " ? # # #
Hinch N/A N/A N/A N/A N/A N/A
One Nation " " " " # "
Xenophon " " # " # #
Lambie " " N/A ? " ?
Notes: Maroon: party has taken a position against. Yellow: party has taken a position in favour of. Orange: party has not taken any stance, or policies are inconsistent. Policy positions taken
from published policy positions and other public statements prior to 2016 election. Party positions may have changed since.
Sources: Parties’ websites.
Box 4: Minor parties can appeal on niche issues where major parties are “out of touch”
Analysis by Aaron Martin (forthcoming) found that the policy positionsof the major parties were closely aligned to public opinion on mostof the 30 policy issues explored in the VoteCompass Survey.Martin(forthcoming) For the handful of issues where both Labor and theCoalition parties were out of line with public opinion, the minor partiestypically suggested policies more in line with public opinion.
These included:
Establishing a federal corruption watchdog: Nick Xenophon Team(2015) and Jacqui Lambie Network (2016)
Legalising voluntary euthanasia: Derryn Hinch’s Justice Party(2017a), The Reason Party (2018) and Liberal Democrats Party (2015)
Imposing more onerous restrictions on foreign ownership of land
and port facilities: One Nation (2015a) and Katter’s Australian Party(2016)
Grattan Institute 2018 27
A crisis of trust: The rise of protest politics in Australia
to develop a comprehensive policy platform, and would not necessarilybe rewarded by the electorate for doing so.
3.2 Growth in the micro party vote
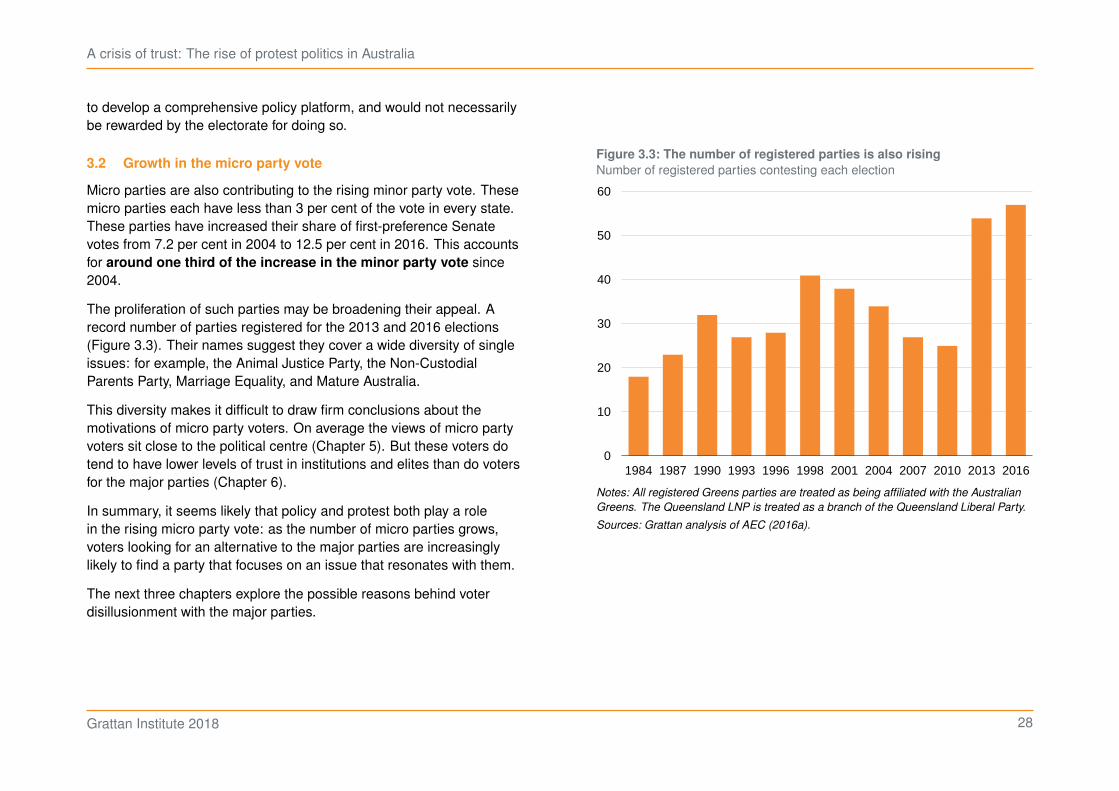
Micro parties are also contributing to the rising minor party vote. Thesemicro parties each have less than 3 per cent of the vote in every state.These parties have increased their share of first-preference Senatevotes from 7.2 per cent in 2004 to 12.5 per cent in 2016. This accountsfor around one third of the increase in the minor party vote since2004.
The proliferation of such parties may be broadening their appeal. Arecord number of parties registered for the 2013 and 2016 elections(Figure 3.3). Their names suggest they cover a wide diversity of singleissues: for example, the Animal Justice Party, the Non-CustodialParents Party, Marriage Equality, and Mature Australia.
This diversity makes it difficult to draw firm conclusions about themotivations of micro party voters. On average the views of micro partyvoters sit close to the political centre (Chapter 5). But these voters dotend to have lower levels of trust in institutions and elites than do votersfor the major parties (Chapter 6).
In summary, it seems likely that policy and protest both play a rolein the rising micro party vote: as the number of micro parties grows,voters looking for an alternative to the major parties are increasinglylikely to find a party that focuses on an issue that resonates with them.
The next three chapters explore the possible reasons behind voterdisillusionment with the major parties.
Figure 3.3: The number of registered parties is also rising
Number of registered parties contesting each election
0
10
20
30
40
50
60
1984 1987 1990 1993 1996 1998 2001 2004 2007 2010 2013 2016
Notes: All registered Greens parties are treated as being affiliated with the Australian
Greens. The Queensland LNP is treated as a branch of the Queensland Liberal Party.
Sources: Grattan analysis of AEC (2016a).
Grattan Institute 2018 28
A crisis of trust: The rise of protest politics in Australia
4 Does economic insecurity explain the rising minor party vote?
Growing economic insecurity is a common explanation for the risein the populist vote across western nations. Low wage growth, jobinsecurity and rising inequality have all been fingered as culprits forgrowing political disaffection in Australia.
But how does the evidence align with these claims?
Support for minor parties in Australia rose most when wages grewstrongly and inequality was stable. Economic insecurity also doesn’tseem to explain the widening city/regional voting divide: the regions arekeeping pace on most indicators of individual economic well-being.
Voters for the minor parties are no more likely to embrace policies toalleviate inequality or protect the poor than are voters for the majorparties. Nor do many of the minor parties focus on these themes. Butminor party voters are more likely to be concerned about job securityand to have negative views about globalisation and free trade. Theprotectionist economic policies of many minor parties may thereforeaccount for some of their appeal. But some of this rhetoric taps intothe broader cultural anxiety associated with globalisation rather than itsimmediate economic effects (Chapter 5).
Overall, low income growth or job insecurity might explain some voters’decision to vote for a minor party, but these do not seem to be thedominant driver of the rising minor party vote.
4.1 Is populism a symptom of low growth and rising inequality?
Many claim that diminishing economic security explains the rise in thepopulist vote across Western democracies.31 The theory is that the‘losers’ from globalisation protest about the erosion of their job security
31. Inglehart and Norris (2016).
and the falls in their relative incomes by voting for someone outside thepolitical mainstream.32
4.1.1 International evidence is mixed on the link between
populism and the economy
A number of empirical studies internationally have called into questionthe primacy of economics in explaining the growing populist backlash(Box 5 on the next page). Still others have pointed out that there is justas much evidence of populist parties thriving in periods of economicprosperity (or declining in economic downturns) as there is of theconverse.33
4.1.2 Evidence for economic voting in Australia
In Australia, the economic insecurity hypothesis is popular amongcommentators seeking to explain the rising support for minor partiessuch as One Nation and the Nick Xenophon Team.34
The logic is superficially attractive. Australians regularly nominate theeconomy as the number one issue that will determine their vote.35 Andit dominates the legislative agenda: since the 1960s more economiclegislation has been passed than legislation in any other policycategory.36
32. Under this theory any social or cultural tensions have an economic basis: they area by-product of the conflict between immigrants and locals over scarce resources.Esses et al. (1998) and Riek et al. (2006).
33. Mols and Jetten (2017).34. McNaughton (2017).35. Markus (2017, p. 34).36. Dowding and Martin (2017, p. 92).
Grattan Institute 2018 29
A crisis of trust: The rise of protest politics in Australia
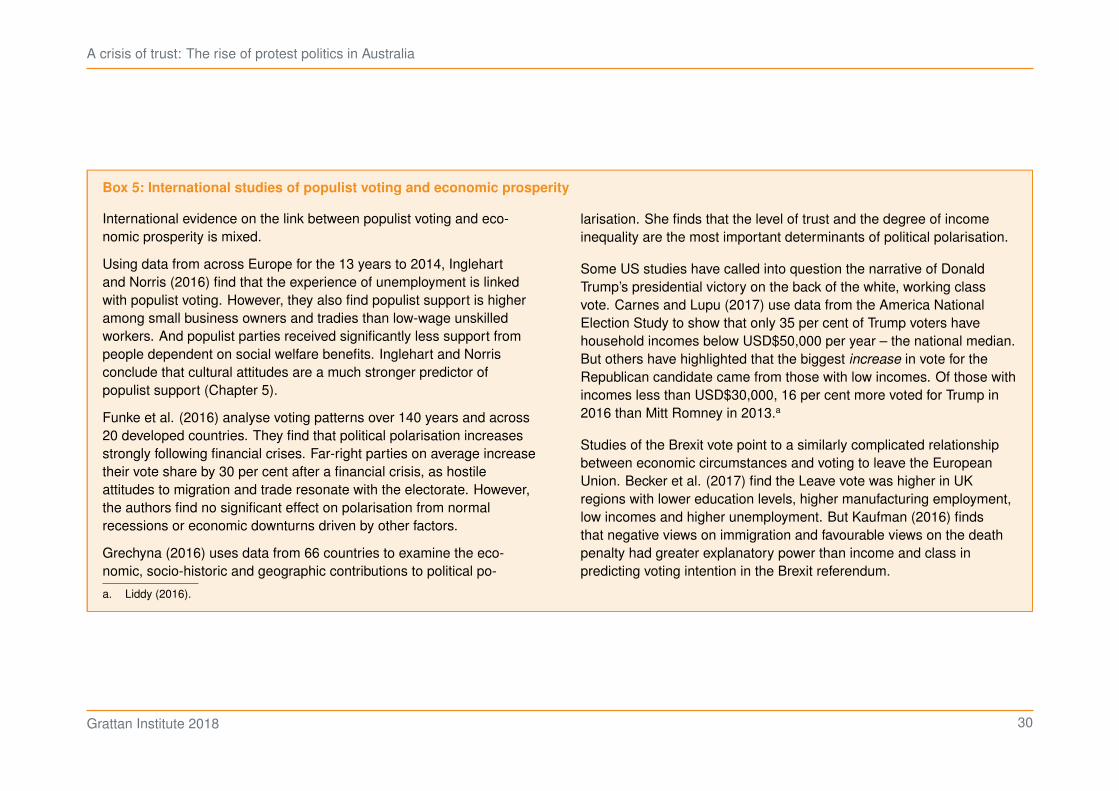
Box 5: International studies of populist voting and economic prosperity
International evidence on the link between populist voting and eco-nomic prosperity is mixed.
Using data from across Europe for the 13 years to 2014, Inglehartand Norris (2016) find that the experience of unemployment is linkedwith populist voting. However, they also find populist support is higheramong small business owners and tradies than low-wage unskilledworkers. And populist parties received significantly less support frompeople dependent on social welfare benefits. Inglehart and Norrisconclude that cultural attitudes are a much stronger predictor ofpopulist support (Chapter 5).
Funke et al. (2016) analyse voting patterns over 140 years and across20 developed countries. They find that political polarisation increasesstrongly following financial crises. Far-right parties on average increasetheir vote share by 30 per cent after a financial crisis, as hostileattitudes to migration and trade resonate with the electorate. However,the authors find no significant effect on polarisation from normalrecessions or economic downturns driven by other factors.
Grechyna (2016) uses data from 66 countries to examine the eco-nomic, socio-historic and geographic contributions to political po-
larisation. She finds that the level of trust and the degree of incomeinequality are the most important determinants of political polarisation.
Some US studies have called into question the narrative of DonaldTrump’s presidential victory on the back of the white, working classvote. Carnes and Lupu (2017) use data from the America NationalElection Study to show that only 35 per cent of Trump voters havehousehold incomes below USD$50,000 per year – the national median.But others have highlighted that the biggest increase in vote for theRepublican candidate came from those with low incomes. Of those withincomes less than USD$30,000, 16 per cent more voted for Trump in2016 than Mitt Romney in 2013.a
Studies of the Brexit vote point to a similarly complicated relationshipbetween economic circumstances and voting to leave the EuropeanUnion. Becker et al. (2017) find the Leave vote was higher in UKregions with lower education levels, higher manufacturing employment,low incomes and higher unemployment. But Kaufman (2016) findsthat negative views on immigration and favourable views on the deathpenalty had greater explanatory power than income and class inpredicting voting intention in the Brexit referendum.
a. Liddy (2016).
Grattan Institute 2018 30
A crisis of trust: The rise of protest politics in Australia
But despite this pre-eminence of economics in Australian parliamentaryefforts and the minds of voters, studies have failed to find any relation-ship between the vote-share of the incumbent and the health of theAustralian economy.37 Indeed, Hellwig and McAllister (2016) documentthe ‘paradox’ of the low levels of economic voting in Australia comparedto similar democracies.38
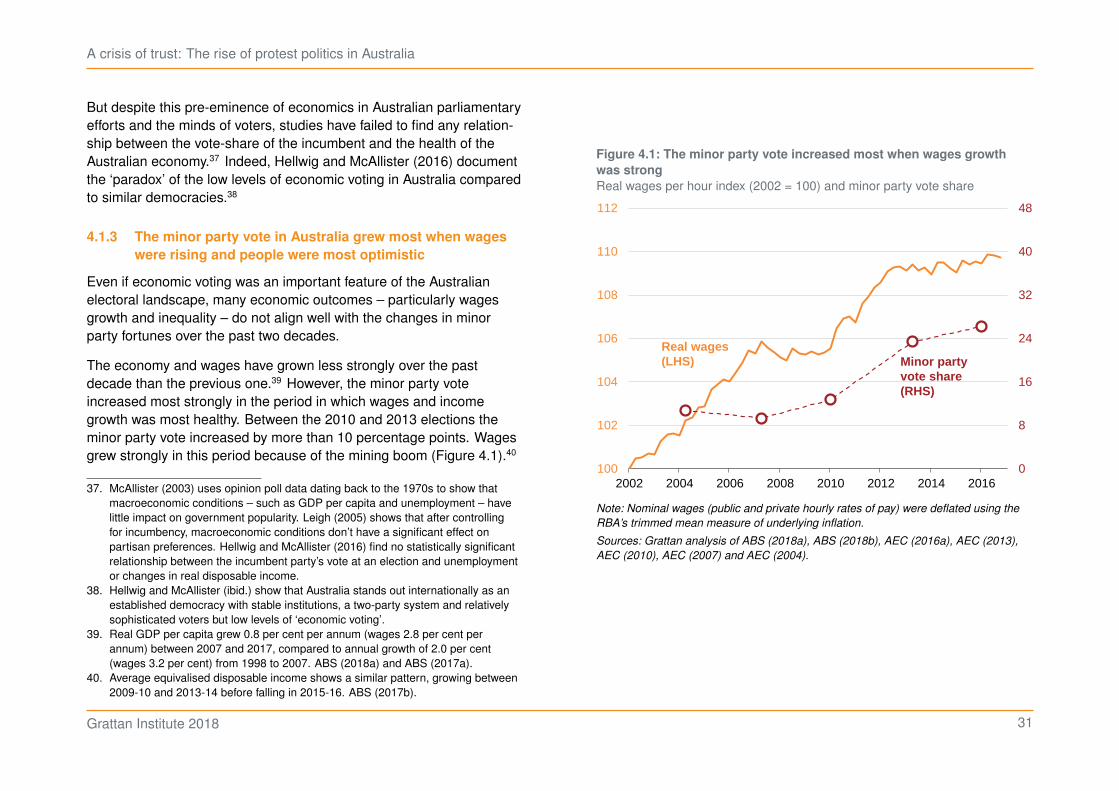
4.1.3 The minor party vote in Australia grew most when wages
were rising and people were most optimistic
Even if economic voting was an important feature of the Australianelectoral landscape, many economic outcomes – particularly wagesgrowth and inequality – do not align well with the changes in minorparty fortunes over the past two decades.
The economy and wages have grown less strongly over the pastdecade than the previous one.39 However, the minor party voteincreased most strongly in the period in which wages and incomegrowth was most healthy. Between the 2010 and 2013 elections theminor party vote increased by more than 10 percentage points. Wagesgrew strongly in this period because of the mining boom (Figure 4.1).40
37. McAllister (2003) uses opinion poll data dating back to the 1970s to show thatmacroeconomic conditions – such as GDP per capita and unemployment – havelittle impact on government popularity. Leigh (2005) shows that after controllingfor incumbency, macroeconomic conditions don’t have a significant effect onpartisan preferences. Hellwig and McAllister (2016) find no statistically significantrelationship between the incumbent party’s vote at an election and unemploymentor changes in real disposable income.
38. Hellwig and McAllister (ibid.) show that Australia stands out internationally as anestablished democracy with stable institutions, a two-party system and relativelysophisticated voters but low levels of ‘economic voting’.
39. Real GDP per capita grew 0.8 per cent per annum (wages 2.8 per cent perannum) between 2007 and 2017, compared to annual growth of 2.0 per cent(wages 3.2 per cent) from 1998 to 2007. ABS (2018a) and ABS (2017a).
40. Average equivalised disposable income shows a similar pattern, growing between2009-10 and 2013-14 before falling in 2015-16. ABS (2017b).
Figure 4.1: The minor party vote increased most when wages growth
was strong
Real wages per hour index (2002 = 100) and minor party vote share
0
8
16
24
32
40
48
100
102
104
106
108
110
112
2002 2004 2006 2008 2010 2012 2014 2016
Real wages (LHS) Minor party
vote share (RHS)
Note: Nominal wages (public and private hourly rates of pay) were deflated using the
RBA’s trimmed mean measure of underlying inflation.
Sources: Grattan analysis of ABS (2018a), ABS (2018b), AEC (2016a), AEC (2013),
AEC (2010), AEC (2007) and AEC (2004).
Grattan Institute 2018 31
A crisis of trust: The rise of protest politics in Australia
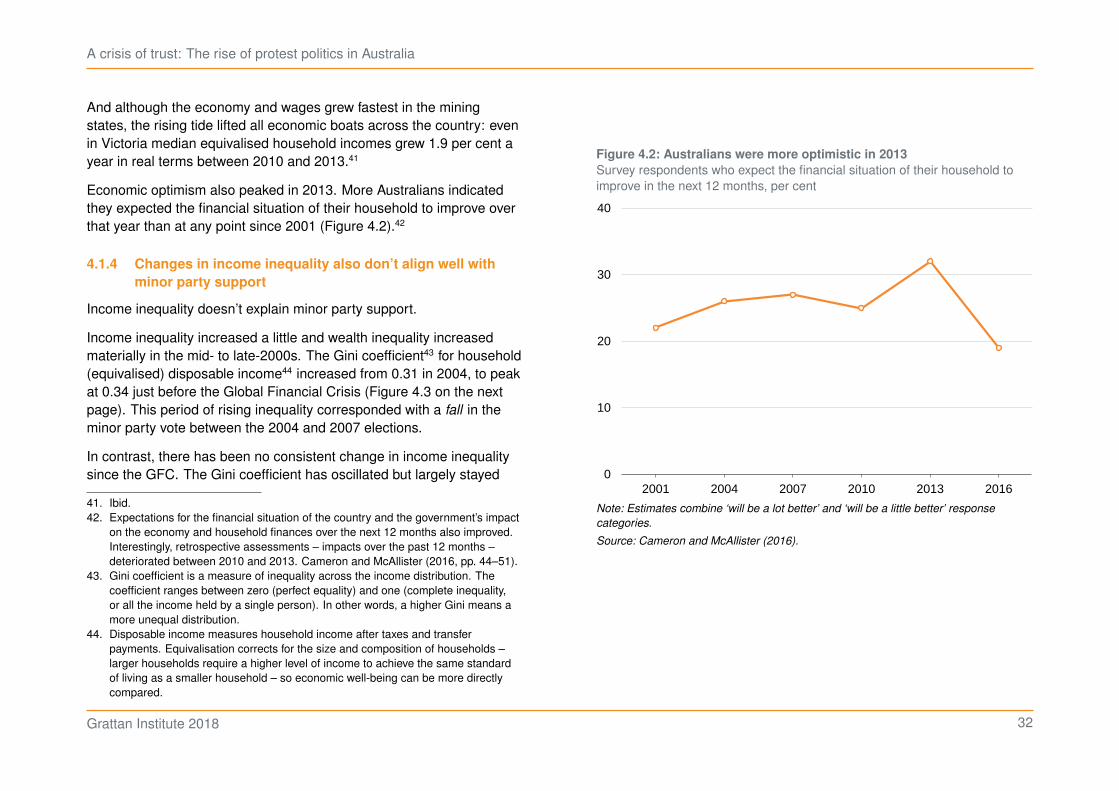
And although the economy and wages grew fastest in the miningstates, the rising tide lifted all economic boats across the country: evenin Victoria median equivalised household incomes grew 1.9 per cent ayear in real terms between 2010 and 2013.41
Economic optimism also peaked in 2013. More Australians indicatedthey expected the financial situation of their household to improve overthat year than at any point since 2001 (Figure 4.2).42
4.1.4 Changes in income inequality also don’t align well with
minor party support
Income inequality doesn’t explain minor party support.
Income inequality increased a little and wealth inequality increasedmaterially in the mid- to late-2000s. The Gini coefficient43 for household(equivalised) disposable income44 increased from 0.31 in 2004, to peakat 0.34 just before the Global Financial Crisis (Figure 4.3 on the nextpage). This period of rising inequality corresponded with a fall in theminor party vote between the 2004 and 2007 elections.
In contrast, there has been no consistent change in income inequalitysince the GFC. The Gini coefficient has oscillated but largely stayed
41. Ibid.42. Expectations for the financial situation of the country and the government’s impact
on the economy and household finances over the next 12 months also improved.Interestingly, retrospective assessments – impacts over the past 12 months –deteriorated between 2010 and 2013. Cameron and McAllister (2016, pp. 44–51).
43. Gini coefficient is a measure of inequality across the income distribution. Thecoefficient ranges between zero (perfect equality) and one (complete inequality,or all the income held by a single person). In other words, a higher Gini means amore unequal distribution.
44. Disposable income measures household income after taxes and transferpayments. Equivalisation corrects for the size and composition of households –larger households require a higher level of income to achieve the same standardof living as a smaller household – so economic well-being can be more directlycompared.
Figure 4.2: Australians were more optimistic in 2013
Survey respondents who expect the financial situation of their household toimprove in the next 12 months, per cent
0
10
20
30
40
2001 2004 2007 2010 2013 2016
Note: Estimates combine ‘will be a lot better’ and ‘will be a little better’ response
categories.
Source: Cameron and McAllister (2016).
Grattan Institute 2018 32
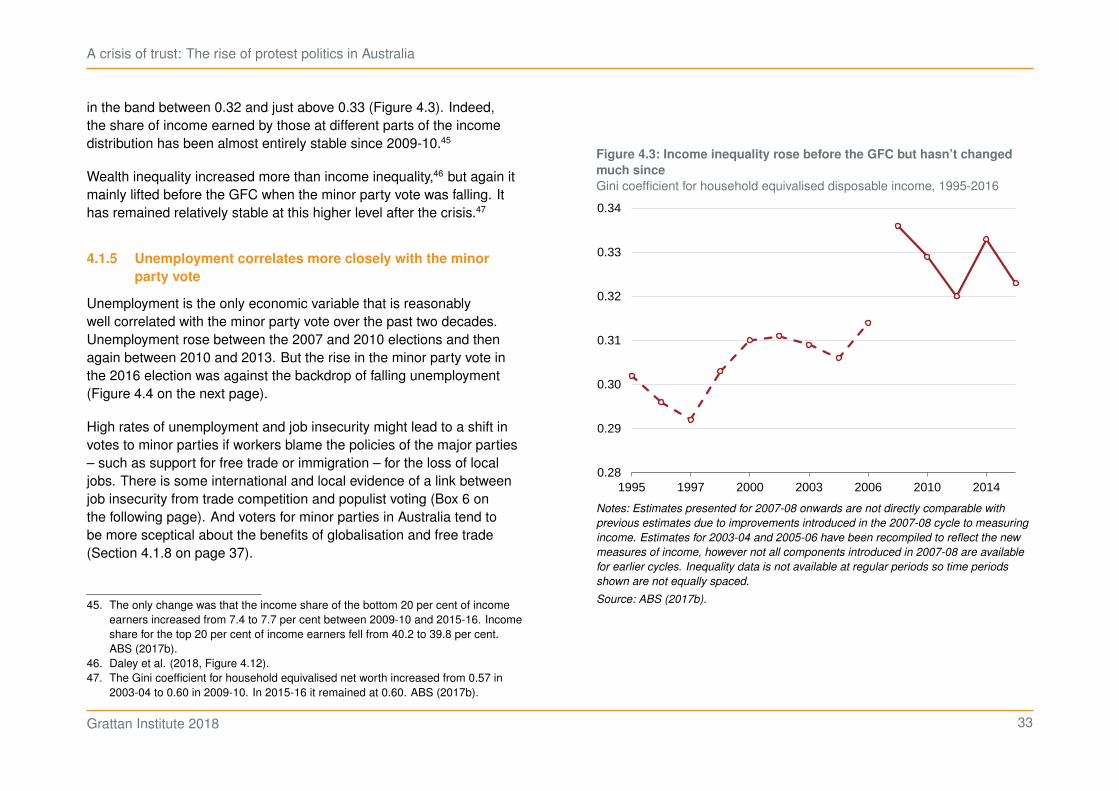
A crisis of trust: The rise of protest politics in Australia
in the band between 0.32 and just above 0.33 (Figure 4.3). Indeed,the share of income earned by those at different parts of the incomedistribution has been almost entirely stable since 2009-10.45
Wealth inequality increased more than income inequality,46 but again itmainly lifted before the GFC when the minor party vote was falling. Ithas remained relatively stable at this higher level after the crisis.47
4.1.5 Unemployment correlates more closely with the minor
party vote
Unemployment is the only economic variable that is reasonablywell correlated with the minor party vote over the past two decades.Unemployment rose between the 2007 and 2010 elections and thenagain between 2010 and 2013. But the rise in the minor party vote inthe 2016 election was against the backdrop of falling unemployment(Figure 4.4 on the next page).
High rates of unemployment and job insecurity might lead to a shift invotes to minor parties if workers blame the policies of the major parties– such as support for free trade or immigration – for the loss of localjobs. There is some international and local evidence of a link betweenjob insecurity from trade competition and populist voting (Box 6 onthe following page). And voters for minor parties in Australia tend tobe more sceptical about the benefits of globalisation and free trade(Section 4.1.8 on page 37).
45. The only change was that the income share of the bottom 20 per cent of incomeearners increased from 7.4 to 7.7 per cent between 2009-10 and 2015-16. Incomeshare for the top 20 per cent of income earners fell from 40.2 to 39.8 per cent.ABS (2017b).
46. Daley et al. (2018, Figure 4.12).47. The Gini coefficient for household equivalised net worth increased from 0.57 in
2003-04 to 0.60 in 2009-10. In 2015-16 it remained at 0.60. ABS (2017b).
Figure 4.3: Income inequality rose before the GFC but hasn’t changed
much since
Gini coefficient for household equivalised disposable income, 1995-2016
0.28
0.29
0.30
0.31
0.32
0.33
0.34
1995 1997 2000 2003 2006 2010 2014
Notes: Estimates presented for 2007-08 onwards are not directly comparable with
previous estimates due to improvements introduced in the 2007-08 cycle to measuring
income. Estimates for 2003-04 and 2005-06 have been recompiled to reflect the new
measures of income, however not all components introduced in 2007-08 are available
for earlier cycles. Inequality data is not available at regular periods so time periods
shown are not equally spaced.
Source: ABS (2017b).
Grattan Institute 2018 33
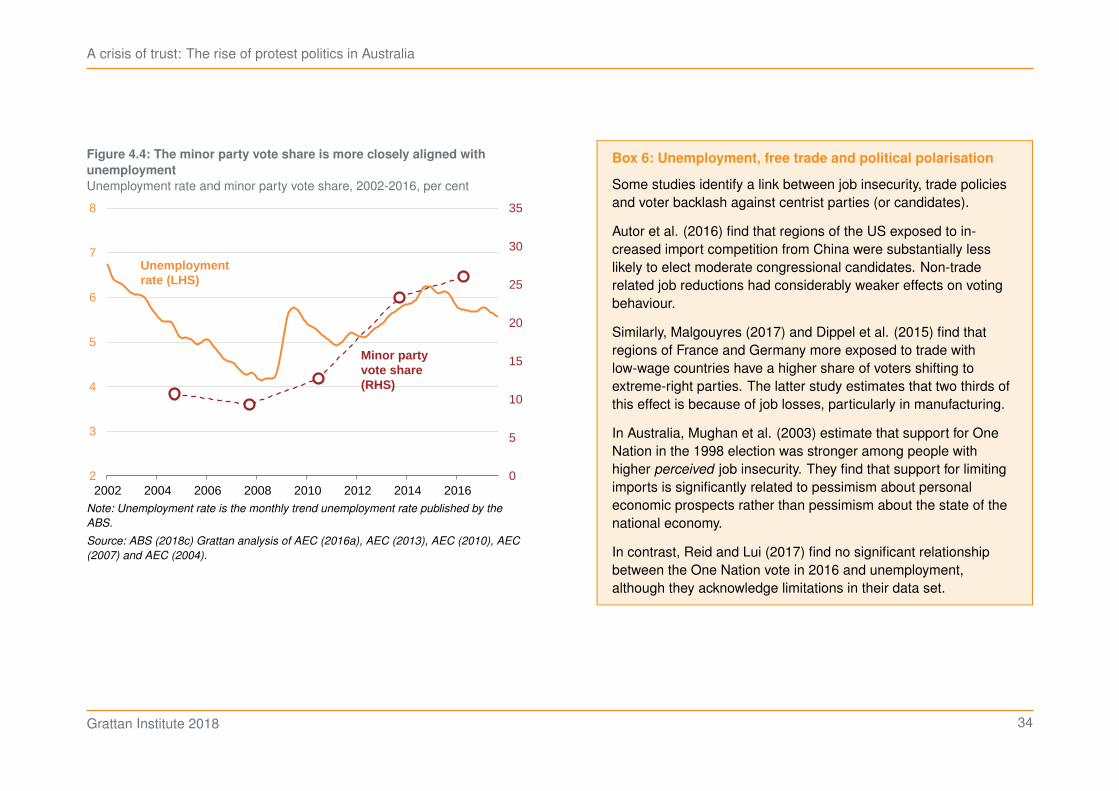
A crisis of trust: The rise of protest politics in Australia
Figure 4.4: The minor party vote share is more closely aligned with
unemployment
Unemployment rate and minor party vote share, 2002-2016, per cent
0
5
10
15
20
25
30
35
2
3
4
5
6
7
8
2002 2004 2006 2008 2010 2012 2014 2016
Minor party vote share (RHS)
Unemployment rate (LHS)
Note: Unemployment rate is the monthly trend unemployment rate published by the
ABS.
Source: ABS (2018c) Grattan analysis of AEC (2016a), AEC (2013), AEC (2010), AEC
(2007) and AEC (2004).
Box 6: Unemployment, free trade and political polarisation
Some studies identify a link between job insecurity, trade policiesand voter backlash against centrist parties (or candidates).
Autor et al. (2016) find that regions of the US exposed to in-creased import competition from China were substantially lesslikely to elect moderate congressional candidates. Non-traderelated job reductions had considerably weaker effects on votingbehaviour.
Similarly, Malgouyres (2017) and Dippel et al. (2015) find thatregions of France and Germany more exposed to trade withlow-wage countries have a higher share of voters shifting toextreme-right parties. The latter study estimates that two thirds ofthis effect is because of job losses, particularly in manufacturing.
In Australia, Mughan et al. (2003) estimate that support for OneNation in the 1998 election was stronger among people withhigher perceived job insecurity. They find that support for limitingimports is significantly related to pessimism about personaleconomic prospects rather than pessimism about the state of thenational economy.
In contrast, Reid and Lui (2017) find no significant relationshipbetween the One Nation vote in 2016 and unemployment,although they acknowledge limitations in their data set.
Grattan Institute 2018 34
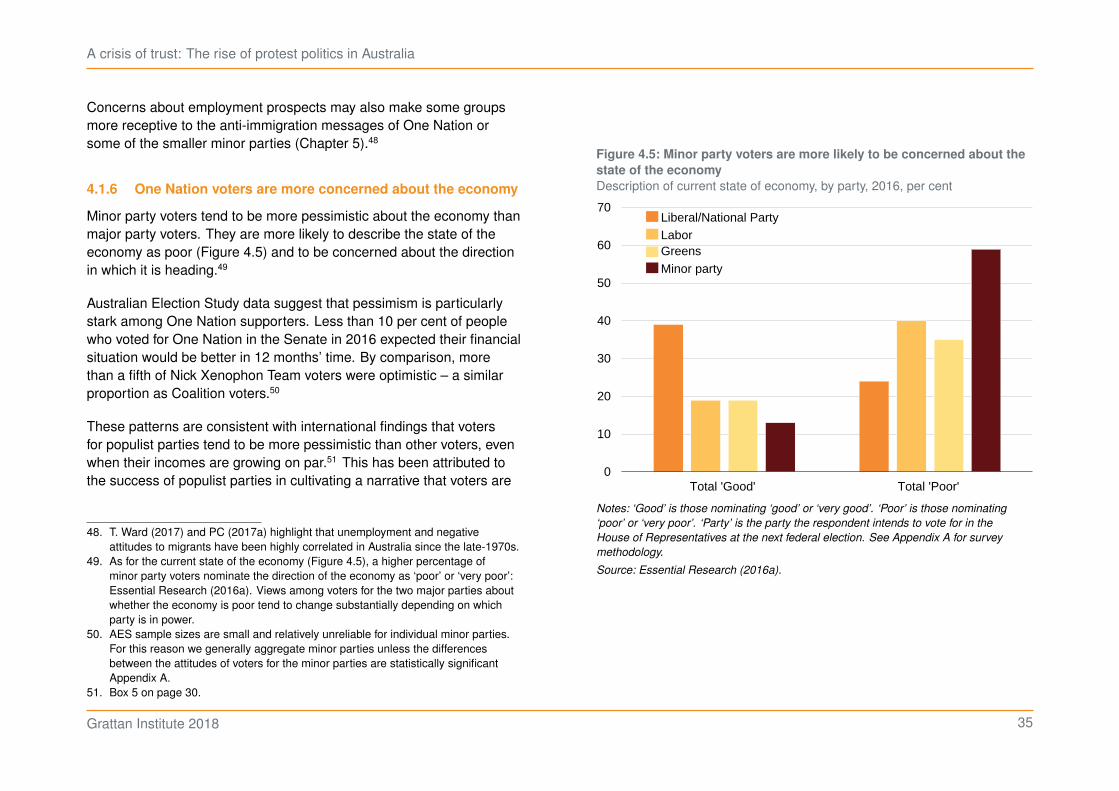
A crisis of trust: The rise of protest politics in Australia
Concerns about employment prospects may also make some groupsmore receptive to the anti-immigration messages of One Nation orsome of the smaller minor parties (Chapter 5).48
4.1.6 One Nation voters are more concerned about the economy
Minor party voters tend to be more pessimistic about the economy thanmajor party voters. They are more likely to describe the state of theeconomy as poor (Figure 4.5) and to be concerned about the directionin which it is heading.49
Australian Election Study data suggest that pessimism is particularlystark among One Nation supporters. Less than 10 per cent of peoplewho voted for One Nation in the Senate in 2016 expected their financialsituation would be better in 12 months’ time. By comparison, morethan a fifth of Nick Xenophon Team voters were optimistic – a similarproportion as Coalition voters.50
These patterns are consistent with international findings that votersfor populist parties tend to be more pessimistic than other voters, evenwhen their incomes are growing on par.51 This has been attributed tothe success of populist parties in cultivating a narrative that voters are
48. T. Ward (2017) and PC (2017a) highlight that unemployment and negativeattitudes to migrants have been highly correlated in Australia since the late-1970s.
49. As for the current state of the economy (Figure 4.5), a higher percentage ofminor party voters nominate the direction of the economy as ‘poor’ or ‘very poor’:Essential Research (2016a). Views among voters for the two major parties aboutwhether the economy is poor tend to change substantially depending on whichparty is in power.
50. AES sample sizes are small and relatively unreliable for individual minor parties.For this reason we generally aggregate minor parties unless the differencesbetween the attitudes of voters for the minor parties are statistically significantAppendix A.
51. Box 5 on page 30.
Figure 4.5: Minor party voters are more likely to be concerned about the
state of the economy
Description of current state of economy, by party, 2016, per cent
0
10
20
30
40
50
60
70
Total 'Good' Total 'Poor'
Liberal/National Party LaborGreens Minor party
Notes: ‘Good’ is those nominating ‘good’ or ‘very good’. ‘Poor’ is those nominating
‘poor’ or ‘very poor’. ‘Party’ is the party the respondent intends to vote for in the
House of Representatives at the next federal election. See Appendix A for survey
methodology.
Source: Essential Research (2016a).
Grattan Institute 2018 35
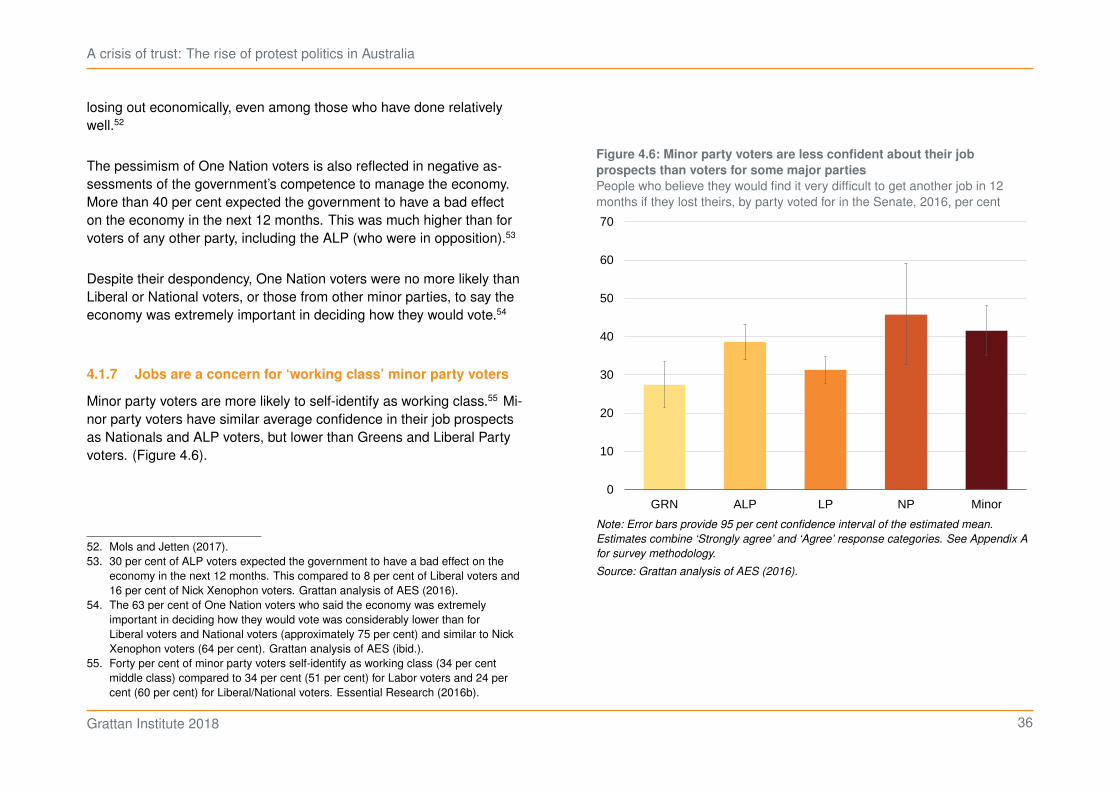
A crisis of trust: The rise of protest politics in Australia
losing out economically, even among those who have done relativelywell.52
The pessimism of One Nation voters is also reflected in negative as-sessments of the government’s competence to manage the economy.More than 40 per cent expected the government to have a bad effecton the economy in the next 12 months. This was much higher than forvoters of any other party, including the ALP (who were in opposition).53
Despite their despondency, One Nation voters were no more likely thanLiberal or National voters, or those from other minor parties, to say theeconomy was extremely important in deciding how they would vote.54
4.1.7 Jobs are a concern for ‘working class’ minor party voters
Minor party voters are more likely to self-identify as working class.55 Mi-nor party voters have similar average confidence in their job prospectsas Nationals and ALP voters, but lower than Greens and Liberal Partyvoters. (Figure 4.6).
52. Mols and Jetten (2017).53. 30 per cent of ALP voters expected the government to have a bad effect on the
economy in the next 12 months. This compared to 8 per cent of Liberal voters and16 per cent of Nick Xenophon voters. Grattan analysis of AES (2016).
54. The 63 per cent of One Nation voters who said the economy was extremelyimportant in deciding how they would vote was considerably lower than forLiberal voters and National voters (approximately 75 per cent) and similar to NickXenophon voters (64 per cent). Grattan analysis of AES (ibid.).
55. Forty per cent of minor party voters self-identify as working class (34 per centmiddle class) compared to 34 per cent (51 per cent) for Labor voters and 24 percent (60 per cent) for Liberal/National voters. Essential Research (2016b).
Figure 4.6: Minor party voters are less confident about their job
prospects than voters for some major parties
People who believe they would find it very difficult to get another job in 12months if they lost theirs, by party voted for in the Senate, 2016, per cent
0
10
20
30
40
50
60
70
GRN ALP LP NP Minor
Note: Error bars provide 95 per cent confidence interval of the estimated mean.
Estimates combine ‘Strongly agree’ and ‘Agree’ response categories. See Appendix A
for survey methodology.
Source: Grattan analysis of AES (2016).
Grattan Institute 2018 36
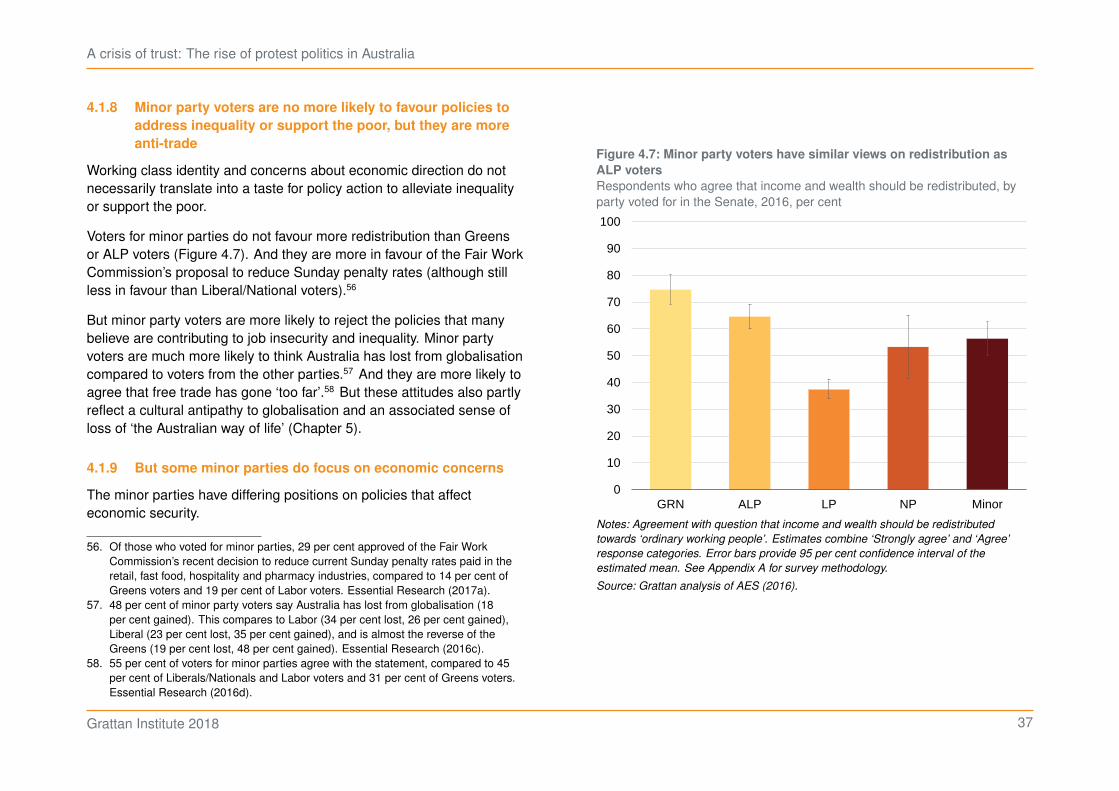
A crisis of trust: The rise of protest politics in Australia
4.1.8 Minor party voters are no more likely to favour policies to
address inequality or support the poor, but they are more
anti-trade
Working class identity and concerns about economic direction do notnecessarily translate into a taste for policy action to alleviate inequalityor support the poor.
Voters for minor parties do not favour more redistribution than Greensor ALP voters (Figure 4.7). And they are more in favour of the Fair WorkCommission’s proposal to reduce Sunday penalty rates (although stillless in favour than Liberal/National voters).56
But minor party voters are more likely to reject the policies that manybelieve are contributing to job insecurity and inequality. Minor partyvoters are much more likely to think Australia has lost from globalisationcompared to voters from the other parties.57 And they are more likely toagree that free trade has gone ‘too far’.58 But these attitudes also partlyreflect a cultural antipathy to globalisation and an associated sense ofloss of ‘the Australian way of life’ (Chapter 5).
4.1.9 But some minor parties do focus on economic concerns
The minor parties have differing positions on policies that affecteconomic security.
56. Of those who voted for minor parties, 29 per cent approved of the Fair WorkCommission’s recent decision to reduce current Sunday penalty rates paid in theretail, fast food, hospitality and pharmacy industries, compared to 14 per cent ofGreens voters and 19 per cent of Labor voters. Essential Research (2017a).
57. 48 per cent of minor party voters say Australia has lost from globalisation (18per cent gained). This compares to Labor (34 per cent lost, 26 per cent gained),Liberal (23 per cent lost, 35 per cent gained), and is almost the reverse of theGreens (19 per cent lost, 48 per cent gained). Essential Research (2016c).
58. 55 per cent of voters for minor parties agree with the statement, compared to 45per cent of Liberals/Nationals and Labor voters and 31 per cent of Greens voters.Essential Research (2016d).
Figure 4.7: Minor party voters have similar views on redistribution as
ALP voters
Respondents who agree that income and wealth should be redistributed, byparty voted for in the Senate, 2016, per cent
0
10
20
30
40
50
60
70
80
90
100
GRN ALP LP NP Minor
Notes: Agreement with question that income and wealth should be redistributed
towards ‘ordinary working people’. Estimates combine ‘Strongly agree’ and ‘Agree’
response categories. Error bars provide 95 per cent confidence interval of the
estimated mean. See Appendix A for survey methodology.
Source: Grattan analysis of AES (2016).
Grattan Institute 2018 37
A crisis of trust: The rise of protest politics in Australia
The Jacqui Lambie Network and One Nation are the two minor partiesthat attract a disproportionate amount of their support from low-incomeareas. Lambie strongly opposes cuts to welfare benefits,59 and herSenate voting patterns are consistent with this stance.60 In contrast,One Nation generally favours tightening access to welfare (but not thepension) – measures that would disproportionately reduce incomes forthe most vulnerable.61
On jobs, Xenophon is notable as a party leader who strongly advocatesfor policies to increase jobs in his home state of South Australia.62
And while foreign trade is a second-order issue in Australian politics,63
some minor parties do emphasise it in their platforms. One Nation isstrongly opposed to ‘free trade economic policies’, arguing they havebeen responsible for the decline in manufacturing.64 Xenophon calls
59. ABC News (2017).60. Lambie has almost always voted against policies that would reduce welfare
benefits, but has mixed support for policies that would increase benefits. GrattanInstitute analysis of They Vote for You database.
61. Grattan analysis of They Vote for You database. One Nation policy is to increasethe Age Pension One Nation (2015b).
62. Xenophon lobbied heavily for Australia’s replacement submarines to be built inSouth Australia and for the major parties to commit to a bail-out for the Whyallasteel works in the lead-up to the 2016 election. He also lobbied for the federalgovernment to provide money for a proton beam therapy centre in Adelaide. ABCNews (2014), B. Fitzgerald (2016) and SBS News (2017a).
63. Dowding and Martin (2017, pp. 98, 186) estimate that trade consumes around 3per cent of legislative attention, far less than the time dedicated to macroeconomicconditions, banking, finance, domestic commerce and labour and immigration.It also consumes less media attention, other than short periods of focus duringthe Asian Financial Crisis and the signing of the USFTA. The share nominatingforeign trade among the ‘three most important things government should be doingsomething about’ fell (from a low base) between the early-1990s and the early-2000s. The share nominating it as the ‘most important thing facing Australia today’has also remained low since that time. Dowding and Martin (ibid., pp. 207–208).
64. One Nation (2015c).
for stronger anti-dumping laws,65 and Bob Katter advocated againstthe Trans-Pacific Partnership agreement.66 These policies differentiatethese minor parties from the ‘consensus’ among the major partiesabout the economic benefits of free trade.
4.1.10 Economics: something, but not everything
Economic factors at best provide a partial explanation for the overallrise in the minor party vote (Table 4.1 on the next page).
If voters really are ‘stewing in ominous silence’ over rising inequality,67 itis difficult to detect. The minor party vote rose most when wages wererising and inequality was flat-lining. And there is no evidence that minorparties or their voters are especially keen on redistribution or boostingthe safety net.
Similarly, while minor party voters are more concerned about theeconomy than are major party voters, the minor parties do not speakin the language of growth or expanding prosperity. And their popularitygrew most when workers were doing relatively well.
If there is an ‘economic’ dimension to the popularity of the minor partiesit is their message on job security. Minor party voters are more likely toidentify as working class. They are also more likely to offer a negativeassessment of globalisation and free trade. The protectionist policiesadvocated by the minor parties will not bring back the agriculturaland manufacturing jobs lost over the past four decades.68 But they doappeal, particularly to older male voters who work outside the servicessector and are nostalgic for a period of greater job opportunities.
65. Nick Xenophon Team (2017a).66. Katter’s Australian Party (2017).67. Swan (2016).68. Leigh (2017).
Grattan Institute 2018 38
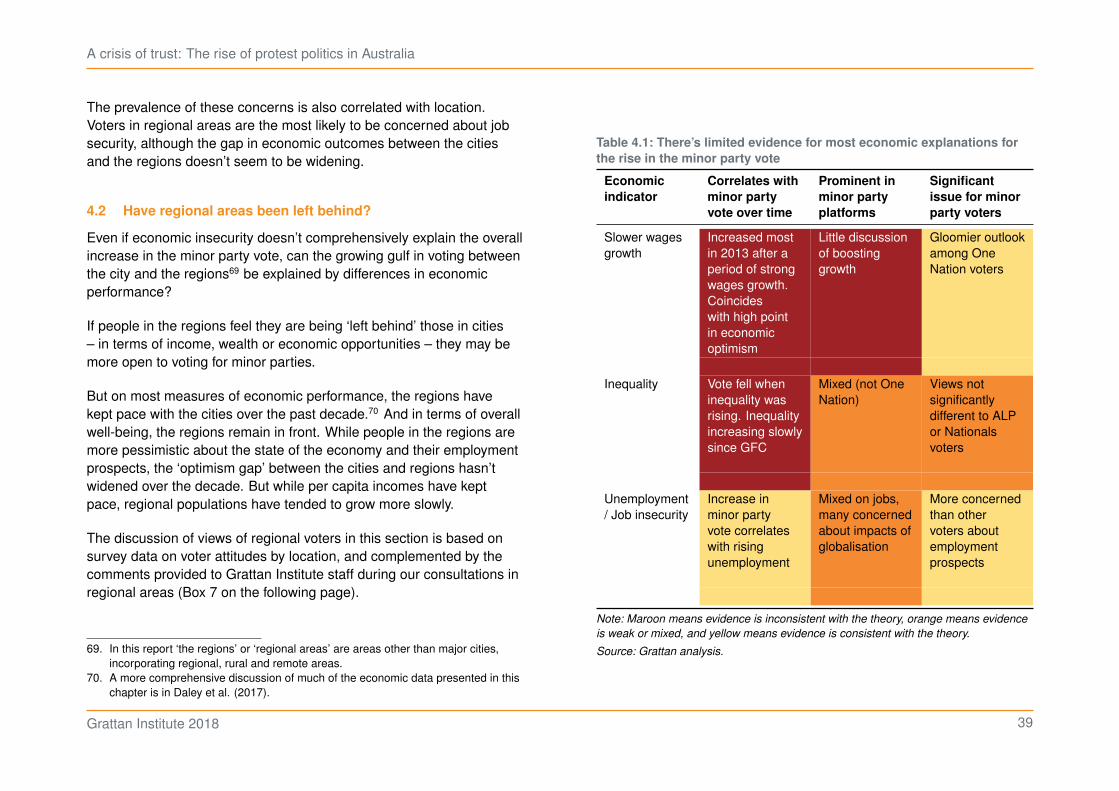
A crisis of trust: The rise of protest politics in Australia
The prevalence of these concerns is also correlated with location.Voters in regional areas are the most likely to be concerned about jobsecurity, although the gap in economic outcomes between the citiesand the regions doesn’t seem to be widening.
4.2 Have regional areas been left behind?
Even if economic insecurity doesn’t comprehensively explain the overallincrease in the minor party vote, can the growing gulf in voting betweenthe city and the regions69 be explained by differences in economicperformance?
If people in the regions feel they are being ‘left behind’ those in cities– in terms of income, wealth or economic opportunities – they may bemore open to voting for minor parties.
But on most measures of economic performance, the regions havekept pace with the cities over the past decade.70 And in terms of overallwell-being, the regions remain in front. While people in the regions aremore pessimistic about the state of the economy and their employmentprospects, the ‘optimism gap’ between the cities and regions hasn’twidened over the decade. But while per capita incomes have keptpace, regional populations have tended to grow more slowly.
The discussion of views of regional voters in this section is based onsurvey data on voter attitudes by location, and complemented by thecomments provided to Grattan Institute staff during our consultations inregional areas (Box 7 on the following page).
69. In this report ‘the regions’ or ‘regional areas’ are areas other than major cities,incorporating regional, rural and remote areas.
70. A more comprehensive discussion of much of the economic data presented in thischapter is in Daley et al. (2017).
Table 4.1: There’s limited evidence for most economic explanations for
the rise in the minor party vote
Economic
indicator
Correlates with
minor party
vote over time
Prominent in
minor party
platforms
Significant
issue for minor
party voters
Slower wagesgrowth
Increased mostin 2013 after aperiod of strongwages growth.Coincideswith high pointin economicoptimism
Little discussionof boostinggrowth
Gloomier outlookamong OneNation voters
Inequality Vote fell wheninequality wasrising. Inequalityincreasing slowlysince GFC
Mixed (not OneNation)
Views notsignificantlydifferent to ALPor Nationalsvoters
Unemployment/ Job insecurity
Increase inminor partyvote correlateswith risingunemployment
Mixed on jobs,many concernedabout impacts ofglobalisation
More concernedthan othervoters aboutemploymentprospects
Note: Maroon means evidence is inconsistent with the theory, orange means evidence
is weak or mixed, and yellow means evidence is consistent with the theory.
Source: Grattan analysis.
Grattan Institute 2018 39

A crisis of trust: The rise of protest politics in Australia
Box 7: What do people in the regions say about their economic concerns?
In preparing this report, Grattan Institute staff spoke to individuals,community groups and councils in three very different regional centres:Mildura (Victoria), Whyalla (SA), and Emerald (Queensland).
Their economic and political concerns were diverse.
People in Mildura lamented the ‘brain drain’ – losing bright youngpeople to the major cities or overseas. But some considered there weregood opportunities for those who stayed in the region – for example,jobs in high-end agricultural processing. Concerns related to the agri-cultural sector also featured prominently in Mildura. Water managementissues – including the sale of water out of the Mildura region – and thepros and cons of working holiday visas for farmworkers were frequentlymentioned.
In Whyalla – a town whose economy is closely tied to the futureof the Arrium steelworks – the main concern was diversifying thelocal economy. Education, tourism, defence and aquaculture werementioned as sectors that could expand in the region to provide morejobs and a more stable future. Unsurprisingly, given the dependenceof the town on a trade-exposed industry, people in Whyalla were morehostile to free trade than those from other regions.
In Emerald, a major concern was managing the economic swings:a mining employment boom and then bust, floods, and agriculturalcommodity cycles. A fly-in fly-out workforce helped manage the
demand during the mining boom, but also led to income leaking fromthe region.
There were some consistent themes in the consultations: in all threeregions, people emphasised a desire for more government servicesand infrastructure.
In Mildura, reopening the passenger train line to Melbourne was onthe wish-list of every group we spoke to. Reopening the rail line wouldmean quicker trips to Melbourne. And the closed line weighs on thetown’s psyche as a symbol of neglect by the state government.
In Whyalla, health services were a point of concern. The hospital isclosed on the weekend, and people have to travel long distances to seespecialists because of regional consolidation of services.
In Emerald, too, consolidation of health services was raised repeatedly.There was concern about the strain on health professionals required totravel long distances because they service large areas.
But there were also many positives raised about life in the regions.Across the consultations, people spoke of the resilience of their localarea. The ability of country people to adapt and support each otherwas evidently a source of pride.
And the lifestyle of the regions was seen as a major attraction. Quickcommutes, excellent cafes, thriving arts scenes and the sense ofcommunity – all were mentioned as benefits of living in these areas.
Grattan Institute 2018 40
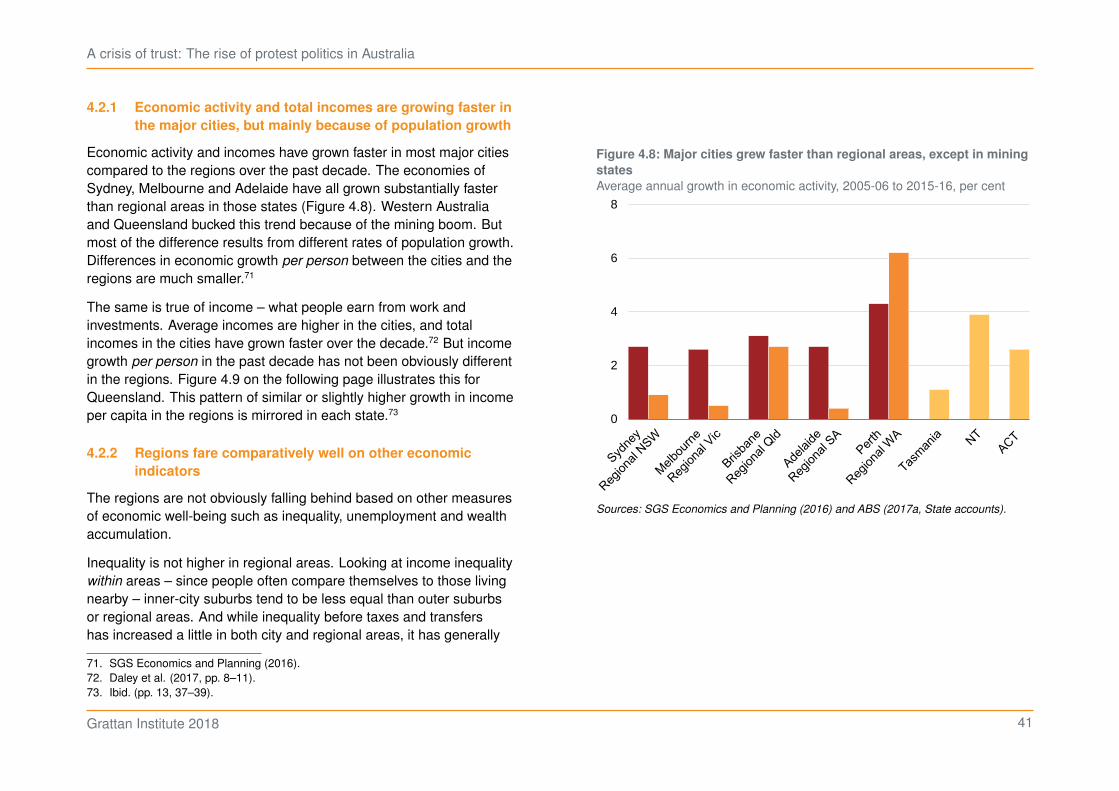
A crisis of trust: The rise of protest politics in Australia
4.2.1 Economic activity and total incomes are growing faster in
the major cities, but mainly because of population growth
Economic activity and incomes have grown faster in most major citiescompared to the regions over the past decade. The economies ofSydney, Melbourne and Adelaide have all grown substantially fasterthan regional areas in those states (Figure 4.8). Western Australiaand Queensland bucked this trend because of the mining boom. Butmost of the difference results from different rates of population growth.Differences in economic growth per person between the cities and theregions are much smaller.71
The same is true of income – what people earn from work andinvestments. Average incomes are higher in the cities, and totalincomes in the cities have grown faster over the decade.72 But incomegrowth per person in the past decade has not been obviously differentin the regions. Figure 4.9 on the following page illustrates this forQueensland. This pattern of similar or slightly higher growth in incomeper capita in the regions is mirrored in each state.73
4.2.2 Regions fare comparatively well on other economic
indicators
The regions are not obviously falling behind based on other measuresof economic well-being such as inequality, unemployment and wealthaccumulation.
Inequality is not higher in regional areas. Looking at income inequalitywithin areas – since people often compare themselves to those livingnearby – inner-city suburbs tend to be less equal than outer suburbsor regional areas. And while inequality before taxes and transfershas increased a little in both city and regional areas, it has generally
71. SGS Economics and Planning (2016).72. Daley et al. (2017, pp. 8–11).73. Ibid. (pp. 13, 37–39).
Figure 4.8: Major cities grew faster than regional areas, except in mining
states
Average annual growth in economic activity, 2005-06 to 2015-16, per cent
0
2
4
6
8
Sources: SGS Economics and Planning (2016) and ABS (2017a, State accounts).
Grattan Institute 2018 41
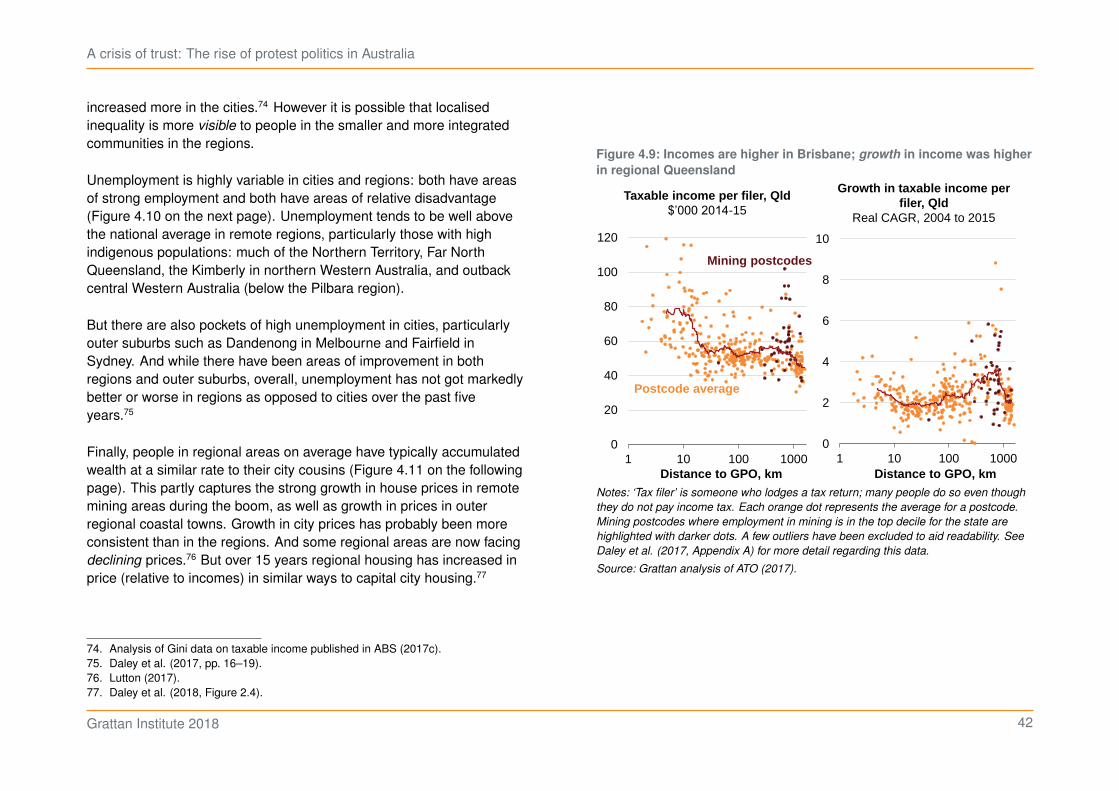
A crisis of trust: The rise of protest politics in Australia
increased more in the cities.74 However it is possible that localisedinequality is more visible to people in the smaller and more integratedcommunities in the regions.
Unemployment is highly variable in cities and regions: both have areasof strong employment and both have areas of relative disadvantage(Figure 4.10 on the next page). Unemployment tends to be well abovethe national average in remote regions, particularly those with highindigenous populations: much of the Northern Territory, Far NorthQueensland, the Kimberly in northern Western Australia, and outbackcentral Western Australia (below the Pilbara region).
But there are also pockets of high unemployment in cities, particularlyouter suburbs such as Dandenong in Melbourne and Fairfield inSydney. And while there have been areas of improvement in bothregions and outer suburbs, overall, unemployment has not got markedlybetter or worse in regions as opposed to cities over the past fiveyears.75
Finally, people in regional areas on average have typically accumulatedwealth at a similar rate to their city cousins (Figure 4.11 on the followingpage). This partly captures the strong growth in house prices in remotemining areas during the boom, as well as growth in prices in outerregional coastal towns. Growth in city prices has probably been moreconsistent than in the regions. And some regional areas are now facingdeclining prices.76 But over 15 years regional housing has increased inprice (relative to incomes) in similar ways to capital city housing.77
74. Analysis of Gini data on taxable income published in ABS (2017c).75. Daley et al. (2017, pp. 16–19).76. Lutton (2017).77. Daley et al. (2018, Figure 2.4).
Figure 4.9: Incomes are higher in Brisbane; growth in income was higher
in regional Queensland
0
20
40
60
80
100
120
1 10 100 10000
2
4
6
8
10
1 10 100 1000
Taxable income per filer, Qld$’000 2014-15
Growth in taxable income per filer, Qld
Real CAGR, 2004 to 2015
Distance to GPO, km Distance to GPO, km
Postcode average
Mining postcodes
Notes: ‘Tax filer’ is someone who lodges a tax return; many people do so even though
they do not pay income tax. Each orange dot represents the average for a postcode.
Mining postcodes where employment in mining is in the top decile for the state are
highlighted with darker dots. A few outliers have been excluded to aid readability. See
Daley et al. (2017, Appendix A) for more detail regarding this data.
Source: Grattan analysis of ATO (2017).
Grattan Institute 2018 42
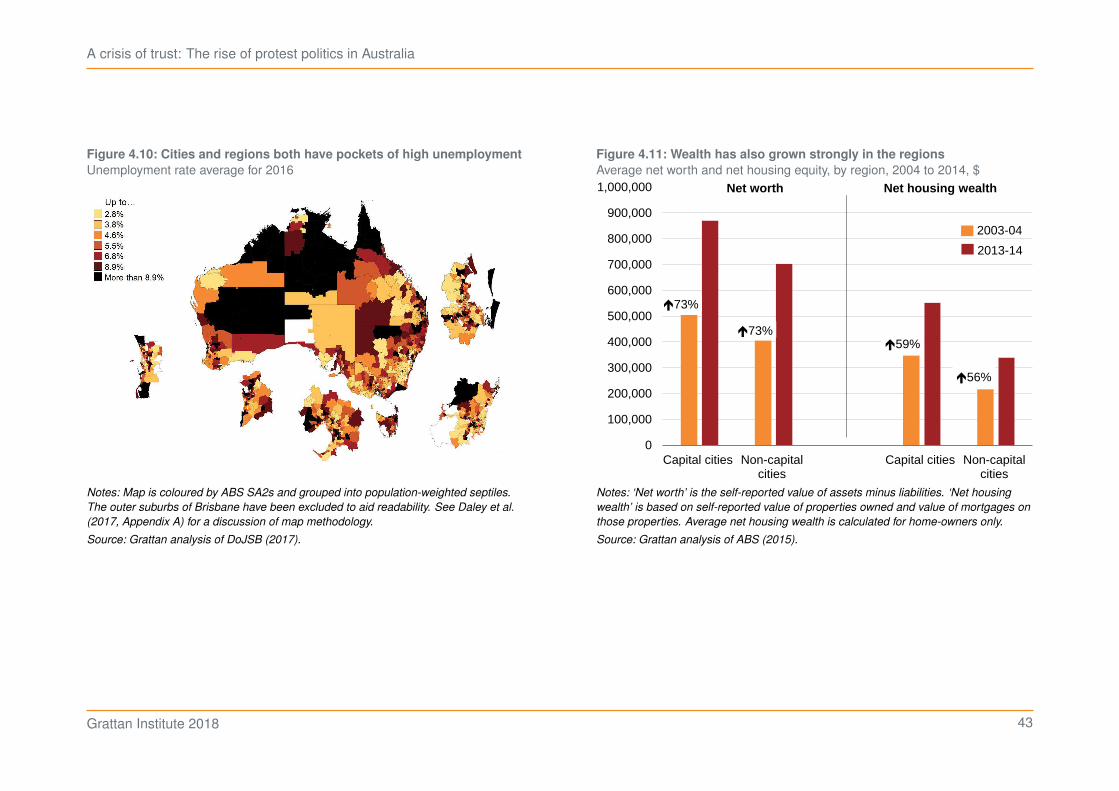
A crisis of trust: The rise of protest politics in Australia
Figure 4.10: Cities and regions both have pockets of high unemployment
Unemployment rate average for 2016
Notes: Map is coloured by ABS SA2s and grouped into population-weighted septiles.
The outer suburbs of Brisbane have been excluded to aid readability. See Daley et al.
(2017, Appendix A) for a discussion of map methodology.
Source: Grattan analysis of DoJSB (2017).
Figure 4.11: Wealth has also grown strongly in the regions
Average net worth and net housing equity, by region, 2004 to 2014, $
0
100,000
200,000
300,000
400,000
500,000
600,000
700,000
800,000
900,000
1,000,000
Capital cities Non-capitalcities
Capital cities Non-capitalcities
59%
54%
73%
73%
56%
Net worth Net housing wealth
2013-14
2003-04
Notes: ‘Net worth’ is the self-reported value of assets minus liabilities. ‘Net housing
wealth’ is based on self-reported value of properties owned and value of mortgages on
those properties. Average net housing wealth is calculated for home-owners only.
Source: Grattan analysis of ABS (2015).
Grattan Institute 2018 43
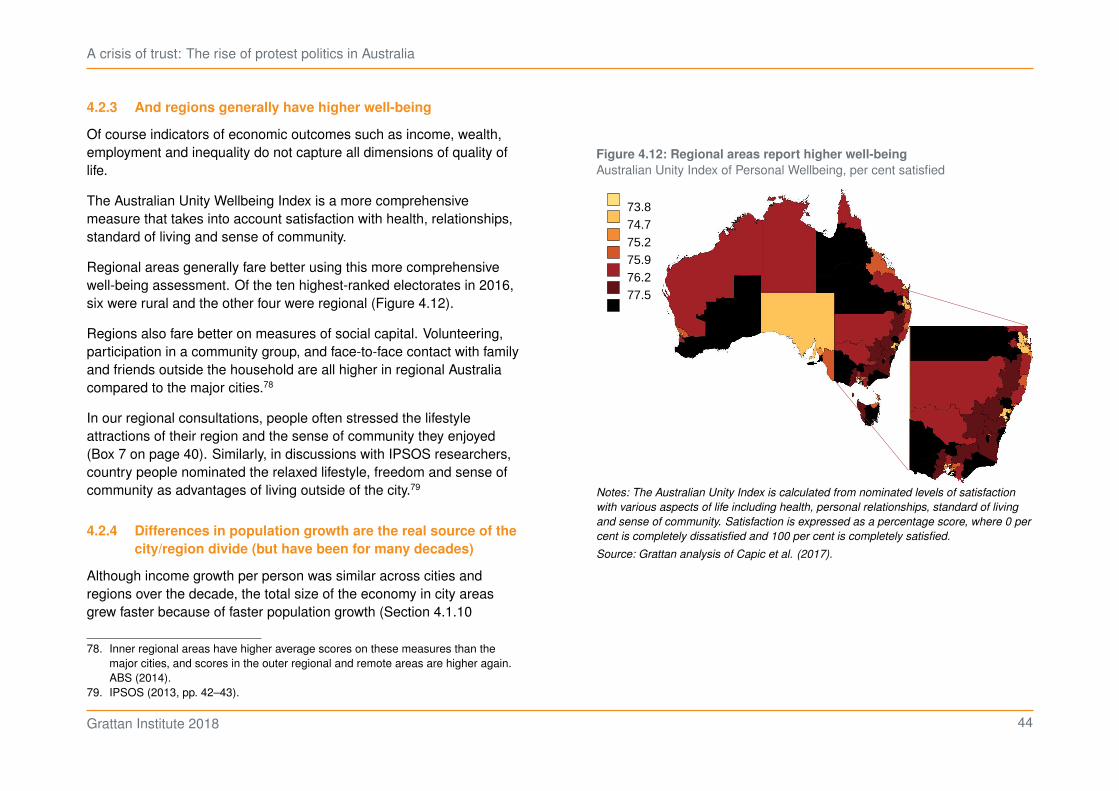
A crisis of trust: The rise of protest politics in Australia
4.2.3 And regions generally have higher well-being
Of course indicators of economic outcomes such as income, wealth,employment and inequality do not capture all dimensions of quality oflife.
The Australian Unity Wellbeing Index is a more comprehensivemeasure that takes into account satisfaction with health, relationships,standard of living and sense of community.
Regional areas generally fare better using this more comprehensivewell-being assessment. Of the ten highest-ranked electorates in 2016,six were rural and the other four were regional (Figure 4.12).
Regions also fare better on measures of social capital. Volunteering,participation in a community group, and face-to-face contact with familyand friends outside the household are all higher in regional Australiacompared to the major cities.78
In our regional consultations, people often stressed the lifestyleattractions of their region and the sense of community they enjoyed(Box 7 on page 40). Similarly, in discussions with IPSOS researchers,country people nominated the relaxed lifestyle, freedom and sense ofcommunity as advantages of living outside of the city.79
4.2.4 Differences in population growth are the real source of the
city/region divide (but have been for many decades)
Although income growth per person was similar across cities andregions over the decade, the total size of the economy in city areasgrew faster because of faster population growth (Section 4.1.10
78. Inner regional areas have higher average scores on these measures than themajor cities, and scores in the outer regional and remote areas are higher again.ABS (2014).
79. IPSOS (2013, pp. 42–43).
Figure 4.12: Regional areas report higher well-being
Australian Unity Index of Personal Wellbeing, per cent satisfied
73.874.775.275.976.277.5
Notes: The Australian Unity Index is calculated from nominated levels of satisfaction
with various aspects of life including health, personal relationships, standard of living
and sense of community. Satisfaction is expressed as a percentage score, where 0 per
cent is completely dissatisfied and 100 per cent is completely satisfied.
Source: Grattan analysis of Capic et al. (2017).
Grattan Institute 2018 44
A crisis of trust: The rise of protest politics in Australia
on page 38). Indeed, the difference in population growth is the key‘city/region divide’ in the economic data over the decade.
Population in the capital cities – particularly the inner cities and the cityfringes – grew more than 1.5 per cent a year on average.80 In contrast,populations of suburbs more than 100 km from a major city barelyincreased. Even this hides a regional dynamic: major regional centresgrew, while many of the surrounding regions and smaller towns actuallylost population.81
The Productivity Commission argues that depopulation has torn at thesocial fabric of these communities and engendered a sense of being‘left behind’ as the rest of Australia prospers.82
Regional differences in settlement patterns are caused by longer-termstructural changes in the Australian economy. An increasing proportionof the Australian workforce is employed in service industries, a patternwe see across developed economies. Over 50 years, employment inservices has risen from 5-in-10 to 8-in-10 workers.83
Services jobs, particularly in professional services, tend to cluster incities and their centres. There are big benefits to ‘agglomeration’ –being close to lots of other service firms. The productivity benefits ofcities are reflected in higher wages, GDP and rates of innovation perperson.84
These services jobs attract people both from overseas and withinAustralia who are younger and more educated. Cities have a higherproportion of young people, immigrants and people with a tertiary
80. Grattan analysis of ABS (2017d); see also Daley et al. (2017).81. Daley et al. (2017, p. 23); and PC (2017a).82. PC (2017a, pp. 19–21).83. Withers et al. (1985); and Daley et al. (2017, p. 6).84. Romer (2015); and Bettencourt et al. (2007).
education. Almost all of the migrants to Australia in the past decadehave settled in the capital cities.85
But these changes did not just emerge in the past ten years – theyhave been occurring over many decades. Indeed, the biggest structuralshifts in the economy away from agriculture and manufacturing towardsservices jobs occurred in the 1970s and 1980s.86
People in regional areas feel the loss of manufacturing jobs moreacutely than those in cities. Regional Australians are somewhat morelikely to believe that we should make more of an effort to manufacturegoods in Australia.87 However, given the longer-term nature of this shiftin employment, there is no obvious reason why shifting populationswould suddenly manifest as regional voter disillusionment in recentelections.
And there is evidence that some people in regional centres are moreworried about the side-effects of growth than about contraction. Indiscussions with IPSOS researchers, people in Bunbury, Townville andTamworth raised concerns that with growth ‘city type’ social problemsemerged: rudeness, lack of respect, traffic, and crime. Some werealso concerned about the broadening ethnic mix that this might entail(Chapter 5).88
4.2.5 People in the regions are more pessimistic (but it was
always thus)
People in regional areas are less optimistic about the economy – theytend to have more negative views on their future household financial
85. Daley et al. (2017, pp. 24–29).86. Ibid. (pp. 5–6).87. Although agreement is high across the board: 79% of people in the city agree
compared to 90% outside of cities. Political tribes data, Grattan analysis; see alsoIPSOS (2013) and Wade and Ting (2017).
88. IPSOS (2013, pp. 50–52).
Grattan Institute 2018 45
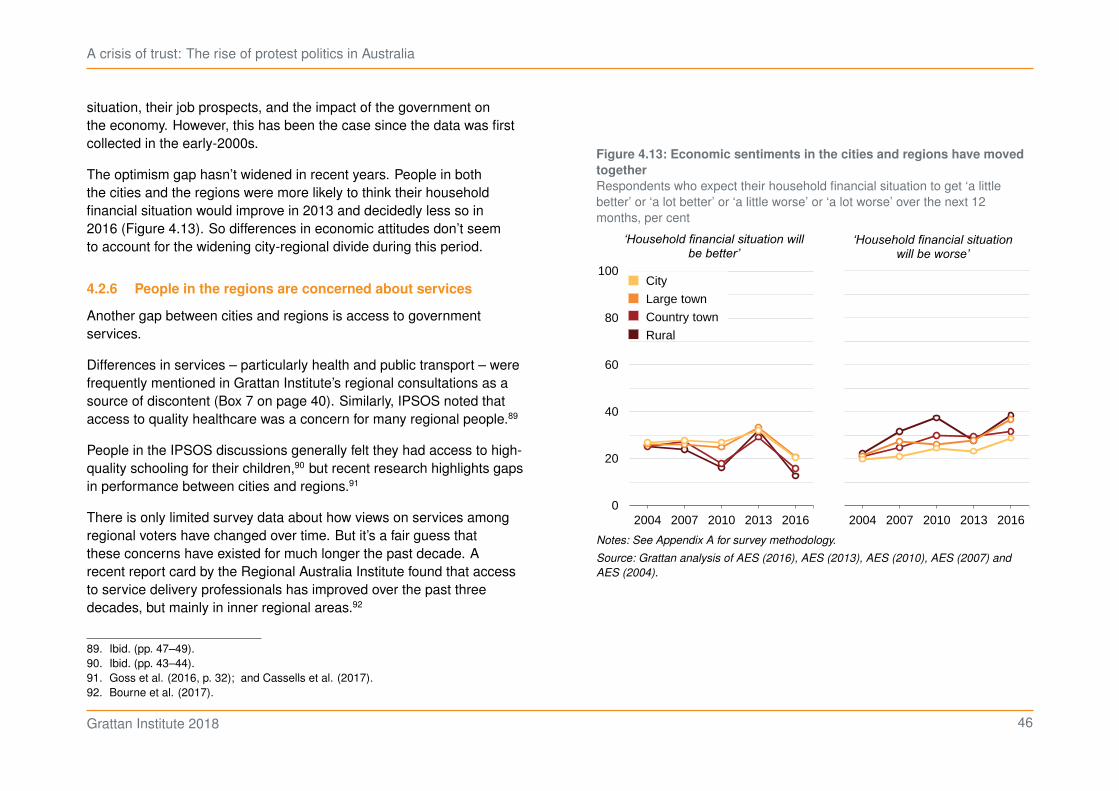
A crisis of trust: The rise of protest politics in Australia
situation, their job prospects, and the impact of the government onthe economy. However, this has been the case since the data was firstcollected in the early-2000s.
The optimism gap hasn’t widened in recent years. People in boththe cities and the regions were more likely to think their householdfinancial situation would improve in 2013 and decidedly less so in2016 (Figure 4.13). So differences in economic attitudes don’t seemto account for the widening city-regional divide during this period.
4.2.6 People in the regions are concerned about services
Another gap between cities and regions is access to governmentservices.
Differences in services – particularly health and public transport – werefrequently mentioned in Grattan Institute’s regional consultations as asource of discontent (Box 7 on page 40). Similarly, IPSOS noted thataccess to quality healthcare was a concern for many regional people.89
People in the IPSOS discussions generally felt they had access to high-quality schooling for their children,90 but recent research highlights gapsin performance between cities and regions.91
There is only limited survey data about how views on services amongregional voters have changed over time. But it’s a fair guess thatthese concerns have existed for much longer the past decade. Arecent report card by the Regional Australia Institute found that accessto service delivery professionals has improved over the past threedecades, but mainly in inner regional areas.92
89. Ibid. (pp. 47–49).90. Ibid. (pp. 43–44).91. Goss et al. (2016, p. 32); and Cassells et al. (2017).92. Bourne et al. (2017).
Figure 4.13: Economic sentiments in the cities and regions have moved
together
Respondents who expect their household financial situation to get ‘a littlebetter’ or ‘a lot better’ or ‘a little worse’ or ‘a lot worse’ over the next 12months, per cent
0
20
40
60
80
100
2004 2007 2010 2013 2016
‘Household financial situation will be better’
2004 2007 2010 2013 2016
‘Household financial situation will be worse’
City
Large town
Country town
Rural
Notes: See Appendix A for survey methodology.
Source: Grattan analysis of AES (2016), AES (2013), AES (2010), AES (2007) and
AES (2004).
Grattan Institute 2018 46
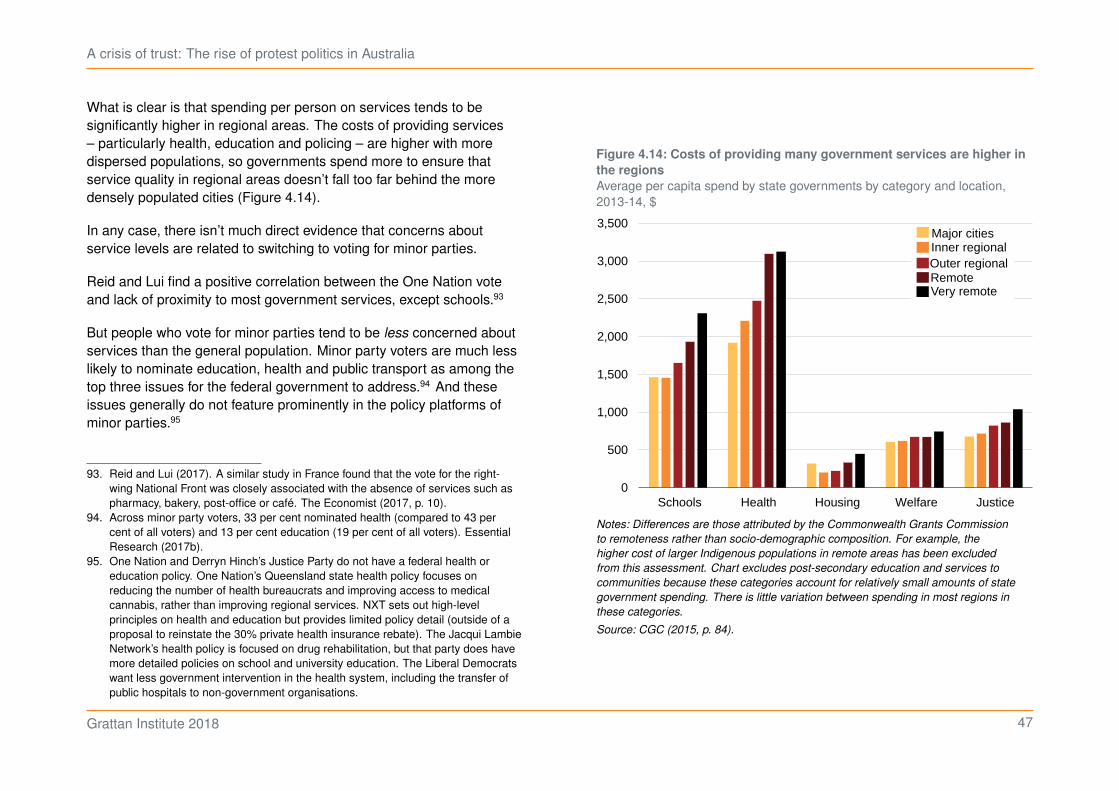
A crisis of trust: The rise of protest politics in Australia
What is clear is that spending per person on services tends to besignificantly higher in regional areas. The costs of providing services– particularly health, education and policing – are higher with moredispersed populations, so governments spend more to ensure thatservice quality in regional areas doesn’t fall too far behind the moredensely populated cities (Figure 4.14).
In any case, there isn’t much direct evidence that concerns aboutservice levels are related to switching to voting for minor parties.
Reid and Lui find a positive correlation between the One Nation voteand lack of proximity to most government services, except schools.93
But people who vote for minor parties tend to be less concerned aboutservices than the general population. Minor party voters are much lesslikely to nominate education, health and public transport as among thetop three issues for the federal government to address.94 And theseissues generally do not feature prominently in the policy platforms ofminor parties.95
93. Reid and Lui (2017). A similar study in France found that the vote for the right-wing National Front was closely associated with the absence of services such aspharmacy, bakery, post-office or café. The Economist (2017, p. 10).
94. Across minor party voters, 33 per cent nominated health (compared to 43 percent of all voters) and 13 per cent education (19 per cent of all voters). EssentialResearch (2017b).
95. One Nation and Derryn Hinch’s Justice Party do not have a federal health oreducation policy. One Nation’s Queensland state health policy focuses onreducing the number of health bureaucrats and improving access to medicalcannabis, rather than improving regional services. NXT sets out high-levelprinciples on health and education but provides limited policy detail (outside of aproposal to reinstate the 30% private health insurance rebate). The Jacqui LambieNetwork’s health policy is focused on drug rehabilitation, but that party does havemore detailed policies on school and university education. The Liberal Democratswant less government intervention in the health system, including the transfer ofpublic hospitals to non-government organisations.
Figure 4.14: Costs of providing many government services are higher in
the regions
Average per capita spend by state governments by category and location,2013-14, $
0
500
1,000
1,500
2,000
2,500
3,000
3,500
Schools Health Housing Welfare Justice
Major cities Inner regionalOuter regional Remote Very remote
Notes: Differences are those attributed by the Commonwealth Grants Commission
to remoteness rather than socio-demographic composition. For example, the
higher cost of larger Indigenous populations in remote areas has been excluded
from this assessment. Chart excludes post-secondary education and services to
communities because these categories account for relatively small amounts of state
government spending. There is little variation between spending in most regions in
these categories.
Source: CGC (2015, p. 84).
Grattan Institute 2018 47
A crisis of trust: The rise of protest politics in Australia
4.2.7 Differences between the cities and regions exist but don’t
seem to explain recent dissatisfaction
Regions differ economically from cities in a number of ways: incomesare lower on average, access to government services – particularlyhealth and public transport – is poorer, and the population is growingmore slowly, if at all.
But it is not clear that these differences can account for the wideninggulf between city and regional voting over the past decade. These arelong-standing issues and none of them has got much worse. Incomegrowth in the regions has been on par with the cities. The service ‘gap’is not obviously increasing (and in any case, does not seem to be astrong motivator of minor party voting). City populations have beengrowing faster for decades.
On other indicators such as general well-being, inequality and unem-ployment, the regions fare better, or not noticeably worse, than thecities, so these are also unlikely to account for emerging discontent.
On the other hand, these population and economic trends are accentu-ating the cultural divide between the cities and regions (Chapter 5).
4.3 Summing up
The growing minor party vote isn’t neatly explained by changes in theeconomy. Most economic indicators don’t align closely with the minorparty vote or the increasing difference in vote between the cities andregions.
But rising unemployment and associated dissatisfaction with the majorparty ‘consensus’ on free trade and immigration may have played arole. And longer-term structural changes that have reduced job oppor-tunities in certain sectors and regions also play into cultural concernsabout how Australia is changing (Chapter 5) and the effectiveness ofgovernment (Chapter 6).
Grattan Institute 2018 48
A crisis of trust: The rise of protest politics in Australia
5 Does the minor party vote reflect growing cultural divides?
This chapter explores the cultural dimensions of the minor party vote.Culture explains a great deal about why more people are voting forminor parties, especially in the regions.
Culture might play into politics as a backlash against social changecontrary to a range of personal beliefs. But claims that a growing ‘silentmajority’ are voting for minor parties to signal their opposition to sociallyprogressive change are not borne out by the facts: minor party votersdo not have strong views on social liberalism, and most minor partyplatforms don’t focus on these issues. Regional Australians are also notmuch more socially conservative than people in the cities.
A more powerful explanation for the rise in the minor party vote is thatsome voters want to ‘take back control’ in a world where the directionand pace of change isn’t to their liking. Some minor party voters areparticularly nostalgic for a time when people like them seemed to havehad more control over their lives and the country’s direction. They wishto protect the cultural symbols and narratives that are associated with‘traditional Australia’.
A sense of being left behind is more prevalent in regional Australia.Regions hold a falling share of Australia’s population, and consequentlytheir share of the nation’s economy is shrinking, as is their share ofpolitical influence. Australia’s cultural symbols are shifting from imagesof the bush to images from cities. The cultural divide between cities andregions is widening not because regions are falling behind, but becausecities are drifting further away.
Concerns about this loss of cultural power are higher among the votersfor some minor parties. And some minor parties have policies thatexplicitly appeal to these concerns. As such, culture forms a part ofthe explanation of the rising minor party vote. But as described in
Chapter 6, minor parties are usually also appealing to falling trust ingovernment – which garners votes in both cities and regions.
5.1 What cultural factors might explain the rise of minor party
voting overall?
Cultural explanations for minor party voting come in two broad flavours:
Theory 1: Opposition to progressive social change – ‘cultural
backlash’
One theory is that some voters are concerned about growing tolerancefor diverse identities.96 These voters can be mobilised by outsiderpoliticians and parties that stand up for conservative values and fightagainst political correctness.97 If ‘cultural backlash’ were a drivingfactor in the Australian case, we would expect the people who vote forminor parties to be more conservative on issues around gender roles,sexuality, and race.
Theory 2: Loss of community power – ‘taking back control’
A second theory is that minor party voters are responding to a sensethat their community or in-group is losing cultural and political power.98
These voters feel that cultural changes are generally in the wrong direc-tion: their way of life is under threat, Australia’s national sovereignty iseroding, and ‘people like me’ have been forgotten. They are drawn to
96. Beauchamp (2017); Inglehart and Norris (2016); Kaletsky (2016); and Sayer(2017).
97. Inglehart and Norris (2016); see Albrechtsen (2016), Shepherd (2017) and Wilms(2016) for examples of this discussion in Australian media.
98. Goodhart (2017); Haidt (2016a); Jennings and Stoker (2016); and Posner(2017).
Grattan Institute 2018 49
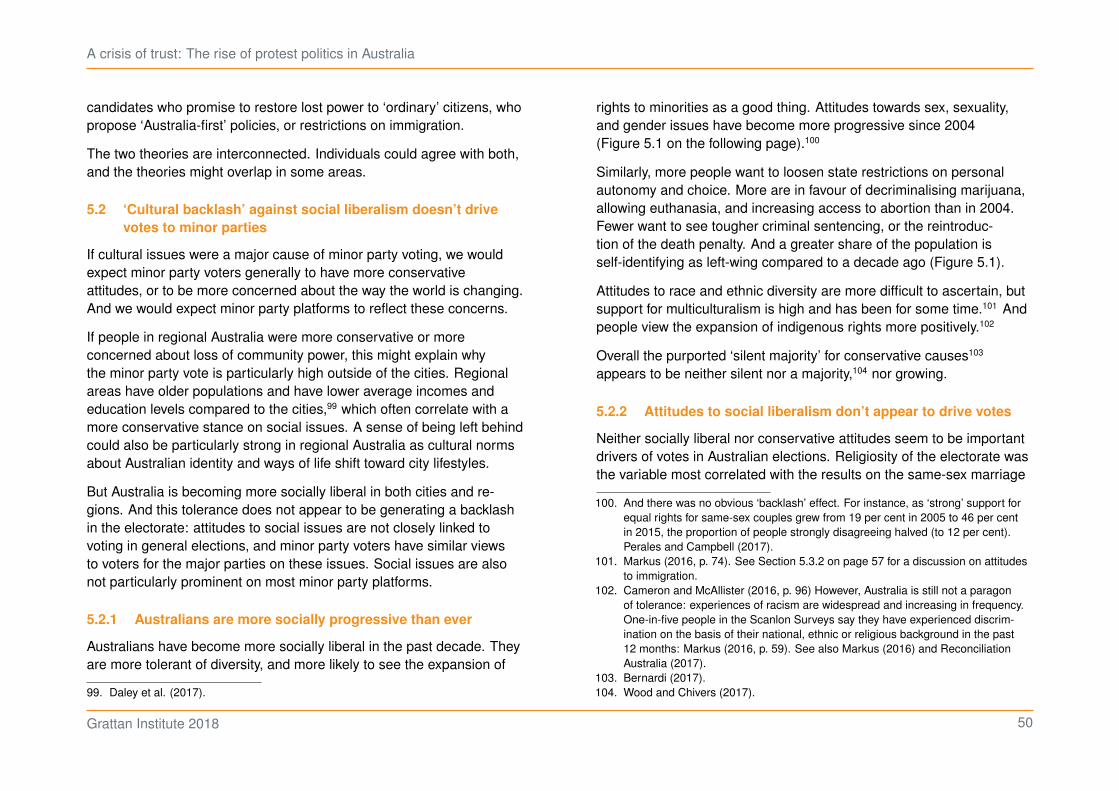
A crisis of trust: The rise of protest politics in Australia
candidates who promise to restore lost power to ‘ordinary’ citizens, whopropose ‘Australia-first’ policies, or restrictions on immigration.
The two theories are interconnected. Individuals could agree with both,and the theories might overlap in some areas.
5.2 ‘Cultural backlash’ against social liberalism doesn’t drive
votes to minor parties
If cultural issues were a major cause of minor party voting, we wouldexpect minor party voters generally to have more conservativeattitudes, or to be more concerned about the way the world is changing.And we would expect minor party platforms to reflect these concerns.
If people in regional Australia were more conservative or moreconcerned about loss of community power, this might explain whythe minor party vote is particularly high outside of the cities. Regionalareas have older populations and have lower average incomes andeducation levels compared to the cities,99 which often correlate with amore conservative stance on social issues. A sense of being left behindcould also be particularly strong in regional Australia as cultural normsabout Australian identity and ways of life shift toward city lifestyles.
But Australia is becoming more socially liberal in both cities and re-gions. And this tolerance does not appear to be generating a backlashin the electorate: attitudes to social issues are not closely linked tovoting in general elections, and minor party voters have similar viewsto voters for the major parties on these issues. Social issues are alsonot particularly prominent on most minor party platforms.
5.2.1 Australians are more socially progressive than ever
Australians have become more socially liberal in the past decade. Theyare more tolerant of diversity, and more likely to see the expansion of
99. Daley et al. (2017).
rights to minorities as a good thing. Attitudes towards sex, sexuality,and gender issues have become more progressive since 2004(Figure 5.1 on the following page).100
Similarly, more people want to loosen state restrictions on personalautonomy and choice. More are in favour of decriminalising marijuana,allowing euthanasia, and increasing access to abortion than in 2004.Fewer want to see tougher criminal sentencing, or the reintroduc-tion of the death penalty. And a greater share of the population isself-identifying as left-wing compared to a decade ago (Figure 5.1).
Attitudes to race and ethnic diversity are more difficult to ascertain, butsupport for multiculturalism is high and has been for some time.101 Andpeople view the expansion of indigenous rights more positively.102
Overall the purported ‘silent majority’ for conservative causes103
appears to be neither silent nor a majority,104 nor growing.
5.2.2 Attitudes to social liberalism don’t appear to drive votes
Neither socially liberal nor conservative attitudes seem to be importantdrivers of votes in Australian elections. Religiosity of the electorate wasthe variable most correlated with the results on the same-sex marriage
100. And there was no obvious ‘backlash’ effect. For instance, as ‘strong’ support forequal rights for same-sex couples grew from 19 per cent in 2005 to 46 per centin 2015, the proportion of people strongly disagreeing halved (to 12 per cent).Perales and Campbell (2017).
101. Markus (2016, p. 74). See Section 5.3.2 on page 57 for a discussion on attitudesto immigration.
102. Cameron and McAllister (2016, p. 96) However, Australia is still not a paragonof tolerance: experiences of racism are widespread and increasing in frequency.One-in-five people in the Scanlon Surveys say they have experienced discrim-ination on the basis of their national, ethnic or religious background in the past12 months: Markus (2016, p. 59). See also Markus (2016) and ReconciliationAustralia (2017).
103. Bernardi (2017).104. Wood and Chivers (2017).
Grattan Institute 2018 50
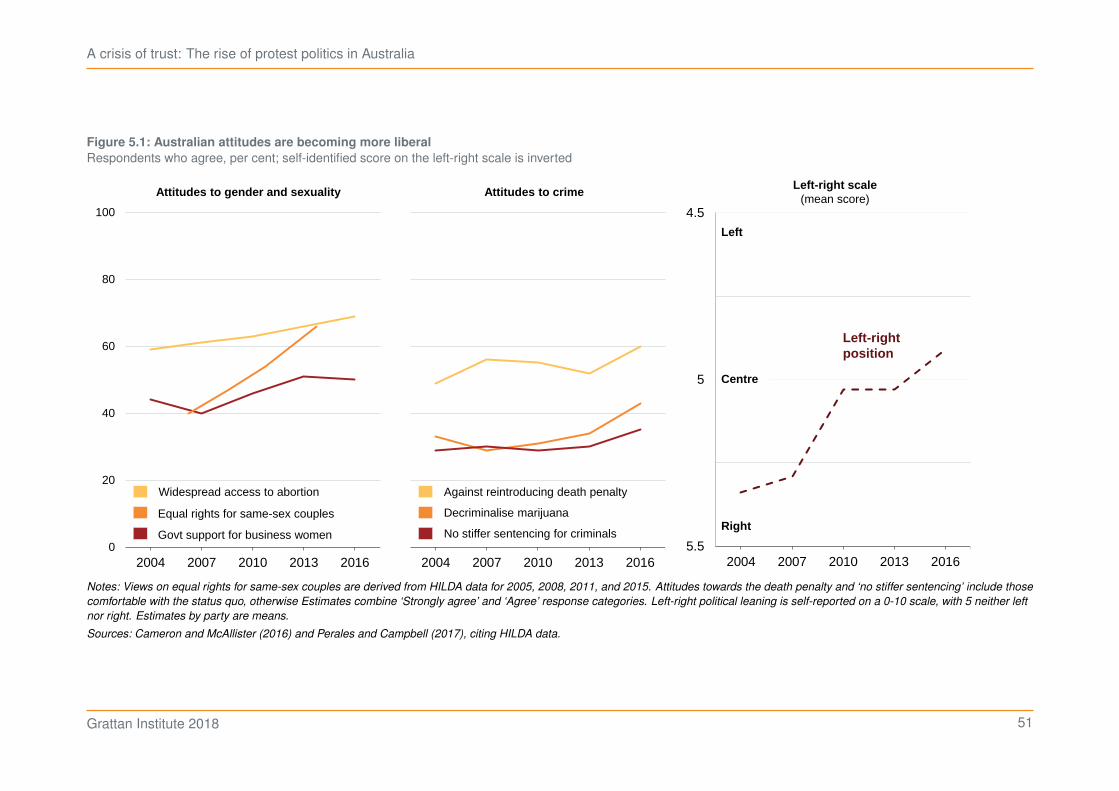
A crisis of trust: The rise of protest politics in Australia
Figure 5.1: Australian attitudes are becoming more liberal
Respondents who agree, per cent; self-identified score on the left-right scale is inverted
2000 2005 2010 2015 2020
0
20
40
60
80
100
2004 2007 2010 2013 2016
Widespread access to abortion
Equal rights for same-sex couples
Govt support for business women
0 0.5 1 1.5
0
0.1
0.2
0.3
0.4
0.5
0.6
0.7
0.8
0.9
1
0
20
40
60
80
100
2004 2007 2010 2013 2016
4.5
5
5.52004 2007 2010 2013 2016
Left-rightposition
Centre
Left
Right
Against reintroducing death penalty
Decriminalise marijuana
No stiffer sentencing for criminals
Attitudes to gender and sexuality Attitudes to crimeLeft-right scale
(mean score)
Notes: Views on equal rights for same-sex couples are derived from HILDA data for 2005, 2008, 2011, and 2015. Attitudes towards the death penalty and ‘no stiffer sentencing’ include those
comfortable with the status quo, otherwise Estimates combine ‘Strongly agree’ and ‘Agree’ response categories. Left-right political leaning is self-reported on a 0-10 scale, with 5 neither left
nor right. Estimates by party are means.
Sources: Cameron and McAllister (2016) and Perales and Campbell (2017), citing HILDA data.
Grattan Institute 2018 51
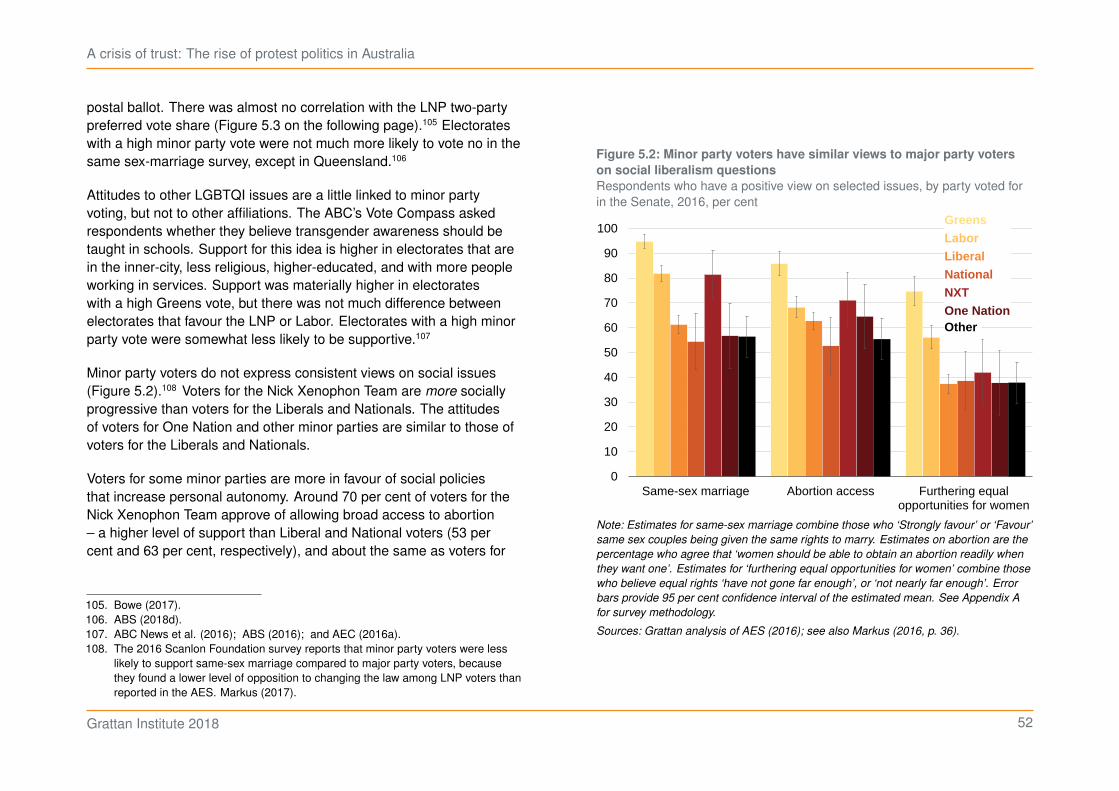
A crisis of trust: The rise of protest politics in Australia
postal ballot. There was almost no correlation with the LNP two-partypreferred vote share (Figure 5.3 on the following page).105 Electorateswith a high minor party vote were not much more likely to vote no in thesame sex-marriage survey, except in Queensland.106
Attitudes to other LGBTQI issues are a little linked to minor partyvoting, but not to other affiliations. The ABC’s Vote Compass askedrespondents whether they believe transgender awareness should betaught in schools. Support for this idea is higher in electorates that arein the inner-city, less religious, higher-educated, and with more peopleworking in services. Support was materially higher in electorateswith a high Greens vote, but there was not much difference betweenelectorates that favour the LNP or Labor. Electorates with a high minorparty vote were somewhat less likely to be supportive.107
Minor party voters do not express consistent views on social issues(Figure 5.2).108 Voters for the Nick Xenophon Team are more sociallyprogressive than voters for the Liberals and Nationals. The attitudesof voters for One Nation and other minor parties are similar to those ofvoters for the Liberals and Nationals.
Voters for some minor parties are more in favour of social policiesthat increase personal autonomy. Around 70 per cent of voters for theNick Xenophon Team approve of allowing broad access to abortion– a higher level of support than Liberal and National voters (53 percent and 63 per cent, respectively), and about the same as voters for
105. Bowe (2017).106. ABS (2018d).107. ABC News et al. (2016); ABS (2016); and AEC (2016a).108. The 2016 Scanlon Foundation survey reports that minor party voters were less
likely to support same-sex marriage compared to major party voters, becausethey found a lower level of opposition to changing the law among LNP voters thanreported in the AES. Markus (2017).
Figure 5.2: Minor party voters have similar views to major party voters
on social liberalism questions
Respondents who have a positive view on selected issues, by party voted forin the Senate, 2016, per cent
0
10
20
30
40
50
60
70
80
90
100
Same-sex marriage Abortion access Furthering equalopportunities for women
GreensLaborLiberalNationalNXTOne NationOther
Note: Estimates for same-sex marriage combine those who ‘Strongly favour’ or ‘Favour’
same sex couples being given the same rights to marry. Estimates on abortion are the
percentage who agree that ‘women should be able to obtain an abortion readily when
they want one’. Estimates for ‘furthering equal opportunities for women’ combine those
who believe equal rights ‘have not gone far enough’, or ‘not nearly far enough’. Error
bars provide 95 per cent confidence interval of the estimated mean. See Appendix A
for survey methodology.
Sources: Grattan analysis of AES (2016); see also Markus (2016, p. 36).
Grattan Institute 2018 52
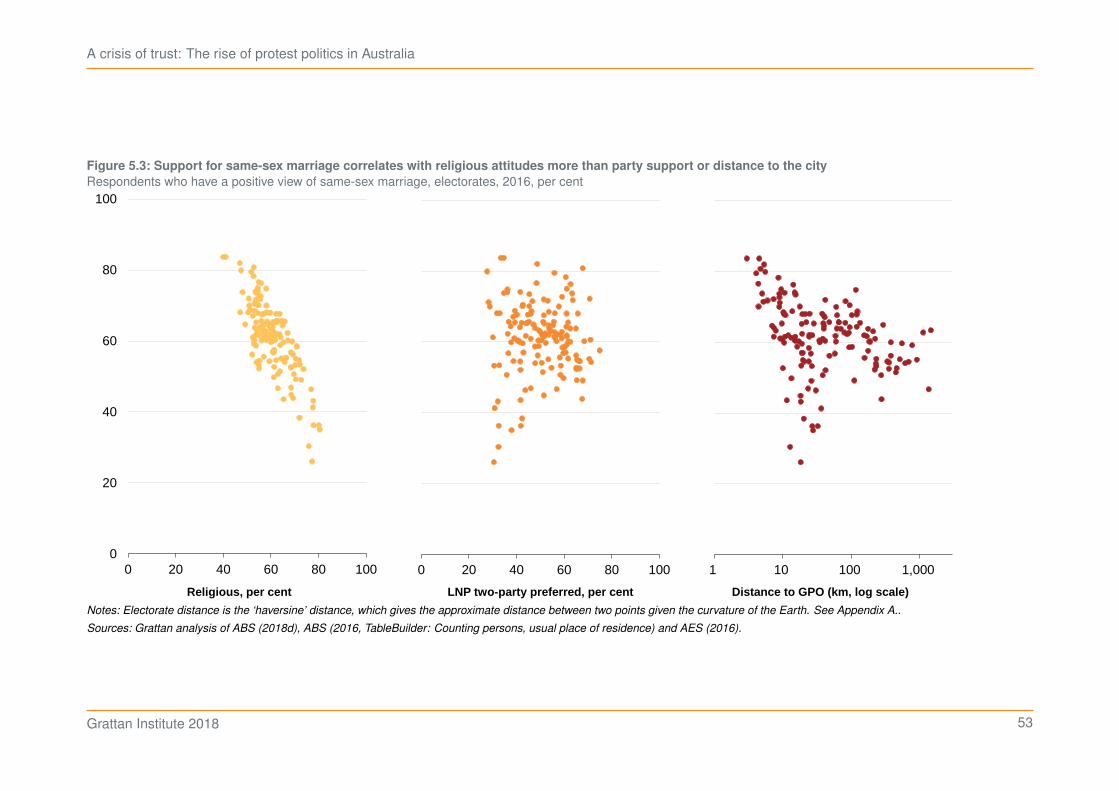
A crisis of trust: The rise of protest politics in Australia
Figure 5.3: Support for same-sex marriage correlates with religious attitudes more than party support or distance to the city
Respondents who have a positive view of same-sex marriage, electorates, 2016, per cent
0
20
40
60
80
100
0 20 40 60 80 1000
20
40
60
80
100
0 20 40 60 80 1000
20
40
60
80
100
1 10 100 1,000
Religious, per cent LNP two-party preferred, per cent Distance to GPO (km, log scale)
Notes: Electorate distance is the ‘haversine’ distance, which gives the approximate distance between two points given the curvature of the Earth. See Appendix A..
Sources: Grattan analysis of ABS (2018d), ABS (2016, TableBuilder: Counting persons, usual place of residence) and AES (2016).
Grattan Institute 2018 53
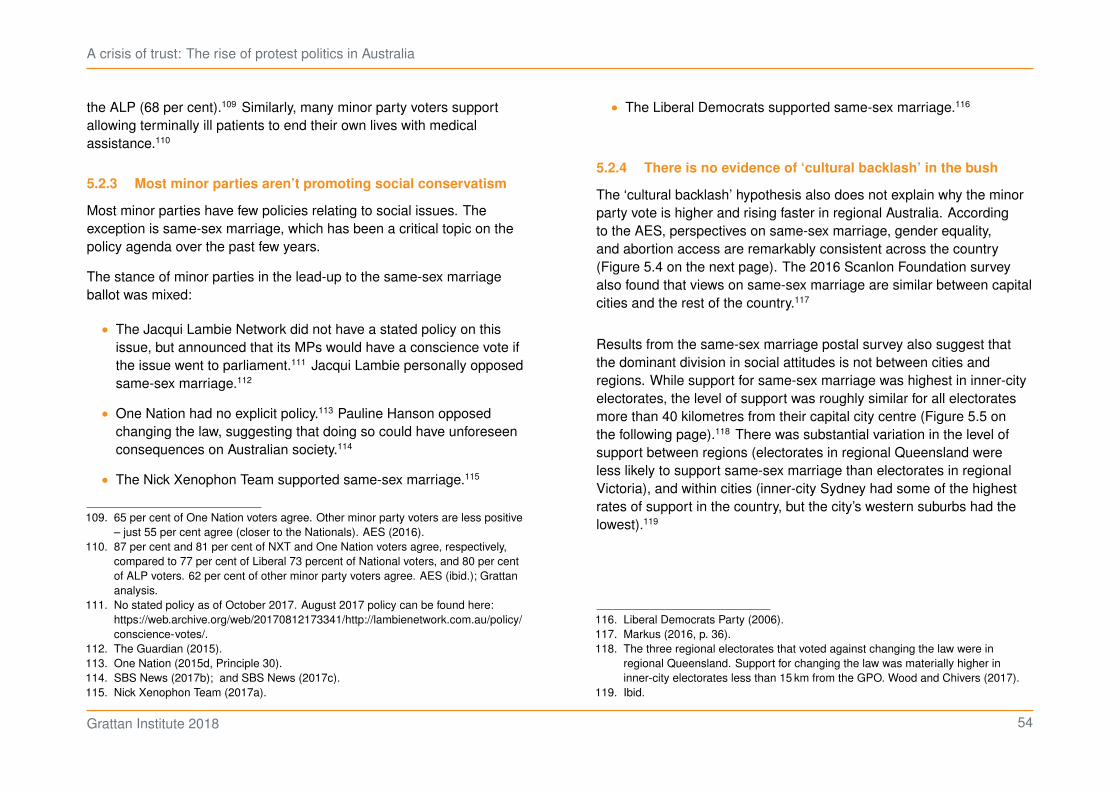
A crisis of trust: The rise of protest politics in Australia
the ALP (68 per cent).109 Similarly, many minor party voters supportallowing terminally ill patients to end their own lives with medicalassistance.110
5.2.3 Most minor parties aren’t promoting social conservatism
Most minor parties have few policies relating to social issues. Theexception is same-sex marriage, which has been a critical topic on thepolicy agenda over the past few years.
The stance of minor parties in the lead-up to the same-sex marriageballot was mixed:
• The Jacqui Lambie Network did not have a stated policy on thisissue, but announced that its MPs would have a conscience vote ifthe issue went to parliament.111 Jacqui Lambie personally opposedsame-sex marriage.112
• One Nation had no explicit policy.113 Pauline Hanson opposedchanging the law, suggesting that doing so could have unforeseenconsequences on Australian society.114
• The Nick Xenophon Team supported same-sex marriage.115
109. 65 per cent of One Nation voters agree. Other minor party voters are less positive– just 55 per cent agree (closer to the Nationals). AES (2016).
110. 87 per cent and 81 per cent of NXT and One Nation voters agree, respectively,compared to 77 per cent of Liberal 73 percent of National voters, and 80 per centof ALP voters. 62 per cent of other minor party voters agree. AES (ibid.); Grattananalysis.
111. No stated policy as of October 2017. August 2017 policy can be found here:https://web.archive.org/web/20170812173341/http://lambienetwork.com.au/policy/conscience-votes/.
112. The Guardian (2015).113. One Nation (2015d, Principle 30).114. SBS News (2017b); and SBS News (2017c).115. Nick Xenophon Team (2017a).
• The Liberal Democrats supported same-sex marriage.116
5.2.4 There is no evidence of ‘cultural backlash’ in the bush
The ‘cultural backlash’ hypothesis also does not explain why the minorparty vote is higher and rising faster in regional Australia. Accordingto the AES, perspectives on same-sex marriage, gender equality,and abortion access are remarkably consistent across the country(Figure 5.4 on the next page). The 2016 Scanlon Foundation surveyalso found that views on same-sex marriage are similar between capitalcities and the rest of the country.117
Results from the same-sex marriage postal survey also suggest thatthe dominant division in social attitudes is not between cities andregions. While support for same-sex marriage was highest in inner-cityelectorates, the level of support was roughly similar for all electoratesmore than 40 kilometres from their capital city centre (Figure 5.5 onthe following page).118 There was substantial variation in the level ofsupport between regions (electorates in regional Queensland wereless likely to support same-sex marriage than electorates in regionalVictoria), and within cities (inner-city Sydney had some of the highestrates of support in the country, but the city’s western suburbs had thelowest).119
116. Liberal Democrats Party (2006).117. Markus (2016, p. 36).118. The three regional electorates that voted against changing the law were in
regional Queensland. Support for changing the law was materially higher ininner-city electorates less than 15 km from the GPO. Wood and Chivers (2017).
119. Ibid.
Grattan Institute 2018 54
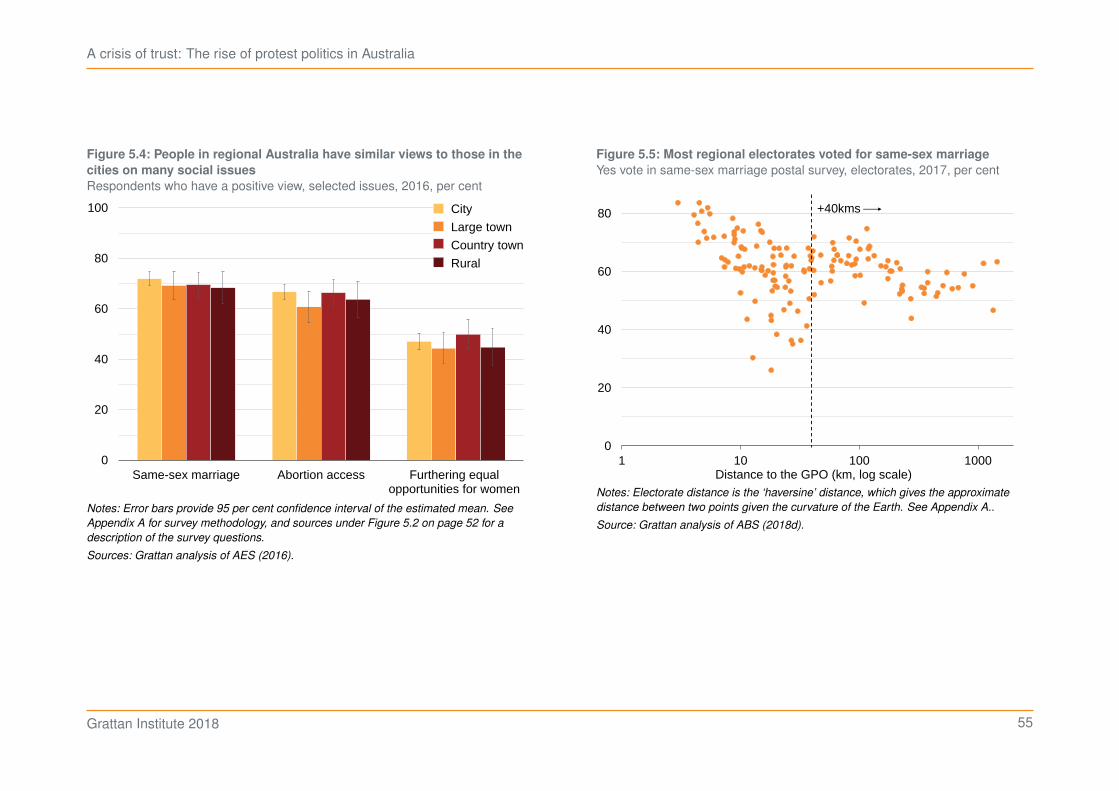
A crisis of trust: The rise of protest politics in Australia
Figure 5.4: People in regional Australia have similar views to those in the
cities on many social issues
Respondents who have a positive view, selected issues, 2016, per cent
0
20
40
60
80
100
Same-sex marriage Abortion access Furthering equalopportunities for women
City
Large town
Country town
Rural
Notes: Error bars provide 95 per cent confidence interval of the estimated mean. See
Appendix A for survey methodology, and sources under Figure 5.2 on page 52 for a
description of the survey questions.
Sources: Grattan analysis of AES (2016).
Figure 5.5: Most regional electorates voted for same-sex marriage
Yes vote in same-sex marriage postal survey, electorates, 2017, per cent
0
20
40
60
80
1 10 100 1000Distance to the GPO (km, log scale)
+40kms
Notes: Electorate distance is the ‘haversine’ distance, which gives the approximate
distance between two points given the curvature of the Earth. See Appendix A..
Source: Grattan analysis of ABS (2018d).
Grattan Institute 2018 55

A crisis of trust: The rise of protest politics in Australia
5.2.5 Summing up: ‘cultural backlash’ doesn’t explain the rise of
minor parties
Tolerance for diverse identities is increasing across Australia, andsurvey data gives no reason to believe that there is bubbling resent-ment about this change. Minor parties and their voters don’t seemto be particularly against expanding rights to women or LGBTQIcommunities. And most regional areas – where the minor party voteis highest – are on-board with socially progressive change. Thisexplanation for the high and rising minor party vote just doesn’t holdwater.
5.3 Minor party voters want to ‘take back control’
A more powerful explanation for the rise in the minor party vote is thatsome voters want to ‘take back control’ in a world where the directionand pace of change aren’t to their liking. The pervasive sentiment isthat ‘things aren’t what they used to be’. Minor party voters identifywith the norms, values, and ways of life of ‘traditional Australia’. Thesesentiments are more prevalent in regional Australia.
Some minor parties have been effective in tapping into these sen-timents, particularly concerns that immigration is a threat to theAustralian way of life and that regional Australia is being left behind.Similar cultural tensions have been important drivers of votes in manyother western countries (Box 8).
5.3.1 Minor parties appeal to people who feel left behind by
changes in Australian society
Australia’s national identity is changing. Our culture is more city-centricand globalised. Fewer people are working in agriculture and manufac-turing, and more people are finding jobs in services (Chapter 4). Morepeople are going on to higher education. And Australia’s immigration
Box 8: Voter psychology could explain why traditional
left-right divides have broken down
As is the case in other high income countries,a Australian politicsincreasingly operates on a different political axis to traditional left-right divides. Australian minor party voters are especially likely tosay they do not identify as ‘left’ or ‘right’ wing.b
Political theorists overseas have suggested that a second politicalaxis is forming between ‘nationalists’ and ‘globalists’.c Haidt callsthis divide ‘the central axis of [political] conflict within and acrossmany nations’. According to Haidt, nationalists become ‘mobilisedfor forceful action’ if they perceive external physical threats ordestabilising social change, especially when there is a threat toa group’s established political status.d There is a growing body ofwork looking at the influence of this sort of voter psychology in theTrump vote in the US, and the Brexit vote in the UK.e
a. Haidt (2016b); and Murday (2015).b. 63 per cent agree. Essential Research (2017c).c. Haidt (2016b). Other framings of this divide include: the divide between
‘somewheres’ and ‘anywheres’ (see Goodhart (2017)); the divide betweenauthoritarians and cosmopolitans (see Stenner (2009)); and the dividebetween liberals and conservatives (see Roberts (2015) and Hibbing et al.(2014)).
d. Haidt (2016a). See also Stenner (2009), who uses the term ‘authoritarian’to refer to a similar response.
e. Goodhart (2017), Krueger and Jaeger (2016), Haidt (2016a) and Haidt(2016b); see Hibbing et al. (2014), Roberts (2015) and Stenner (2009), forearlier work on this topic.
Grattan Institute 2018 56
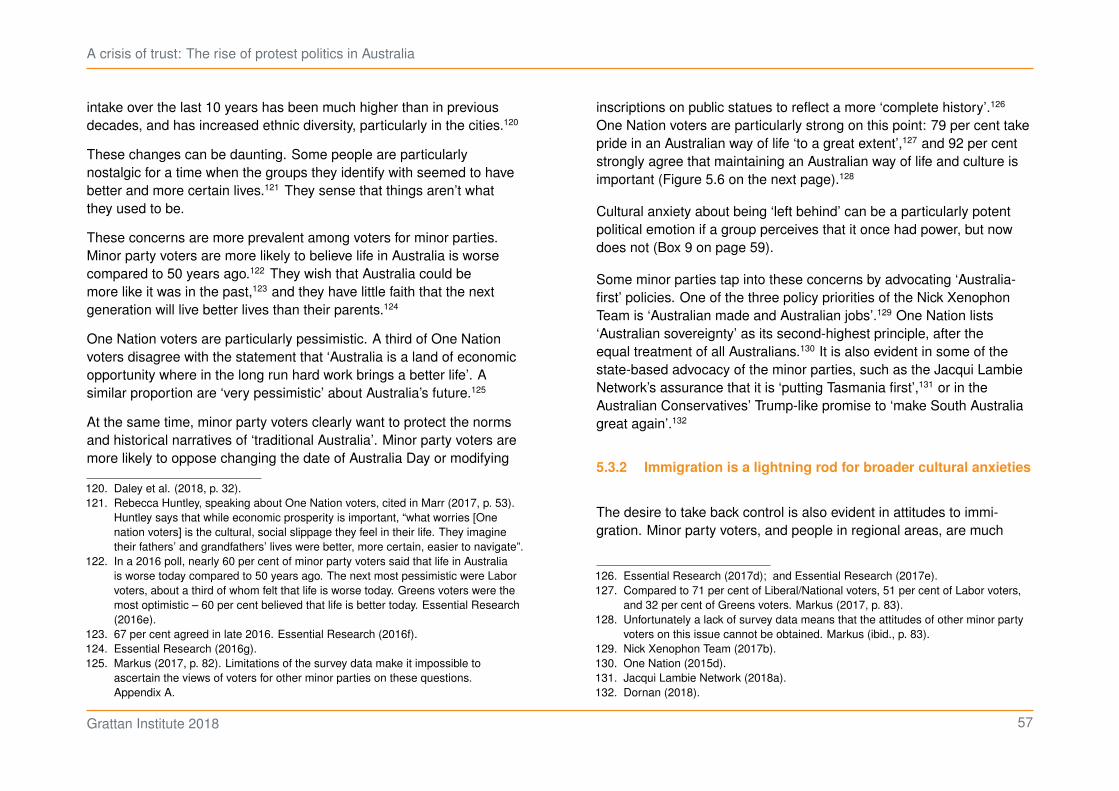
A crisis of trust: The rise of protest politics in Australia
intake over the last 10 years has been much higher than in previousdecades, and has increased ethnic diversity, particularly in the cities.120
These changes can be daunting. Some people are particularlynostalgic for a time when the groups they identify with seemed to havebetter and more certain lives.121 They sense that things aren’t whatthey used to be.
These concerns are more prevalent among voters for minor parties.Minor party voters are more likely to believe life in Australia is worsecompared to 50 years ago.122 They wish that Australia could bemore like it was in the past,123 and they have little faith that the nextgeneration will live better lives than their parents.124
One Nation voters are particularly pessimistic. A third of One Nationvoters disagree with the statement that ‘Australia is a land of economicopportunity where in the long run hard work brings a better life’. Asimilar proportion are ‘very pessimistic’ about Australia’s future.125
At the same time, minor party voters clearly want to protect the normsand historical narratives of ‘traditional Australia’. Minor party voters aremore likely to oppose changing the date of Australia Day or modifying
120. Daley et al. (2018, p. 32).121. Rebecca Huntley, speaking about One Nation voters, cited in Marr (2017, p. 53).
Huntley says that while economic prosperity is important, “what worries [Onenation voters] is the cultural, social slippage they feel in their life. They imaginetheir fathers’ and grandfathers’ lives were better, more certain, easier to navigate”.
122. In a 2016 poll, nearly 60 per cent of minor party voters said that life in Australiais worse today compared to 50 years ago. The next most pessimistic were Laborvoters, about a third of whom felt that life is worse today. Greens voters were themost optimistic – 60 per cent believed that life is better today. Essential Research(2016e).
123. 67 per cent agreed in late 2016. Essential Research (2016f).124. Essential Research (2016g).125. Markus (2017, p. 82). Limitations of the survey data make it impossible to
ascertain the views of voters for other minor parties on these questions.Appendix A.
inscriptions on public statues to reflect a more ‘complete history’.126
One Nation voters are particularly strong on this point: 79 per cent takepride in an Australian way of life ‘to a great extent’,127 and 92 per centstrongly agree that maintaining an Australian way of life and culture isimportant (Figure 5.6 on the next page).128
Cultural anxiety about being ‘left behind’ can be a particularly potentpolitical emotion if a group perceives that it once had power, but nowdoes not (Box 9 on page 59).
Some minor parties tap into these concerns by advocating ‘Australia-first’ policies. One of the three policy priorities of the Nick XenophonTeam is ‘Australian made and Australian jobs’.129 One Nation lists‘Australian sovereignty’ as its second-highest principle, after theequal treatment of all Australians.130 It is also evident in some of thestate-based advocacy of the minor parties, such as the Jacqui LambieNetwork’s assurance that it is ‘putting Tasmania first’,131 or in theAustralian Conservatives’ Trump-like promise to ‘make South Australiagreat again’.132
5.3.2 Immigration is a lightning rod for broader cultural anxieties
The desire to take back control is also evident in attitudes to immi-gration. Minor party voters, and people in regional areas, are much
126. Essential Research (2017d); and Essential Research (2017e).127. Compared to 71 per cent of Liberal/National voters, 51 per cent of Labor voters,
and 32 per cent of Greens voters. Markus (2017, p. 83).128. Unfortunately a lack of survey data means that the attitudes of other minor party
voters on this issue cannot be obtained. Markus (ibid., p. 83).129. Nick Xenophon Team (2017b).130. One Nation (2015d).131. Jacqui Lambie Network (2018a).132. Dornan (2018).
Grattan Institute 2018 57
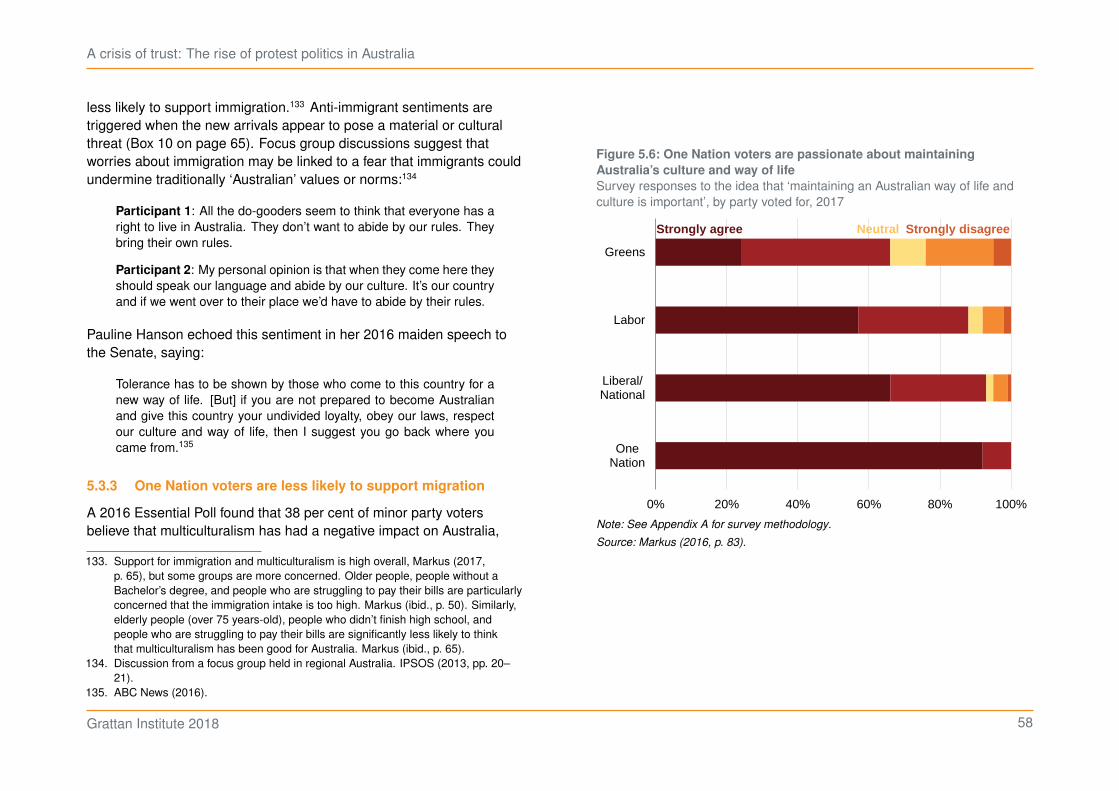
A crisis of trust: The rise of protest politics in Australia
less likely to support immigration.133 Anti-immigrant sentiments aretriggered when the new arrivals appear to pose a material or culturalthreat (Box 10 on page 65). Focus group discussions suggest thatworries about immigration may be linked to a fear that immigrants couldundermine traditionally ‘Australian’ values or norms:134
Participant 1: All the do-gooders seem to think that everyone has aright to live in Australia. They don’t want to abide by our rules. Theybring their own rules.
Participant 2: My personal opinion is that when they come here theyshould speak our language and abide by our culture. It’s our countryand if we went over to their place we’d have to abide by their rules.
Pauline Hanson echoed this sentiment in her 2016 maiden speech tothe Senate, saying:
Tolerance has to be shown by those who come to this country for anew way of life. [But] if you are not prepared to become Australianand give this country your undivided loyalty, obey our laws, respectour culture and way of life, then I suggest you go back where youcame from.135
5.3.3 One Nation voters are less likely to support migration
A 2016 Essential Poll found that 38 per cent of minor party votersbelieve that multiculturalism has had a negative impact on Australia,
133. Support for immigration and multiculturalism is high overall, Markus (2017,p. 65), but some groups are more concerned. Older people, people without aBachelor’s degree, and people who are struggling to pay their bills are particularlyconcerned that the immigration intake is too high. Markus (ibid., p. 50). Similarly,elderly people (over 75 years-old), people who didn’t finish high school, andpeople who are struggling to pay their bills are significantly less likely to thinkthat multiculturalism has been good for Australia. Markus (ibid., p. 65).
134. Discussion from a focus group held in regional Australia. IPSOS (2013, pp. 20–21).
135. ABC News (2016).
Figure 5.6: One Nation voters are passionate about maintaining
Australia’s culture and way of life
Survey responses to the idea that ‘maintaining an Australian way of life andculture is important’, by party voted for, 2017
0% 20% 40% 60% 80% 100%
Greens
Labor
Liberal/National
OneNation
Strongly agree Strongly disagreeNeutral
Note: See Appendix A for survey methodology.
Source: Markus (2016, p. 83).
Grattan Institute 2018 58
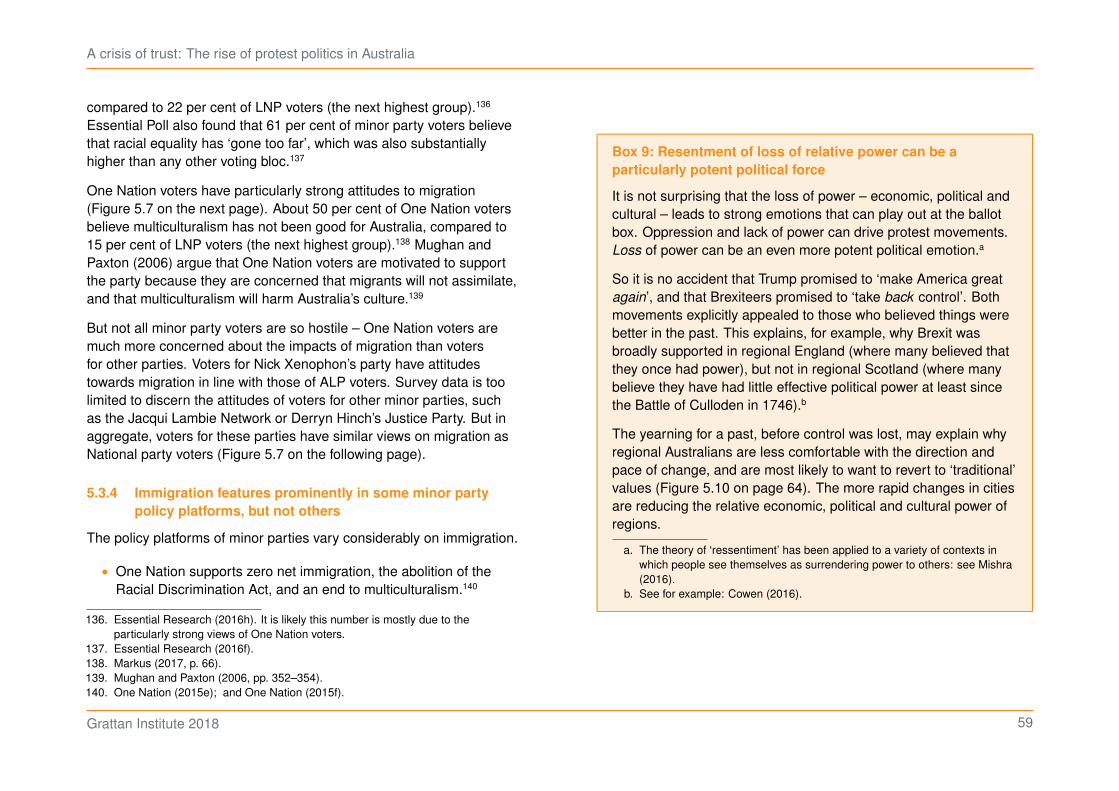
A crisis of trust: The rise of protest politics in Australia
compared to 22 per cent of LNP voters (the next highest group).136
Essential Poll also found that 61 per cent of minor party voters believethat racial equality has ‘gone too far’, which was also substantiallyhigher than any other voting bloc.137
One Nation voters have particularly strong attitudes to migration(Figure 5.7 on the next page). About 50 per cent of One Nation votersbelieve multiculturalism has not been good for Australia, compared to15 per cent of LNP voters (the next highest group).138 Mughan andPaxton (2006) argue that One Nation voters are motivated to supportthe party because they are concerned that migrants will not assimilate,and that multiculturalism will harm Australia’s culture.139
But not all minor party voters are so hostile – One Nation voters aremuch more concerned about the impacts of migration than votersfor other parties. Voters for Nick Xenophon’s party have attitudestowards migration in line with those of ALP voters. Survey data is toolimited to discern the attitudes of voters for other minor parties, suchas the Jacqui Lambie Network or Derryn Hinch’s Justice Party. But inaggregate, voters for these parties have similar views on migration asNational party voters (Figure 5.7 on the following page).
5.3.4 Immigration features prominently in some minor party
policy platforms, but not others
The policy platforms of minor parties vary considerably on immigration.
• One Nation supports zero net immigration, the abolition of theRacial Discrimination Act, and an end to multiculturalism.140
136. Essential Research (2016h). It is likely this number is mostly due to theparticularly strong views of One Nation voters.
137. Essential Research (2016f).138. Markus (2017, p. 66).139. Mughan and Paxton (2006, pp. 352–354).140. One Nation (2015e); and One Nation (2015f).
Box 9: Resentment of loss of relative power can be a
particularly potent political force
It is not surprising that the loss of power – economic, political andcultural – leads to strong emotions that can play out at the ballotbox. Oppression and lack of power can drive protest movements.Loss of power can be an even more potent political emotion.a
So it is no accident that Trump promised to ‘make America greatagain’, and that Brexiteers promised to ‘take back control’. Bothmovements explicitly appealed to those who believed things werebetter in the past. This explains, for example, why Brexit wasbroadly supported in regional England (where many believed thatthey once had power), but not in regional Scotland (where manybelieve they have had little effective political power at least sincethe Battle of Culloden in 1746).b
The yearning for a past, before control was lost, may explain whyregional Australians are less comfortable with the direction andpace of change, and are most likely to want to revert to ‘traditional’values (Figure 5.10 on page 64). The more rapid changes in citiesare reducing the relative economic, political and cultural power ofregions.
a. The theory of ‘ressentiment’ has been applied to a variety of contexts inwhich people see themselves as surrendering power to others: see Mishra(2016).
b. See for example: Cowen (2016).
Grattan Institute 2018 59
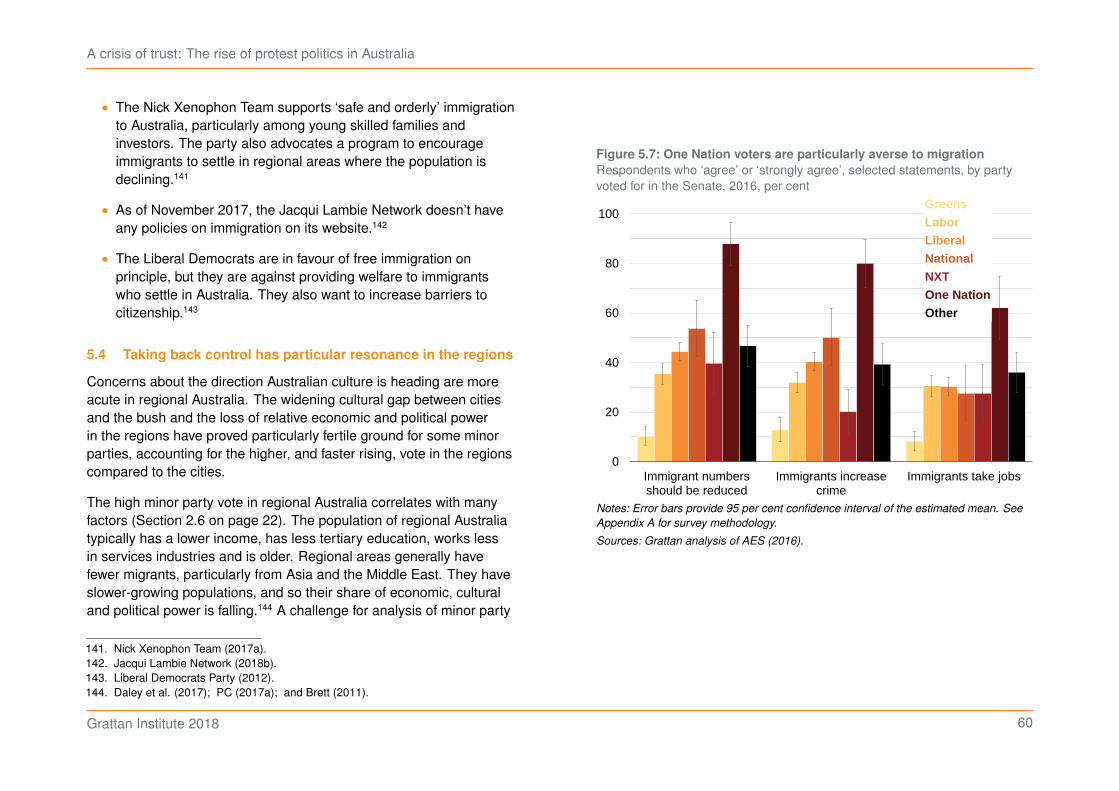
A crisis of trust: The rise of protest politics in Australia
• The Nick Xenophon Team supports ‘safe and orderly’ immigrationto Australia, particularly among young skilled families andinvestors. The party also advocates a program to encourageimmigrants to settle in regional areas where the population isdeclining.141
• As of November 2017, the Jacqui Lambie Network doesn’t haveany policies on immigration on its website.142
• The Liberal Democrats are in favour of free immigration onprinciple, but they are against providing welfare to immigrantswho settle in Australia. They also want to increase barriers tocitizenship.143
5.4 Taking back control has particular resonance in the regions
Concerns about the direction Australian culture is heading are moreacute in regional Australia. The widening cultural gap between citiesand the bush and the loss of relative economic and political powerin the regions have proved particularly fertile ground for some minorparties, accounting for the higher, and faster rising, vote in the regionscompared to the cities.
The high minor party vote in regional Australia correlates with manyfactors (Section 2.6 on page 22). The population of regional Australiatypically has a lower income, has less tertiary education, works lessin services industries and is older. Regional areas generally havefewer migrants, particularly from Asia and the Middle East. They haveslower-growing populations, and so their share of economic, culturaland political power is falling.144 A challenge for analysis of minor party
141. Nick Xenophon Team (2017a).142. Jacqui Lambie Network (2018b).143. Liberal Democrats Party (2012).144. Daley et al. (2017); PC (2017a); and Brett (2011).
Figure 5.7: One Nation voters are particularly averse to migration
Respondents who ‘agree’ or ‘strongly agree’, selected statements, by partyvoted for in the Senate, 2016, per cent
0
20
40
60
80
100
Immigrant numbersshould be reduced
Immigrants increasecrime
Immigrants take jobs
GreensLaborLiberalNationalNXTOne NationOther
Notes: Error bars provide 95 per cent confidence interval of the estimated mean. See
Appendix A for survey methodology.
Sources: Grattan analysis of AES (2016).
Grattan Institute 2018 60
A crisis of trust: The rise of protest politics in Australia
voting is to identify which of these features might be driving votingbehaviour.
5.4.1 The cultural gulf is widening between cities and regions
Australia’s regions and cities are becoming more culturally distinct.
The shift in employment patterns towards services jobs has led tothe major cities drawing younger and more-educated people from theregions, as well as the majority of new migrants (Chapter 4).These pat-terns of population settlement are almost impossible for governments toreverse.145 The effect is harrowing for the people who remain in areasof decline. Many small country towns seem ‘[drained] of purpose’, withboarded-up shops, closed football clubs and shut down post officesproviding a ghostly reminder of ‘grander days’ gone by.146
Cities have also become increasingly ethnically diverse.147 Newmigrants are much more likely to settle in Australia’s cities (Figure 5.8on the next page). In many city areas, more than 15 per cent of thepopulation was born in Asia and more than 4 per cent in the MiddleEast and Africa. But in regional areas, less than 5 per cent of the
145. Because these patterns emerge from structural changes in the economy and theassociated change in business activity and the availability of jobs (Section 4.2.1on page 41), it would be very expensive for governments to substantially changethese patterns (Chapter 7).
146. Brett (2011, p. 21), PC (2017a, pp. 20-1) and RAI (2016). The ProductivityCommission suggests that the loss of population could be especially problematicfor small towns, because the people who leave were often pivotal figures inthe community, for example leading sporting clubs or volunteer organisations(PC (2017a, p. 113)). Younger people are also more likely to leave regionalAustralia and move to the city (PC (ibid., p. 120)), which could contribute to thecomparatively older populations in regional Australia (Daley et al. (2017)).
147. 83 per cent of Australians born overseas live in Australia’s cities, compared to 61per cent of people born in Australia. Markus (2017, p. 1).
population was born in Asia (Figure 5.9 on page 63) and less than 1per cent in the Middle East and Africa.148
Cultural power follows population. As the cities steam ahead, theninevitably films, television, and literature become less about The Man
from Snowy River and more about The Boat. And the increasing cul-tural diversity of cities has led some to claim that Australia’s distinctive-ness lies in ‘its ethnically mixed and culturally sophisticated capitals’.149
This cosmopolitan identity is hard to reconcile with the image of a ‘trueblue’ Aussie farmer – instead it celebrates an Australian way of life thatis primarily found in the cities.150
5.4.2 Regional Australians are more concerned about these
cultural changes
People in regional Australia are less likely than those in the cities toembrace these cultural shifts. People in the regions are more likelyto report feeling that ‘everything is changing too fast’, and ‘there istoo little emphasis on traditional values’ in Australia (Figure 5.10 onpage 64).
Anti-immigrant views are also more prevalent in regional Australia.More than 40 per cent of people in regional Australia think that thenumber of immigrants allowed into the country should be reduced,compared to just over 30 per cent of people in the city.151 The gapin attitudes isn’t getting wider,152 but negative attitudes may be moresalient when the media or politicians focus on these issues.153
148. Daley et al. (2017).149. Brett (2011, p. 39).150. Ibid. (p. 40).151. See also Markus (2017, p. 50).152. Grattan analysis of AES (2004), AES (2007), AES (2010), AES (2013) and AES
(2016).153. Dowding and Martin (2017) find that immigration issues dominated the media
agenda in 2010, when immigration concerns were highest. The federal (Labor)
Grattan Institute 2018 61
A crisis of trust: The rise of protest politics in Australia
Regional Australians are much more likely to believe that migrantsincrease crime and take jobs (Figure 5.11 on page 64). And they areless open to embracing different customs: 44 per cent of people inremote areas agree that we should do more to learn about the cultureand customs of different ethnic groups in the country, compared to 65per cent of city Australians.154
Concerns about immigration are higher in the regions even thoughthere are far fewer migrants there, especially from Asia, the Middle-Eastand Africa.155 Presumably, the lack of contact increases anxiety aboutpeople with unfamiliar cultural backgrounds (Box 10 on page 65).
5.4.3 People in regional areas feel ignored by politicians in
Canberra
Exacerbating this cultural anxiety in regional Australia is the sense thatchanges put city agendas even more at forefront of politics. Aroundthree-quarters of people in regional Australia feel ignored by politiciansand policy makers.156
Given the weight of electoral representation, it is not surprising thatgovernments have made high-profile decisions adverse to regionalinterests on totemic policy issues that particularly affect regionalAustralia.157 Many in the regions resent the rapidly-imposed ban on live
opposition increased its focus on immigration issues in 2005 and 2006,and concerns about immigrant numbers also rose. Legislative attention onimmigration did not change much over the period.
154. 52 per cent of people in outer or inner regional Australia agree. Data provided byA. Markus, from Scanlon Foundation Surveys 2017.
155. Daley et al. (2017).156. Grattan analysis of Sheppard (2017), Fairfax Political Personas Project. 51 per
cent of people in the city agree.157. The growing reluctance to provide special assistance for regional areas (Brett
(2011)) may be linked to the decline of ‘countrymindedness’ in Australian politics.Countrymindedness, first described by Aitkin in 1985, is the idea that regionalcommunities ought to be supported by governments because agriculture provides
Figure 5.8: Most immigrants settle in the cities
Population by country born and remoteness area, millions people
0
2
4
6
8
10
12
Major Cities of AustraliaInner Regional AustraliaOuter Regional AustraliaRemote AustraliaVery Remote Australia
Born overseasBorn in Australia
Very remote
Remote Outer regional
Inner regional
Major city
Change in 2016
2011
Note: As 2016 Remoteness Areas have not been released for the latest census,
immigration data has been converted from 2016 SA2s to 2011 Remoteness Area
Levels using correspondences provided by the ABS.
Sources: Grattan analysis of ABS (2017e).
Grattan Institute 2018 62
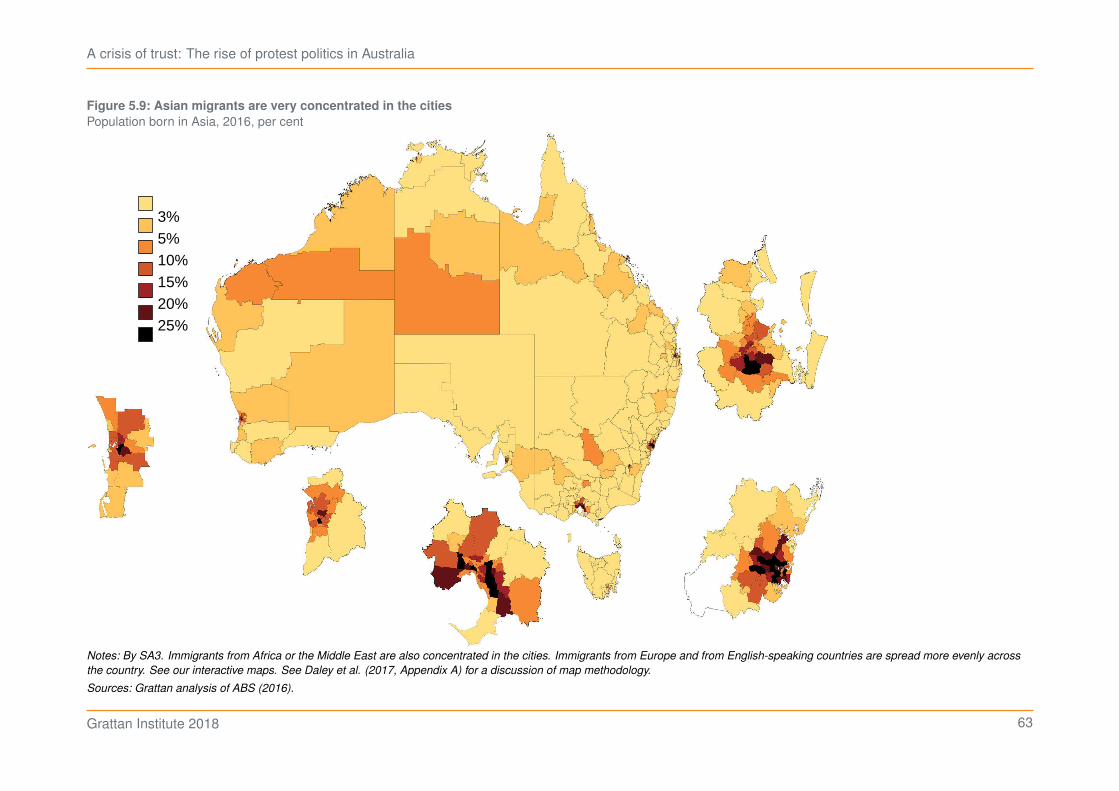
A crisis of trust: The rise of protest politics in Australia
Figure 5.9: Asian migrants are very concentrated in the cities
Population born in Asia, 2016, per cent
3%5%10%15%20%25%
Notes: By SA3. Immigrants from Africa or the Middle East are also concentrated in the cities. Immigrants from Europe and from English-speaking countries are spread more evenly across
the country. See our interactive maps. See Daley et al. (2017, Appendix A) for a discussion of map methodology.
Sources: Grattan analysis of ABS (2016).
Grattan Institute 2018 63
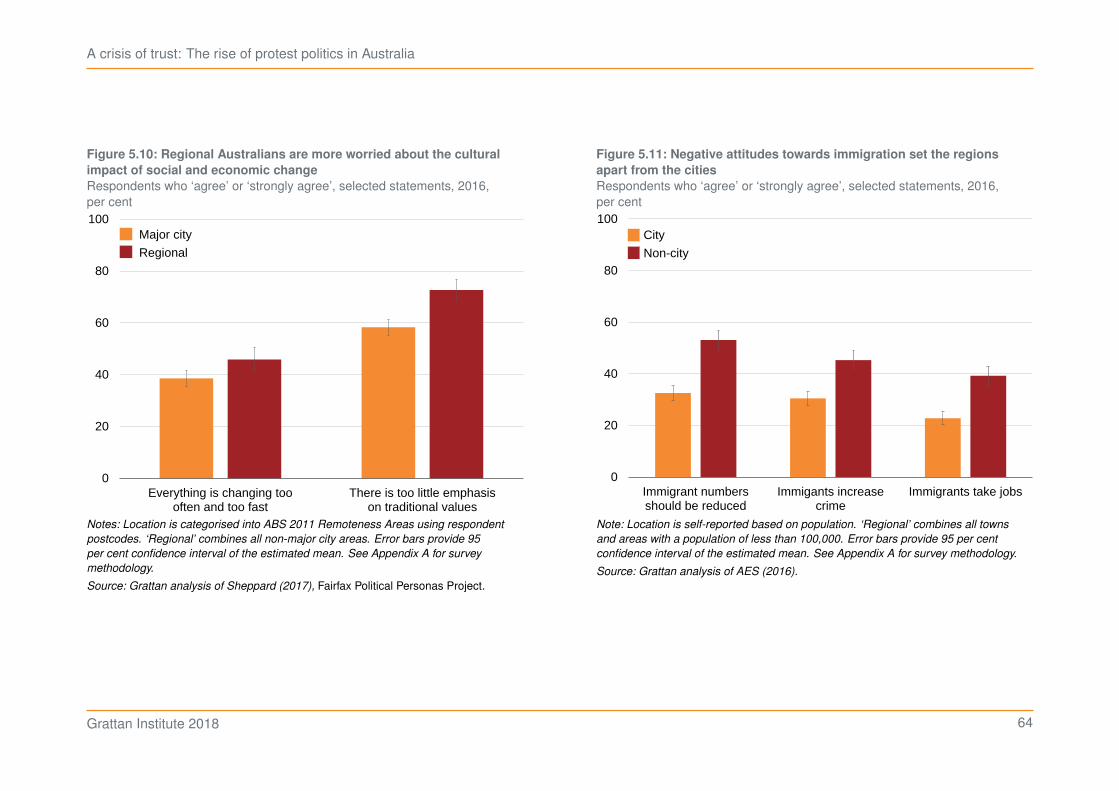
A crisis of trust: The rise of protest politics in Australia
Figure 5.10: Regional Australians are more worried about the cultural
impact of social and economic change
Respondents who ‘agree’ or ‘strongly agree’, selected statements, 2016,per cent
0
20
40
60
80
100
Everything is changing toooften and too fast
There is too little emphasison traditional values
Major city
Regional
Notes: Location is categorised into ABS 2011 Remoteness Areas using respondent
postcodes. ‘Regional’ combines all non-major city areas. Error bars provide 95
per cent confidence interval of the estimated mean. See Appendix A for survey
methodology.
Source: Grattan analysis of Sheppard (2017), Fairfax Political Personas Project.
Figure 5.11: Negative attitudes towards immigration set the regions
apart from the cities
Respondents who ‘agree’ or ‘strongly agree’, selected statements, 2016,per cent
0
20
40
60
80
100
Immigrants take jobsImmigants increasecrime
Immigrant numbersshould be reduced
City
Non-city
Note: Location is self-reported based on population. ‘Regional’ combines all towns
and areas with a population of less than 100,000. Error bars provide 95 per cent
confidence interval of the estimated mean. See Appendix A for survey methodology.
Source: Grattan analysis of AES (2016).
Grattan Institute 2018 64
A crisis of trust: The rise of protest politics in Australia
meat exports to Indonesia, and the allocation of water rights. As onefocus group respondent put it:
Although we live in a city, we’re still in a very rural environmentand yet that ruralness is slowly being taken away, slowly but surelynow. They’re destroying the dairy industry. They’re destroying thebeef industry. We’re not going to be able to buy [Australian] beef. . .because we don’t kill them the right way.158
There is a growing sense that things are changing for people in thecountry, and that city-dwellers don’t understand the impact of thechanges happening in their own backyard.
5.4.4 Some minor parties promise to restore political and
cultural power to the regions
Regional Australians who feel left-behind or ignored by cosmopolitanelites in the cities have been attracted to minor parties.
Katter’s Australian Party focuses heavily on regional issues. In an inter-view with Leigh Sales after the 2010 election (at the time, Julia Gillardwas negotiating with Independents to form a minority government) itsleader Bob Katter noted:
. . . the position of rural Australia will be taken into consideration,which has not been the case over the last 12 years under the LNPand over the last three years under the ALP and the ALP previousto that. We were just not taken into consideration at all. The partysystem has served the big city interests, the big corporate interests,
the basis of society and economy, and because the cities prosper on the basisof regional production. It is widely accepted among political scientists thatcountrymindedness is in decline as a result of urbanisation and the relativedecline in importance of the agricultural industry: Aitkin (2005), Cockfield (2009),Duncan and Epps (1992) and Wear (2009), cited in Botterill and Cockfield (2015).
158. IPSOS (2013, p. 55).
Box 10: What causes anxiety about immigration?
A heightened sense of threat, particularly when combined with alack of contact, contribute to anti-immigrant sentiments, especiallyin regional Australia.
A sense of threat may be higher among those who perceive thatthey are competing with immigrants over finite resources, suchas jobs, welfare benefits, or political power. It may also developif immigrant groups become more visible, or if immigrant groupsappear to not be following existing cultural norms.a
The sense of threat can be as important than the actual level ofthreat. For example, concerns about migrants typically go upwhen unemployment rises, rather than when migration levelsactually rise.b Yet the best evidence is that immigration has littleimpact on unemployment.c
This sense of threat tends to be lower when people regularlycome into contact with migrant groups. Contact between differentpeople often increases empathy and understanding betweenthem, and blends two separate groups – ‘us’ and ‘them’ – intoone inclusive group: ‘we’.d Of course, meaningful contact is itselfless likely when there is a pre-existing sense of threat betweengroups.e
a. Eger and Bohman (2016, pp. 878–9, 881); Mughan and Paxton (2006);and Sniderman et al. (2004).
b. PC (2016, p. 258).c. One recent study found that migration has had no material impact on
unemployment in regional Australia (PC (2017a, pp. 194–197)). Breuniget al. (2017), find that immigration has not had a material impact on thewages and employment of incumbent workers.
d. Bastian (2012, p. 66); and Pettigrew and Tropp (2008).e. Eger and Bohman (2016). See also: Bastian (2012), Biggs and Knauss
(2012), Forrest and Dunn (2006) and Pettigrew and Tropp (2006).
Grattan Institute 2018 65
A crisis of trust: The rise of protest politics in Australia
but it has not served the interests of ordinary people, 30 per cent ofus, which live outside of the major capital cities.159
After the 2010 election, regional Australians saw the political power thatIndependents and minor parties can bring. A high vote for minor partiescan help a regional electorate get the attention of the government of theday – especially when the seat becomes marginal.160
Regional Independents such as Cathy McGowan, Tony Windsor, RobOakeshott and Andrew Wilkie have been successful in extractingcommitments targeted at their electorates.161
Similarly, in the Queensland state election last year One Nation pushedfor the Brisbane-based Cross River Rail project to be dumped in favourof building a coal-fired power station in North Queensland and investingin farming and agriculture projects.162
In consultations with Grattan Institute staff (Box 11 on the followingpage), a number of voters in regional Australia volunteered that theywere attracted to minor candidates for this reason. Voters in Milduraand Whyalla felt overlooked because they were in a safe Nationalsseat, and they looked wistfully towards the benefits that seemed toaccrue to swing regional seats.
But it is important to note that the regional effect is stronger for someminor parties than others. Big-name minor parties – such as OneNation and the Nick Xenophon Team – gain higher support in thecountry than the city. However, very small minor parties and the Liberal
159. Brett (2011, p. 4).160. Prosser and Denniss (2015).161. To win over the Independents and form minority government, Julia Gillard
promised to: fund a $9.9 billion package to support regional areas; implementpoker machine reform (a particular concern for Andrew Wilkie); and implement apackage of parliamentary reforms. Liddy (2010).
162. Walker (2017); and Dickson (2017).
Democrats tend to gain a consistent vote share in the cities and theregions.163
As noted in Chapter 2, this may reflect that minor party voters can haveone of two very different motivations. Some are driven by falling trust ingovernment; others (particularly those in regions) are concerned about‘their’ group losing political, economic and cultural power relative to acosmopolitan culture that increasingly dominates cities.
5.5 Summing up: Voters who feel left-behind support minor
parties in an effort to ‘take back control’
Australia’s national identity is changing. As the country becomes morecity-centric, cosmopolitan, and ethnically diverse, our collective ideas ofwhat makes Australia unique have shifted.
Australia’s changing ethnic make-up is a big part of this. As noted byhistorian Judith Brett, ‘as the cities were socially and culturally trans-formed by migration, their residents started to argue that Australia’sdistinctiveness lay not in its resourceful, friendly country folk but in itsethnically mixed and culturally sophisticated capitals’.164 Prime MinisterMalcolm Turnbull often defines Australia as ‘the world’s most successfulmulticultural nation’.165
But regional communities, older people, and the less educated feel theyhave borne the brunt of the broad social changes wrought by economicrationalism and globalisation. For many, these changes have created afeeling of being left-behind as the rest of the nation prospers.166
163. The distinction between minor parties is most obvious in Queensland, where thevote for One Nation is strongly regional, whereas in aggregate the vote for otherminor parties is pretty consistent across the state (Figure 2.5 on page 17).
164. Brett (2011, p. 39).165. Malcolm Turnbull used a version of this phrase six times in a recent appearance
on the ABC. Q&A (2017).166. PC (2017a).
Grattan Institute 2018 66
A crisis of trust: The rise of protest politics in Australia
The major parties – including the Nationals – have struggled to respondto this sentiment. And so minor parties have filled this vacuum. Withoutthe constraints of office, they have more scope to make big promisesabout restoring the Australia of old, and bringing prosperity and dignityto the regions. One Nation explicitly appeals to related concerns aboutimmigration.
It seems likely this strategy has contributed to the rise in the minorparty vote overall and particularly the increase in the vote in the regionsrelative to the cities (Table 5.1 on the following page).
Box 11: People in the regions feel left out of policy making
Community groups in Emerald, Mildura and Whyalla consistentlytold Grattan Institute that they feel shut out of policy making, asthe big decisions that affect them are made far away in the cities.Many believed that policy choices were made without respect forthe ‘history, social context, and future’ of regional communities.
Groups in Emerald suggested that people in Canberra don’t un-derstand the unique context of regional Australia. As a result, theflow-on effects of policy change often aren’t properly considered.“People in regional Australia aren’t taken on the journey [of policymaking],” one person said. Examples included: bans on live cattleexports, the ‘streamlining’ of regional health services, and poordesign of community grants schemes.
In Mildura, the Murray-Darling Basin Plan was an especiallyprominent example of perceived ‘top-down’ political decision-making. Many locals believed that the community wasn’t ade-quately consulted on this issue of deep importance to them.
Groups in Whyalla were slightly more positive. Many felt they hadgood access to state and federal politicians. But some urgedpoliticians to ‘walk the walk’, rather than simply ‘talking the talk’.As one person joked – “Don’t put your Akubra on and think you’reone of us”.
A concern that regional Australia is left out of politics was moreconsistent throughout Grattan Institute’s consultations thanconcern about immigration, worries about the expansion of socialliberalism, or anxiety about the economy.
Grattan Institute 2018 67
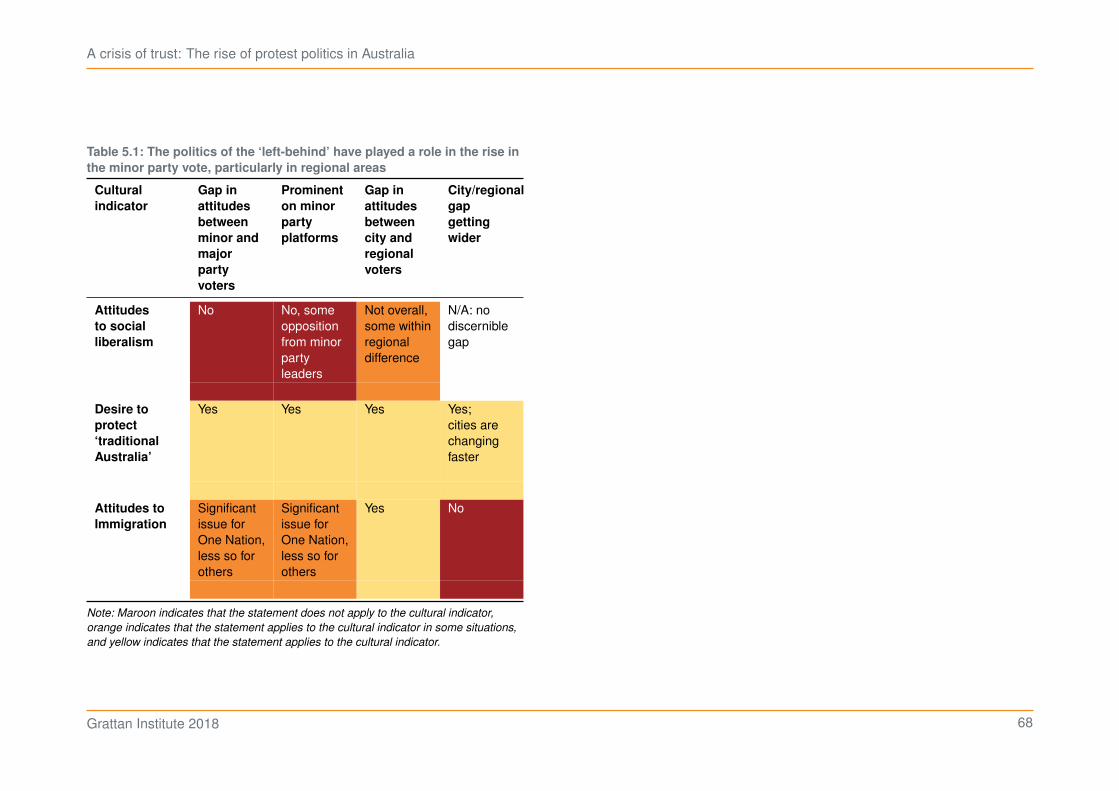
A crisis of trust: The rise of protest politics in Australia
Table 5.1: The politics of the ‘left-behind’ have played a role in the rise in
the minor party vote, particularly in regional areas
Cultural
indicator
Gap in
attitudes
between
minor and
major
party
voters
Prominent
on minor
party
platforms
Gap in
attitudes
between
city and
regional
voters
City/regional
gap
getting
wider
Attitudes
to social
liberalism
No No, someoppositionfrom minorpartyleaders
Not overall,some withinregionaldifference
N/A: nodiscerniblegap
Desire to
protect
‘traditional
Australia’
Yes Yes Yes Yes;cities arechangingfaster
Attitudes to
Immigration
Significantissue forOne Nation,less so forothers
Significantissue forOne Nation,less so forothers
Yes No
Note: Maroon indicates that the statement does not apply to the cultural indicator,
orange indicates that the statement applies to the cultural indicator in some situations,
and yellow indicates that the statement applies to the cultural indicator.
Grattan Institute 2018 68
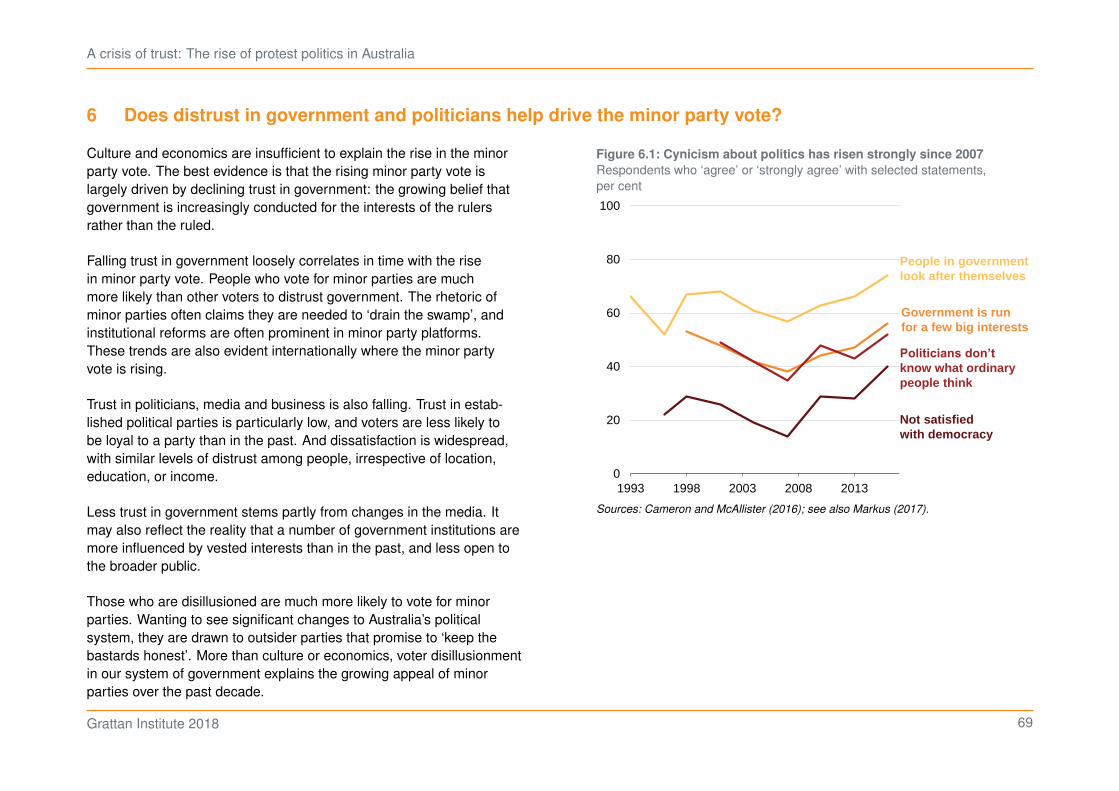
A crisis of trust: The rise of protest politics in Australia
6 Does distrust in government and politicians help drive the minor party vote?
Culture and economics are insufficient to explain the rise in the minorparty vote. The best evidence is that the rising minor party vote islargely driven by declining trust in government: the growing belief thatgovernment is increasingly conducted for the interests of the rulersrather than the ruled.
Falling trust in government loosely correlates in time with the risein minor party vote. People who vote for minor parties are muchmore likely than other voters to distrust government. The rhetoric ofminor parties often claims they are needed to ‘drain the swamp’, andinstitutional reforms are often prominent in minor party platforms.These trends are also evident internationally where the minor partyvote is rising.
Trust in politicians, media and business is also falling. Trust in estab-lished political parties is particularly low, and voters are less likely tobe loyal to a party than in the past. And dissatisfaction is widespread,with similar levels of distrust among people, irrespective of location,education, or income.
Less trust in government stems partly from changes in the media. Itmay also reflect the reality that a number of government institutions aremore influenced by vested interests than in the past, and less open tothe broader public.
Those who are disillusioned are much more likely to vote for minorparties. Wanting to see significant changes to Australia’s politicalsystem, they are drawn to outsider parties that promise to ‘keep thebastards honest’. More than culture or economics, voter disillusionmentin our system of government explains the growing appeal of minorparties over the past decade.
Figure 6.1: Cynicism about politics has risen strongly since 2007
Respondents who ‘agree’ or ‘strongly agree’ with selected statements,per cent
0
20
40
60
80
100
1993 1998 2003 2008 2013
Not satisfiedwith democracy
People in government look after themselves
Government is run for a few big interests
Politicians don’t know what ordinary people think
Sources: Cameron and McAllister (2016); see also Markus (2017).
Grattan Institute 2018 69
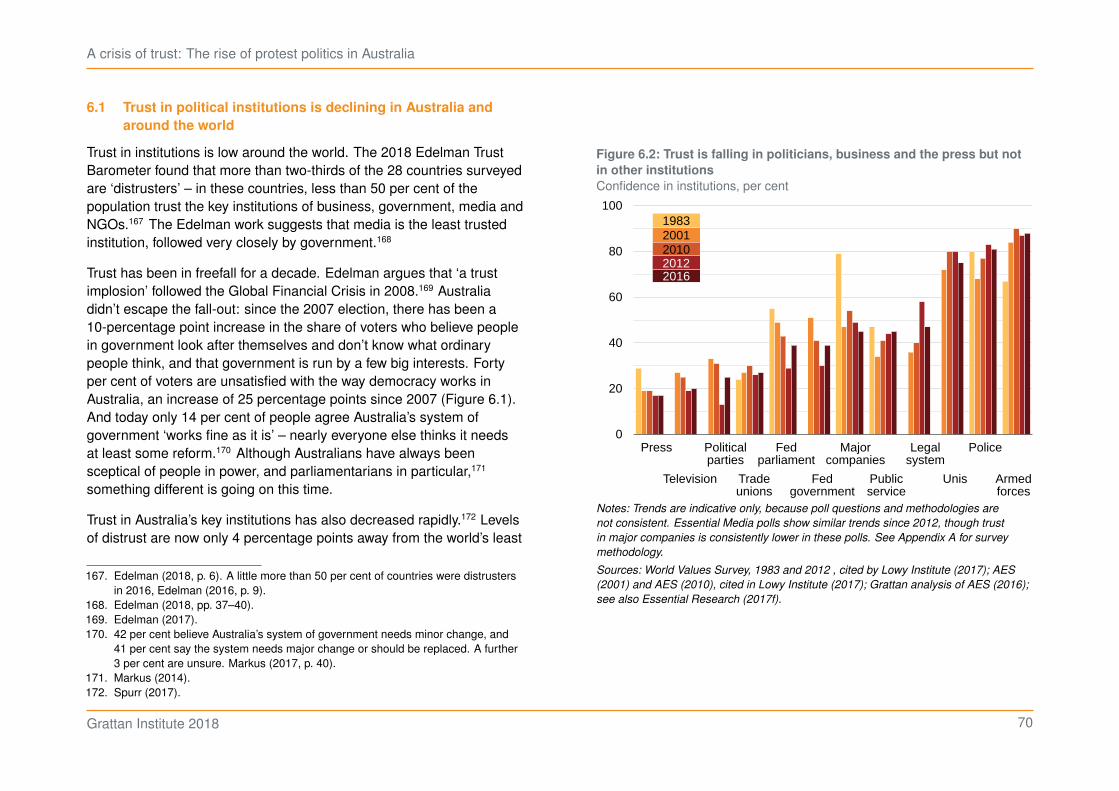
A crisis of trust: The rise of protest politics in Australia
6.1 Trust in political institutions is declining in Australia and
around the world
Trust in institutions is low around the world. The 2018 Edelman TrustBarometer found that more than two-thirds of the 28 countries surveyedare ‘distrusters’ – in these countries, less than 50 per cent of thepopulation trust the key institutions of business, government, media andNGOs.167 The Edelman work suggests that media is the least trustedinstitution, followed very closely by government.168
Trust has been in freefall for a decade. Edelman argues that ‘a trustimplosion’ followed the Global Financial Crisis in 2008.169 Australiadidn’t escape the fall-out: since the 2007 election, there has been a10-percentage point increase in the share of voters who believe peoplein government look after themselves and don’t know what ordinarypeople think, and that government is run by a few big interests. Fortyper cent of voters are unsatisfied with the way democracy works inAustralia, an increase of 25 percentage points since 2007 (Figure 6.1).And today only 14 per cent of people agree Australia’s system ofgovernment ‘works fine as it is’ – nearly everyone else thinks it needsat least some reform.170 Although Australians have always beensceptical of people in power, and parliamentarians in particular,171
something different is going on this time.
Trust in Australia’s key institutions has also decreased rapidly.172 Levelsof distrust are now only 4 percentage points away from the world’s least
167. Edelman (2018, p. 6). A little more than 50 per cent of countries were distrustersin 2016, Edelman (2016, p. 9).
168. Edelman (2018, pp. 37–40).169. Edelman (2017).170. 42 per cent believe Australia’s system of government needs minor change, and
41 per cent say the system needs major change or should be replaced. A further3 per cent are unsure. Markus (2017, p. 40).
171. Markus (2014).172. Spurr (2017).
Figure 6.2: Trust is falling in politicians, business and the press but not
in other institutions
Confidence in institutions, per cent
0
20
40
60
80
10019832001201020122016
Unis
Political parties
Fed government
Television
Press Major companies
Tradeunions
Armedforces
Police
Public service
Legal system
Fed parliament
Notes: Trends are indicative only, because poll questions and methodologies are
not consistent. Essential Media polls show similar trends since 2012, though trust
in major companies is consistently lower in these polls. See Appendix A for survey
methodology.
Sources: World Values Survey, 1983 and 2012 , cited by Lowy Institute (2017); AES
(2001) and AES (2010), cited in Lowy Institute (2017); Grattan analysis of AES (2016);
see also Essential Research (2017f).
Grattan Institute 2018 70
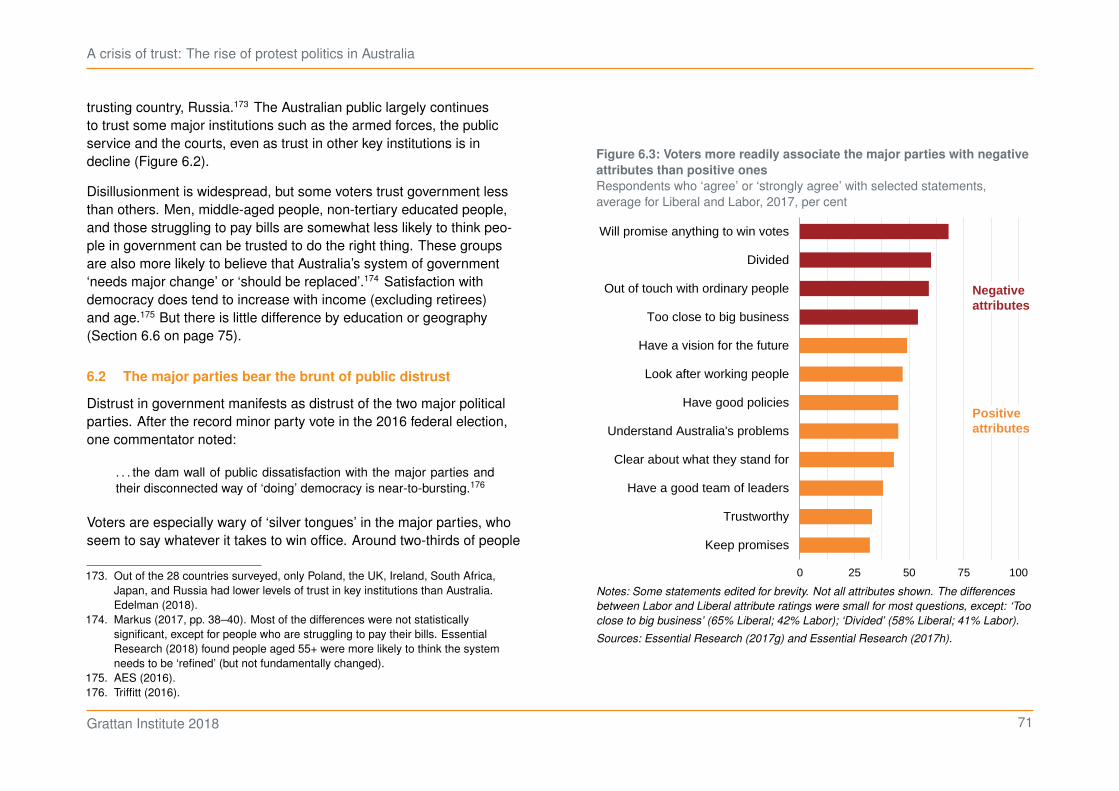
A crisis of trust: The rise of protest politics in Australia
trusting country, Russia.173 The Australian public largely continuesto trust some major institutions such as the armed forces, the publicservice and the courts, even as trust in other key institutions is indecline (Figure 6.2).
Disillusionment is widespread, but some voters trust government lessthan others. Men, middle-aged people, non-tertiary educated people,and those struggling to pay bills are somewhat less likely to think peo-ple in government can be trusted to do the right thing. These groupsare also more likely to believe that Australia’s system of government‘needs major change’ or ‘should be replaced’.174 Satisfaction withdemocracy does tend to increase with income (excluding retirees)and age.175 But there is little difference by education or geography(Section 6.6 on page 75).
6.2 The major parties bear the brunt of public distrust
Distrust in government manifests as distrust of the two major politicalparties. After the record minor party vote in the 2016 federal election,one commentator noted:
. . . the dam wall of public dissatisfaction with the major parties andtheir disconnected way of ‘doing’ democracy is near-to-bursting.176
Voters are especially wary of ‘silver tongues’ in the major parties, whoseem to say whatever it takes to win office. Around two-thirds of people
173. Out of the 28 countries surveyed, only Poland, the UK, Ireland, South Africa,Japan, and Russia had lower levels of trust in key institutions than Australia.Edelman (2018).
174. Markus (2017, pp. 38–40). Most of the differences were not statisticallysignificant, except for people who are struggling to pay their bills. EssentialResearch (2018) found people aged 55+ were more likely to think the systemneeds to be ‘refined’ (but not fundamentally changed).
175. AES (2016).176. Triffitt (2016).
Figure 6.3: Voters more readily associate the major parties with negative
attributes than positive ones
Respondents who ‘agree’ or ‘strongly agree’ with selected statements,average for Liberal and Labor, 2017, per cent
0 25 50 75 100
Will promise anything to win votes
Divided
Out of touch with ordinary people
Too close to big business
Have a vision for the future
Look after working people
Have good policies
Understand Australia's problems
Clear about what they stand for
Have a good team of leaders
Trustworthy
Keep promises
Negative attributes
Positive attributes
Notes: Some statements edited for brevity. Not all attributes shown. The differences
between Labor and Liberal attribute ratings were small for most questions, except: ‘Too
close to big business’ (65% Liberal; 42% Labor); ‘Divided’ (58% Liberal; 41% Labor).
Sources: Essential Research (2017g) and Essential Research (2017h).
Grattan Institute 2018 71
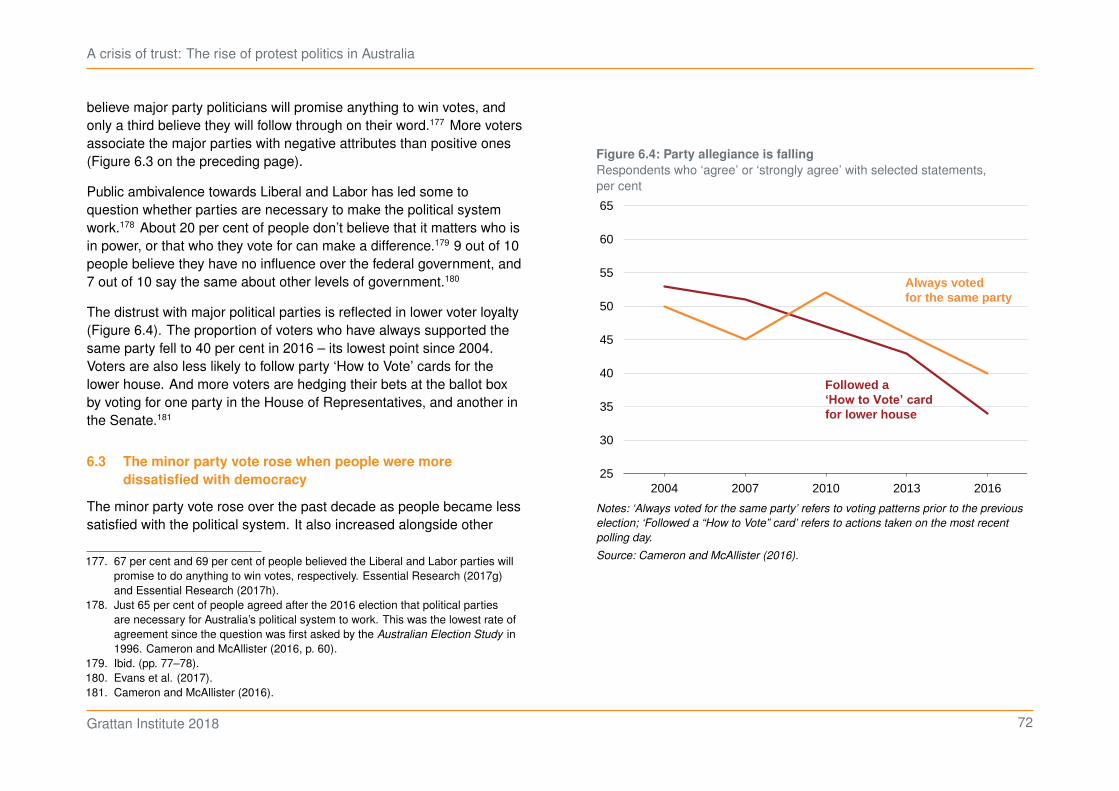
A crisis of trust: The rise of protest politics in Australia
believe major party politicians will promise anything to win votes, andonly a third believe they will follow through on their word.177 More votersassociate the major parties with negative attributes than positive ones(Figure 6.3 on the preceding page).
Public ambivalence towards Liberal and Labor has led some toquestion whether parties are necessary to make the political systemwork.178 About 20 per cent of people don’t believe that it matters who isin power, or that who they vote for can make a difference.179 9 out of 10people believe they have no influence over the federal government, and7 out of 10 say the same about other levels of government.180
The distrust with major political parties is reflected in lower voter loyalty(Figure 6.4). The proportion of voters who have always supported thesame party fell to 40 per cent in 2016 – its lowest point since 2004.Voters are also less likely to follow party ‘How to Vote’ cards for thelower house. And more voters are hedging their bets at the ballot boxby voting for one party in the House of Representatives, and another inthe Senate.181
6.3 The minor party vote rose when people were more
dissatisfied with democracy
The minor party vote rose over the past decade as people became lesssatisfied with the political system. It also increased alongside other
177. 67 per cent and 69 per cent of people believed the Liberal and Labor parties willpromise to do anything to win votes, respectively. Essential Research (2017g)and Essential Research (2017h).
178. Just 65 per cent of people agreed after the 2016 election that political partiesare necessary for Australia’s political system to work. This was the lowest rate ofagreement since the question was first asked by the Australian Election Study in1996. Cameron and McAllister (2016, p. 60).
179. Ibid. (pp. 77–78).180. Evans et al. (2017).181. Cameron and McAllister (2016).
Figure 6.4: Party allegiance is falling
Respondents who ‘agree’ or ‘strongly agree’ with selected statements,per cent
25
30
35
40
45
50
55
60
65
2004 2007 2010 2013 2016
Followed a ‘How to Vote’ cardfor lower house
Always voted for the same party
Notes: ‘Always voted for the same party’ refers to voting patterns prior to the previous
election; ‘Followed a “How to Vote” card’ refers to actions taken on the most recent
polling day.
Source: Cameron and McAllister (2016).
Grattan Institute 2018 72
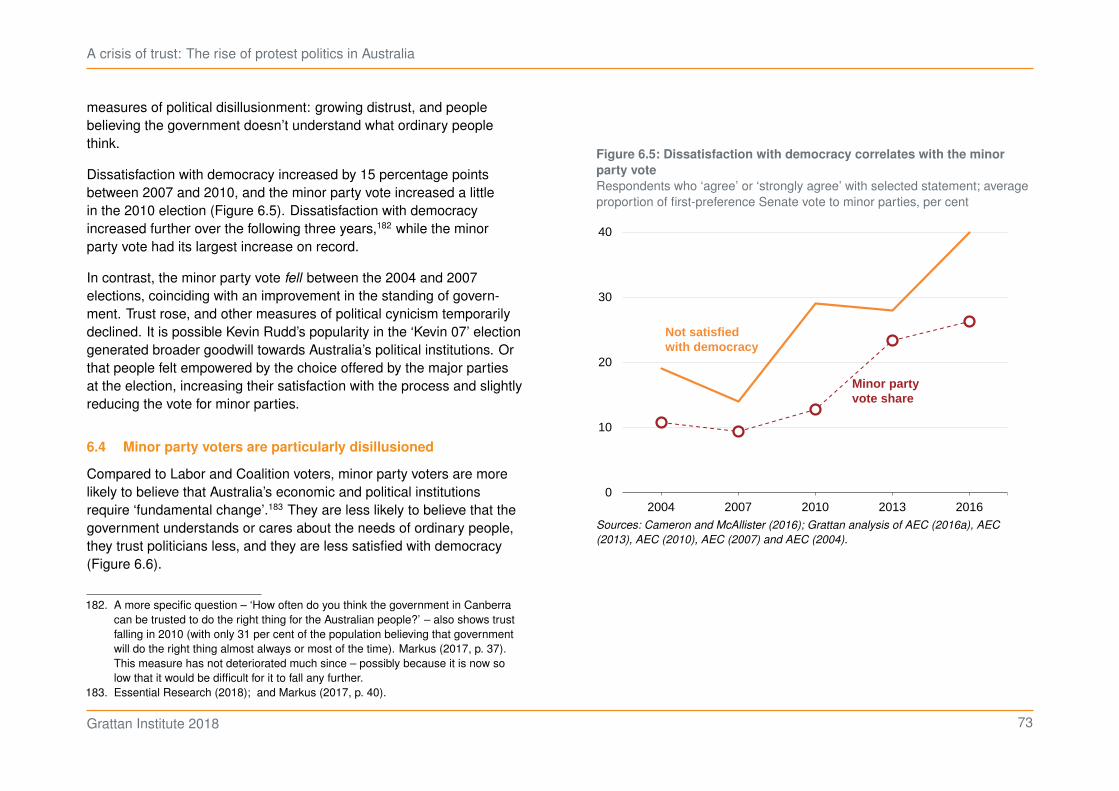
A crisis of trust: The rise of protest politics in Australia
measures of political disillusionment: growing distrust, and peoplebelieving the government doesn’t understand what ordinary peoplethink.
Dissatisfaction with democracy increased by 15 percentage pointsbetween 2007 and 2010, and the minor party vote increased a littlein the 2010 election (Figure 6.5). Dissatisfaction with democracyincreased further over the following three years,182 while the minorparty vote had its largest increase on record.
In contrast, the minor party vote fell between the 2004 and 2007elections, coinciding with an improvement in the standing of govern-ment. Trust rose, and other measures of political cynicism temporarilydeclined. It is possible Kevin Rudd’s popularity in the ‘Kevin 07’ electiongenerated broader goodwill towards Australia’s political institutions. Orthat people felt empowered by the choice offered by the major partiesat the election, increasing their satisfaction with the process and slightlyreducing the vote for minor parties.
6.4 Minor party voters are particularly disillusioned
Compared to Labor and Coalition voters, minor party voters are morelikely to believe that Australia’s economic and political institutionsrequire ‘fundamental change’.183 They are less likely to believe that thegovernment understands or cares about the needs of ordinary people,they trust politicians less, and they are less satisfied with democracy(Figure 6.6).
182. A more specific question – ‘How often do you think the government in Canberracan be trusted to do the right thing for the Australian people?’ – also shows trustfalling in 2010 (with only 31 per cent of the population believing that governmentwill do the right thing almost always or most of the time). Markus (2017, p. 37).This measure has not deteriorated much since – possibly because it is now solow that it would be difficult for it to fall any further.
183. Essential Research (2018); and Markus (2017, p. 40).
Figure 6.5: Dissatisfaction with democracy correlates with the minor
party vote
Respondents who ‘agree’ or ‘strongly agree’ with selected statement; averageproportion of first-preference Senate vote to minor parties, per cent
2004 2007 2010 2013 20160
10
20
30
40
Not satisfied with democracy
Minor party vote share
Sources: Cameron and McAllister (2016); Grattan analysis of AEC (2016a), AEC
(2013), AEC (2010), AEC (2007) and AEC (2004).
Grattan Institute 2018 73
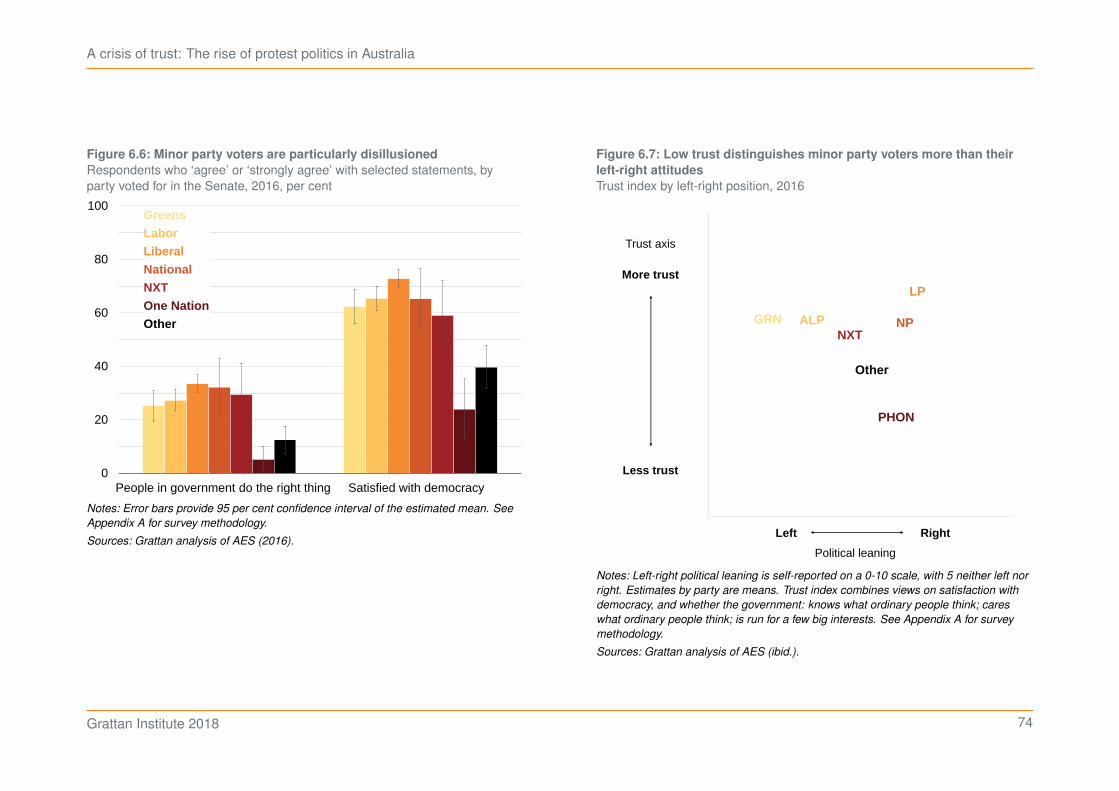
A crisis of trust: The rise of protest politics in Australia
Figure 6.6: Minor party voters are particularly disillusioned
Respondents who ‘agree’ or ‘strongly agree’ with selected statements, byparty voted for in the Senate, 2016, per cent
0
20
40
60
80
100
prop_trust prop_satisfiedPeople in government do the right thing Satisfied with democracy
GreensLaborLiberalNationalNXTOne NationOther
Notes: Error bars provide 95 per cent confidence interval of the estimated mean. See
Appendix A for survey methodology.
Sources: Grattan analysis of AES (2016).
Figure 6.7: Low trust distinguishes minor party voters more than their
left-right attitudes
Trust index by left-right position, 2016
LP
ALP NPGRN
PHON
NXT
Other
0
0.2
0.4
0.6
0.2 0.4 0.6 0.8Left
Political leaning
More trust
Less trust
Trust axis
Right
Notes: Left-right political leaning is self-reported on a 0-10 scale, with 5 neither left nor
right. Estimates by party are means. Trust index combines views on satisfaction with
democracy, and whether the government: knows what ordinary people think; cares
what ordinary people think; is run for a few big interests. See Appendix A for survey
methodology.
Sources: Grattan analysis of AES (ibid.).
Grattan Institute 2018 74
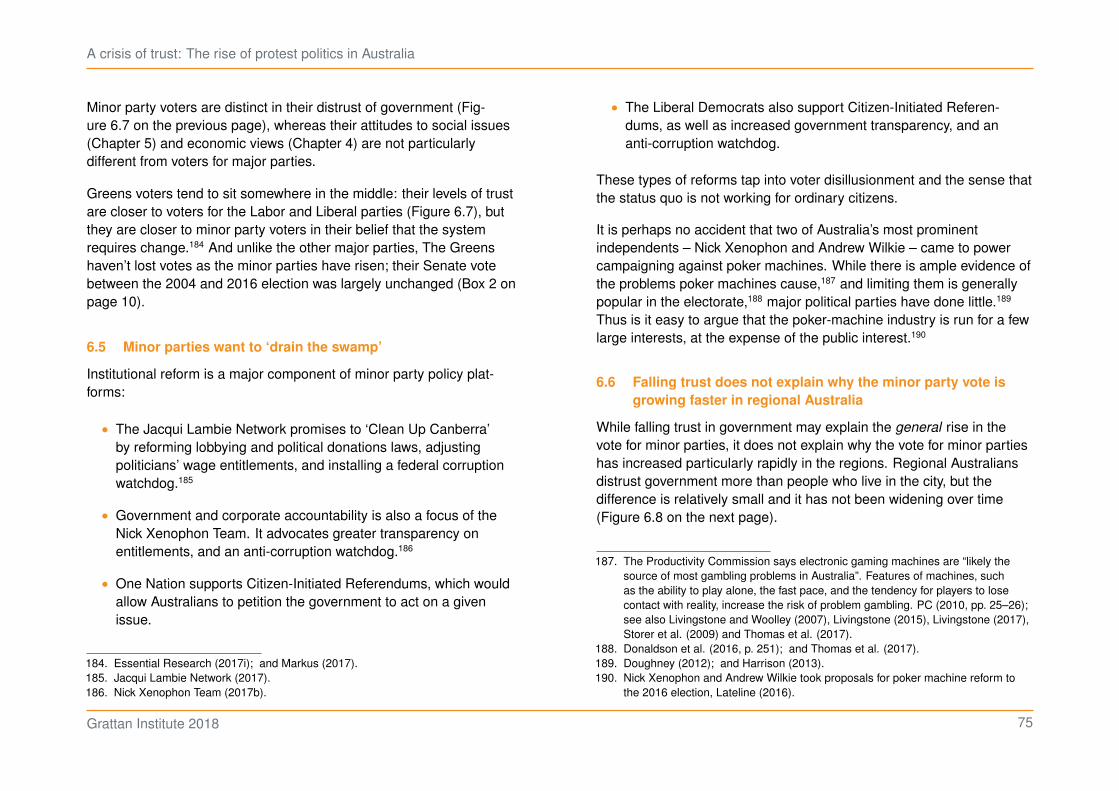
A crisis of trust: The rise of protest politics in Australia
Minor party voters are distinct in their distrust of government (Fig-ure 6.7 on the previous page), whereas their attitudes to social issues(Chapter 5) and economic views (Chapter 4) are not particularlydifferent from voters for major parties.
Greens voters tend to sit somewhere in the middle: their levels of trustare closer to voters for the Labor and Liberal parties (Figure 6.7), butthey are closer to minor party voters in their belief that the systemrequires change.184 And unlike the other major parties, The Greenshaven’t lost votes as the minor parties have risen; their Senate votebetween the 2004 and 2016 election was largely unchanged (Box 2 onpage 10).
6.5 Minor parties want to ‘drain the swamp’
Institutional reform is a major component of minor party policy plat-forms:
• The Jacqui Lambie Network promises to ‘Clean Up Canberra’by reforming lobbying and political donations laws, adjustingpoliticians’ wage entitlements, and installing a federal corruptionwatchdog.185
• Government and corporate accountability is also a focus of theNick Xenophon Team. It advocates greater transparency onentitlements, and an anti-corruption watchdog.186
• One Nation supports Citizen-Initiated Referendums, which wouldallow Australians to petition the government to act on a givenissue.
184. Essential Research (2017i); and Markus (2017).185. Jacqui Lambie Network (2017).186. Nick Xenophon Team (2017b).
• The Liberal Democrats also support Citizen-Initiated Referen-dums, as well as increased government transparency, and ananti-corruption watchdog.
These types of reforms tap into voter disillusionment and the sense thatthe status quo is not working for ordinary citizens.
It is perhaps no accident that two of Australia’s most prominentindependents – Nick Xenophon and Andrew Wilkie – came to powercampaigning against poker machines. While there is ample evidence ofthe problems poker machines cause,187 and limiting them is generallypopular in the electorate,188 major political parties have done little.189
Thus is it easy to argue that the poker-machine industry is run for a fewlarge interests, at the expense of the public interest.190
6.6 Falling trust does not explain why the minor party vote is
growing faster in regional Australia
While falling trust in government may explain the general rise in thevote for minor parties, it does not explain why the vote for minor partieshas increased particularly rapidly in the regions. Regional Australiansdistrust government more than people who live in the city, but thedifference is relatively small and it has not been widening over time(Figure 6.8 on the next page).
187. The Productivity Commission says electronic gaming machines are “likely thesource of most gambling problems in Australia”. Features of machines, suchas the ability to play alone, the fast pace, and the tendency for players to losecontact with reality, increase the risk of problem gambling. PC (2010, pp. 25–26);see also Livingstone and Woolley (2007), Livingstone (2015), Livingstone (2017),Storer et al. (2009) and Thomas et al. (2017).
188. Donaldson et al. (2016, p. 251); and Thomas et al. (2017).189. Doughney (2012); and Harrison (2013).190. Nick Xenophon and Andrew Wilkie took proposals for poker machine reform to
the 2016 election, Lateline (2016).
Grattan Institute 2018 75
A crisis of trust: The rise of protest politics in Australia
On other indicators of trust in government, there is little differencebetween cities and regions. For example, the number of people whobelieve the government is run for a few big interests is consistentacross cities and regions and has been for some time.191 One smallpoint of difference is the belief that Australia’s political system needsfundamental change: 45 per cent of people outside the capital citiesbelieve this to be true, compared to 38 per cent in the cities.192
6.7 Causes of disillusion
Why is trust in government falling? A detailed investigation is beyondthe scope of this report, but it is not hard to find explanations for boththe perception and the reality that rulers are acting less often in theinterests of the ruled.
People are less trusting of expertise. Politicians have become part ofa self-reinforcing cycle of over-promising and under-delivering. Themajor political parties are less representative of the general population.Vested interests play a more prominent role in public debate – andthey spend more money doing so. There are many questions aboutthe role of political donations. Media stories abound of misuse ofparliamentary entitlements. And the more rapidly-revolving doorbetween political office and lobbying positions increases concernsabout both self-interested behaviour and the power of vested interests.
Individually, none of these issues might be fatal to trust in government,but it is easy to see why collectively they might lead to rapidly fallingtrust in government. And the failure to implement significant reformto donations, politicians’ entitlements and post-political employment,despite the issues raised over the past few years, reinforces distrust.
191. AES (2016).192. The difference is not statistically significant, however. Markus (2016, p. 40). And
the gap is not wider than when the question was first asked (though both citiesand regions are increasingly likely to agree). Markus (2014, p. 33).
Figure 6.8: Trust is falling across the board, not just in the regions
Respondents who ‘agree’ or ‘strongly agree’ with selected statements,per cent
0%
20%
40%
60%
80%
100%
2004 2007 2010 2013 20160
20
40
60
80
100
2004 2007 2010 2013 2016
City
Large town
Country town
Rural
‘People in govt do the right thing’ ‘I am satisfied with how democracy works in Aus’
Notes: See Appendix A for survey methodology.
Source: Grattan analysis of AES (2016), AES (2013), AES (2010), AES (2007) and
AES (2004).
Grattan Institute 2018 76
A crisis of trust: The rise of protest politics in Australia
6.7.1 Media and expertise
People are increasingly sceptical of experts.193 Digital media havemade it easy for people to seek out contrarian voices and (oftenunknowingly) avoid information that challenges their world-view.194
And where government does make mistakes, these are exposed muchmore quickly and widely than in the past, as illustrated by the rise of‘fact-checking’ units.195
6.7.2 Over-promising
Governments increasingly disappoint voters. Politicians are inevitablypressed to solve each pressing social ill. Successive governmentshave promised to make housing more affordable, reduce power bills,increase jobs and growth, and develop regions. But both major partieshave over-promised and under-delivered.
Government never had instant solutions that would quickly make a bigdifference to these sorts of issues that tend to be at the forefront of vot-ers’ minds. And some of the challenges in delivery are largely invisibleto voters, such as the need for federal government to coordinate withthe states in areas such as energy policy.
193. Nichols (2017), Lamberts (2017) and M. Smith (2017). Some of the fall has beenreversed in recent years – the Edelman (2018) reports that trust in journalists,CEOs, and board executives increased since 2017. But the sense that ‘peoplehave had enough of experts’ is often exploited by anti-establishment partiesand candidates to draw distinctions between ‘ordinary citizens’ and the ‘politicalestablishment’ (quoted in Mance (2016), see also Clarke and Newman (2017)and Nelson (2017)). In Australia, One Nation politicians are well known toquestion expert opinion. Pauline Hanson sparked controversy last year byadvising parents to ‘go out and do their own research’ on vaccines and autism(O’Malley (2017)), and former senator Malcolm Roberts gained internationalnotoriety after an appearance on Q&A where he debated the science on climatechange with particle physicist Professor Brian Cox. ABC (2016).
194. Becker et al. (2017); and Hawdon (2012).195. Clune (2013); and Graves (2016).
While incumbent governments happily take credit for employmentgrowth, and oppositions make hay with economic downturns, muchof Australia’s economic performance reflects global factors beyondgovernment control.196 And as a result of deregulation and privatisation,governments have less direct control over the economy.197
Politicians thus tend to raise ‘great expectations’, and then dash them –increasing voter cynicism.
6.7.3 Unrepresentative democracy
Our political parties are less representative of the general populationthan in the past. Party members are now only a very small fraction(about one in 200) of the population. The best available evidence isthat the ALP has about 55,000 members, while estimates for the LiberalParty (including the Queensland LNP) range from 40,000 and 80,000members.198
196. Of course, governments can affect the economic performance of the economyin the short term through expansionary fiscal policy – running budget deficits –or in the longer term through economic reforms or infrastructure spending thatenhance the productive capacity of the economy. But the effects tend to be smallrelative to economic growth that would happen anyway. Daley et al. (2012).
197. Tingle (2012).198. Party membership numbers are notoriously difficult to pin down, because parties
keep exact figures secret – especially if they are embarrassingly low. The LiberalParty claims on its website (Liberal Party of Australia (2018)) to have 80,000members nationally, but just a few years ago a party member estimated thatthe number is closer to 40,000-45,000 (Bramston (2015)), which is closer toearlier estimates (C. Alexander (2013), McAllister et al. (1997) and I. Ward andStewart (2010)), but not earlier statements on the party website (Cross and Gauja(2014)). Membership figures for the ALP have hovered between 37,000 and55,000 for a long time (Bracks et al. (2011), Bramston (2015), Cross and Gauja(2014) and Shorten (2014)). In 2010 an internal ALP review found the party wasfacing ‘a crisis of membership’ (Bracks et al. (2011)), but party reform appears tohave improved membership numbers in recent years (Bramston (2015)). Basedon returns to the NSW Electoral Commission, in NSW in 2015 the Liberal Party
Grattan Institute 2018 77
A crisis of trust: The rise of protest politics in Australia
The demographics of these members are unrepresentative of the popu-lation. As a Liberal Party report reflected, “our membership is ageingand declining”.199 At the time, the average age of Victorian LiberalParty members was 62.200 Similarly, an internal review conductedby the ALP reflected, “Throughout the Review process and in everypart of Australia, the Review Committee was continually reminded bymembers that the membership of the Party is ageing.”201 Between 1999and 2009, the NSW wing of the ALP closed more than 100 branches,many of them in regional areas.202 And almost all members of the ALPare union members, even though union membership in Australia hasfallen rapidly to about 15 per cent of employees, and 6 per cent of thepopulation.203
Politicians themselves are also less representative, in the sense thattheir backgrounds are narrower than in the past. They are increasinglydrawn from a professional political class rather than broader walks oflife.204 Others have little work experience outside being political staffersor trade union officials.205 It is almost unimaginable that Australia todaywould have a prime minister who had actually driven a train.206
had about 10,500 members, the Nationals about 5,000 members, and the ALPabout 18,000 members. Murray (2015).
199. Cited in Cross and Gauja (2014).200. Abjorensen (2010).201. Bracks et al. (2011).202. Grattan analysis of Cavalier (2010).203. ABS (2018e, Table 18).204. Lumb (2013) found that 54 per cent of parliamentarians worked in the public
service, party administration, or other political roles just before joining the 43rdparliament, reflecting the increased ‘professionalisation’ of politics Jones (2008).
205. An analysis of the 2013 Parliament showed that 41 per cent had held a politics-related job immediately before being elected. In 1998, the equivalent figure was26 per cent. Lumb (2013).
206. Ben Chifley was a train driver in Bathurst before he became prime ministerdecades later in 1945. NAA (2016).
People in regional Australia are especially likely to think that Australia’sdemocracy is unrepresentative. Historically, the National Party hasbeen key to ensuring that regional issues get represented in parlia-ment. Due to the long-standing partnership with the Liberal Party, theNationals have gained portfolios that allow them to influence policy infavour of their constituents.207 But while many of their parliamentarianshave been successful advocates for the bush,208 there may be agrowing perception that some have “succumbed to the allure of thewhite car”, and overly toe the Coalition (or Liberal) party lines.209
Botterill and Cockfield (2015, p. 115) argue that Nationals’ support forLiberal Party economic and social agendas has forced the Nationalsto step away from their traditional values of regional exceptionalism,‘countrymindedness’ (Chapter 5), and agrarian collectivism.
The authors suggest this threatens to undermine the party’s ideologicalcoherence. If regional voters don’t believe that they will receiveadequate representation by the Nationals, they might be more likelyto turn to independents or minor parties to fulfil this role.210
207. Botterill and Cockfield (2015, p. 56).208. Some landmark achievements in government include: the Foundation for Rural
and Regional Renewal, set up in 2000, the Sustainable Regions Program,established in 2001, improvements to telecommunications infrastructure in theregions, and various adjustment packages for regional industries. See Davey(2010, pp. 422–425) for an overview.
209. Botterill and Cockfield (2015, p. 56).210. The Liberal and National parties merged in 2008 in Queensland, in a move that is
widely believed to have provided an opportunity for third parties (particularly OneNation) to gain votes from disaffected regional constituencies. Grattan (2016),Coorey (2017) and Botterill and Cockfield (2015).
Grattan Institute 2018 78
A crisis of trust: The rise of protest politics in Australia
6.7.4 Favouring vested interests at the expense of the public
interest
Political decisions often convey the appearance – and quite possiblythe reality – that they have been swayed primarily by vested inter-ests rather than the public interest. It would be understandable if asubstantial proportion of the electorate was nervous that powerfulbusiness interests rather than the public interest were dominatingdecision making on issues such as the mining super profits tax, pokermachine regulation, reduction in television licence fees, pharmacyregulation, financial services regulation, and property development.Similarly, many voters remain unconvinced that they will gain from theprivatisation of government assets,211 despite the economic benefitsthese changes can bring.212
Whether or not government has in fact made good decisions in theoverall public interest in these areas, the collective impression isthat the voices of vested interests were loud in the debate, and oftensuccessful.
In the US, vested interests have increased the amount they spendon lobbying government, not least because previous lobbying invest-ments have yielded high returns.213 There is no equivalent study that
211. 70 per cent of respondents in Essential Research (2015) agreed that “privatisa-tion mainly benefits the corporate sector”, and that “prices always increase morewhen services are privatised”. Just one-in-four respondents agreed that sellingpublic utilities would help the economy.
212. PC (2014, p. 33) found that privatisation of utilities is the preferred policy optionwhen the objective of reform is to achieve the most efficient management ofassets.
213. R. M. Alexander et al. (2009) found that firms which had lobbied for a tax holidayon repatriated earnings in the American Jobs Act of 2004 gained $220 for everydollar spent. The ‘Strategas Index’ – inspired by this study – looks at the returnsto lobbying for the top 50 firms that lobby most intensely. Between 2002 and 2015the Index outperformed the S&P500 by 11 per cent per annum (The Economist(2011) and Wells and Chemi (2015)).
shows that Australian corporates have increased their spending ongovernment relations. However, they appear to expend very substantialresources on in-house government relations experts, industry associa-tions, and third-party lobbyists – often with revolving doors to politiciansand their advisers. Many people believe that vested interests get a lotmore ‘air time’ with politicians than do ordinary voters.214
Donations to political parties have been more prominent in the mediaover the past few years. With a few high-profile exceptions, there is nextto no evidence that political donations are made in exchange for par-ticular undertakings. But as the saying goes, ‘you never bribe a personwhen you need them’; instead, ‘you give in order to get back’.The realconcern is that donations create a relationship of obligation that in thefuture will provide at least an opportunity to influence.215
214. The proportion of people who agree with the statement that ‘government is run bya few big interests’ is at its highest level since 2004 (Figure 6.1 on page 69).
215. Some business people are remarkably open about the potential relationshipbetween donations and political influence. In an interview with Four Corners
last year, Luca Belgiorno-Nettis, managing director of Transfield Holdings, saidof donations ‘do ut des’: (you give in order to get back), that it was ‘fairly plain’that Transfield Holdings made political donations to get access to politicians andinfluence events, and that it would be ‘difficult to deny’ that donations helped thecompany gain a contract worth $750 million to build the Sydney Harbour Tunnel.K. Murphy (2016). A former treasurer of the NSW and federal Liberal parties saysthat Australia’s political donations system creates potential for donors to ‘havean expectation of some kind of policy or other outcome in view of their donation’.Yabsley, Steketee (2015), see also W. Smith (2014).
Grattan Institute 2018 79
A crisis of trust: The rise of protest politics in Australia
The NSW216 and Victorian217 governments have tightened donationregimes, and some states are moving towards real-time on-line disclo-sure.218 But the Commonwealth has not significantly limited donations.Donations to parties at the national level are not disclosed for up to18 months, despite government using the internet for everything fromtax returns to government tendering. And many would argue there aretoo many loopholes in the disclosure regime that allow donors to avoidtransparency.219
6.7.5 Benefits to politicians at the expense of the public interest
Trust has also been eroded by the perception that politicians don’talways use public funds in the public interest. Public cynicism aboutpoliticians and their motives is fed by stories of MPs abusing theirentitlements and appointing their former colleagues into generouslypaid, taxpayer-funded roles.220
216. In the wake of a series of public scandals, NSW introduced a ban on politicaldonations by property developers in 2009. In 2010 the ban was expanded toinclude tobacco companies, for-profit liquor and gambling enterprises, and thecaps on politicians’ expenditure and entitlements were lowered. NSW ElectoralCommission (2017).
217. Premier Daniel Andrews has pledged to legislate the ‘strictest donations lawsin the country’, which should be in place before the November 2018 Victorianelection. The proposal is to cap donations at $4000 to political parties, associatedentities and third-party campaigners over a four-year term. Foreign donationswould be banned, and every donation of $1000 or more would be declared. RMITABC Fact Check (2017) and Ng (2017).
218. Needham (2016). Donations to political parties in Queensland must be disclosedwithin seven business days, and are displayed on the Electoral CommissionQueensland website. Blackwood (2017). Premier Andrews’ proposed Victoriandonations reform package includes real-time disclosure. RMIT ABC Fact Check(2017) and Ng (2017).
219. Tham (2017); and Edwards (2017).220. Almost three-quarters of surveyed individuals agreed ‘people in government look
after themselves’, the highest level since 2004 (Chapter 6).
Parliamentary entitlements are significantly greater than those providedto employees of other organisations,221 and stories about their abusehave been prominent in recent years. In the past five years, twospeakers of the House of Representatives and a minister resignedafter media stories about car rides to wineries, a helicopter flight fromMelbourne to Geelong, and repeated flights to the Gold Coast.
Inherently, misuse of entitlements symbolises politicians lookingafter their personal interests at the expense of the public interest.This may explain why the media and public are so fascinated withexpenditures that are very small relative to total government spending– total Commonwealth spending on politicians’ entitlements wasonly $178 million in 2016-17.222 The number of news stories aboutpoliticians’ entitlements peaked in 2015, and remains high by historicalstandards.223
And the appointment of former politicians into public roles can alsoerode trust. A significant number of paid positions on the boards ofgovernment instrumentalities and bodies such as the AdministrativeAppeals Tribunal (AAT) are occupied by former politicians.224 It is notobvious that politics in fact provides these politicians with particularskills in either business or administrative decision-making.
Suspicions of overly close links between politicians and vested interestsare reinforced when politicians take up lobbying roles soon aftertheir departure from politics. For example, within a year of leaving
221. For example few employers pay for the travel of family members, an entitlement ofCommonwealth parliamentarians.
222. Treasury (2017, p. 95).223. As of December 2017. Factiva search for news articles of ‘entitlements’ within five
words of ‘politicians’ or ‘political’ or ‘party’ or ‘ministers’ or ‘taxpayer funded’ andcontaining the words ‘scandal’ or ‘misuse’ or ‘controversy’ or ‘abuse’ (Dow Jones(2018)).
224. Grattan analysis of the 2017 appointees to the AAT suggests that 8 per cent haveknown ties to political parties (former parliamentarians or staff).
Grattan Institute 2018 80
A crisis of trust: The rise of protest politics in Australia
politics, the former Minister for Broadband, Communications and theDigital Economy took up a role representing the Australian gamblingindustry,225 the former Minister for Trade took on a consultancy rolewith the owner of the Port of Darwin (although he denies that thisinvolved any lobbying role in Australia),226 and the former Ministerfor Small Business became executive chairman of the peak body forfranchisors.227
6.7.6 Lack of accountability when things go wrong
Public suspicion of the major parties is fuelled by a sense that par-liamentarians aren’t being held accountable for poor behaviour.228
Examples of politicians getting away with doing the wrong thing givethe impression that the political system lacks integrity. The situation isworse when politicians seem to avoid blame by using weasel words toescape responsibility for their actions. Changes in the media landscape(see Section 6.7.1) may make the public more aware of this sort ofbehaviour than in the past.229
6.8 Summing up: Dissatisfaction with government provides
fertile soil for minor parties
When disillusionment with the political system crosses a threshold,people can respond by choosing not to vote in elections, or by votinginformally, or by supporting candidates who might instil institutionalchange.230 Voters may be more likely to choose the last two optionsin countries where voting is compulsory,231 including in Australia.232 As
225. Willingham (2016).226. McKenzie and Massola (2017).227. Waters (2016).228. Evans et al. (2017).229. Grattan (2014).230. Hirschman (1970); Hetherington (1999); and Bélanger and Nadeau (2005).231. Hooghe et al. (2011); and Hooghe and Dassonneville (2016).232. AEC (2016b); and Bélanger (2017, p. 246).
a result, the link between falling trust in government and a rising minorparty vote may be particularly strong in Australia.233
The data fits the theory. Falling trust in government loosely correlatesin time with the rise in minor party vote, policies aimed at institutionalreforms are prominent in minor party platforms, and minor party votersare more likely to distrust government. All the signs suggest thatdisillusionment is an important driver of minor party support in boththe cities and the regions (Table 6.1 on the next page). Trust does not,however, explain why the minor party vote is rising faster in regionalareas. Trends in minor party voting in regional Australia are influencedby the sense that regional Australia is being ‘left-behind’ economicallyand culturally (see Chapter 4 and 5).
233. Bélanger (2017); and Bélanger (2004).
Grattan Institute 2018 81
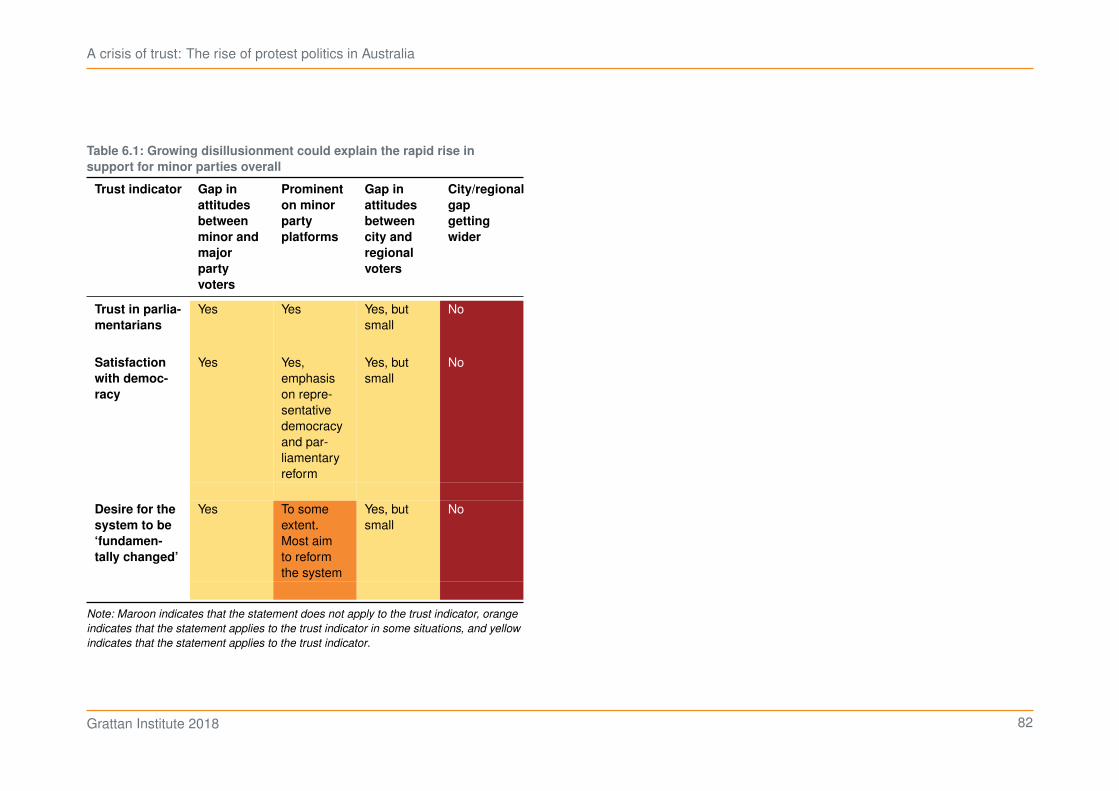
A crisis of trust: The rise of protest politics in Australia
Table 6.1: Growing disillusionment could explain the rapid rise in
support for minor parties overall
Trust indicator Gap in
attitudes
between
minor and
major
party
voters
Prominent
on minor
party
platforms
Gap in
attitudes
between
city and
regional
voters
City/regional
gap
getting
wider
Trust in parlia-
mentarians
Yes Yes Yes, butsmall
No
Satisfaction
with democ-
racy
Yes Yes,emphasison repre-sentativedemocracyand par-liamentaryreform
Yes, butsmall
No
Desire for the
system to be
‘fundamen-
tally changed’
Yes To someextent.Most aimto reformthe system
Yes, butsmall
No
Note: Maroon indicates that the statement does not apply to the trust indicator, orange
indicates that the statement applies to the trust indicator in some situations, and yellow
indicates that the statement applies to the trust indicator.
Grattan Institute 2018 82
A crisis of trust: The rise of protest politics in Australia
7 What should governments do?
Why does a rising vote for minor parties matter?
The overall rise in the minor party vote primarily reflects growing voterdistrust in politicians and political parties. And many regional voters arealso reacting to a growing cultural divide between cities and regions.Economics is less important, but voters concerned about keeping theirjob are more likely to be politically volatile.
Of itself, a rising minor party vote is not necessarily bad. If existingpolitical parties are replaced by others that better reflect the popularwill and public interest, then democracy is working.
The rising minor party vote – properly understood – may encourageexisting major parties to enact reforms in their own long-term self-interest that would also be in the public interest. Policies that actuallyincrease trust in government and improve social cohesion would beboth worthwhile ends in themselves, and the means to increase theappeal of major parties in the long term. And policies that narrow thecity-regional cultural divide would increase social cohesion and reducethe appeal of counter-productive isolationism. But if major parties failto enact such reforms, then current trends suggest that democraticelectorates will ultimately rebuild governments without them.
7.1 Current trends may reshape the political landscape
The minor party vote is reaching levels that have historically reshapedthe political landscape. In itself this is not necessarily a bad thing,but it’s obviously concerning to incumbent major political parties.As former ALP advisers Lachlan Harris and Andrew Charlton pointout, on the three previous occasions that the minor party vote in theHouse of Representatives reached 25 per cent (as it did in 2016 if The
Greens are regarded as a minor party), there has been a major politicalrealignment (Figure 7.1 on the following page).234
Electoral arithmetic explains why a minor party vote around 25 per centis prone to reshaping parties. Below that level, most single-memberelectorates remain primarily a contest between the two major parties.Above that level, and the minor party vote in a number of individualelectorates will be more than 30 per cent. And in those electorates,either minor party preferences are determinative, or the candidate ofone of the major parties runs third and there is a good chance that theleading minor party candidate will be elected.
These dynamics played out in the recent Queensland election. Witha minor party vote of 31 per cent, election analyst Antony Greendescribed it as ‘one of the toughest elections to call’ in his nearly30-year career.235 A large number of seats became three-way contests.Minor parties ultimately won six out of 93 seats, but could easily havewon many more.
Political realignment is even more likely when a single party aggregatesmost of the minor party votes, as appears to be happening in SouthAustralia.236 In France, President Macron’s En Marche! Party wasonly formed in 2016, but in 2017 it won 49 per cent of the vote and61 per cent of the seats in the final round of voting from the NationalAssembly, in alliance with the Democratic Movement.237
234. Harris & Charlton (2017), cited in D. Murphy (2017).235. Silva (2017).236. Owen (2017).237. Kirk and Scott (2017).
Grattan Institute 2018 83
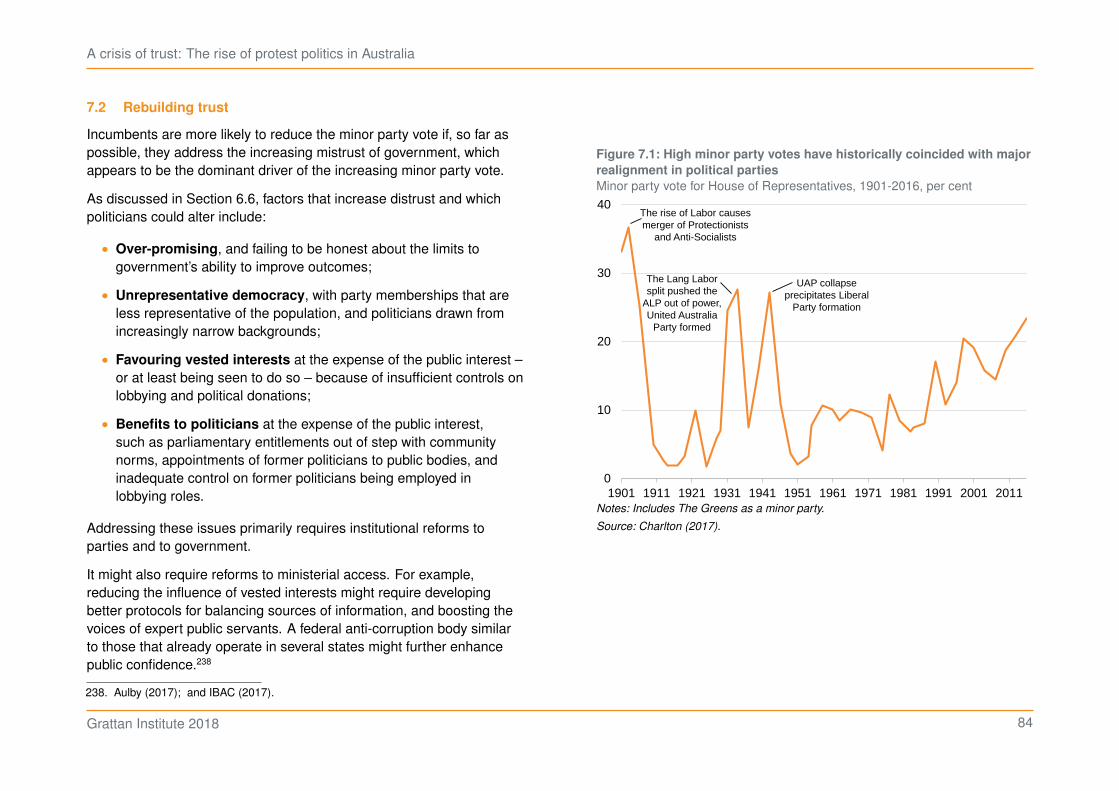
A crisis of trust: The rise of protest politics in Australia
7.2 Rebuilding trust
Incumbents are more likely to reduce the minor party vote if, so far aspossible, they address the increasing mistrust of government, whichappears to be the dominant driver of the increasing minor party vote.
As discussed in Section 6.6, factors that increase distrust and whichpoliticians could alter include:
• Over-promising, and failing to be honest about the limits togovernment’s ability to improve outcomes;
• Unrepresentative democracy, with party memberships that areless representative of the population, and politicians drawn fromincreasingly narrow backgrounds;
• Favouring vested interests at the expense of the public interest –or at least being seen to do so – because of insufficient controls onlobbying and political donations;
• Benefits to politicians at the expense of the public interest,such as parliamentary entitlements out of step with communitynorms, appointments of former politicians to public bodies, andinadequate control on former politicians being employed inlobbying roles.
Addressing these issues primarily requires institutional reforms toparties and to government.
It might also require reforms to ministerial access. For example,reducing the influence of vested interests might require developingbetter protocols for balancing sources of information, and boosting thevoices of expert public servants. A federal anti-corruption body similarto those that already operate in several states might further enhancepublic confidence.238
238. Aulby (2017); and IBAC (2017).
Figure 7.1: High minor party votes have historically coincided with major
realignment in political parties
Minor party vote for House of Representatives, 1901-2016, per cent
0
10
20
30
40
1901 1911 1921 1931 1941 1951 1961 1971 1981 1991 2001 2011
The rise of Labor causes merger of Protectionists
and Anti-Socialists
The Lang Laborsplit pushed the
ALP out of power, United Australia
Party formed
UAP collapse precipitates Liberal
Party formation
Notes: Includes The Greens as a minor party.
Source: Charlton (2017).
Grattan Institute 2018 84
A crisis of trust: The rise of protest politics in Australia
Reforms that addressed these issues would probably improve both thequality of government and trust in government. They would be in thelong-term self-interest of major parties, and be in the public interesttoo. Nevertheless, there has been little progress on many of them fordecades because they would run counter to the interests – in the shortrun at least – of incumbent parties.
Reforms might also allay concerns that foreign governments andinterests can influence Australian domestic politics inappropriately.239 Ifcontrols on political donations and lobbying do not limit domestic actorsenough, then there also tends to be too much space for foreign actorsto influence Australian governments.
Reforming the way citizens engage with Australia’s democracy couldalleviate growing dissatisfaction with the political system.240
7.3 Narrowing the cultural divide
As well as reflecting falling trust in government, the minor party vote isrising particularly fast in regions, reflecting the widening cultural dividebetween regions and cities. Although incomes per capita are rising asquickly in regions as in cities, populations are growing more slowly –if not shrinking – in many regional areas (Section 4.2.4 on page 44).Migrants, increasingly from Asia and the Middle East and Africa, arealmost all settling in cities (Section 5.4.1 on page 61). And so somepeople in regions resent the perceived loss of economic, political andcultural power to those who live in cities (Section 5.4.1).
While governments can’t do much to change the population and eco-nomic trends, they can improve regional services, increase region-cityinteractions, and reduce (rather than inflame) concerns about migrants.
239. See debate highlighted in Lowy Interpreter (2017).240. See the newDemocracy (2018) for an example.
7.3.1 Promoting social cohesion
The rising minor party vote in regions is not in itself undesirable. Thereis nothing inherently bad about voters supporting new parties becausethey believe that they will better reflect their economic, political andcultural interests.
But if people in regions see themselves as having fundamentallydifferent values to those in cities, then it is harder to maintain socialcohesion. Social cohesion provides all kinds of benefits, not least asociety in which individuals are prepared to compromise what they seeas their self-interest for continued participation in the larger community.Democracy relies on citizens being prepared to make these kind ofcompromises.
7.3.2 Promoting economic development
In part cultural divides stem from city populations growing faster thanregions. Many inland regions more than two hours from state capitalsare losing population. The geography of economic growth largelyreflects employer choices: being close to many other businessesin a city usually outweighs lower labour and land costs in regions(Chapter 4).
Stopping or reversing these trends is not an option. Governmentshave tried unsuccessfully for decades to fight against the economicforces of centralisation. Shifting jobs and people from the cities toregions – for example through incentive payments – has proved akin topushing water uphill.241 Direct government expenditure on projects cancreate short-term employment, but it does little to support long-termsustainable growth in regions.242 And transferring government agencies
241. Daley and Lancy (2011).242. PC (2017a, p. 116).
Grattan Institute 2018 85
A crisis of trust: The rise of protest politics in Australia
to regions usually inflicts big disruption costs on the agency, forrelatively little increase in regional employment.243
Nor are infrastructure projects likely to have much impact. Over thepast decade Commonwealth and state governments spent far moreon infrastructure projects in regions than capital cities relative to eitherpopulation, population growth or economic activity.244 Nevertheless,population and economic activity continue to concentrate in large cities.
As the Productivity Commission recently recommended, governmentsshould focus on people-based interventions in regions – supportingpeople in regional communities to adjust to changing economiccircumstances.245
7.3.3 Improving services
Something governments do control is the level of services. Smallerand slower-growing parts of rural and regional Australia should retainaccess to a minimum level of services – such as schools, hospitals,transport and other community facilities. Governments in fact tend tospend more per capita on these services in regions (Figure 4.14 onpage 47), but outcomes are often worse, largely because they lackeconomies of scale. But in many cases there is a perception thatregions are not getting their fair share,246 which is reinforced becausegovernments typically do their best to conceal the cross-subsidies.247
243. For example, when the Federal Government decided to transfer the AustralianPesticides and Veterinary Medicines Authority from Canberra to Armidale, theCEO advised that only 10 per cent of the staff were willing to relocate. Staffturnover increased rapidly, and some key scientific positions remained unfilled.Rodrigues et al. (2017, pp. 54–56). Fully staffed, the agency would have added alittle more than 1 per cent to the workforce of Armidale.
244. Terrill et al. (2016, p. 28).245. PC (2017a).246. Brett (2011).247. Data on the cost of government services by remoteness is very rarely made
public; data in this report relies on the Commonwealth Grants Commission, one
These cross-subsidies should be explicitly justified on equity or socialgrounds. This would reduce the perception in regions that governmentsare ignoring them, or favouring cities at the expense of regions.
Regional festivals and cultural institutions may be more important thanmany realise in breaking down cultural divides. Because they oftenattract visitors from elsewhere, they can create the sense that those incities do value what is happening in regions, while validating a sense ofregional pride.248 And they can be relatively cheap compared to otherimprovements in regional services and infrastructure.
7.3.4 Increasing interactions between region and city
Promoting a deeper understanding of the lifestyle and policy challengesfacing other parts of Australia might also help narrow the widening gapin attitudes.
Visits from members of the federal and state governments – seniorministers as well as local MPs – would help ground governments in adeeper understanding of regional issues. The best way to understandDarwin is from the ground, not at 35,000ft on the way to Paris.249
Visits by senior ministers would also help to counter the perceptionthat regions don’t count as part of the national culture. Regional areasbeyond the commuter belt perceive they receive less attention fromgovernment than people in the cities and the closer regional centres.250
Senior ministers should make these appearances individually rather
of the few arenas where states have incentives to argue that services in regionscost more.
248. For example, many credit the Museum of Old and New Art with reviving bothtourism and civic pride in Hobart – although of course this initiative was privatelyfunded.
249. As Paul Keating famously suggested. Milliken (1994).250. This was frequently mentioned in Grattan Institute’s regional consultations in
Mildura (Box 7 on page 40). Grattan analysis of political tribes data.
Grattan Institute 2018 86
A crisis of trust: The rise of protest politics in Australia
than as a mass ‘community cabinet’, which is inherently only visiblein one of Australia’s many regional centres. Nor are local members asubstitute for a senior minister: inherently a local member representsthe local area, whereas a minister represents the national or stategovernment.
Governments may be able to promote a shared understanding inother ways. Many school and university students go on internationalexchanges, but very few spend a term immersed in life in a differentpart of Australia. Nothing beats hours spent in Sydney traffic or notbeing able to get a GP appointment in a regional area to engendersupport for greater investment in the services that would make the mostdifference to people in different parts of Australia.
7.3.5 Reducing tensions based on migration
The cultural divide between regions and cities crystallises around mi-gration. This is difficult to deal with because the places most concernedabout migrants have very few migrants. Instead, concern is highestin places where people are primarily concerned about the ‘other’ –cultures that they have not experienced directly (Section 5.4.2 onpage 61). This problem has got worse over the past decade becausesimultaneously the number of migrants increased, more came fromAsia and the Middle East rather than Europe, and far fewer settled inregions rather than cities.
When governments ramp up concerns about migrants,251 or terrorism,they may hope to increase their appeal to those voters fearing the‘other’. But more likely, they just increase these voters’ fears,252
251. Hunter and Preiss (2018).252. Sandovici et al. (2012). The proportion of people nominating defence/national
security or terrorism as the number one issue facing Australia today increasedfrom less than 1 per cent in 2014 to closer to 10 per cent in 2015. Markus (2017,p. 34).
inflaming anti-immigrant sentiment, and increasing the appeal of moreopenly anti-migrant parties such as One Nation.
Instead, governments can dampen – or at the very least not inflame –cultural divides arising from immigration. The perception that migrantsare ‘other’ is reduced if, rather than emphasising difference, govern-ment rhetoric focuses on the contribution of migrants to core nationalvalues such as community service (for example, health professionals),running small businesses, or volunteering.253
The media also plays an important role. Coverage given to populistpoliticians and their anti-immigration messages can increase anti-immigration sentiments.254 Media coverage of divisive figures is oftenwell out of proportion with their vote or ultimate political impact.255
And governments may also be able to contain the appeal of anti-migrant rhetoric with a more nuanced discussion about its effects.Ambit claims about the benefits of migration inherently lack credibilityif they fail to address costs that to voters appear undeniable, suchas higher house prices and more congestion, particularly whengovernment policies on land-use planning and infrastructure don’t doenough to accommodate additional residents.256
7.3.6 Making globalisation work for Australians
In some countries, such as the US, voting against establishmentcandidates is sometimes fuelled by sentiment opposed to free trade.257
This appears to be less of a concern in the UK258 and in Australia.
253. Haidt (2016b).254. Sandovici et al. (2012).255. For a discussion, see Whyte (2016).256. Daley et al. (2018).257. Stokes (2016).258. Brexiteers were opposed to migration and membership of the European Union,
but were very keen on implementing an expansive free trade agreement with theEuropean Union after exit (Cocco (2017)).
Grattan Institute 2018 87
A crisis of trust: The rise of protest politics in Australia
Nevertheless, there are some protectionist elements to minor partyrhetoric in Australia (Section 4.1.9 on page 37).
While there is plenty of evidence that multilateral free trade generallyincreases welfare,259 the case can be undermined by overblownrhetoric. Not all free trade deals are that beneficial. Recent bilateraltrade deals have come with promises of billions of dollars more in theeconomy and hundreds of thousands of jobs.260 But economic studiesof these preferential trade deals suggest the real benefits are muchsmaller. Indeed, some of these deals may impose net costs on theAustralian community.261
The gulf between rhetoric and reality has created a space for minorparties to tap into the concerns of workers with low levels of jobsecurity (Section 4.1 on page 29) by offering a return to a more closedeconomy.262
The long-term decline in jobs in manufacturing and agriculture isn’tgoing to be reversed (Chapter 4). But more realistic rhetoric on tradeand much more rigorous cost-benefit assessment before signing on tonew preferential trade deals might help reduce public cynicism aboutthem.
259. Will et al. (2017).260. ABC (2015).261. Bilateral trade agreements add to the complexity and cost of international trade
through rules of origin (need to identify the origin of importing goods to establishthe tariff treatment) and potentially costly intellectual property protectionsand investor-state dispute settlement provisions. They can also lead to ‘tradediversion’: increase in trade with partner to the agreement at the expense oflower-cost trade with countries outside of the agreement. PC (2017b), PC (2015)and Armstrong (2015).
262. Section 4.1.9 on page 37.
7.4 The dangers of distraction
The rise of minor parties may also distract incumbents from goodpolicy.
Stung by claims that they are not delivering in the public interest,incumbents may double down on promises to produce more economicgrowth, more jobs, and more affordable housing. As discussed inChapter 6, they are unlikely to be able to fulfil these promises, and inthe long run that would further erode trust in government.
Alternatively, in the mistaken belief that the rise of political outsidersis driven by inequality,263 incumbents may double down on promisesto redistribute income and wealth.264 While further redistribution is notnecessarily a bad thing,265 it may be a false hope that distracts fromtackling the real issues that are reducing trust in government.
Other incumbents may revert to more socially conservative policies,believing that this will recapture the votes lost to minor parties.266
Regardless of whether more socially conservative policy is desirable,this is unlikely to win elections for an incumbent party. As discussedin Chapter 5, minor party voters aren’t more socially conservative;most minor parties don’t particularly promote socially conservativepolicies; and the electorate is overall becoming more socially liberal.And focusing on such an agenda is likely to distract from tackling thereal issues reducing trust in government.
To respond to the rising minor party vote, incumbents might appealto authoritarian instincts provoked by cultural insecurity. This mightbe the effect of ramping up national security laws (even if it is not the
263. Section 4.1.4 on page 32.264. Shorten (2017); and Massola (2017).265. Daley et al. (2013, p. 36).266. Van Onselen (2017); K. Murphy (2016); and R. Fitzgerald (2018).
Grattan Institute 2018 88
A crisis of trust: The rise of protest politics in Australia
intention).267 And the tightening of citizenship and migration laws mightalso suggest resistance to the ‘other’ feared particularly by some minorparty voters in regional areas.268 But unless they reduce net migration
267. National security measures adopted by the Turnbull and Abbott governments:the creation of the Department of Home Affairs, a ‘super-ministry’ that combinesborder security, the federal police, and intelligence operations under one roof(Yaxley (2017)); meta-data retention laws (Telecommunications (Interception and
Access) Amendment (Data Retention) Act 2015); the establishment of a schemefor the continuing detention of high-risk terrorist offenders who are consideredby a judge to pose an unacceptable risk to the community (Criminal Code
Amendment (High Risk Terrorist Offenders) Act 2016); increased monitoring andstrengthening of the counter-terrorism framework (Counter Terrorism Legislation
Amendment Act (No. 1) 2016); the increased ability for border protection officersto collect and store a broad range of personal identifiers (including photographsand fingerprints) of citizens and non-citizens at the border (Migration Amendment
(Strengthening Biometrics Integrity) Act 2015); the creation of mechanisms toautomatically revoke the citizenship of people who participate in terrorism-relatedoffences overseas (Australian Citizenship Amendment (Allegiance to Australia)
Act 2015); strengthening the capabilities of ASIO to conduct covert intelligenceoperations (National Security Legislation Amendment Act (No. 1) 2014); thestrengthening of border security measures, and providing for the cancellation ofwelfare payments to people involved in terrorism (Counter-Terrorism Legislation
Amendment (Foreign Fighters) Act 2014); and reductions to the amountof information required to apply for an interim control order, and increasedintelligence sharing between ASIS and the ADF (Counter-Terrorism Legislation
Amendment Act (No. 1) 2014).268. Citizenship and migration policies adopted by the Turnbull and Abbott govern-
ments include: strengthening the ability of the minister to cancel the visa ofpeople who do not pass general and character provisions (Migration Amendment
(Character and General Visa Cancellation) Act 2015, amended February 2017);measures to protect information given to the Department of Immigration byintelligence agencies from disclosure (Migration Amendment (Validation of
Decisions) Act 2017 ); criminalising the disclosure of information relating to borderforce activity and the establishment of a Border Force Commissioner (Australian
Border Force Act 2014, amended in Australian Border Force Amendment
(Protected Information) Act 2017 ); increasing the responsibility of asylum seekersto provide information relating to their application for temporary protection(Migration Amendment (Protection and Other Measures) Act 2015); provisionsto limit the ability for people who have had their visa cancelled, or an application
rates to near zero,269 such measures would do little to narrow thecultural gap that feeds the minor party vote in regional areas. Instead,such measures may well focus regional voters on the issues thatillustrate the cultural divide, and increase the appeal of minor parties.And such policies might well increase the cynicism of other voters andreduce their trust in government further.
7.5 The ultimate destination?
There are many lessons for politicians and the political class in therising minor party vote.
More of the same is likely to elicit the same result from voters: risingcynicism and more choosing to vote for ‘anyone but them’.
Alternatively, incumbent politicians could heed the warning signalsand focus on what matters to voters: restoring trust and social co-hesion. This will not be a quick process. But trust and cohesion canbe improved with an extended period of under-promising and quietover-delivery. And improving the integrity of the system can help toreduce the incidence of trust-sapping scandals.
As always, policy makers have choices. And those choices make adifference.
for a visa refused, to apply for a bridging visa (Migration Legislation Amendment
Act (No. 1) 2014); and the reintroduction of temporary protection visas andreinforcing the ability of the government to turn back boats.
269. As One Nation advocates. One Nation (2016).
Grattan Institute 2018 89
A crisis of trust: The rise of protest politics in Australia
Appendix A: The data used in this report
This report uses polling, survey data, and responses to focus groups todraw conclusions on voter attitudes across Australia. The main sourcesare:
• Election data, various years;
• The Australian Election Study, 2004-2016;
• The Scanlon Foundation studies, 2016 and 2017;
• Polling by Essential Research, (various years);
• Fairfax Political Personas Project, 2017;
• Vote Compass, 2016;
• Australian Marriage Law Postal Survey, 2017;
• The Mind and Mood Report: Life in Two Australias, by IPSOS,2013; and
• Regional consultations undertaken by Grattan Institute staff.
A.1 Election data
This report uses data on the first-preference Senate vote from theAustralian Electoral Commission.
The Australian Electoral Commission (AEC) provides the total numberof first-preference Senate votes for each candidate at each pollingplace. The AEC also provides the latitude and longitude coordinates ofmost polling places.270 The distance cited in this report of each pollingplace from the nearest capital city is the ‘haversine’ distance, which
270. AEC (2016a); AEC (2013); AEC (2010); AEC (2007); and AEC (2004).
gives the approximate distance between two points, given the curvatureof the Earth.
Polling places with no coordinates (such as mobile polling vans), nogiven coordinates (such as those assigned to multiple sites), or not inAustralia were excluded. Polling places in the external territories, suchas Cocos Islands, were included (where coordinates were supplied).
In counting votes at a particular polling place, we consider only‘ordinary votes’ – votes cast by electors within the division for whichthey are enrolled. More than 80 per cent of votes cast in the 2016election were ordinary votes. Postal votes, absent votes, provisionalvotes, and pre-poll votes were not included in the regional analysis,although they are included in the overall analysis.
A.2 Survey data
Sample size issues limit the extent to which we can identify attitudesof voters for particular minor parties and comparisons between them.Because of these issues we place more more weight on findings thatappear to be consistent between the surveys listed below.
Where possible, we have also provided error bars which show the95 per cent confidence interval for the mean. Charts depicting socialattitudes by party or by location combine responses where there wasno significant difference in attitudes between voters for particular minorparties, or between voters in particular locations.
Grattan Institute 2018 90
A crisis of trust: The rise of protest politics in Australia
A.2.1 The Australian Election Study, 2004-2016
Lead researchers (current): Ian McAllister, Clive Bean, Rachel Gibson,Toni Makkai.
Sample size: 2,818 (in 2016); 3,955 (in 2013); 2,214 (in 2010); 1,873(in 2007); 1,769 (in 2004).
Response rate (adjusted271) : 27 per cent in 2016; 34 per cent in 2013;43 per cent in 2010; 40 per cent in 2007; 45 per cent in 2004.
The Australian Election Study (AES) is a key source on Australiansocial attitudes.272 It is timed to coincide with Australian FederalElections. The studies reuse a common set of questions in order toprovide a long-term view on social attitudes. It is conducted by The
Australian National University (ANU). Since 2010 the surveys havebeen funded by Australian Research Council. In 2016, respondentsneeded to be eligible to vote in Australian elections; in earlier yearsrespondents needed to be enrolled to vote. The surveys aim to gathera nationally representative sample. Responses from the 2010, 2013,and 2016 surveys have been weighted.
This report uses publicly available data from the AES to calculateattitudes by region and by party voted for in the Senate. Figure 2.12uses AES data to calculate the demographic characteristics of minorparty voters.
Respondents’ location is self-reported, based on their estimation ofpopulation size of their community. For simplicity, this report combinesresponses from small and large country towns. The definition of eachcategory is as follows: Cities – over 100,000 people; Large towns –between 25-100,000 people; Large or small country towns – up to
271. The adjusted response rate accounts for the ‘out of scope’ sample (deceased,incapable, return to sender, not an Australian citizen).
272. AES (2016); AES (2013); AES (2010); AES (2007); and AES (2004).
25,000 people; Rural – little or no population. Nearly 300 responsescame from rural areas in 2016 (the smallest subgroup), compared to alittle under 1,500 responses from city areas (the largest subgroup).
Attitudes by party voted for in the Senate are categorised by respon-dents’ self-reported vote. Just over 70 respondents voted for OneNation in the 2016 AES, and 76 voted for the Nick Xenophon Team.Nearly 200 respondents voted for other minor parties. The largestsample was for the Liberal Party, with 970 respondents.
A.2.2 The Scanlon Foundation Surveys, 2016 and 2017
Lead researcher (current): Andrew Markus.
Sample size: 1,500 in 2016 and 2017. The studies occasionallycombine samples between years; 17,280 people have responded sincethe survey began in 2007.
Response rate: 45 per cent in 2017; 50 per cent in 2016.
The The Mapping Social Cohesion surveys are run by the Scanlon
Foundation in partnership with Monash University.273 The first surveywas conducted in 2007, and it has been conducted annually since2009. The 2017 national survey was complemented with a targetedsample of One Nation voters. This study does not provide data on theattitudes of voters for other minor parties. The 2017 study releasedattitudinal data by ABS Remoteness Areas. The 2016 study providesdata on minor party voters as a single group, and defines minorparty voters as anyone who didn’t vote for the Coalition, Labor, or theGreens. The survey sample is expected to give a maximum samplingerror of plus or minus 2.5 percentage points 95 per cent of the time.Andrew Markus provided additional data to Grattan that was notreleased in the publicly available summary report.
273. Markus (2017); and Markus (2016).
Grattan Institute 2018 91

A crisis of trust: The rise of protest politics in Australia
A.2.3 Polling by Essential Research, various years
Sample size: Approx. 1,000.
Response rate: 13-14 per cent.
Essential Research conducts regular polling on Australian politicalattitudes.274 Market research firm Your Source gathers data for Essen-tial Research through an online panel every fortnight. The panel is aself-managed online portal of over 100,000 members, most of whomwere recruited using offline technologies. Measures are in place toensure that panelists are not over-used and are authentic. An invitationto participate in the poll is sent out to approximately 7-8,000 panelmembers. The response rate varies, but usually delivers over 1,000responses. Essential Research estimates that there is a samplingerror of plus or minus 3 percentage points 95 per cent of the time. Thepolls define minor party voters as anyone who does not support theCoalition, Labor, or the Greens. The data is weighted to be nationallyrepresentative based on ABS data.
A.2.4 Fairfax Political Personas Project, 2017
Lead researcher: Jill Sheppard.
Sample size: 2,600.
Response rate: 79 per cent.
The Fairfax Political Personas study was conducted via the ANU SocialResearch Centre’s Life in Australia panel in conjunction with Fairfaxmedia.275 Members are randomly recruited to the panel and invited toparticipate in monthly surveys. The panel is designed to be nationallyrepresentative, and the survey responses are weighted. The PoliticalPersonas survey was conducted between the 1st of December and
274. For example, see Essential Research (2017f).275. Sheppard (2017).
22nd of December in 2016. Grattan categorised the responses to thesurvey into 2011 ABS Remoteness Areas by postcode,276 according tocorrespondences provided by the ABS.
A.2.5 Vote Compass, 2016
Vote Compass is an online tool run by the ABC which is designedto help people decide how to vote in an upcoming election.277 Thesoftware and questions are designed by political scientists in Australiaand overseas. The survey is weighted to ensure that the sample isnationally representative. More than 1 million people have participatedin the survey to date. Data on responses to some questions asked inthe survey was provided to Grattan at an electorate level for responsesreceived between May and July of 2016.
A.2.6 Australian Marriage Law Postal Survey
The Australian Marriage Law postal survey was conducted on behalfof the Federal Government by the ABS.278 People who are on theelectoral roll were sent a postal ballot on the issue of same-sex mar-riage. Results of the survey were released by electorate on the 15th ofNovember, 2016. Nearly 80 per cent of eligible voters participated inthe survey. Participation rates were higher in inner-city electorates, butwere not materially different elsewhere.
A.3 Focus groups and consultations
We use qualitative research to complement the survey data. Althoughthis research is not representative of general trends, it provides insightinto the way that national issues can play out at a local level.
276. 2011 Remoteness Areas were used as updated Remoteness Areas have not yetbeen released for the 2016 Census.
277. ABC News et al. (2016).278. ABS (2018d).
Grattan Institute 2018 92
A crisis of trust: The rise of protest politics in Australia
A.3.1 The Mind and Mood Report: Life in Two Australias, by
IPSOS
The IPSOS Mind and Mood reports use qualitative research methodsto understand the attitudes and values of different groups. Theresearch technique used for The Mind and Mood Report: Life in Two
Australias was group discussion.279 The groups used were affinitygroups (neighbours, friends or workmates), and the discussions wereheld in familiar environments, such as homes or offices. Direct ques-tions from the researcher were avoided to allow natural discussion onparticular topics to occur. Participants were aged from their late-teensto mid-70s, and mostly from a middle-class background. The fieldworkwas conducted in Sydney, Melbourne, Tamworth, Townsville andBunbury. 16 groups were interviewed in total. Emphasis is given tothose opinions and attitudes which appeared to be consistent acrossthe whole sample.
A.3.2 Grattan’s regional consultations
As a part of our research for this report, Grattan staff spoke withcouncillors, journalists, community leaders, and business groups inEmerald, Mildura, and Whyalla.
We chose these locations to get a diversity of views from regionalAustralians on the content of this report. Life is quite different for peoplein the three areas. Emerald is a small town located three hours westof Rockhampton, and is a part of the Bowen Basin mining region ofCentral Queensland. The town has a relatively small population, andfly-in fly-out workers are common. Mildura is a larger regional centrein north-west Victoria. Agriculture is an important source of income forthe Mildura area, though the services industry is also a big employer.About 30,000 people live there. Whyalla is a large town located in SA.
279. IPSOS (2013).
A significant proportion of the population works as technicians or tradesworkers, or as machinery operators.
Grattan’s consultations were informal, and should not be taken asindicative of broader social trends across regional Australia.
Grattan Institute 2018 93
A crisis of trust: The rise of protest politics in Australia
Bibliography
Analysis in this report used R 3.4.3: R Core Team (2017), including the followingpackages:
Arnold (2017) Bache and Wickham (2014)Bengtsson (2018) Breiman et al. (2015)Dowle and Srinivasan (2018) Eddelbuettel (2018)Fernihough (2014) Garnier (2018a)Garnier (2018b) Hocking (2017)Hothorn et al. (2017) Kahle and Wickham (2016)McMahon (2018) Raymond McTaggart et al. (2016)Microsoft (2018) Microsoft (2017)Parsonage (2017) Parsonage (2018a)Parsonage (2016) Parsonage et al. (2018)Parsonage (2018b) Ripley (2017)Robinson (2017) Ryan and Ulrich (2017)Sievert et al. (2017) Slowikowski (2017)Wickham (2017b) Wickham (2018)Wickham (2017a) Wickham (2017c)Wickham and Bryan (2017) Wickham and Chang (2016)Wickham et al. (2017) Wickham et al. (2018a)Wickham et al. (2018b) Wilke (2017)Zeileis et al. (2016) Zeileis et al. (2018)Zeileis and Lumley (2017)
ABC (2015). “Fact check: Does the China Free Trade Agreement threatenAustralian jobs?” ABC Online.http://www.abc.net.au/news/2015-08-12/china-free-trade-agreement-cost-australian-jobs-fact-check/6653214.
(2016). “Q&A: Professor Brian Cox takes on Senator MalcolmRoberts in climate change stoush”. ABC Online.http://www.abc.net.au/news/2016-08-16/professor-brian-cox-vs.-senator-malcolm-roberts/7746576.
ABC News (2014). “Submarine policy: Nick Xenophon urges PM to ’end theuncertainty’ over SA project”. ABC Online.http://www.abc.net.au/news/2014-09-08/xenophon-urges-pm-to-end-uncertainty-over-submarine-project/5727028.
(2016). Transcript: Pauline Hanson’s 2016 maiden speech to the
Senate. ABC News. http://www.abc.net.au/news/2016-09-15/pauline-hanson-maiden-speech-2016/7847136.
(2017). “Outpouring of Support for Jacqui Lambie’s emotional Senatespeech on social media”. ABC News.http://www.abc.net.au/news/2017-03-23/praise-for-lambies-emotional-senate-speech/8381726.
ABC News et al. (2016). ABC News, VOX Pop Labs and The University ofMelbourne. Vote Compass: 2016 Australia Votes.https://votecompass.abc.net.au/.
Abjorensen, N. (2010). “The Parties’ Democratic Deficit”. Inside Story.http://insidestory.org.au/the-parties-democratic-deficit/.
ABS (2014). General Social Survey. 4159.0. Australian Bureau of Statistics.http://www.abs.gov.au/ausstats/[email protected]/mf/4159.0.
(2015). Survey of Income and Housing, Australia, 2013-14. Cat.6553.0. Australian Bureau of Statistics. http://www.abs.gov.au/AUSSTATS/[email protected]/DetailsPage/6553.02013-14?OpenDocument.
(2016). Census of Population and Housing: Nature and Content,
Australia, 2016. Cat. 2008.0. Australian Bureau of Statistics.http://www.abs.gov.au/AUSSTATS/[email protected]/Lookup/2008.0Main+Features922016?OpenDocument.
(2017a). Australian National Accounts: National Income, Expenditure
and Product, Sep 2017. Cat. 5206.0. Australian Bureau of Statistics.http://www.abs.gov.au/AUSSTATS/[email protected]/DetailsPage/5206.0Sep%202017?OpenDocument.
Grattan Institute 2018 94
A crisis of trust: The rise of protest politics in Australia
ABS (2017b). Household Income and Wealth, Australia, 2015-16. Cat. 6523.0.Australian Bureau of Statistics. http://www.abs.gov.au/AUSSTATS/[email protected]/DetailsPage/6523.02015-16?OpenDocument.
(2017c). Estimates of Personal Income for Small Areas, 2011-2015.Cat. 6525.0.55.002. Australian Bureau of Statistics.http://www.abs.gov.au/AUSSTATS/[email protected]/Lookup/6524.0.55.002Main+Features12011-2015?OpenDocument.
(2017d). Regional Population Growth, Australia, 2016. Cat. 3218.0.Australian Bureau of Statistics. http://www.abs.gov.au/AUSSTATS/[email protected]/DetailsPage/3218.02016.
(2017e). Census of Population and Housing, Time Series Profiles
2006-2016. Cat. 2916.0. Australian Bureau of Statistics.http://www.abs.gov.au/websitedbs/censushome.nsf/home/communityprofiles?opendocument&navpos=230.
(2018a). Wage Price Index, Australia, Dec 2017. Cat. 6345.0.Australian Bureau of Statistics.http://www.abs.gov.au/ausstats/[email protected]/mf/6345.0.
(2018b). Consumer Price Index, Australia, Dec 2017. Cat. 6401.0.Australian Bureau of Statistics.http://www.abs.gov.au/ausstats/[email protected]/mf/6401.0.
(2018c). Labour Force, Australia, Jan 2018. Cat. 6202.0. AustralianBureau of Statistics.http://www.abs.gov.au/ausstats/[email protected]/mf/6202.0.
(2018d). Australian Marriage Law Postal Survey, 2017. Cat. 1800.0.Australian Bureau of Statistics. http://www.abs.gov.au/AUSSTATS/[email protected]/Lookup/1800.0Main+Features382017?OpenDocument.
(2018e). Characteristics of Employment, Australia, August 2017. Cat.6330.0. Australian Bureau of Statistics.http://www.abs.gov.au/AUSSTATS/[email protected]/Lookup/6333.0Main+Features1August%202017?OpenDocument.
AEC (2004). Virtual Tally Room: Senate results. Australian ElectoralCommission. http://results.aec.gov.au/12246/results/default.htm.
(2007). Virtual Tally Room: Senate results. Australian ElectoralCommission.http://results.aec.gov.au/13745/Website/SenateDownloadsMenu-13745-csv.htm.
(2010). Virtual Tally Room: Senate results. Australian ElectoralCommission. http://results.aec.gov.au/15508/Website/default.htm.
(2013). Virtual Tally Room: Senate results. Australian ElectoralCommission. http://results.aec.gov.au/17496/Website/Default.htm.
(2016a). Virtual Tally Room: Senate results. Australian ElectoralCommission.http://results.aec.gov.au/20499/Website/SenateDownloadsMenu-20499-Csv.htm.
(2016b). Informal voting. Australian Electoral Commission.http://aec.gov.au/About_AEC/research/files/informal-voting-2016.pdf.
AES (2001). 2001 Australia Election Study. Theme: Challenges togovernance.https://www.australianelectionstudy.org/voter_studies.html.
(2004). 2004 Australian Election Study. McAllister, I., Bean, C.,Gibson, R and Gow, D. Theme: The decline of political parties.https://www.australianelectionstudy.org/voter_studies.html.
(2007). 2007 Australian Election Study. McAllister, I., Bean, C. andGow, D. Theme: Democracy and representation.https://www.australianelectionstudy.org/voter_studies.html.
(2010). 2010 Australian Election Study. McAllister, I., Bean, C.,Gibson, R and Pietsch, J. Theme: The dynamics of political choice.https://www.australianelectionstudy.org/voter_studies.html.
(2013). 2013 Australian Election Study. McAllister, I., Bean, C.,Gibson, R and Pietsch, J. Theme: Volatility and electoral change.https://www.australianelectionstudy.org/voter_studies.html.
Grattan Institute 2018 95
A crisis of trust: The rise of protest politics in Australia
AES (2016). 2016 Australian Election Study. McAllister, I., Bean, C., Gibson,R. and Makkai, T. Theme: Political engagement among the young.http://australianelectionstudy.org/.
Aisch et al. (2016a). Aisch, G., Pearce, A. and Russell, K. “How Britain Votedin the E.U. Referendum”. The New York Times.https://www.nytimes.com/interactive/2016/06/24/world/europe/how-britain-voted-brexit-referendum.html?smid=tw-nytimes&smtyp=cur.
Aisch et al. (2016b). Aisch, G., Pearce, A. and Yourish, K. “How Large Is theDivide Between Red and Blue America?” The New York Times.https://www.nytimes.com/interactive/2016/11/04/us/politics/growing-divide-between-red-and-blue-america.html.
Aitkin, D. (2005). “Afterword: Return to ‘Countrymindedness’”. Struggle
country : the rural ideal in twentieth century Australia. Ed. byG. Davison and M. Brodie. Clayton, Vic. : Monash University ePress.
Akkerman et al. (2013). Akkerman, A., Mudde, C. and Zaslove, A. “HowPopulist Are the People? Measuring Populist Attitudes in Voters”.Comparative Political Studies 47.9, pp. 1324–1353.http://journals.sagepub.com/doi/abs/10.1177/0010414013512600.
Albrechtsen, J. (2016). “Cory Bernadi gives the silent majority a voice”. The
Australian.https://www.theaustralian.com.au/opinion/columnists/janet-albrechtsen/cory-bernardi-gives-the-silent-majority-a-voice-online/news-story/fdeba588a94d2bf7c171d8a1a2d8c337.
Alexander, C. (2013). “The party’s over: which clubs have the mostmembers?” Crikey. https://www.crikey.com.au/2013/07/18/the-partys-over-which-clubs-have-the-most-members/.
R. M. Alexander et al. (2009). Alexander, R. M., Mazza, S. W. and Scholz, S.“Measuring Rates of Return for Lobbying Expenditures: An EmpiricalCase Study of Tax Breaks for Multinational Corporations”. Journal of
Law and Politics 25.401.https://papers.ssrn.com/sol3/papers.cfm?abstract_id=1375082.
Armstrong, S. (2015). The economic impact of the Australia–United States
free trade agreement. Australia-Japan Research Centre.https://crawford.anu.edu.au/pdf/ajrc/wpapers/2015/201501.pdf.
Arnold, J. B. (2017). ggthemes: Extra Themes, Scales and Geoms for
’ggplot2’. R package version 3.4.0.https://CRAN.R-project.org/package=ggthemes.
ATO (2017). Taxation Statistics 2014-15. Australian Taxation Office.https://www.ato.gov.au/About-ATO/Research-and-statistics/In-detail/Taxation-statistics/Taxation-statistics-2014-15/.
Aulby, H. (2017). The case for a federal corruption watchdog. Discussionpaper. The Australia Institute.http://www.tai.org.au/content/federal-icac-needed-fill-gaps.
Autor et al. (2016). Autor, D., Dorn, D., Hanson, G. and Majilesi, K. Importing
Political Polarization? The Electoral Consequences of Rising Trade
Exposure. NBER. http://www.nber.org/papers/w22637.
Bache, S. M. and Wickham, H. (2014). magrittr: A Forward-Pipe Operator for
R. R package version 1.5.https://CRAN.R-project.org/package=magrittr.
Barth, M. (2016). The Politics of Rage. Barclays.https://www.investmentbank.barclays.com/our-insights/politics-of-rage.html.
Bastian, B. (2012). “Immigration, Multiculturalism and the Changing Face ofAustralia”. Peace Psychology in Australia. Ed. by D. Bretherton andN. Balvin. Boston, MA: Springer US, pp. 55–70.http://dx.doi.org/10.1007/978-1-4614-1403-2_4.
Beauchamp, Z. (2017). “White Riot”. Vox. http://www.vox.com/2016/9/19/12933072/far-right-white-riot-trump-brexit.
Beck, U. (2007). “A new cosmopolitanism is in the air”. Sign and Sight.http://www.signandsight.com/features/1603.html.
Becker et al. (2017). Becker, S., Fetzer, T. and Novy, D. Who Voted for Brexit?
A Comprehensive District Level Analysis. CESifo Group. https://www.econstor.eu/bitstream/10419/161877/1/cesifo1_wp6438.pdf.
Grattan Institute 2018 96
A crisis of trust: The rise of protest politics in Australia
Bélanger, É. (2004). “Antipartyism and Third-Party Vote Choice”. Comparative
Political Studies 37.9, pp. 1054–1078.http://journals.sagepub.com/doi/abs/10.1177/0010414004268847.
(2017). “Political trust and voting behaviour”. Handbook on Political
Trust. Ed. by S. Zmerli and T. W.G. van der Meer. Elgar Publishing.Chap. 15.
Bélanger, É. and Nadeau, R. (2005). “Political trust and the vote in multipartyelections: The Canadian case”. European Journal of Political
Research 44.1, pp. 121–146. DOI:10.1111/j.1475-6765.2005.00221.x.https://doi.org/10.1111/j.1475-6765.2005.00221.x.
Bengtsson, H. (2018). matrixStats: Functions that Apply to Rows and Columns
of Matrices (and to Vectors). R package version 0.53.1.https://CRAN.R-project.org/package=matrixStats.
Berelson et al. (1954). Berelson, B. R., Lazarsfeld, P. F. and MacPhee, W. N.Voting. University of Chicago Press.
Bernardi, C. (2017). Cory Bernardi. Facebook post following 2017 Budgetannouncement.https://www.facebook.com/Bernardi.Cory/posts/10155358495493216.
Bettencourt et al. (2007). Bettencourt, L., Lobo, H., Helbing, D., Kuhnert, C.and West, G. “Growth, Innovation, Scaling, and the Pace of Life inCities”. Proceedings of the National Academy of Sciences 104.17.http://www.uvm.edu/pdodds/files/papers/others/2007/bettencourt2007ua.pdf.
Biggs, M. and Knauss, S. (2012). “Explaining Membership in the BritishNational Party: A Multilevel Analysis of Contact and Threat”.European Sociological Review 28.5, pp. 633–646. https://academic.oup.com/esr/article-abstract/28/5/633/562719/Explaining-Membership-in-the-British-National?redirectedFrom=PDF.
Blackwood, E. (2017). “Queensland elections: Party donations revealed in newreal-time electronic disclosure”. ABC News.http://www.abc.net.au/news/2017-11-12/online-disclosure-reveals-queensland-election-party-donations/9141352.
Botterill, L. C. and Cockfield, G. (2015). “From ’Unstable’ to ’Stable’ MinorityGovernment: Reflections on the Role of the Nationals in FederalCoalition Governments”. Australian Journal of Politics & History 61.1,pp. 53–66. https://ezp.lib.unimelb.edu.au/login?url=https://search.ebscohost.com/login.aspx?direct=true&db=a9h&AN=101712495&site=eds-live&scope=site.
Bourne et al. (2017). Bourne, K., Nash, A. and Houghton, K. Pillars of
communities: Service delivery professionals in small Australian towns
1981-2011. Regional Australia Institute.http://www.regionalaustralia.org.au/home/wp-content/uploads/2017/12/RAI_Pillars-of-Communities_Small-Towns-Report.pdf.
Bowe, W. (2017). Same-sex marriage survey: 61.6 yes, 38.4 no: And the
winner is... The Poll Bludger.https://www.pollbludger.net/2017/11/15/sex-marriage-survey-61-6-yes-38-4-no/.
Bowler, S. and Denemark, D. (1993). “Split ticket voting in Australia:Dealignment and inconsistent votes reconsidered”. Australian Journal
of Political Science 28.1, pp. 19–37. DOI:10.1080/00323269308402223.https://doi.org/10.1080/00323269308402223.
Bracks et al. (2011). Bracks, S., Faulkner, J. and Carr, B. 2010 National
Review: Report to the ALP National Executive. Australian LaborParty.http://resources.news.com.au/files/2011/02/18/1226008/222073-labor-review-report.pdf.
Bramston, T. (2015). “Membership reforms see recruits rally to Labor cause”.The Australian. https://www.theaustralian.com.au/national-affairs/membership-reforms-see-recruits-rally-to-labor-cause/news-story/9c7e3c8507295e97f9b47b960535be00.
Breiman et al. (2015). Breiman, L., Cutler, A., Liaw, A. and Wiener, M.randomForest: Breiman and Cutler’s Random Forests for
Classification and Regression. R package version 4.6-12.https://CRAN.R-project.org/package=randomForest.
Grattan Institute 2018 97

A crisis of trust: The rise of protest politics in Australia
Brett, J. (2011). “Fair Share: Country and City in Australia”. Quarterly Essay
42. https://www.quarterlyessay.com.au/essay/2011/06/fair-share.
Breunig et al. (2017). Breunig, R., Deutscher, N. and To, H. T. “TheRelationship between Immigration to Australia and the Labour MarketOutcomes of Australian-Born Workers”. Economic Record 93.301,pp. 255–276. http://dx.doi.org/10.1111/1475-4932.12328.
Brownstein, R. (2016). How the Election Revealed the Divide Between City
and Country. The Atlantic.https://www.theatlantic.com/politics/archive/2016/11/clinton-trump-city-country-divide/507902/.
Brownstein, R. and Askarinam, L. (2016). The Tipping Points of the 2016
Election. The Atlantic.https://www.theatlantic.com/politics/archive/2016/10/the-tipping-points-of-the-2016-election/505238/.
Cabrera, L. (2010). The Practice of Global Citizenship. Cambridge UniversityPress.
Cameron, S. M. and McAllister, I. (2016). Trends in Australian Political Opinion
Results from the Australian Election Study 1987 - 2016. ANU Schoolof Politics et al. http://ada.edu.au/ADAData/AES/Trends%20in%20Australian%20Political%20Opinion%201987-2016.pdf.
Campbell Angus Converse E. Philip, M. E. W. and E.Donald, S. (1980). The
American Voter. University of Chicago Press.
Capic et al. (2017). Capic, T., Hutchinson, D., Fuller-Tyszkiewicz, M.,Richardson, B., Hartley-Clark, L., Khor, S., Olsson, C. andCummins, R. Australian Unity Wellbeing Index; Survey 34: Summary
Report.https://www.australianunity.com.au/~/media/corporate/documents/annual%20reports/wellbeing%20index/wellbeing%20index%202017.pdf?la=en&hash=71921E6FF43A64A470299CCCBFD9A769F97746A4.
Carnes, N. and Lupu, N. (2017). “It’s time to bust the myth: Most Trump voterswere not working class”. Washington Post.https://www.washingtonpost.com/news/monkey-cage/wp/2017/06/05/its-time-to-bust-the-myth-most-trump-voters-were-not-working-class/?utm_term=.7f5a16a62e11.
Cassells et al. (2017). Cassells, R., Dockery, M., Duncan, A. and Seymour, R.Educate Australia Fair? Education Inequality in Australia. BankwestCurtin Economics Centre. http://bcec.edu.au/publications/educate-australia-fair-education-inequality-australia/.
Cavalier, R. (2010). Power crisis: the self-destruction of a state Labor Party.Australian encounters. Port Melbourne, Vic. : Cambridge UniversityPress, 2010.
CGC (2015). Report on GST Revenue Sharing Relativities 2015 Review -
Volume 1. Commonwealth Grants Commission. https://cgc.gov.au/index.php?option=com_content&view=article&id=219&Itemid=318.
Charlton, A. (2017). The great tipping point. Accessed 9-Mar-2018.https://andrewcharlton.com/2017/03/26/httpstwitter-comalphabetanewsstatus842847518387924992/.
Chase, J. (2017). AfD: What you need to know about Germany’s far-right
party. Deutsche Welle. http://www.dw.com/en/afd-what-you-need-to-know-about-germanys-far-right-party/a-37208199.
Clarke, J. and Newman, J. (2017). “‘People in this country have had enough ofexperts’: Brexit and the paradoxes of populism”. Critical Policy
Studies 11.1, pp. 101–116.https://doi.org/10.1080/19460171.2017.1282376.
Clune, B. (2013). Are fact-checking sites a symptom of the media not doing its
job? The Guardian.https://www.theguardian.com/commentisfree/2013/jul/16/data-journalism-fact-checking-australia.
Cocco, F. (2017). “Voters want hard borders and free trade, Brexit surveyfinds”. Financial Times. https://www.ft.com/content/3086af7e-0e42-11e7-b030-768954394623.
Grattan Institute 2018 98
A crisis of trust: The rise of protest politics in Australia
Cockfield, G. (2009). “A rural party in an urban nation”. The National Party:
Prospects for the Great Survivors. Ed. by G. Cockfield andL. C. Botterill. Allen & Unwin.
Coorey, P. (2017). Call to undo Liberals Nationals coalition to fend off One
Nation. Financial Review.http://www.afr.com/news/call-to-undo-liberals-nationals-coalition-to-fend-off-one-nation-20170227-gump8d.
Cowen, T. (2016). “Why Brexit happened and what it means”. Marginal
Revolution.http://marginalrevolution.com/marginalrevolution/2016/06/why-brexit-happened-the-lens-of-japan.html.
Crosby, K. (2017). Populism, Populist, or Personality? Australian PoliticalStudies Association. https://opus.lib.uts.edu.au/bitstream/10453/118337/1/Populism%20populist%20personality_%20Crosby.pdf.
Cross, W. and Gauja, A. (2014). “Evolving membership strategies in Australianpolitical parties”. Australian Journal of Political Science 49.4,pp. 611–625. https://doi.org/10.1080/10361146.2014.958979.
Daley, J. and Lancy, A. (2011). Investing in regions: Making a difference.Report No. 2011-4. Grattan Institute. https://grattan.edu.au/report/investing-in-regions-making-a-difference/.
Daley et al. (2012). Daley, J., McGannon, C. and Ginnivan, L. Game-changers:
Economic reform priorities for Australia. Grattan Institute.https://grattan.edu.au/report/game-changers-economic-reform-priorities-for-australia/.
Daley et al. (2013). Daley, J., McGannon, C. and Savage, J. Budget Pressures
on Australian Governments. Grattan Institute.http://grattan.edu.au/report/budget-pressures-on-australian-governments/.
Daley et al. (2017). Daley, J., Wood, D. and Chivers, C. Regional patterns of
Australia’s economy and population. Grattan Institute.https://grattan.edu.au/wp-content/uploads/2017/08/890-Regional-patterns.pdf.
Daley et al. (2018). Daley, J., Coates, B. and Wiltshire, T. Housing affordability:
re-imagining the Australian dream. Grattan Report No. 2018-04.Grattan Institute. https://grattan.edu.au/report/housing-affordability-re-imagining-the-australian-dream/.
Davey, P. (2010). 90 not out: The National Party of Australia, 1920-2010.University of New South Wales Press.https://trove.nla.gov.au/work/36364893?q&versionId=46818006.
Derryn Hinch’s Justice Party (2017a). Dying with Dignity.https://www.justiceparty.com.au/our-policies/voluntary-euthanasia/.
(2017b). What We Stand For.https://www.justiceparty.com.au/our-policies/.
Dickson, S. (2017). Queensland One Nation to Invest Cross River Rail Billions
Into Visionary Projects That Are Needed Now.http://www.stevedickson.com.au/media-release/queensland-one-nation-to-invest-cross-river-rail-billions-into-visionary-projects-that-are-needed-now/.
Dippel et al. (2015). Dippel, C., Gold, R. and Heblich, S. Globalization and its
(Dis-)content: Trade Shocks and Voting Behaviour. NBER.http://www.nber.org/papers/w21812.pdf.
Dodds, L. and Akkoc, R. (2015). Mapped: where is Ukip’s support strongest?
Where there are no immigrants. The Telegraph. http://www.telegraph.co.uk/news/politics/ukip/11539388/Mapped-where-is-Ukips-support-strongest-Where-there-are-no-immigrants.html.
DoJSB (2017). SA2 Data tables - Small Area Labour Markets - September
quarter 2017. Department of Jobs and Small Business.https://docs.jobs.gov.au/documents/sa2-data-tables-small-area-labour-markets-september-quarter-2015.
Donaldson et al. (2016). Donaldson, P., Rockloff, M., Browne, M.,Sorenson, C.-M., Langham, E. and Li, E. “Attitudes TowardsGambling and Gambling Reform in Australia”. Journal of Gambling
Studies 32.1, pp. 243–259.https://link.springer.com/article/10.1007/s10899-015-9529-y.
Grattan Institute 2018 99
A crisis of trust: The rise of protest politics in Australia
Dornan, T. (2018). Conservatives revive nuke dump plan for SA. Yahoo News.https://au.news.yahoo.com/sa/a/39312530/sa-conservatives-campaign-gets-underway/.
Doughney, J. (2012). “Pokies reforms explained: how good intentions werederailed”. The Conversation. https://theconversation.com/pokies-reforms-explained-how-good-intentions-were-derailed-5001.
Dow Jones (2018). Factiva Database.https://www.dowjones.com/products/factiva/.
Dowding, K. and Martin, A. (2017). Policy Agendas in Australia. PalgraveMacmillan. https://www.palgrave.com/gp/book/9783319408040.
Dowle, M. and Srinivasan, A. (2018). data.table: Extension of ‘data.frame‘. Rpackage version 1.10.5. http://r-datatable.com.
Downs, A. (1957). “An economic theory of political action in a democracy”.Journal of political economy 65.2, pp. 135–150.
Duncan, C. and Epps, W. (1992). “The demise of ‘countrymindedness’: Newplayers or changing values in Australian rural politics?” Political
Geography 11.5, pp. 430–448.http://www.sciencedirect.com/science/article/pii/096262989290035R.
Eddelbuettel, D. (2018). digest: Create Compact Hash Digests of R Objects. Rpackage version 0.6.15. https://CRAN.R-project.org/package=digest.
Edelman (2016). 2016 Edelman Trust Barometer Global Report. https://www.edelman.com/research/2016-trust-barometer-global-results.
(2017). 2017 Edelman Trust Barometer Global Report.https://www.edelman.com/trust2017/.
(2018). 2018 Edelman Trust Barometer Global Report.http://cms.edelman.com/sites/default/files/2018-02/2018_Edelman_Trust_Barometer_Global_Report_FEB.pdf.
Edwards, B. (2017). Submission to Select Committee into the Political
Influence of Donations, Submission 22. Parliament of Australia.https://www.aph.gov.au/Parliamentary_Business/Committees/Senate/Political_Influence_of_Donations/PoliticalDonations/Submissions.
Eger, M. A. and Bohman, A. (2016). “The political consequences ofcontemporary immigration”. Sociology Compass 10.10, pp. 877–892.
Essential Research (2015). Privatisation. Essential Research.http://www.essentialvision.com.au/privatisation.
(2016a). State of the economy. Essential Research.http://www.essentialvision.com.au/state-of-the-economy-15.
(2016b). Social Class Identification. Essential Research.http://www.essentialvision.com.au/social-class-identification-5.
(2016c). Globalisation. Essential Research.http://www.essentialvision.com.au/globalisation.
(2016d). The Essential Report. Essential Research.http://www.essentialvision.com.au/wp-content/uploads/2016/11/Essential-Report_161122.pdf.
(2016e). Life compared to 50 years ago. Essential Research.http://www.essentialvision.com.au/life-compared-to-50-years-ago.
(2016f). Statements about Australia. Essential Research.http://www.essentialvision.com.au/statements-about-australia.
(2016g). Life for next generation. Essential Research.http://www.essentialvision.com.au/life-for-next-generation.
(2016h). Contributions of Multiculturalism. Essential Research.http://www.essentialvision.com.au/contribution-of-multiculturalism-4.
(2017a). Reduction in Sunday penalty rates. Essential Research.http://www.essentialvision.com.au/reduction-in-sunday-penalty-rates.
(2017b). Important Issues. Essential Research.http://www.essentialvision.com.au/important-issues-4.
(2017c). Statements about politics. Essential Research.http://www.essentialvision.com.au/statements-about-politics.
(2017d). Public statues. Essential Research.http://www.essentialvision.com.au/public-statues.
Grattan Institute 2018 100
A crisis of trust: The rise of protest politics in Australia
Essential Research (2017e). Date of Australia Day. Essential Research.http://www.essentialvision.com.au/date-of-australia-day-2.
(2017f). Trust in Institutions. Essential Research.http://www.essentialvision.com.au/trust-in-institutions-10.
(2017g). Attributes of the Liberal Party. Essential Research.http://www.essentialvision.com.au/attributes-liberal-party.
(2017h). Attributes of the Labor Party. Essential Research.http://www.essentialvision.com.au/attributes-labor-party.
(2017i). Australian society. Essential Research.http://www.essentialvision.com.au/australian-society-2.
(2018). Australian society. Essential Research.http://www.essentialvision.com.au/australian-society-3.
Esses et al. (1998). Esses, V., Jackson, L. M. and Armstrong, T. L. “IntergroupCompetition and Attitudes Toward Immigrants and Immigration: AnInstrumental Model of Group Conflict”. Journal of Social Issues 54.4,pp. 699–724.
Evans et al. (2017). Evans, M., Halupka, M. and Stoker, G. How Australians
imagine their democracy. http://www.governanceinstitute.edu.au/magma/media/upload/publication/408_Democracy100-report-IGPA.pdf.
Fernihough, A. (2014). mfx: Marginal Effects, Odds Ratios and Incidence Rate
Ratios for GLMs. R package version 1.1.https://CRAN.R-project.org/package=mfx.
Fingerhut, H. (2016). In ‘political correctness’ debate, most Americans think
too many people are easily offended. Pew Research Centre. http://www.pewresearch.org/fact-tank/2016/07/20/in-political-correctness-debate-most-americans-think-too-many-people-are-easily-offended/.
Fitzgerald, B. (2016). “Whyalla steelworks may not need taxpayer-fundedbailout”. The Australian.https://www.theaustralian.com.au/national-affairs/state-politics/whyalla-steelworks-may-not-need-taxpayerfunded-bailout/news-story/d95189c034e7eb450ffaefaee3d0a64a.
Fitzgerald, R. (2018). Malcolm Turnbull now just keeping seat warm for next
PM. The Australian.https://www.theaustralian.com.au/opinion/columnists/ross-fitzgerald/malcolm-turnbull-now-just-keeping-seat-warm-for-next-pm/news-story/68401ec163e67fd596ecf78899a05aa6.
Florida, R. and Johnson, S. (2012). What Republicans Are Really Up Against:
Population Density. CityLab.https://www.citylab.com/equity/2012/11/what-republicans-are-really-against-population-density/3953/.
Forrest, J. and Dunn, K. (2006). “Racism and Intolerance in Eastern Australia:A geographic perspective”. Australian Geographer 37.2, pp. 167–186.
Funke et al. (2016). Funke, M., Schularick, M. and Trebesch, C. “Going toExtremes: Politics After Financial Crises, 1870–2014”. European
Economic Review 88.1, pp. 227–260. http://www.sciencedirect.com/science/article/pii/S0014292116300587.
Garnier, S. (2018a). viridis: Default Color Maps from ’matplotlib’. R packageversion 0.5.0. https://CRAN.R-project.org/package=viridis.
(2018b). viridisLite: Default Color Maps from ’matplotlib’ (Lite
Version). R package version 0.3.0.https://CRAN.R-project.org/package=viridisLite.
Goodhart, D. (2017). The road to somewhere: the populist revolt and the
future of politics. Oxford University Press.https://books.google.com.au/books/about/The_Road_to_Somewhere.html?id=NOZxDgAAQBAJ&redir_esc=y.
Goss et al. (2016). Goss, P., Sonnemann, J., Chisholm, C. and Nelson, L.Widening gaps: what NAPLAN tells us about student progress.Grattan Institute. https://grattan.edu.au/report/widening-gaps/.
Grattan, M. (2014). “Integrity in politics”. The Conversation.https://theconversation.com/integrity-in-politics-34360.
Grattan Institute 2018 101
A crisis of trust: The rise of protest politics in Australia
Grattan, M. (2016). “Brandis says Queensland Liberal National Party mergercould be revisited”. The Conversation.https://theconversation.com/brandis-says-queensland-liberal-national-party-merger-could-be-revisited-69149.
Graves, L. (2016). Deciding what’s true: the rise of political fact-checking in
American journalism. Columbia University Press.https://cup.columbia.edu/book/deciding-whats-true/9780231542227.
Grechyna, D. (2016). “On the determinants of political polarization”.Economics Letters 144, pp. 10–14.https://doi.org/10.1016/j.econlet.2016.04.018.
Haidt, J. (2016a). “When and Why Nationalism Beats Globalism”. The
American Interest 12.1.http://www.the-american-interest.com/2016/07/10/when-and-why-nationalism-beats-globalism/.
(2016b). “The Ethics of Globalism, Nationalism, and Patriotism”.Minding Nature 9.3, pp. 18–24. http://www.humansandnature.org/the-ethics-of-globalism-nationalism-and-patriotism.
Harrison, D. (2013). Labor to back Coalition in scrapping of pokie reforms. TheSydney Morning Herald.http://www.smh.com.au/federal-politics/political-news/labor-to-back-coalition-in-scrapping-of-pokie-reforms-20131210-2z2vv.html.
Hawdon, J. (2012). “Applying differential association theory to online hategroups: a theoretical statement”. Research on Finnish Society 5,pp. 39–47. https://vtechworks.lib.vt.edu/bitstream/handle/10919/46864/rfs_Hawdon_2012.pdf?sequence=1&isAllowed=y.
Hellwig, T. and McAllister, I. (2016). “Does the economy matter? Economicperceptions and the vote in Australia”. Australian Journal of Political
Science 51.2, pp. 236–254.http://dx.doi.org/10.1080/10361146.2015.1135306.
Hetherington, M. J. (1999). “The Effect of Political Trust on the PresidentialVote, 1968-96”. The American Political Science Review 93.2,pp. 311–326. https://www.jstor.org/stable/2585398?seq=1#page_scan_tab_contents.
Hibbing et al. (2014). Hibbing, J. R., Smith, K. B. and Alford, J. R. “Differencesin negativity bias underlie variations in political ideology”. Behavioural
and Brain Sciences 37.3, pp. 297–307.https://www.cambridge.org/core/journals/behavioral-and-brain-sciences/article/differences-in-negativity-bias-underlie-variations-in-political-ideology/72A29464D2FD037B03F7485616929560.
Hirschman, A. (1970). Exit, Voice, and Loyalty. Harvard University Press.ISBN: 0-674-27660-4. https://books.google.com.au/books/about/Exit_Voice_and_Loyalty.html?id=vYO6sDvjvcgC&redir_esc=y.
Hocking, T. D. (2017). directlabels: Direct Labels for Multicolor Plots. Rpackage version 2017.03.31.https://CRAN.R-project.org/package=directlabels.
Hooghe et al. (2011). Hooghe, M., Marien, S. and Pauwels, T. “Where DoDistrusting Voters Turn if There is No Viable Exit or Voice Option?The Impact of Political Trust on Electoral Behaviour in the BelgianRegional Elections of June 2009”. Government and Opposition 46.2,pp. 245–273. http://dx.doi.org/10.1111/j.1477-7053.2010.01338.x.
Hooghe, M. and Dassonneville, R. (2016). A Spiral of Distrust: A Panel Study
on the Relation between Political Distrust and Protest Voting in
Belgium. Government, Opposition and Cambridge University Press.https://www.cambridge.org/core/journals/government-and-opposition/article/a-spiral-of-distrust-a-panel-study-on-the-relation-between-political-distrust-and-protest-voting-in-belgium/561B04EAC73E80409F138B8B03CFA979.
Horne, N. (2010). Hung parliaments and minority governments. ParliamentaryLibrary Australia.https://www.aph.gov.au/About_Parliament/Parliamentary_Departments/Parliamentary_Library/pubs/BN/1011/HungParliaments.
Hothorn et al. (2017). Hothorn, T., Zeileis, A., Farebrother, R. W. andCummins, C. lmtest: Testing Linear Regression Models. R packageversion 0.9-35. https://CRAN.R-project.org/package=lmtest.
Grattan Institute 2018 102
A crisis of trust: The rise of protest politics in Australia
Hunter, F. and Preiss, B. (2018). “Victorians scared to go to restaurants atnight because of street gang violence: Peter Dutton”. Sydney Morning
Herald. https://www.smh.com.au/politics/federal/victorians-scared-to-go-to-restaurants-at-night-because-of-street-gang-violence-peter-dutton-20180103-h0cvu4.html.
IBAC (2017). Exposing and preventing corruption in Victoria - Special report
on IBAC’s first five years. Independent Broad-based Anti-corruptionCommission. http://www.ibac.vic.gov.au/publications-and-resources/article/exposing-and-preventing-corruption-in-victoria-special-report-on-ibacs-first-five-years.
Inglehart, R. and Norris, P. (2016). Trump, Brexit, and the rise of Populism:
Economic have-nots and cultural backlash. Harvard Kennedy School.https://papers.ssrn.com/sol3/papers.cfm?abstract_id=2818659.
IPSOS (2013). The Mind and Mood Report: Life in Two Australias. IPSOS.
Jacqui Lambie Network (2016). Federal Anti-Corruption body or ICAC
supported by JLN. http://www.senatorlambie.com.au/2016/06/federal-anti-corruption-body-or-icac-supported-by-jln/.
(2017). Cleaning Up Politics.http://www.lambienetwork.com.au/cleaning_up_politics.
(2018a). Home Page. http://www.senatorlambie.com.au/.
(2018b). Issues. https://www.lambienetwork.com.au/issues.
Jennings, W. and Stoker, G. (2016). “The Bifurcation of Politics: TwoEnglands”. The Political Quarterly 87.3, pp. 372–382.http://dx.doi.org/10.1111/1467-923X.12228.
Johansson et al. (2017). Johansson, A., Caccavello, G. and Sandell, C.Authoritarian Populism Index 2017. Timbro. https://ieaepicenter1.wpengine.com/wp-content/uploads/2017/07/TIMBRO-Authoritarian-Populism-Index-2017-Briefing.pdf.
Jones, K. (2008). “Professional Politicians as the Subjects of Moral Panic”.Australian Journal of Political Science 43.2, pp. 243–258.https://www.tandfonline.com/doi/abs/10.1080/10361140802035762.
Kahle, D. and Wickham, H. (2016). ggmap: Spatial Visualization with ggplot2.R package version 2.6.1.https://CRAN.R-project.org/package=ggmap.
Kaletsky, A. (2016). “Trump’s rise and Brexit vote are more an outcome ofculture than economics”. The Guardian.https://www.theguardian.com/business/2016/oct/28/trumps-rise-and-brexit-vote-are-more-an-outcome-of-culture-than-economics.
Katter’s Australian Party (2016). Essential public assets and infrastructure.https://www.ausparty.org.au/page/attachment/42/essential-public-assets-and-infrastructure.
(2017). Katter: who the bloody hell on earth does Free Trade???
https://www.bobkatter.com.au/module/latestNews/view/771/katter-who-the-bloody-hell-on-earth-does-free-trade/media-releases.
Kaufman, E. (2016). It’s NOT the economy, stupid: Brexit as a story of
personal values. The London School of Economics and PoliticalScience.http://blogs.lse.ac.uk/politicsandpolicy/personal-values-brexit-vote/.
Kirk, A. and Scott, P. (2017). “French election results: How the Parliamentlooks as Macron’s party claims an astounding majority”. The
Telegraph. https://www.telegraph.co.uk/news/2017/06/19/french-election-results-new-parliament-looks-macrons-new-party.
Kleingeld, P. (2013). “Cosmopolitanism”. International Encyclopedia of Ethics.http://dx.doi.org/10.1002/9781444367072.wbiee629.pub2.
Krueger, J. and Jaeger, B. (2016). “The Personality of Brexit Voters”.Psychology Today. https://www.psychologytoday.com/blog/one-among-many/201606/the-personality-brexit-voters.
Krugman, P. (2012). “The New Political Correctness”. The New York Times.https://krugman.blogs.nytimes.com/2012/05/26/the-new-political-correctness/.
Grattan Institute 2018 103
A crisis of trust: The rise of protest politics in Australia
Lamberts, R. (2017). “Distrust of experts happens when we forget they arehuman beings”. The Conversation.https://theconversation.com/distrust-of-experts-happens-when-we-forget-they-are-human-beings-76219.
Lateline (2016). “Gambling reform: Nick Xenophon, Andrew Wilkie to takepokies fight to marginal seats”. ABC.http://www.abc.net.au/news/2016-07-19/xenophon,-wilkie-to-take-pokies-fight-to-marginal-seats/7642218.
Latham, M. (2002). Grievance Debate, Politics: new correctness (speech).
Leigh, A. (2005). “Economic Voting and Electoral Behaviour: How doIndividual, Local and National Factors Affect the Partisan Choice?”Economics and Politics 17.2. http://onlinelibrary.wiley.com/doi/10.1111/j.1468-0343.2005.00154.x/full.
(2017). Choosing Openness: A Lowy Institute Paper: Why Global
Engagement is Best For Australia. Penguin Specials. ISBN:9780143788317. https://www.penguin.com.au/books/choosing-openness-a-lowy-institute-paper-penguin-special-9780143788317.
Liberal Democrats Party (2006). Lifestyle Choices.https://www.ldp.org.au/lifestyle_choices.
(2012). Immigration. https://www.ldp.org.au/immigration.
(2015). Euthanasia. http://www.ldp.org.au/euthanasia.
Liberal Party of Australia (2018). Our Structure.https://www.liberal.org.au/our-structure.
Liddy, M. (2010). “Labor’s minority government explained”. ABC Online.http://www.abc.net.au/news/2010-09-08/labors-minority-government-explained/2253236.
(2016). “US election: Who voted for Donald Trump?” ABC News.http://www.abc.net.au/news/2016-11-10/us-election-donald-trump-voters-exit-polls/8012158.
Lind, M. (1994). “In Defense of Liberal Nationalism”. Foreign Affairs.https://www.foreignaffairs.com/articles/1994-05-01/defense-liberal-nationalism.
Livingstone, C. (2015). “Bright lights, big losses: how poker machines createaddicts and rob them blind”. The Conversation.https://theconversation.com/bright-lights-big-losses-how-poker-machines-create-addicts-and-rob-them-blind-49143.
(2017). “Pokies, sport and racing harm 41% of monthly gamblers:survey”. The Conversation. https://theconversation.com/pokies-sport-and-racing-harm-41-of-monthly-gamblers-survey-81486.
Livingstone, C. and Woolley, R. (2007). “Risky Business: A Few Provocationson the Regulation of Electronic Gaming Machines”. International
Gambling Studies 7.3, pp. 361–376.https://doi.org/10.1080/14459790701601810.
Lowy Institute (2017). Governing in an era of distrust (presentation at IPAA
Victoria Public Sector Week, 2017).
Lowy Interpreter (2017). Sam Dastyari and Chinese government influence in
Australia. Lowy Institute. https://www.lowyinstitute.org/the-interpreter/dastyari-and-chinese-government-influence-australia.
Lumb, M. (2013). The 43rd Parliament: traits and trends. ParliamentaryLibrary. https://www.aph.gov.au/About_Parliament/Parliamentary_Departments/Parliamentary_Library/pubs/rp/rp1314/43rdParl#_ftn18.
Lutton, E. (2017). The long-suffering Qld towns that could be the next property
hotspots. Domain.https://www.domain.com.au/news/the-longsuffering-qld-towns-that-could-be-the-next-property-hotspots-20170817-gxx820/.
Malgouyres, C. (2017). Trade Shocks and Far Right Voting: Evidence from
French Presidential Elections. Robert Schuman Centre for AdvancedStudies.https://papers.ssrn.com/sol3/papers.cfm?abstract_id=2942173.
Grattan Institute 2018 104
A crisis of trust: The rise of protest politics in Australia
Mance, H. (2016). “Britain has had enough of experts, says Gove”. Financial
Times. https://www.ft.com/content/3be49734-29cb-11e6-83e4-abc22d5d108c.
Markus, A. (2014). Trust in the Australian Political System. ParliamentaryLibrary. https://www.aph.gov.au/~/~/link.aspx?_id=1713CA0133C845D8B54945046F5C7B8B&_z=z.
(2016). Australians Today: The Australia at 2015 Scanlon Foundation
Survey. Scanlon Foundation. http://scanlonfoundation.org.au/wp-content/uploads/2016/08/Australians-Today.pdf.
(2017). Mapping Social Cohesion: The Scanlon Foundation surveys
2017. Scanlon Foundation. https://www.monash.edu/mapping-population/public-opinion/social-cohesion-report.
Marr, D. (2017). “The White Queen: One Nation and the Politics of Race”.Quarterly Essay.https://www.quarterlyessay.com.au/essay/2017/03/the-white-queen.
Martin, A. (2018). Exploring the Relationship Between Policy Representation
and Political Trust: Evidence From a Unique Dataset From Australia.Australia National University. Forthcoming.
Massola, J. (2017). ’Inequality kills hope’: Bill Shorten sets out defining
mission if he wins government. The Sydney Morning Herald.https://www.smh.com.au/politics/federal/inequality-kills-hope-bill-shorten-sets-out-defining-mission-if-he-wins-government-20170720-gxf8rs.html.
McAllister, I. (2003). “Prime Ministers, Opposition Leaders and GovernmentPopularity in Australia”. Australian Journal of Political Science 38.2,pp. 259–277. http://dx.doi.org/10.1080/1036114032000092710.
McAllister et al. (1997). McAllister, I., Galligan, B. and Ravenhill, J. New
developments in Australian politics. Ed. byJ. R. Brian Galligan Ian McAllister. Macmillan Education Australia PtyLtd South Melbourne.
McKenzie, N. and Massola, J. (2017). “Andrew Robb’s secret China contract:money for nothing”. Sydney Morning Herald.https://www.smh.com.au/politics/federal/andrew-robbs-secret-china-contract-money-for-nothing-20171205-gzzaq5.html.
McMahon, T. (2018). aes: Responses to the Australian Election Study Voter
Studies 1987-2016. R package version 0.1.0.https://github.com/thmcmahon/aes.
McNaughton, T. (2017). “Governments are bystanders as inequality festers”.Sydney Morning Herald.https://www.smh.com.au/business/the-economy/governments-are-bystanders-as-inequality-festers-20170109-gtobuk.html.
Microsoft (2017). RevoUtilsMath: Microsoft R Services Math Utilities Package.R package version 10.0.1.
(2018). RevoUtils: Microsoft R Utility Package. R package version10.0.7.
Milliken, R. (1994). “Keating’s rear view of the lucky country causes storm:Careless remarks have damaged the PM’s nationalist stance, writesRobert Milliken in Sydney”. Independent.www.independent.co.uk/news/world/keatings-rear-view-of-the-lucky-country-causes-storm-careless-remarks-have-damaged-the-pms-1425378.html.
Mishra, P. (2016). “Welcome to the age of anger”. The Guardian.https://www.theguardian.com/politics/2016/dec/08/welcome-age-anger-brexit-trump.
Mols, F. and Jetten, J. (2017). “One Nation’s support: Why ’income’ is a poorpredictor”. Australasian Parliamentary Review 32.1, pp. 92–100.https://search.informit.com.au/documentSummary;dn=109685059832486;res=IELAPA.
Mudde, C. (2017a). “Politics at the Fringes? Eastern Europe’s Populists,Racists, and Extremists”. The Routledge Handbook of East European
Politics. Ed. by A. Fagan and P. Kopecký. Oxon: Routledge. Chap. 19.
Grattan Institute 2018 105
A crisis of trust: The rise of protest politics in Australia
Mudde, C. (2017b). Populism isn’t dead. Here are five things you need to
know about it. The Guardian.https://www.theguardian.com/commentisfree/2017/jul/07/populism-dead-european-victories-centrists.
Mughan et al. (2003). Mughan, A., Bean, C. and McAllister, I. “Economicglobalization, job insecurity and the populist reaction”. Electoral
Studies 22.4, pp. 617–633. https://www.sciencedirect.com/science/article/pii/S0261379402000471.
Mughan, A. and Paxton, P. (2006). “Anti-Immigrant Sentiment, PolicyPreferences and Populist Party Voting in Australia”. British Journal of
Political Science 36.2, pp. 341–358.https://www.cambridge.org/core/article/antiimmigrant-sentiment-policy-preferences-and-populist-party-voting-in-australia/BBAC1F197B060491151D5AF1CB2DABFB.
Murday, M. (2015). “The left/right divide is outdated and unhelpful”. New
Statesman. https://www.newstatesman.com/politics/2015/07/leftright-divide-outdated-and-unhelpful.
Murphy, K. (2016). “Transfield Holdings boss says political donations ’boughtaccess’ to MPs”. The Guardian.https://www.theguardian.com/australia-news/2016/may/23/transfield-boss-says-political-donations-bought-access-to-mps?CMP=soc_568.
Murphy, D. (2017). “Politics at tipping point as one in four voters flee Labor andthe Coalition”. Sydney Morning Herald. https://www.smh.com.au/politics/federal/politics-at-tipping-point-as-one-in-four-voters-flee-labor-and-the-coalition-20170317-gv0a25.html.
Murray, S. (2015). Political Party Membership in NSW – Figures for 2014-15.https://boilermakerbill.wordpress.com/2015/12/01/political-party-membership-in-nsw-figures-for-2014-15/.
NAA (2016). Australia’s Prime Ministers: Ben Chifley. National Archives ofAustralia. http://primeministers.naa.gov.au/primeministers/chifley/#.
Needham, K. (2016). Political donations: NSW Labor’s Luke Foley pledges
’real-time’ reporting. Sydney Morning Herald.https://www.smh.com.au/national/nsw/political-donations-nsw-labors-luke-foley-pledges-realtime-reporting-20160212-gmt1ke.html.
Nelson, F. (2017). “Michael Gove was (accidentally) right about experts”. The
Spectator. https://www.spectator.co.uk/2017/01/michael-gove-was-accidentally-right-about-experts/.
newDemocracy (2018). Home Page: We Innovate in How We Do Democracy.newDemocracy. https://www.newdemocracy.com.au/.
Ng, Y.-F. (2017). “Victoria gets serious on its political donations rules - now it’sthe federal government’s turn”. The Conversation.https://theconversation.com/victoria-gets-serious-on-its-political-donations-rules-now-its-the-federal-governments-turn-84265.
Nichols, T. (2017). The death of expertise: the campaign against established
knowledge and why it matters. Oxford University Press. ISBN:978-0190469412.
Nick Xenophon Team (2015). Government Accountability and Transparency.https://nxt.org.au/whats-nxt/policy-principles/government-service-delivery-and-accountability/.
(2017a). Nick Xenophon Team: A Common Sense Alternative.https://nxt.org.au/.
(2017b). Our Focus. https://nxt.org.au/whats-nxt/our-focus/.
NSW Electoral Commission (2017). Caps on Political Donations. NSWElectoral Commission. http://www.elections.nsw.gov.au/fd/political_donations/caps_on_political_donations.
O’Malley, N. (2017). “Pauline Hanson’s populist distrust of experts runs deeperthan vaccines”. Sydney Morning Herald.https://www.smh.com.au/opinion/pauline-hansons-populist-distrust-of-experts-runs-deeper-than-vaccines-20170308-gutkj9.html.
One Nation (2015a). Our Aims. http://www.onenation.com.au/aims.
Grattan Institute 2018 106
A crisis of trust: The rise of protest politics in Australia
One Nation (2015b). Aged Pension Increase.http://www.onenation.com.au/policies/aged-pension.
(2015c). Manufacturing.http://www.onenation.com.au/policies/manufacturing.
(2015d). Principles & Objectives.http://www.onenation.com.au/principles.
(2015e). Multiculturalism.http://www.onenation.com.au:80/policies/multiculturalism.
(2015f). Immigration.http://www.onenation.com.au/policies/immigration.
(2016). 24 Million - Third World Growth. Accessed xx-xxx-20xx. http://www.onenation.com.au/current_affairs/24-million-third-world-growth.
OpenAustralia Foundation (2017). They Vote for You.https://theyvoteforyou.org.au/.
Owen, M. (2017). “Xenophon best, daylight second: SA Newspoll shock forALP and Libs”. The Australian.https://www.theaustralian.com.au/national-affairs/newspoll/xenophon-best-daylight-second-sa-newspoll-shock-for-alp-and-libs/news-story/f0793f3a78e67b60e5d6b2afa690f19a.
Parsonage, H. (2016). taxstats: Supply ATO Data for Convenience. R packageversion 0.0.4.1314.
(2017). grattanCharts: Create charts in the style of the Grattan
Insitute, Melbourne. R package version 0.5.1.0.https://github.com/hughparsonage/grattanCharts.
(2018a). hutils: Miscellaneous R Functions and Aliases. R packageversion 1.0.0. https://github.com/hughparsonage/hutils.
(2018b). grattanElectionMaps: Create Maps and Fetch Data From
Australian Federal Electons. R package version 0.1.0.https://github.com/hughparsonage/grattanElectionMaps.
Parsonage et al. (2018). Parsonage, H., Cameron, T., Coates, B. andYoung, W. grattan: Australian Tax Policy Analysis. R package version1.5.3.6. https://github.com/HughParsonage/grattan.
PC (2010). Gambling Inquiry. Productivity Commission.https://www.pc.gov.au/inquiries/completed/gambling-2009/report.
(2014). Submission to the Competition Policy Review. ProductivityCommission. http://www.pc.gov.au/research/supporting/competition-policy-review/competition-policy-review-submission.pdf.
(2015). Trade & Assistance Review 2013-14. ProductivityCommission. https://www.pc.gov.au/research/ongoing/trade-assistance/2013-14/trade-assistance-review-2013-14.pdf.
(2016). Migrant Intake into Australia. Productivity Commission.http://www.pc.gov.au/inquiries/completed/migrant-intake/report/migrant-intake-report.pdf.
(2017a). Transitioning Regional Economies. Productivity Commission.http://www.pc.gov.au/inquiries/current/transitioning-regions/initial.
(2017b). Trade & Assistance Review 2015-16. ProductivityCommission. https://www.pc.gov.au/research/ongoing/trade-assistance/2015-16/trade-assistance-review-2015-16.pdf.
Perales, F. and Campbell, A. (2017). Revealed: who supports marriage
equality in Australia - and who doesn’t. The Conversation.https://theconversation.com/revealed-who-supports-marriage-equality-in-australia-and-who-doesnt-82988.
Pettigrew, T. F. and Tropp, L. R. (2006). “A meta-analytic test of intergroupcontact theory”. Journal of personality and social psychology 90.5,p. 751.http://psycnet.apa.org/?fa=main.doiLanding&doi=10.1037/0022-3514.90.5.751.
Pettigrew, T. F. and Tropp, L. R. (2008). “How does intergroup contact reduceprejudice? Meta-analytic tests of three mediators”. European Journal
of Social Psychology 38.6, pp. 922–934.
Grattan Institute 2018 107
A crisis of trust: The rise of protest politics in Australia
Posner, E. (2017). Liberal Internationalism and the Populist Backlash.University of Chicago - Law School.https://papers.ssrn.com/sol3/papers.cfm?abstract_id=2898357.
Prosser, B. and Denniss, R. (2015). “Lobbying and minority government inAustralia: The concept of the marginal member”. Australian Journal of
Political Science 50.3, pp. 496–512.https://doi.org/10.1080/10361146.2015.1065956.
Q&A (2017). “PM Malcolm Turnbull on Q&A”. ABC.http://www.abc.net.au/tv/qanda/txt/s4758471.htm.
R Core Team (2017). R: A Language and Environment for Statistical
Computing. R 3.4.3. R Foundation for Statistical Computing. Vienna,Austria. https://www.R-project.org/.
RAI (2016). Talking point: The missing migrants. Regional Australia Institute.http://www.regionalaustralia.org.au/home/wp-content/uploads/2016/07/FINAL-Talking-Point-The-missing-migrants.pdf.
Raymond McTaggart et al. (2016). Raymond McTaggart, Gergely Daroczi andClement Leung. Quandl: API Wrapper for Quandl.com. R packageversion 2.8.0. https://CRAN.R-project.org/package=Quandl.
Reconciliation Australia (2017). 2016 Australian Reconciliation Barometer.Reconciliation Australia. https://www.reconciliation.org.au/wp-content/uploads/2017/11/RA_ARB-2016_Overview-brochure_web.pdf.
Reid, B. and Lui, G.-J. (2017). “One Nation and the Heartlands Cleavage”.Australian Political Studies Association Conference.https://www.researchgate.net/publication/320073093_One_Nation_and_the_Heartlands_Cleavage.
Richards, S. (2017). The Rise of the Outsiders. Atlantic.https://www.allenandunwin.com/browse/books/academic-professional/politics-government/The-Rise-of-the-Outsiders-Steve-Richards-9781786492012.
Riek et al. (2006). Riek, B. M., Mania, E. W. and Gaertner, S. L. “IntergroupThreat and Outgroup Attitudes: A Meta-Analytic Review”. Personality
and Social Psychology Review 10.4, pp. 336–353.https://doi.org/10.1207/s15327957pspr1004_4.
Ripley, B. (2017). MASS: Support Functions and Datasets for Venables and
Ripley’s MASS. R package version 7.3-48.https://CRAN.R-project.org/package=MASS.
RMIT ABC Fact Check (2017). “Fact check: Is Victoria set to legislate thestrictest political donation laws in the country?” ABC News.http://www.abc.net.au/news/2017-10-17/fact-check-victorias-political-donations-laws/9042818.
Roberts, D. (2015). “Why mass shootings don’t convince gun owners tosupport gun control”. Vox. https://www.vox.com/2015/12/4/9845146/mass-shootings-gun-control.
Robinson, D. (2017). broom: Convert Statistical Analysis Objects into Tidy
Data Frames. R package version 0.4.3.https://CRAN.R-project.org/package=broom.
Rodrigues et al. (2017). Rodrigues, M., Vaughan, A., Abbott, V., Blow, J.,Carroll, J. and Ramsey, S. Pesticide and Veterinary Medicine
Regulatory Reform. ANAO Report No. 56 2016-17. AustralianNational Audit Office.https://www.anao.gov.au/sites/g/files/net3916/f/ANAO_Report_2016-2017_56.pdf.
Rodrik, D. (2017). Populism and the Economics of Globalization. Centre forEconomic Policy Research. https://cepr.org/active/publications/discussion_papers/dp.php?dpno=12119#.
Romer, P. (2015). Urbanization Passes the Pritchett Test.https://paulromer.net/urbanization-passes-the-pritchett-test/.
Ryan, J. A. and Ulrich, J. M. (2017). xts: eXtensible Time Series. R packageversion 0.10-1. https://CRAN.R-project.org/package=xts.
Grattan Institute 2018 108
A crisis of trust: The rise of protest politics in Australia
Sandovici et al. (2012). Sandovici, M. E., Strabac, Z. and Jakobsen, T. G.“Political Nationalism and Attitudes towards Immigration: TheInteraction of Knowledge and Policy”. International Journal on
Minority and Group Rights 19.2, pp. 115–127. DOI:10.1163/157181112x639041.https://doi.org/10.1163/157181112x639041.
Sayer, D. (2017). “White riot—Brexit, Trump, and post-factual politics”. Journal
of Historical Sociology 30.1, pp. 92–106.http://dx.doi.org/10.1111/johs.12153.
SBS News (2017a). “Proton beam therapy centre for SA”. SBS News.https://www.sbs.com.au/news/proton-beam-therapy-centre-for-sa.
(2017b). “Pauline Hanson links same-sex marriage to polygamy”.SBS News. https://www.sbs.com.au/news/pauline-hanson-links-same-sex-marriage-to-polygamy.
(2017c). “Same-sex marriage: What next? A ban on ’mum and dad’,says Hanson”. SBS News. https://www.sbs.com.au/news/same-sex-marriage-what-next-a-ban-on-mum-and-dad-says-hanson.
SGS Economics and Planning (2016). Australian Cities Accounts 2015-16.SGS Economics and Planning.https://www.sgsep.com.au/application/files/9914/8106/1313/GDP_by_major_capital_city_201516_-_high_res.pdf.
Sharman, C. (1999). The Representation of Small parties and Independents.Department of the Senate Procedure Office. https://www.aph.gov.au/About_Parliament/Senate/Powers_practice_n_procedures/pops/~/link.aspx?_id=F74BDE214CB64985BCC43D1C76A15BF4&_z=z.
Shepherd, T. (2017). “Can the Australian Conservatives win over the silentmajority?” The Advertiser.http://www.adelaidenow.com.au/rendezview/tory-shepherd-can-the-australian-conservatives-win-over-the-silent-majority/news-story/94ae6c47733bb759a72b3dc92226266c.
Sheppard, J. (2017). Fairfax Political Personas Project. Fairfax Media.
Shorten, B. (2014). Speech notes: National Policy Forum (Melbourne).http://www.billshorten.com.au/national-policy-forum.
(2017). Tackling Inequality: A Labor Mission. Australian Labor Party.http://www.billshorten.com.au/speech_tackling_inequality_a_labor_mission_melbourne_institute_friday_21_july_2017.
Sievert et al. (2017). Sievert, C., Parmer, C., Hocking, T., Chamberlain, S.,Ram, K., Corvellec, M. and Despouy, P. plotly: Create Interactive Web
Graphics via ’plotly.js’. R package version 4.7.1.https://CRAN.R-project.org/package=plotly.
Silva, K. (2017). “Queensland election: Results still unclear because votersturned on the major parties”. ABC News.http://www.abc.net.au/news/2017-11-26/queensland-election-result-unclear-voters-turn-on-major-parties/9193946.
Slowikowski, K. (2017). ggrepel: Repulsive Text and Label Geoms for
’ggplot2’. R package version 0.7.0.https://CRAN.R-project.org/package=ggrepel.
Smith, W. (2014). “Political donations corrupt democracy in ways you mightnot realise”. The Guardian.https://www.theguardian.com/commentisfree/2014/sep/11/political-donations-corrupt-democracy-in-ways-you-might-not-realise.
Smith, M. (2017). Leave voters are less likely to trust any experts - even
weather forecasters. YouGov UK.https://yougov.co.uk/news/2017/02/17/leave-voters-are-less-likely-trust-any-experts-eve/.
Sniderman et al. (2004). Sniderman, P. M., Hagendoorn, L. and Prior, M.“Predisposing Factors and Situational Triggers: ExclusionaryReactions to Immigrant Minorities”. American Political Science
Review 98.1, pp. 35–49.https://www.cambridge.org/core/article/predisposing-factors-and-situational-triggers-exclusionary-reactions-to-immigrant-minorities/8E06A1959ACC771754651B897E8E24A8.
Spurr, S. (2017). Trust free-falls in the land down under. Edelman. https://www.edelman.com/post/trust-free-falls-in-the-land-down-under/.
Grattan Institute 2018 109

A crisis of trust: The rise of protest politics in Australia
Steketee, M. (2015). “Donations and democracy: how money is compromisingour political system”. ABC Online.http://www.abc.net.au/news/2015-07-03/steketee-how-money-is-compromising-our-political-system/6589556.
Stenner, K. (2009). “Three kinds of “conservatism””. Psychological Inquiry
20.2-3, pp. 142–159. https://www.researchgate.net/publication/274444535_Three_Kinds_of_Conservatism.
Stokes, B. (2016). Republicans, especially Trump supporters, see free trade
deals as bad for U.S. Pew Research Center.http://www.pewresearch.org/fact-tank/2016/03/31/republicans-especially-trump-supporters-see-free-trade-deals-as-bad-for-u-s/.
Storer et al. (2009). Storer, J., Abbott, M. and Stubbs, J. “Access oradaptation? A meta-analysis of surveys of problem gamblingprevalence in Australia and New Zealand with respect toconcentration of electronic gaming machines”. International Gambling
Studies 9.3, pp. 225–244.https://doi.org/10.1080/14459790903257981.
Swan, W. (2016). We know how to stop Trumpism. Crikey.https://www.crikey.com.au/2016/11/11/wayne-swan-stop-trump-by-helping-the-poor/.
Terrill et al. (2016). Terrill, M., Emslie, O. and Coates, B. Roads to riches:
better transport investment. Report No. 2016-5. Grattan Institute.https://grattan.edu.au/report/roads-to-riches/.
Tham, J.-C. (2017). Submission to Select Committee into the Political
Influence of Donations, Submission 3. Parliament of Australia.https://www.aph.gov.au/Parliamentary_Business/Committees/Senate/Political_Influence_of_Donations/PoliticalDonations/Submissions.
The Economist (2011). “Money and politics: Ask what your country can do foryou”. The Economist. https://www.economist.com/node/21531014.
(2017). “Special Report on France: Double Fracture”. The Economist,pp. 9–10.https://www.economist.com/news/special-report/21729612-vibrant-cities-toxic-banlieues-and-rural-deserts-how-frances-regions-reflect.
The Guardian (2015). “Jacqui Lambie wants gay marriage referendum, butwould ’fight like hell’ against change - video”. The Guardian. https://www.theguardian.com/australia-news/video/2015/may/25/jacqui-lambie-gay-marriage-vote-referendum-video.
The New York Times (2017). “Presidential Election Results: Donald J. TrumpWins”. The New York Times.https://www.nytimes.com/elections/results/president.
The Reason Party (2018). About. https://www.sexparty.org.au/about/.
Thomas et al. (2017). Thomas, S. L., Randle, M., Bestman, A., Pitt, H.,Bowe, S. J., Cowlishaw, S. and Daube, M. “Public attitudes towardsgambling product harm and harm reduction strategies: an onlinestudy of 16–88 year olds in Victoria, Australia”. Harm Reduction
Journal 14.1, p. 49. https://doi.org/10.1186/s12954-017-0173-y.
Tingle, L. (2012). “Great Expectations: Government, entitlement and an angrynation”. Quarterly Essay 46. https://www.quarterlyessay.com.au/essay/2012/06/great-expectations.
Treasury (2017). Budget 2017-18: Budget Paper 4. Treasury.http://www.budget.gov.au/2017-18/content/bp4/html/.
Triffitt, M. (2016). “Australia needs to lead again on democratic innovation”.The Conversation. https://theconversation.com/australia-needs-to-lead-again-on-democratic-innovation-62828.
Van Onselen, P. (2017). “What’s right?” The Monthly.https://www.themonthly.com.au/future-liberal-party-what-s-right-peter-van-onselen-3287.
Wade, M. and Ting, I. (2017). “Australians almost united in their desire tomanufacture more at home”. Sydney Morning Herald.https://www.smh.com.au/politics/federal/the-one-political-view-that-unites-australians-20170203-gu54f4.html.
Walker, J. (2017). “$5.4bn rail crossing price of Hanson support”. The
Australian. https://www.theaustralian.com.au/national-affairs/state-politics/54bn-rail-crossing-price-of-hanson-support/news-story/74506d06595eb34b2c8063d4eec51b4b.
Grattan Institute 2018 110
A crisis of trust: The rise of protest politics in Australia
Ward, T. (2017). Bridging Troubled Waters: Australia and Asylum Seekers.Australian Scholarly Publishing.https://www.amazon.com.au/Bridging-Troubled-Waters-Australia-Seekers/dp/1925588386.
Ward, I. and Stewart, R. G. (2010). Politics One. South Yarra, Vic. : PalgraveMacmillan, 2010.
Waters, C. (2016). Bruce Bilson to head Franchise Council of Australia. TheSydney Morning Herald.https://www.smh.com.au/business/small-business/bruce-billson-to-head-franchise-council-of-australia-20160322-gnonin.html.
Wear, R. (2009). “Countrymindedness and the Nationals”. The National Party:
Prospects for the Great Survivors. Ed. by G. Cockfield andL. C. Botterill. Allen & Unwin.
Wells, N. and Chemi, E. (2015). “Donald Trump is right: Paying politicianspays”. CNBC. https://www.cnbc.com/2015/09/17/donald-trump-is-right-paying-politicians-pays.html.
Whyte, S. (2016). “Is the media giving Pauline Hanson too much attention?”Crikey.
Wickham, H. (2017a). scales: Scale Functions for Visualization. R packageversion 0.5.0. https://CRAN.R-project.org/package=scales.
(2017b). dtplyr: Data Table Back-End for ’dplyr’. R package version0.0.2. https://CRAN.R-project.org/package=dtplyr.
(2017c). testthat: Unit Testing for R. R package version 2.0.0.https://CRAN.R-project.org/package=testthat.
(2018). forcats: Tools for Working with Categorical Variables
(Factors). R package version 0.3.0.https://CRAN.R-project.org/package=forcats.
Wickham, H. and Chang, W. (2016). ggplot2: Create Elegant Data
Visualisations Using the Grammar of Graphics. R package version2.2.1. https://CRAN.R-project.org/package=ggplot2.
Wickham, H. and Bryan, J. (2017). readxl: Read Excel Files. R packageversion 1.0.0. https://CRAN.R-project.org/package=readxl.
Wickham et al. (2017). Wickham, H., Francois, R., Henry, L. and Müller, K.dplyr: A Grammar of Data Manipulation. R package version 0.7.4.https://CRAN.R-project.org/package=dplyr.
Wickham et al. (2018a). Wickham, H., Hester, J. and Chang, W. devtools:
Tools to Make Developing R Packages Easier. R package version1.13.5. https://CRAN.R-project.org/package=devtools.
Wickham et al. (2018b). Wickham, H., Hester, J. and Francois, R. readr: Read
Rectangular Text Data. http://readr.tidyverse.org,https://github.com/tidyverse/readr.
Wilke, C. O. (2017). cowplot: Streamlined Plot Theme and Plot Annotations for
’ggplot2’. R package version 0.9.2.https://CRAN.R-project.org/package=cowplot.
Will et al. (2017). Will, L., Jomini, P., McMillan, H., Veisman-Apter, M. andZhang, X.-G. Rising protectionism. Productivity Commission.https://www.pc.gov.au/research/completed/rising-protectionism/rising-protectionism.pdf.
Willingham, R. (2016). “Labour powerbroker Stephen Conroy joins newgambling lobby”. Sydney Morning Herald.https://www.smh.com.au/politics/federal/labor-powerbroker-stephen-conroy-joins-new-gambling-lobby-20161207-gt6391.html.
Wilms, T. (2016). “Regardless of Bernardi’s Plans The Australian Right MustUnite”. The Unshackled.http://www.theunshackled.net/rundown/regardless-of-bernardis-plans-the-australian-right-must-unite/.
Withers et al. (1985). Withers, G., Endres, T. and Perry, L. Australian historical
statistics: labour statistics. Canberra: Source papers in economichistory ; no. 7.https://www.rse.anu.edu.au/media/118715/SP07_001_Contents.pdf.
Grattan Institute 2018 111
A crisis of trust: The rise of protest politics in Australia
Wood, D. and Chivers, C. (2017). “Same-sex marriage results crush the ideathat Australian voters crave conservatism”. The Conversation.https://theconversation.com/same-sex-marriage-results-crush-the-idea-that-australian-voters-crave-conservatism-87316.
Yaxley, L. (2017). “Federal Government to propose Home Office-stylesuper-ministry to oversee border security”. ABC Online.http://www.abc.net.au/news/2017-07-17/government-to-propose-home-office-style-super-ministry/8716830.
Zeileis et al. (2016). Zeileis, A., Cribari-Neto, F., Gruen, B. and Kosmidis, I.betareg: Beta Regression. R package version 3.1-0.https://CRAN.R-project.org/package=betareg.
Zeileis, A. and Lumley, T. (2017). sandwich: Robust Covariance Matrix
Estimators. R package version 2.4-0.https://CRAN.R-project.org/package=sandwich.
Zeileis et al. (2018). Zeileis, A., Grothendieck, G. and Ryan, J. A. zoo: S3
Infrastructure for Regular and Irregular Time Series (Z’s Ordered
Observations). R package version 1.8-1.https://CRAN.R-project.org/package=zoo.
Grattan Institute 2018 112