a comparison of light microscopy techniques … · two unvarnished oil paintings on canvas from the...
TRANSCRIPT

A COMPARISON OF LIGHT MICROSCOPY TECHNIQUES WITH SCANNING ELECTRON MICROSCOPY FOR
IMAGING THE SURFACE CLEANING OF PAINTINGS
Klaas Jan van den Berg1, Maude Daudin1, Ineke Joosten1, Bill Wei1, Rachel Morrison2, Aviva Burnstock3
1Netherlands Institute for Cultural Heritage P.O. Box 76709, NL-1070 KA Amsterdam, Netherlands
2Scientific Department, National Gallery, London WC2N 5DN, UK 3Department of Conservation & Technology, Courtauld Institute of Art
Somerset House, London WC2R ORN, UK ABSTRACT This paper compares preliminary data provided by three imaging techniques for the characterisation of surfaces on microscopy, including light microscopy (LM), scanning electron microscopy (SEM) imaging and confocal white light profilometry. The techniques were used on samples from an investigation of the effects of citrates, other aqueous solutions and dry cleaning agents for removing surface dirt from unvarnished oil paintings. SEM allows for the imaging of non-conducting surfaces and interfaces at submicron lateral resolution. Images are of equivalent quality to traditional high vacuum SEM images typically used in cleaning studies of painted surfaces. It is possible to locate precisely the same location before and after any number of sequential treatments. Surfaces can be examined in situ and uncoated. Confocal white light profilometry and 3D light microscopy complement SEM imaging. These non-contact techniques provide roughness information of parts of the surface of whole paintings, by processing a sequence of images taken of the sample surface at pre-selected focus intervals into a single in-focus image. Both techniques produce full in-focus microphotographs of paint surfaces, where the depth of field of standard microscopes is limited. Images can be produced of paint surfaces of a lateral resolution high enough to register the presence and removal of particulate dirt. The confocal profilometer tested in this study appears to be more accurate and mechanically stable than the 3D microscope. It has a higher vertical/roughness resolution on the order of nm. The advantage of 3D microscopy is that real colour 3D topographic image are produced that compare with LM images that are easily interpreted. However, the 3D microscopy as it currently is designed is sensitive to vibrations, which reduces accuracy and resolution. INTRODUCTION For the study of surface cleaning procedures, scanning electron microscopy (SEM) can support visual assessment. In a recent study, it was shown that a variable pressure SEM setup applying low acceleration voltages, is advantageous for evaluating the sequential cleaning treatments on exactly the same location on the paint surface, using the high lateral resolution of the SEM (Morrison et al. 2007). However, the technique can not be used for studying whole paintings. A study is thus being conducted to evaluate the usefulness of white light profilometry and a 3D microscopy technique for assessing the extent of dirt removal from paint surfaces and possible changes in surface roughness. Commonly applied methods to clean paint surfaces involve swab rolling the surface with saliva or aqueous solvents such as citrate solutions. Citrate reagents act on the inorganic components of dirt while also breaking up the oily, fatty organic components of dirt (Phenix and Burnstock 1992). For water sensitive paint surfaces (Burnstock et al. 2007) aqueous solvents can not be used and dry cleaning methods may be the only alternatives. Dry cleaning materials are sometimes used on large, monochrome paint surfaces in paper conservation. They involve the use of powders, sponges and other materials of varying stickiness and hardness (Noehles 2002).
1
9th International Conference on NDT of Art, Jerusalem Israel, 25-30 May 2008For more papers of this publication click: www.ndt.net/search/docs.php3?MainSource=65
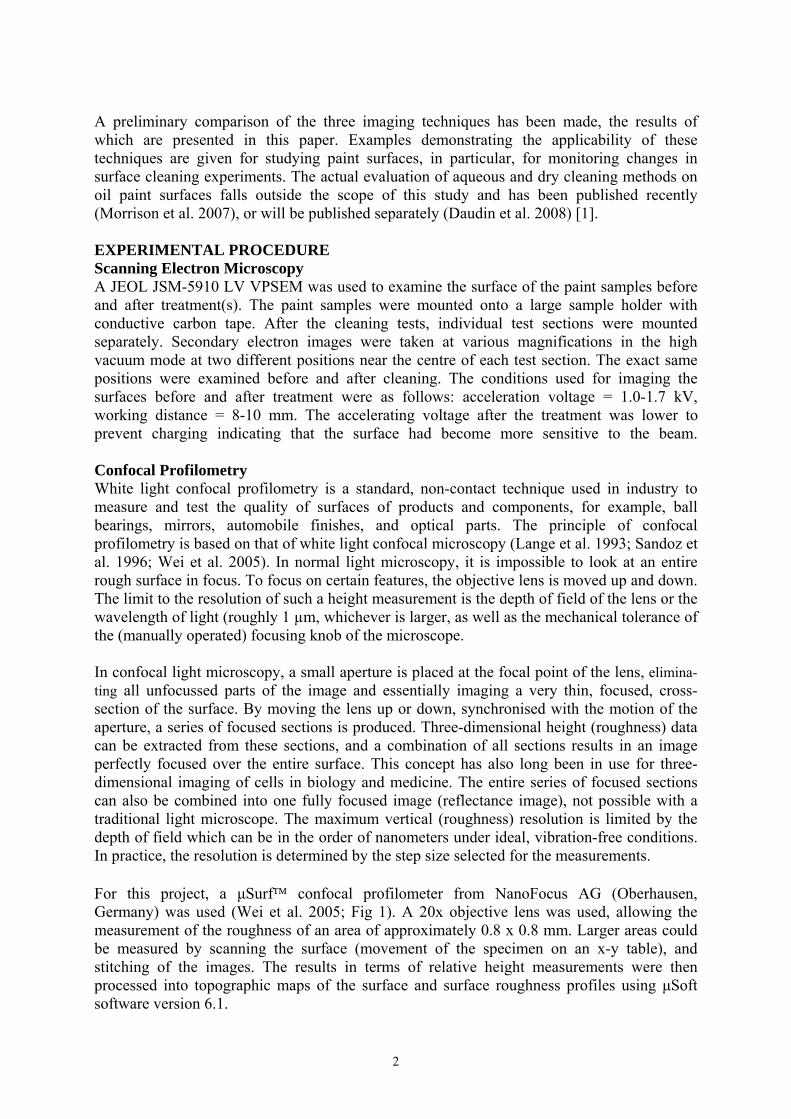
A preliminary comparison of the three imaging techniques has been made, the results of which are presented in this paper. Examples demonstrating the applicability of these techniques are given for studying paint surfaces, in particular, for monitoring changes in surface cleaning experiments. The actual evaluation of aqueous and dry cleaning methods on oil paint surfaces falls outside the scope of this study and has been published recently (Morrison et al. 2007), or will be published separately (Daudin et al. 2008) [1]. EXPERIMENTAL PROCEDURE Scanning Electron Microscopy A JEOL JSM-5910 LV VPSEM was used to examine the surface of the paint samples before and after treatment(s). The paint samples were mounted onto a large sample holder with conductive carbon tape. After the cleaning tests, individual test sections were mounted separately. Secondary electron images were taken at various magnifications in the high vacuum mode at two different positions near the centre of each test section. The exact same positions were examined before and after cleaning. The conditions used for imaging the surfaces before and after treatment were as follows: acceleration voltage = 1.0-1.7 kV, working distance = 8-10 mm. The accelerating voltage after the treatment was lower to prevent charging indicating that the surface had become more sensitive to the beam. Confocal Profilometry White light confocal profilometry is a standard, non-contact technique used in industry to measure and test the quality of surfaces of products and components, for example, ball bearings, mirrors, automobile finishes, and optical parts. The principle of confocal profilometry is based on that of white light confocal microscopy (Lange et al. 1993; Sandoz et al. 1996; Wei et al. 2005). In normal light microscopy, it is impossible to look at an entire rough surface in focus. To focus on certain features, the objective lens is moved up and down. The limit to the resolution of such a height measurement is the depth of field of the lens or the wavelength of light (roughly 1 µm, whichever is larger, as well as the mechanical tolerance of the (manually operated) focusing knob of the microscope. In confocal light microscopy, a small aperture is placed at the focal point of the lens, elimina-ting all unfocussed parts of the image and essentially imaging a very thin, focused, cross-section of the surface. By moving the lens up or down, synchronised with the motion of the aperture, a series of focused sections is produced. Three-dimensional height (roughness) data can be extracted from these sections, and a combination of all sections results in an image perfectly focused over the entire surface. This concept has also long been in use for three-dimensional imaging of cells in biology and medicine. The entire series of focused sections can also be combined into one fully focused image (reflectance image), not possible with a traditional light microscope. The maximum vertical (roughness) resolution is limited by the depth of field which can be in the order of nanometers under ideal, vibration-free conditions. In practice, the resolution is determined by the step size selected for the measurements. For this project, a μSurf™ confocal profilometer from NanoFocus AG (Oberhausen, Germany) was used (Wei et al. 2005; Fig 1). A 20x objective lens was used, allowing the measurement of the roughness of an area of approximately 0.8 x 0.8 mm. Larger areas could be measured by scanning the surface (movement of the specimen on an x-y table), and stitching of the images. The results in terms of relative height measurements were then processed into topographic maps of the surface and surface roughness profiles using μSoft software version 6.1.
2
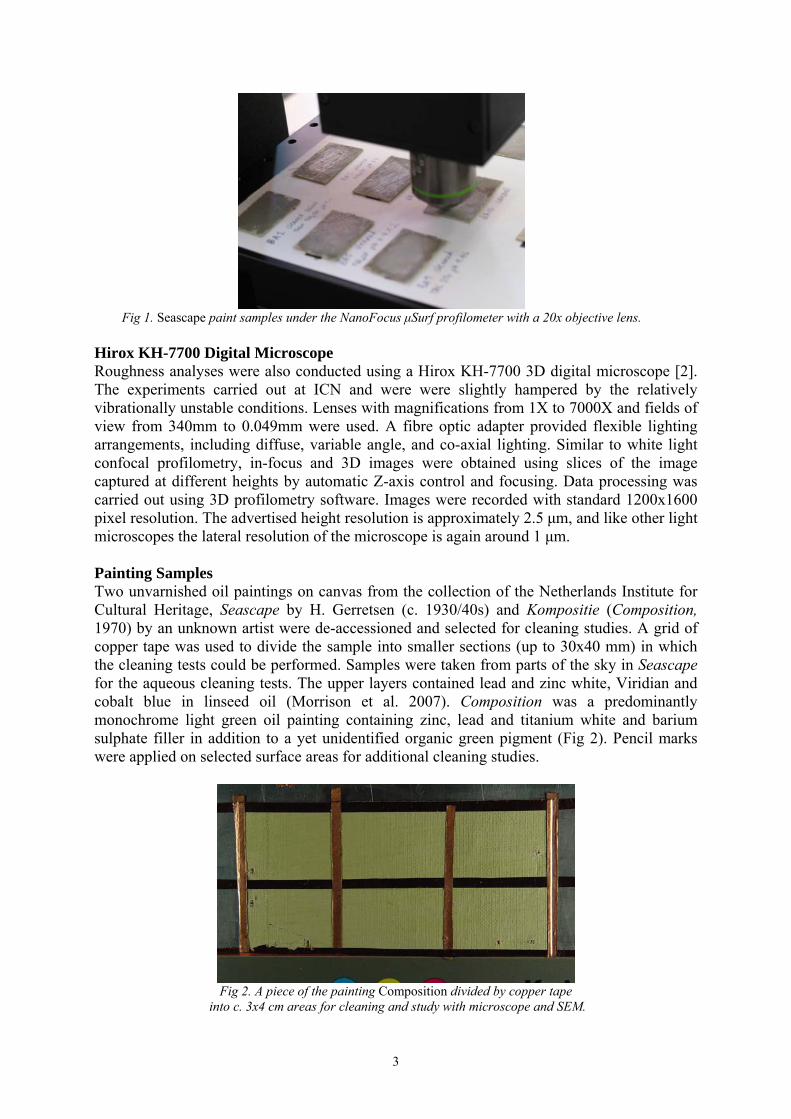
Fig 1. Seascape paint samples under the NanoFocus μSurf profilometer with a 20x objective lens.
Hirox KH-7700 Digital Microscope Roughness analyses were also conducted using a Hirox KH-7700 3D digital microscope [2]. The experiments carried out at ICN and were were slightly hampered by the relatively vibrationally unstable conditions. Lenses with magnifications from 1X to 7000X and fields of view from 340mm to 0.049mm were used. A fibre optic adapter provided flexible lighting arrangements, including diffuse, variable angle, and co-axial lighting. Similar to white light confocal profilometry, in-focus and 3D images were obtained using slices of the image captured at different heights by automatic Z-axis control and focusing. Data processing was carried out using 3D profilometry software. Images were recorded with standard 1200x1600 pixel resolution. The advertised height resolution is approximately 2.5 μm, and like other light microscopes the lateral resolution of the microscope is again around 1 μm. Painting Samples Two unvarnished oil paintings on canvas from the collection of the Netherlands Institute for Cultural Heritage, Seascape by H. Gerretsen (c. 1930/40s) and Kompositie (Composition, 1970) by an unknown artist were de-accessioned and selected for cleaning studies. A grid of copper tape was used to divide the sample into smaller sections (up to 30x40 mm) in which the cleaning tests could be performed. Samples were taken from parts of the sky in Seascape for the aqueous cleaning tests. The upper layers contained lead and zinc white, Viridian and cobalt blue in linseed oil (Morrison et al. 2007). Composition was a predominantly monochrome light green oil painting containing zinc, lead and titanium white and barium sulphate filler in addition to a yet unidentified organic green pigment (Fig 2). Pencil marks were applied on selected surface areas for additional cleaning studies.
Fig 2. A piece of the painting Composition divided by copper tape
into c. 3x4 cm areas for cleaning and study with microscope and SEM.
3
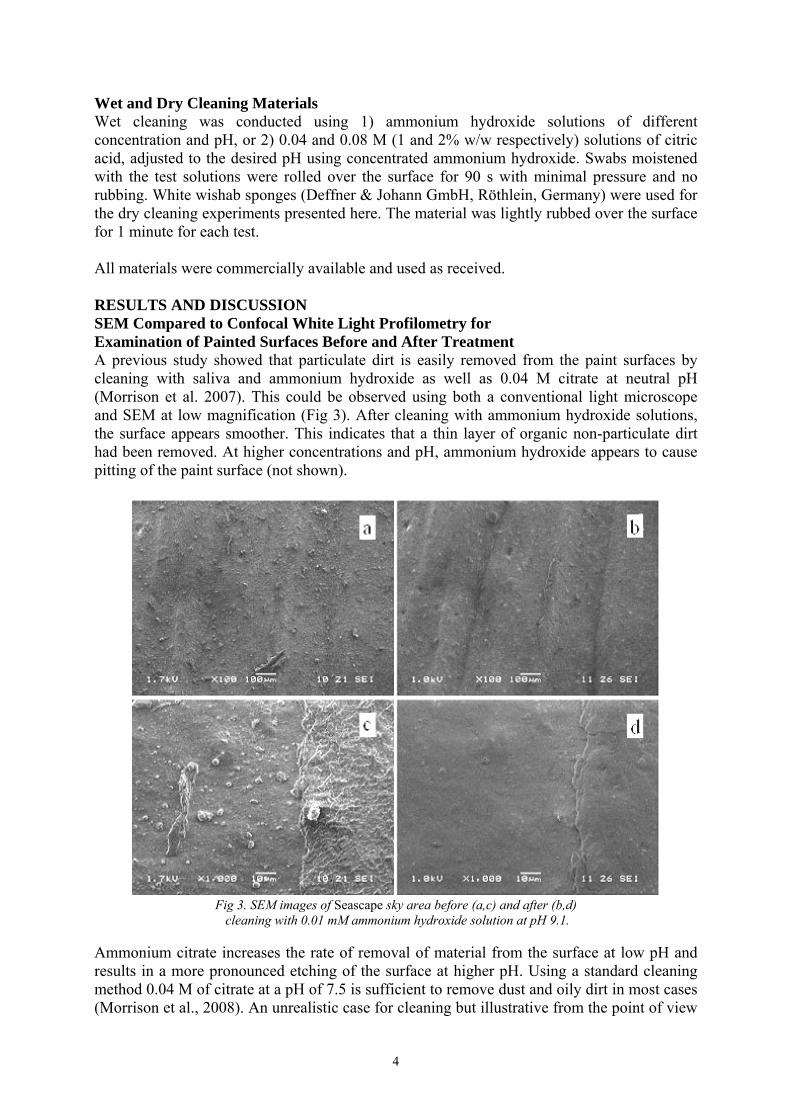
Wet and Dry Cleaning Materials Wet cleaning was conducted using 1) ammonium hydroxide solutions of different concentration and pH, or 2) 0.04 and 0.08 M (1 and 2% w/w respectively) solutions of citric acid, adjusted to the desired pH using concentrated ammonium hydroxide. Swabs moistened with the test solutions were rolled over the surface for 90 s with minimal pressure and no rubbing. White wishab sponges (Deffner & Johann GmbH, Röthlein, Germany) were used for the dry cleaning experiments presented here. The material was lightly rubbed over the surface for 1 minute for each test. All materials were commercially available and used as received. RESULTS AND DISCUSSION SEM Compared to Confocal White Light Profilometry for Examination of Painted Surfaces Before and After Treatment A previous study showed that particulate dirt is easily removed from the paint surfaces by cleaning with saliva and ammonium hydroxide as well as 0.04 M citrate at neutral pH (Morrison et al. 2007). This could be observed using both a conventional light microscope and SEM at low magnification (Fig 3). After cleaning with ammonium hydroxide solutions, the surface appears smoother. This indicates that a thin layer of organic non-particulate dirt had been removed. At higher concentrations and pH, ammonium hydroxide appears to cause pitting of the paint surface (not shown).
Fig 3. SEM images of Seascape sky area before (a,c) and after (b,d)
cleaning with 0.01 mM ammonium hydroxide solution at pH 9.1. Ammonium citrate increases the rate of removal of material from the surface at low pH and results in a more pronounced etching of the surface at higher pH. Using a standard cleaning method 0.04 M of citrate at a pH of 7.5 is sufficient to remove dust and oily dirt in most cases (Morrison et al., 2008). An unrealistic case for cleaning but illustrative from the point of view
4
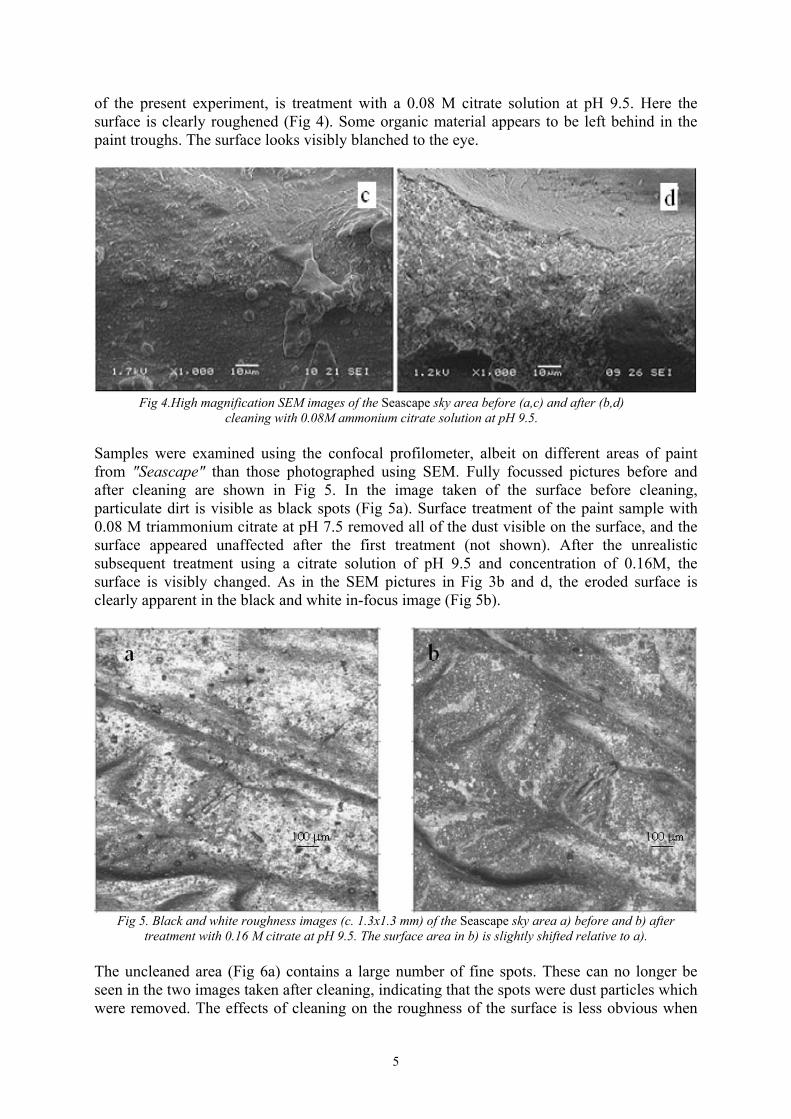
of the present experiment, is treatment with a 0.08 M citrate solution at pH 9.5. Here the surface is clearly roughened (Fig 4). Some organic material appears to be left behind in the paint troughs. The surface looks visibly blanched to the eye.
Fig 4.High magnification SEM images of the Seascape sky area before (a,c) and after (b,d)
cleaning with 0.08M ammonium citrate solution at pH 9.5. Samples were examined using the confocal profilometer, albeit on different areas of paint from "Seascape" than those photographed using SEM. Fully focussed pictures before and after cleaning are shown in Fig 5. In the image taken of the surface before cleaning, particulate dirt is visible as black spots (Fig 5a). Surface treatment of the paint sample with 0.08 M triammonium citrate at pH 7.5 removed all of the dust visible on the surface, and the surface appeared unaffected after the first treatment (not shown). After the unrealistic subsequent treatment using a citrate solution of pH 9.5 and concentration of 0.16M, the surface is visibly changed. As in the SEM pictures in Fig 3b and d, the eroded surface is clearly apparent in the black and white in-focus image (Fig 5b).
Fig 5. Black and white roughness images (c. 1.3x1.3 mm) of the Seascape sky area a) before and b) after
treatment with 0.16 M citrate at pH 9.5. The surface area in b) is slightly shifted relative to a). The uncleaned area (Fig 6a) contains a large number of fine spots. These can no longer be seen in the two images taken after cleaning, indicating that the spots were dust particles which were removed. The effects of cleaning on the roughness of the surface is less obvious when
5
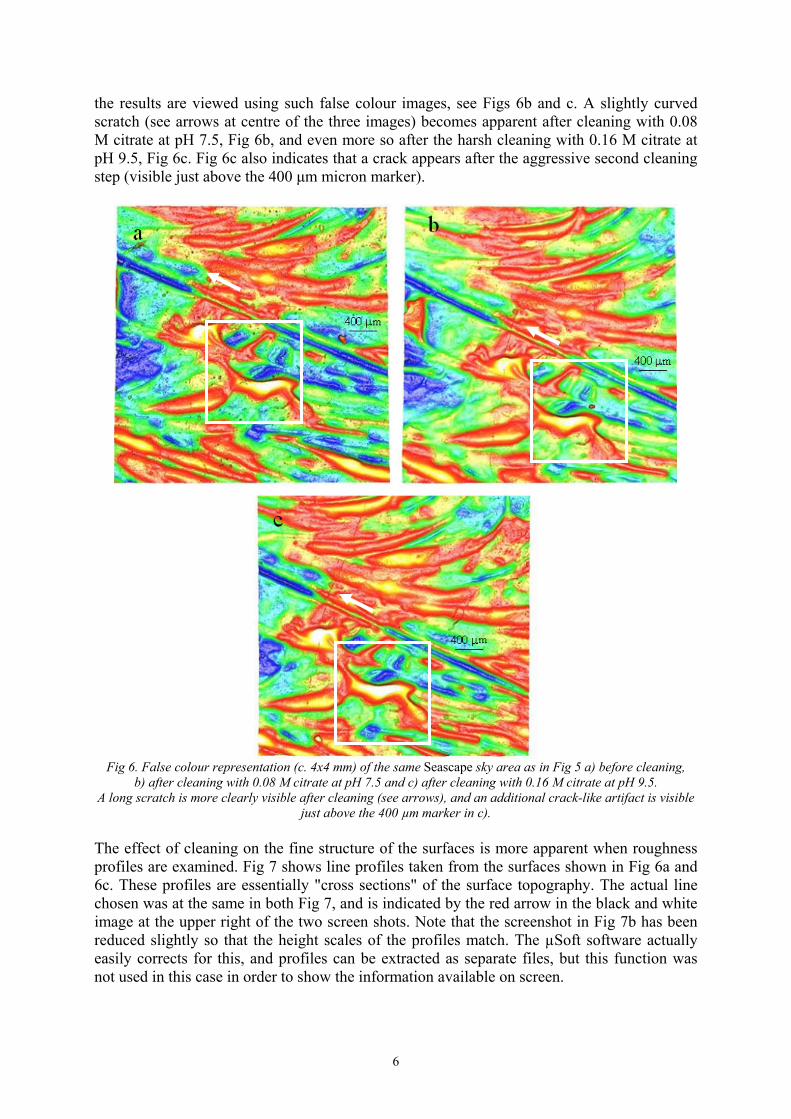
the results are viewed using such false colour images, see Figs 6b and c. A slightly curved scratch (see arrows at centre of the three images) becomes apparent after cleaning with 0.08 M citrate at pH 7.5, Fig 6b, and even more so after the harsh cleaning with 0.16 M citrate at pH 9.5, Fig 6c. Fig 6c also indicates that a crack appears after the aggressive second cleaning step (visible just above the 400 μm micron marker).
Fig 6. False colour representation (c. 4x4 mm) of the same Seascape sky area as in Fig 5 a) before cleaning,
b) after cleaning with 0.08 M citrate at pH 7.5 and c) after cleaning with 0.16 M citrate at pH 9.5. A long scratch is more clearly visible after cleaning (see arrows), and an additional crack-like artifact is visible
just above the 400 µm marker in c). The effect of cleaning on the fine structure of the surfaces is more apparent when roughness profiles are examined. Fig 7 shows line profiles taken from the surfaces shown in Fig 6a and 6c. These profiles are essentially "cross sections" of the surface topography. The actual line chosen was at the same in both Fig 7, and is indicated by the red arrow in the black and white image at the upper right of the two screen shots. Note that the screenshot in Fig 7b has been reduced slightly so that the height scales of the profiles match. The µSoft software actually easily corrects for this, and profiles can be extracted as separate files, but this function was not used in this case in order to show the information available on screen.
6
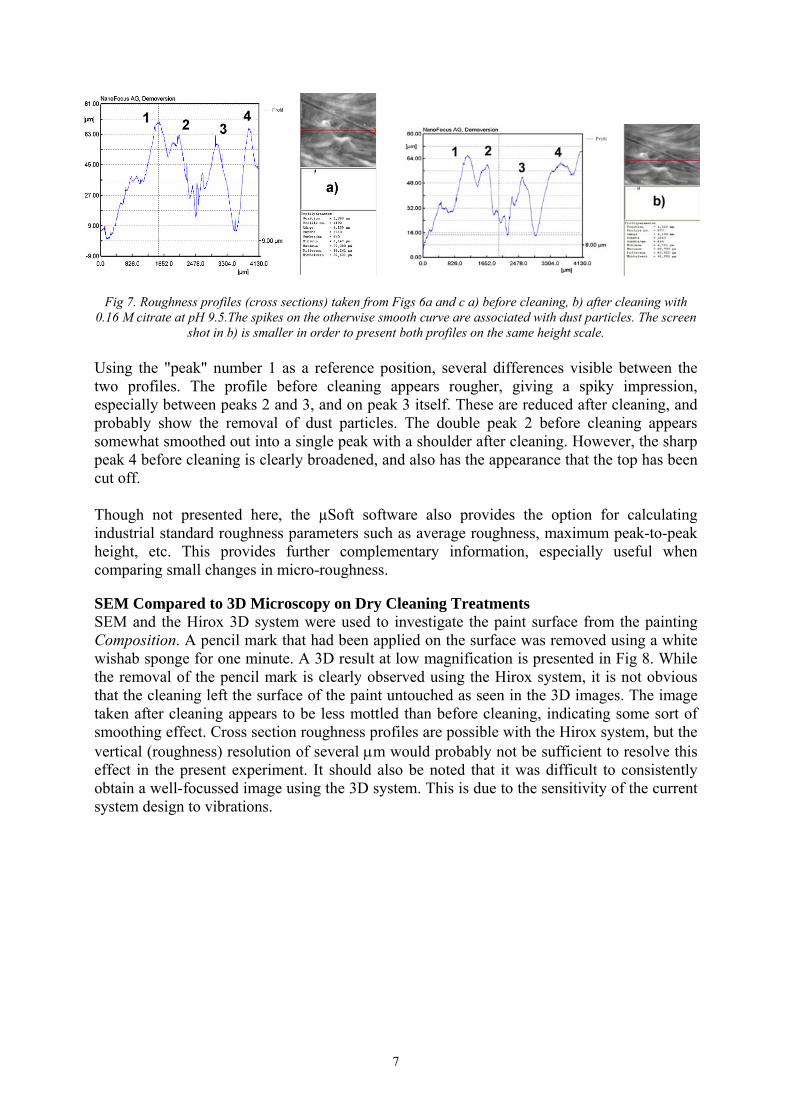
Fig 7. Roughness profiles (cross sections) taken from Figs 6a and c a) before cleaning, b) after cleaning with 0.16 M citrate at pH 9.5.The spikes on the otherwise smooth curve are associated with dust particles. The screen
shot in b) is smaller in order to present both profiles on the same height scale. Using the "peak" number 1 as a reference position, several differences visible between the two profiles. The profile before cleaning appears rougher, giving a spiky impression, especially between peaks 2 and 3, and on peak 3 itself. These are reduced after cleaning, and probably show the removal of dust particles. The double peak 2 before cleaning appears somewhat smoothed out into a single peak with a shoulder after cleaning. However, the sharp peak 4 before cleaning is clearly broadened, and also has the appearance that the top has been cut off. Though not presented here, the µSoft software also provides the option for calculating industrial standard roughness parameters such as average roughness, maximum peak-to-peak height, etc. This provides further complementary information, especially useful when comparing small changes in micro-roughness.
SEM Compared to 3D Microscopy on Dry Cleaning Treatments SEM and the Hirox 3D system were used to investigate the paint surface from the painting Composition. A pencil mark that had been applied on the surface was removed using a white wishab sponge for one minute. A 3D result at low magnification is presented in Fig 8. While the removal of the pencil mark is clearly observed using the Hirox system, it is not obvious that the cleaning left the surface of the paint untouched as seen in the 3D images. The image taken after cleaning appears to be less mottled than before cleaning, indicating some sort of smoothing effect. Cross section roughness profiles are possible with the Hirox system, but the vertical (roughness) resolution of several μm would probably not be sufficient to resolve this effect in the present experiment. It should also be noted that it was difficult to consistently obtain a well-focussed image using the 3D system. This is due to the sensitivity of the current system design to vibrations.
7
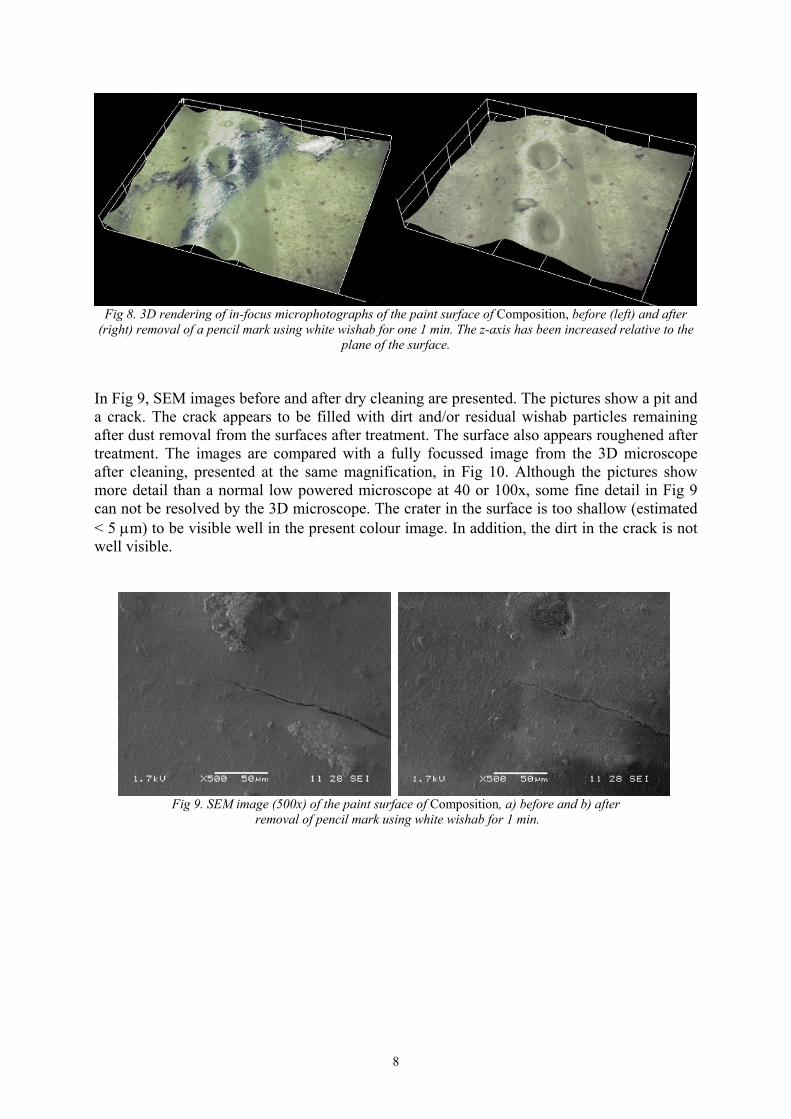
Fig 8. 3D rendering of in-focus microphotographs of the paint surface of Composition, before (left) and after
(right) removal of a pencil mark using white wishab for one 1 min. The z-axis has been increased relative to the plane of the surface.
In Fig 9, SEM images before and after dry cleaning are presented. The pictures show a pit and a crack. The crack appears to be filled with dirt and/or residual wishab particles remaining after dust removal from the surfaces after treatment. The surface also appears roughened after treatment. The images are compared with a fully focussed image from the 3D microscope after cleaning, presented at the same magnification, in Fig 10. Although the pictures show more detail than a normal low powered microscope at 40 or 100x, some fine detail in Fig 9 can not be resolved by the 3D microscope. The crater in the surface is too shallow (estimated < 5 μm) to be visible well in the present colour image. In addition, the dirt in the crack is not well visible.
Fig 9. SEM image (500x) of the paint surface of Composition, a) before and b) after
removal of pencil mark using white wishab for 1 min.
8
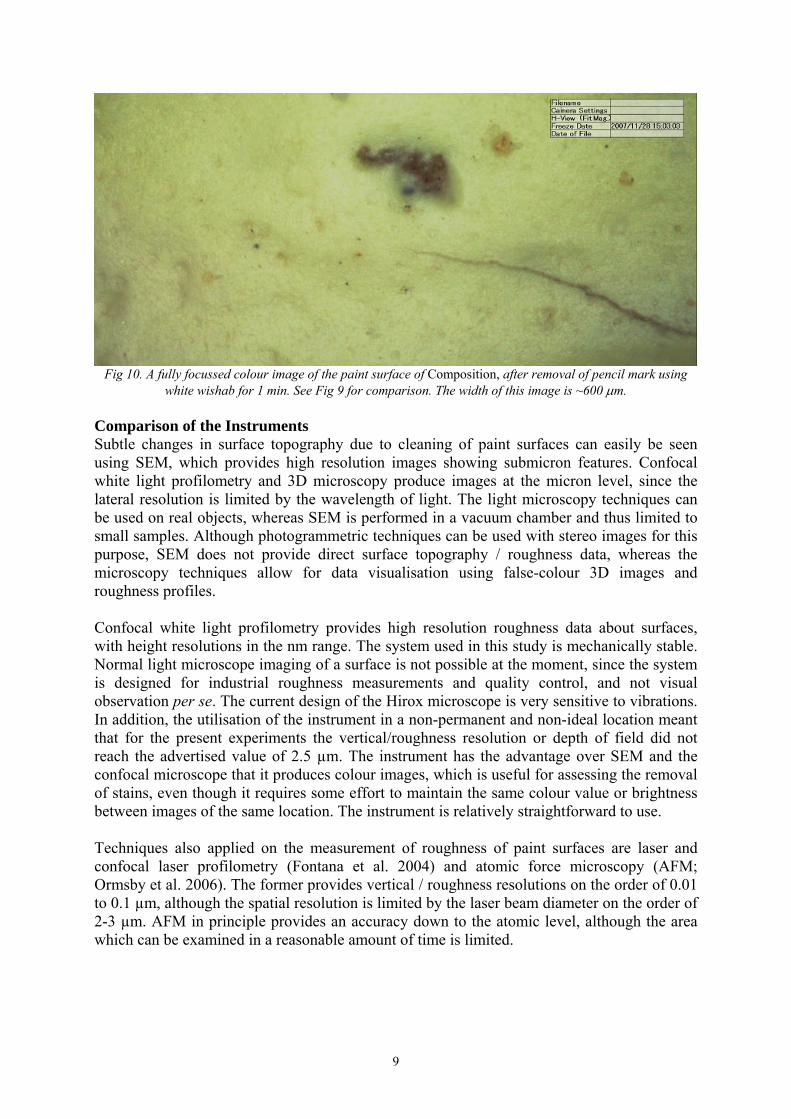
Fig 10. A fully focussed colour image of the paint surface of Composition, after removal of pencil mark using
white wishab for 1 min. See Fig 9 for comparison. The width of this image is ~600 μm. Comparison of the Instruments Subtle changes in surface topography due to cleaning of paint surfaces can easily be seen using SEM, which provides high resolution images showing submicron features. Confocal white light profilometry and 3D microscopy produce images at the micron level, since the lateral resolution is limited by the wavelength of light. The light microscopy techniques can be used on real objects, whereas SEM is performed in a vacuum chamber and thus limited to small samples. Although photogrammetric techniques can be used with stereo images for this purpose, SEM does not provide direct surface topography / roughness data, whereas the microscopy techniques allow for data visualisation using false-colour 3D images and roughness profiles. Confocal white light profilometry provides high resolution roughness data about surfaces, with height resolutions in the nm range. The system used in this study is mechanically stable. Normal light microscope imaging of a surface is not possible at the moment, since the system is designed for industrial roughness measurements and quality control, and not visual observation per se. The current design of the Hirox microscope is very sensitive to vibrations. In addition, the utilisation of the instrument in a non-permanent and non-ideal location meant that for the present experiments the vertical/roughness resolution or depth of field did not reach the advertised value of 2.5 µm. The instrument has the advantage over SEM and the confocal microscope that it produces colour images, which is useful for assessing the removal of stains, even though it requires some effort to maintain the same colour value or brightness between images of the same location. The instrument is relatively straightforward to use. Techniques also applied on the measurement of roughness of paint surfaces are laser and confocal laser profilometry (Fontana et al. 2004) and atomic force microscopy (AFM; Ormsby et al. 2006). The former provides vertical / roughness resolutions on the order of 0.01 to 0.1 µm, although the spatial resolution is limited by the laser beam diameter on the order of 2-3 µm. AFM in principle provides an accuracy down to the atomic level, although the area which can be examined in a reasonable amount of time is limited.
9
CONCLUSIONS A preliminary comparison confocal white light profilometry and 3D microscopy and scanning electron microscopy (SEM) was made to evaluate the effects of cleaning treatments on unvarnished paint surfaces. Confocal white light profilometry or 3D microscopy provide in situ quantitative roughness/topographic information about these changes, and are thus complementary techniques for SEM. Confocal white light profilometry is has a much better height resolution than 3D microscopy, but cannot provide real colour images. SEM provides the best images for a quick evaluation of surface changes, showing features on a submicron scale. In practice, confocal white light profilometry or 3D microscopy provide useful information to the conservator, even though the submicron subtle changes that can be important for the conservator can not be reached. Nevertheless, both instruments are high powered light microscopes that allow for a broad range of magnifications for full in-focus imaging, a feature that overcomes the limited depth of field in comparable low powered light microscopes. The techniques offer other features such as false colour 3-D topographical mapping that may find wider application in studies of changes in paint surfaces, for example in the relative effects of moisture treatment of paintings on canvas or panel. ACKNOWLEDGEMENTS The authors thank Maarten van Bommel, Luc Megens, Madeleine Bischoff, Netherlands Institute for Cultural Heritage, Amsterdam/Rijswijk, The Netherlands. Dirk Jan Weijer, MicrOptik, Deursen, The Netherlands, Josef Frohn, Dirk Hoffmann, and Thorsten Höring, NanoFocus AG, Oberhausen, Germany, for their technical assistance and helpful discussions. ENDNOTES 1. This paper is part of a wider investigation into water sensitive oil paints and the cleaning
of oil paint surfaces at the Netherlands Institute for Cultural Heritage in collaboration with Dutch Museums, The Courtauld Institute of Art, Tate and the Getty Conservation Institute.
2. Digital Microscope KH7700, Operation Manual. Hirox Company, Ltd. BIBLIOGRAPHY 1. A. Burnstock, K.J. van den Berg, S. de Groot and L. Wijnberg, An Investigation of Water-
Sensitive Oil Paints in 20th Century Paintings. In Learner, T. (ed.) Reprints of the Modern Paints Uncovered conference, London 2006. Los Angeles: Getty, 2008. 177-188.
2. M. Daudin et al., Dry cleaning studies of oil paint surfaces. Manuscript in preparation. ICN, 2008.
3. R. Fontana, E. Pampaloni and C. Seccaroni, The laser profilometry technique: an application for characterising the tools used to apply gesso ground to some panel paintings by Perugino. In Brunetti, B.G., Seccaroni C. and Sgamellotti A. (eds) The painting technique of Pietro Vannucci called il Perugino: proceedings of the LabS TECH. Firenze: Nardini, 2004. 57-64.
4. R. Morrison, A. Bagley-Young, A. Burnstock, K.J. van den Berg and H. van Keulen, An investigation of parameters for the use of citrate solutions for surface cleaning unvarnished paintings. Studies in Conservation 52 (2007) 255-270.
5. M. Noehles, Die Kunst des Radierens. Radiermittel im Überblick. Papier Restaurierung 3;1 (2002) 22-28.
10
6. B. Ormsby, T. Learner, M. Schilling, J. Druzik, H. Khanjian, D. Carson, G. Foster and M. Sloan, The Effects of Surface Cleaning on Acrylic Emulsion Paintings – A Preliminary Investigation. In Oberflächenreinigung; Materialien und Methoden. VDR Schriftenreihe 2, Ed. Cornelia Weyer, Theiss Verlag, Stuttgart 2006, 135-149.
7. A. Phenix and A. Burnstock, The removal of surface dirt on paintings with chelating agents. The Conservator 16 (2002) 28-38.
8. D.A. Lange, H.M. Jennings, and S.P. Shah, Analysis of surface roughness using confocal microscopy. Journal of Materials Science 28 (1993) 3879-3884.
9. P. Sandoz et al, Roughness measurement by confocal microscopy for brightness characterization and surface waviness visibility evaluation, Wear 201 (1996) 186-192.
10. W. Wei, S. Stangier and A. de Tagle, In situ characterisation of the surface of paintings before and after cleaning using white light confocal profilometry. In Proceedings of Art '05 - 8th International Conference on Non-Destructive Investigations and Microanalysis for the Diagnostics and Conservation of the Cultural and Environmental Heritage, Lecce, Italy, 15-19 May 2005.
11. W. Wei, J. Frohn and M. Weber, Characterisation of the Varnish-object Interface Using White Light Confocal Profilometry. In Proceedings of SPIE Europe Optical Metrology: Optics for Arts, Architecture, and Archaeology, Munich, 18-21 July 2007.
Back to Top
11