a comparison of fmcg logistics operations in … · a comparison of fmcg logistics operations in...
TRANSCRIPT
A COMPARISON OF FMCG LOGISTICS OPERATIONS IN THE UK
AND SOUTH AFRICA
Vasco Sanchez-Rodrigues, Andrew Potter
Cardiff University, Cardiff Business School, Logistics and Operations Management Section
ABSTRACT
Purpose
International comparison studies provide a useful opportunity in logistics to benchmark
logistics practices. Given this, it is perhaps surprising that there does not appear to be any
benchmarking studies comparing performance between the developed and developing world.
The paper aims to address this shortcoming, focusing on fast moving consumer goods
(FMCG) distribution networks from the UK and South African as comparator countries.
Design/Methodology/Approach
A two-stage study has been undertaken. Firstly, a focus group approach was undertaken to
identify the main causes of supply chain uncertainty affecting freight transport operations in
FMCG distribution. In the second phase, four case studies (two in the UK and two in South
Africa) were undertaken to examine how logistics is managed and the impact of uncertainty.
Findings
In the focus groups undertaken in both countries, the uncertainty clusters found were very
similar, if not the same. However, when looking into the findings from the case studies, the
extra miles generated due to uncertainty within the supply chains studied was greater in the
South African distribution networks studied than in their UK counterparts. Furthermore, the
UK distribution networks studied seems to be more effective in terms of uncertainty
preparedness and responsiveness than their South African counterparts.
Originality
The paper has identified significant differences in terms of uncertainty preparedness and
responsiveness within the distribution networks studied from the UK and South Africa.
Nevertheless, more case studies need to be run in both countries, and in different sectors, to
verify those differences.
A COMPARISON OF FMCG LOGISTICS OPERATIONS IN THE UK AND SOUTH AFRICA
1. INTRODUCTION
International comparison studies provide a useful opportunity to benchmark logistics
practices, identifying areas of similarity and differences both within and between industrial
sectors. This paper focuses on trends in the fast moving consumer goods (FMCG) industry,
covering products such as food, drink and toiletries. This sector is recognised a leader in
supply chain management practices (Hofman et al., 2011), with academic research
particularly focusing on developed countries (Lorentz and Hilmola, 2008). Given the
increasing internationalisation of FMCG retailers, it is perhaps surprising that there does not
appear to be any benchmarking studies comparing performance between the developed and
developing world. The paper aims to address this shortcoming, focusing on the UK and South
Africa as comparator countries. While some retailers in the South African FMCG sector have
links with retailers from the developed world (for example, Marks and Spencer and
Woolworths, Yoffie and St. George, 1997), the arrival in 2011 of Walmart through their
purchase of Massmart (BBC News, 2011) has the potential to herald new logistics challenges.
Therefore, an international comparison of practice is timely.
FMCG logistics operations are frequently orientated towards road transport. The nature of
these operations in Africa can be quite different to more developed countries, with a wide
variety of potential disruptions and delays to cause uncertainty (Christ and Ferrantino, 2011).
South Africa is no different – for example, Steyn and Bean (2011) identify the poor quality of
the road infrastructure as a major issue for logistics providers. The nature of uncertainty, and
how this is managed, provides a wider view on both supply chain operations and the external
operating environment, and therefore is also an area of focus for this paper. Previous studies
on uncertainty in logistics have tended to focus upon the developed world (such as McKinnon
et al. 2009, Sanchez-Rodrigues et al. 2009).
In the context of South Africa, there is little academic research on logistics practices. Cilliers
and Nagel (1994) provide an overview of the state of logistics within the country, and the
extent of outsourcing deployed. More recently, the Annual State of Logistics Surveys have
provided a macro-level perspective on activities within the South African logistics sector

(CSIR, 2011). This does include some international comparisons, such as logistics costs as a
percentage of GDP, but there is a lack of comparative research at a firm level.
The paper proceeds by reviewing the literature on FMCG retail distribution practices.
Subsequently, the method applied to undertake the study is outlined and justified. The
findings from the study are then presented, and the inter-relationship between management
practice and uncertainty explored. This enables some commonalities and differences to be
discussed, providing managerial implications and conclusions.
2. INTERNATIONAL FMCG RETAIL DISTRIBUTION PRACTICES
In the last 20 years, a number of authors have undertaken research on distribution formats and
patterns in the FMCG retail sector in developed countries (Fernie 1992, Sternquist 1998,
Fernie & Staines 2001, Randall et al., 2011). These studies have been focused on the
internationalisation of retail activities and have been undertaken primarily in Europe and
USA. Particularly, Fernie (1992, 1995) used factors, such as the extension of retailer power,
the degree of supply chain control, relative logistics costs, level of Information
Communication Technology (ICT) development and the relative sophistication of logistics
service provision to draw comparisons between the variation in supply chain practices
adopted by European FMCG retailers.
In these studies, the UK retailers have been considered as the most advanced and efficient in
Europe, if not in the world. One of the key success factors of the UK, and some other
European countries such as the Netherlands, is that the ownership in the FMCG retail sector is
concentrated in fewer players unlike the case of countries like Italy where the sector is
fragmented in ownership (Ahlert et al., 2011). This gives UK networks more scope for
efficiency improvements within their networks. The Netherlands have tended to be used as
comparable best practice to the UK due to, as examples, the adoption of regional distribution
centres to consolidate stock and improve responsiveness (Fernie, 1992) or the adoption of
Factory Gate Pricing to coordinate deliveries from suppliers (Potter et al., 2007, le Blanc et
al., 2006).
There are a number of areas where UK FMCG retailers have been pioneers in terms of
improving distribution management practices (Hingley et al., 2011). An example of this is the
construction of large regional distribution centres to have more control over the planning and

execution of their distribution networks (Fernie, 1992) from suppliers to stores. In particular,
Tesco has led the way for innovation and process re-engineering in FMCG distribution (Smith
and Sparks, 2004, Fernie et al., 2010). Fernie (1995) found that UK retailers were more
advanced in terms of distribution planning and ICT infrastructure than elsewhere in Europe.
Currently, the distribution of products is planned using advanced ICT systems such as
Electronic Data Interchange, Electronic Point of Sale and Sales Based Ordering. These
developments have also influenced how freight transport is planned and executed. As
McKinnon (2010) emphasised, the bigger players in the UK road freight transport sector, and
especially within the FMCG sector, have adopted telematics systems to achieve a more
dynamic vehicle route planning.
In the UK FMCG retail sector, a greater proportion of distribution networks were managed by
third-party logistics (3PL) service providers than in other European countries such as
Germany, France and Spain (Fernie 1995, Fernie and Staines 2001). This growth in
outsourcing also encouraged the larger UK logistics providers to expand into Europe (Stone,
2002). This reflects wider trends towards outsourcing FMCG logistics operations in Europe
(Wilding and Juraido, 2004).
The above provides an overview of the developments in relation to FMCG retail logistics
operations, setting the research presented below in a wider context. As noted earlier, there is
little in the way of published academic literature that provides a Southern African perspective.
Consequently, the results below provide an interesting insight for academics and practitioners
alike.
3. METHOD
In comparing the operations in the UK and South Africa, a two-stage study was undertaken.
Firstly, a series of focus groups were undertaken to identify the main causes of supply chain
uncertainty affecting freight transport operations in FMCG distribution. This gave insights
into the nature of operations in the UK and South Africa, and provided a foundation for the
later research. In the second phase, four case studies (two in the UK and two in South Africa)
were undertaken to examine how logistics is managed and the impact of uncertainty.
In the first stage of the research, four focus groups were conducted in the UK as well as one in
South Africa. As Table 1 shows, participants from different types of FMCG companies
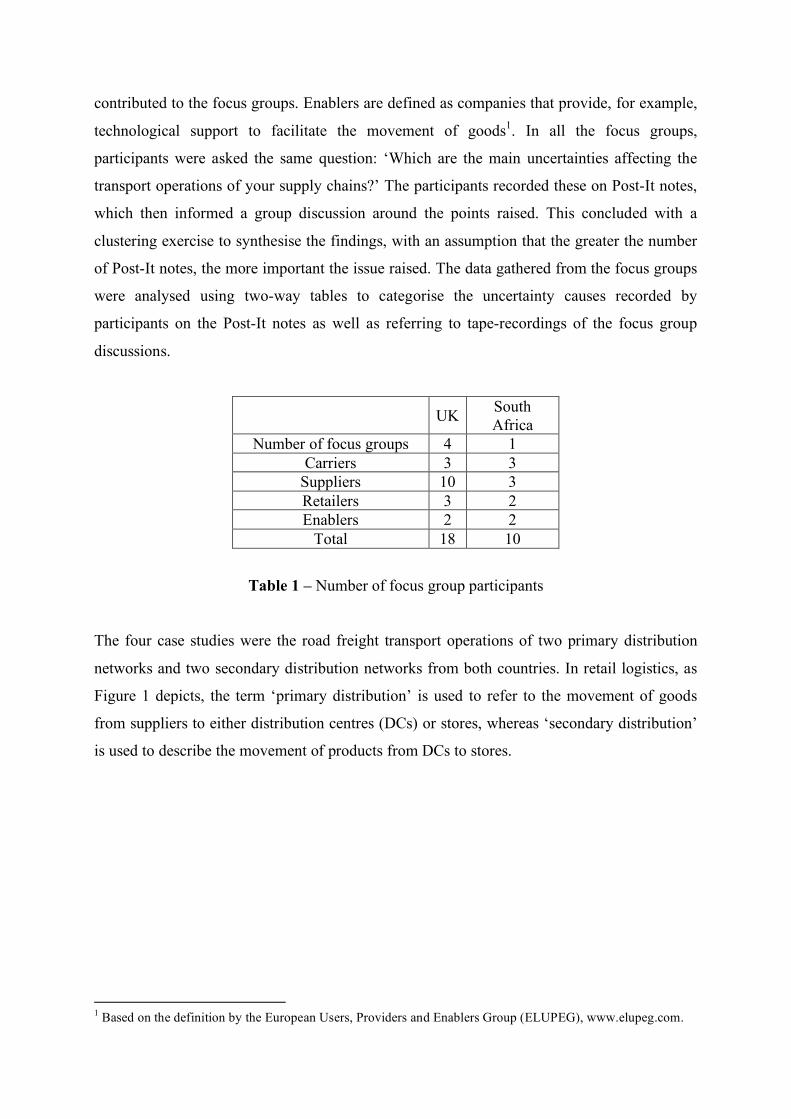
contributed to the focus groups. Enablers are defined as companies that provide, for example,
technological support to facilitate the movement of goods1. In all the focus groups,
participants were asked the same question: ‘Which are the main uncertainties affecting the
transport operations of your supply chains?’ The participants recorded these on Post-It notes,
which then informed a group discussion around the points raised. This concluded with a
clustering exercise to synthesise the findings, with an assumption that the greater the number
of Post-It notes, the more important the issue raised. The data gathered from the focus groups
were analysed using two-way tables to categorise the uncertainty causes recorded by
participants on the Post-It notes as well as referring to tape-recordings of the focus group
discussions.
UK South Africa
Number of focus groups 4 1 Carriers 3 3
Suppliers 10 3 Retailers 3 2 Enablers 2 2
Total 18 10
Table 1 – Number of focus group participants
The four case studies were the road freight transport operations of two primary distribution
networks and two secondary distribution networks from both countries. In retail logistics, as
Figure 1 depicts, the term ‘primary distribution’ is used to refer to the movement of goods
from suppliers to either distribution centres (DCs) or stores, whereas ‘secondary distribution’
is used to describe the movement of products from DCs to stores.
1 Based on the definition by the European Users, Providers and Enablers Group (ELUPEG), www.elupeg.com.
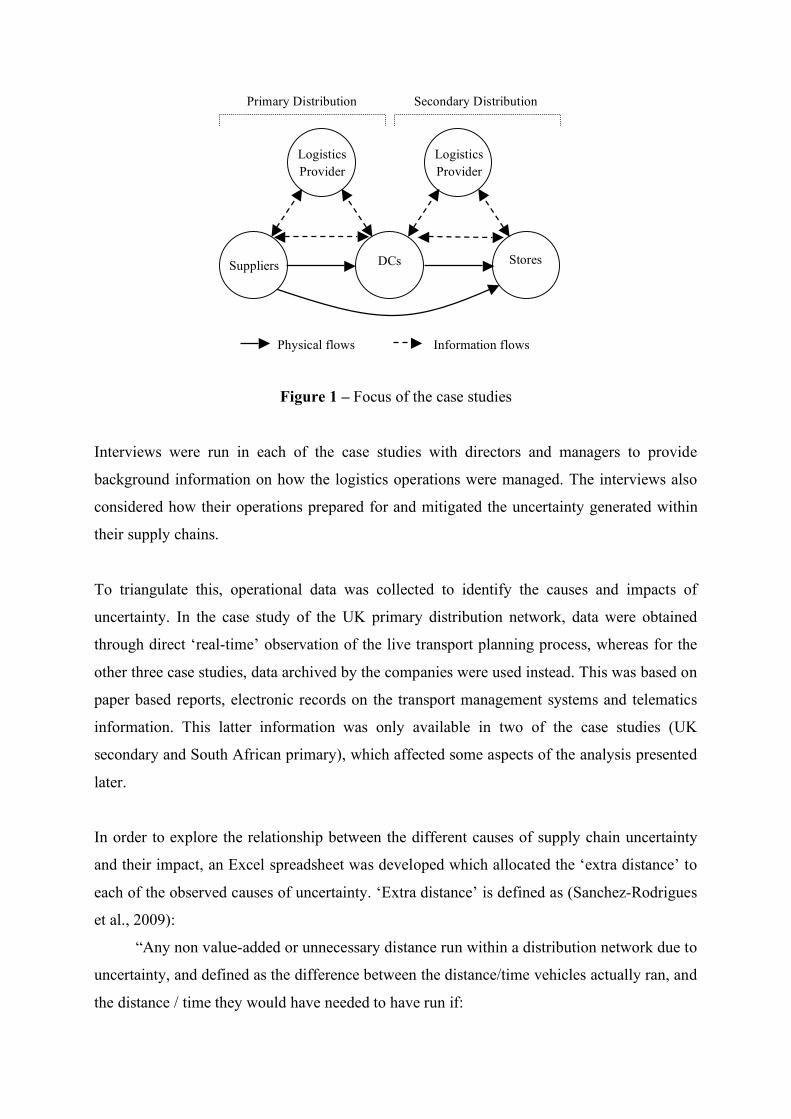
Figure 1 – Focus of the case studies
Interviews were run in each of the case studies with directors and managers to provide
background information on how the logistics operations were managed. The interviews also
considered how their operations prepared for and mitigated the uncertainty generated within
their supply chains.
To triangulate this, operational data was collected to identify the causes and impacts of
uncertainty. In the case study of the UK primary distribution network, data were obtained
through direct ‘real-time’ observation of the live transport planning process, whereas for the
other three case studies, data archived by the companies were used instead. This was based on
paper based reports, electronic records on the transport management systems and telematics
information. This latter information was only available in two of the case studies (UK
secondary and South African primary), which affected some aspects of the analysis presented
later.
In order to explore the relationship between the different causes of supply chain uncertainty
and their impact, an Excel spreadsheet was developed which allocated the ‘extra distance’ to
each of the observed causes of uncertainty. ‘Extra distance’ is defined as (Sanchez-Rodrigues
et al., 2009):
“Any non value-added or unnecessary distance run within a distribution network due to
uncertainty, and defined as the difference between the distance/time vehicles actually ran, and
the distance / time they would have needed to have run if:
Logistics Provider
Suppliers DCs Stores
Logistics Provider
Primary Distribution Secondary Distribution
Physical flows Information flows
• the transport operation had received accurate and timely information on the volumes to be
moved, and/or;
• there had been no unexpected delays at loading or unloading points, and/or;
• there had been no operational failures within the distribution network, and/or;
• there had been no congestion on the journey that could not have been foreseen”
This measure recognises that changes may affect the optimisation of the network and
therefore sees a retrospective re-planning of the network to identify what the optimum should
have been. The spreadsheet allowed the quantification of the frequency of each cause and an
estimation of the impact in terms of cost.
From the above activities, it was possible to compare and contrast the cases, and relate the
specific findings back to both the focus groups and the literature reviewed earlier. This
yielded a number of insights, which we now discuss in more detail. In doing so, we examine
the focus groups and case studies individually first, before discussing some overall
conclusions.
4. FOCUS GROUP FINDINGS
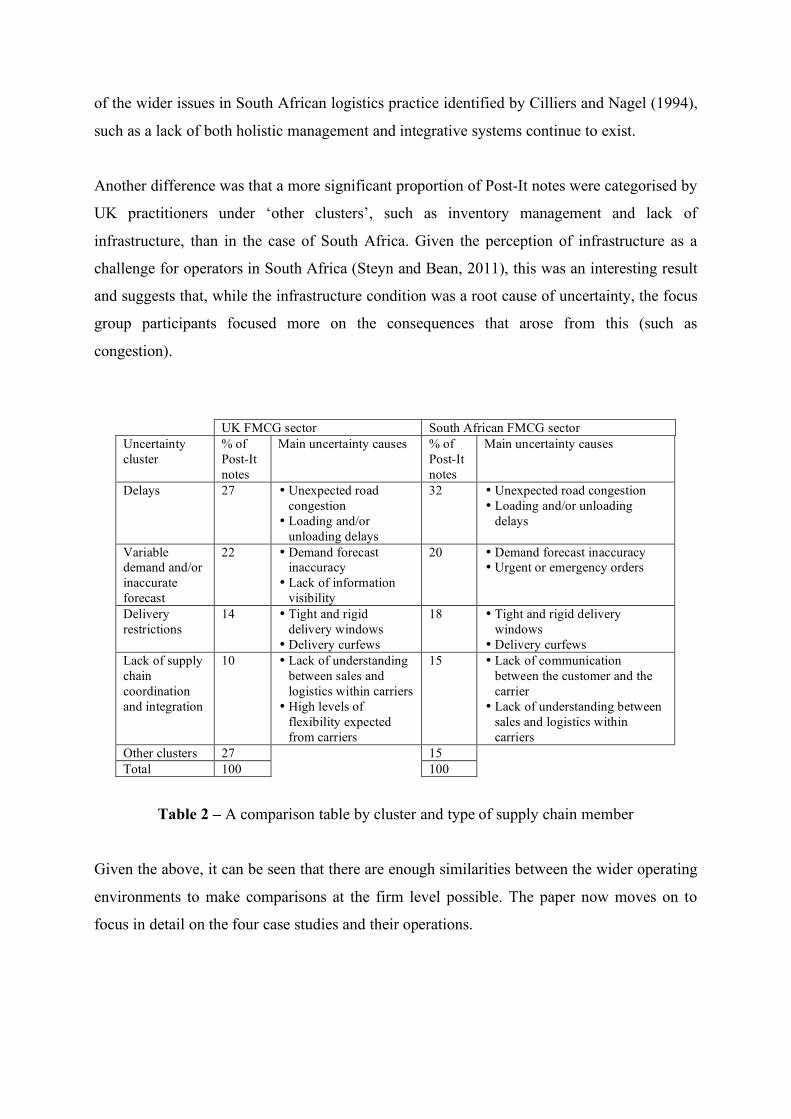
As stated earlier, the intention with the focus groups was to understand the operating
environment for FMCG retail logistics in each country, and the outcome from this is shown in
Table 2. The most significant result from this comparison is that the four main uncertainty
clusters identified in the UK focus groups were also identified in South Africa. The main
problems affecting the freight transport sectors of both countries were: delays, variable
demand and/or inaccurate forecast, delivery constraints and a lack of supply chain
coordination and integration. However, there were differences when looking at specific
causes of uncertainty.
Participants from both countries agreed that unexpected road congestion was the most
significant cause of delays. Even though the uncertainty causes categorised under each cluster
were very similar as well, differences existed in causes under the clusters of ‘variable demand
and/or inaccurate forecast’ and ‘lack of supply chain coordination and integration’. The UK
practitioners perceived the lack of information visibility as a cause under ‘variable demand
and/or inaccurate forecast’, whereas South African participants seemed to attach more
importance to urgent or emergency orders from customers. These findings suggest that some
of the wider issues in South African logistics practice identified by Cilliers and Nagel (1994),
such as a lack of both holistic management and integrative systems continue to exist.
Another difference was that a more significant proportion of Post-It notes were categorised by
UK practitioners under ‘other clusters’, such as inventory management and lack of
infrastructure, than in the case of South Africa. Given the perception of infrastructure as a
challenge for operators in South Africa (Steyn and Bean, 2011), this was an interesting result
and suggests that, while the infrastructure condition was a root cause of uncertainty, the focus
group participants focused more on the consequences that arose from this (such as
congestion).
UK FMCG sector South African FMCG sector Uncertainty cluster
% of Post-It notes
Main uncertainty causes % of Post-It notes
Main uncertainty causes
Delays 27 • Unexpected road congestion
• Loading and/or unloading delays
32 • Unexpected road congestion • Loading and/or unloading
delays
Variable demand and/or inaccurate forecast
22 • Demand forecast inaccuracy
• Lack of information visibility
20 • Demand forecast inaccuracy • Urgent or emergency orders
Delivery restrictions
14 • Tight and rigid delivery windows
• Delivery curfews
18 • Tight and rigid delivery windows
• Delivery curfews Lack of supply chain coordination and integration
10 • Lack of understanding between sales and logistics within carriers
• High levels of flexibility expected from carriers
15 • Lack of communication between the customer and the carrier
• Lack of understanding between sales and logistics within carriers
Other clusters 27 15 Total 100 100
Table 2 – A comparison table by cluster and type of supply chain member
Given the above, it can be seen that there are enough similarities between the wider operating
environments to make comparisons at the firm level possible. The paper now moves on to
focus in detail on the four case studies and their operations.
5. LOGISTICS MANAGEMENT IN THE CASE NETWORKS
The starting point for examining the case studies is to focus upon how they manage their
operations. This provides case-specific context for examining the impact of uncertainty. Table
3 depicts a comparison between the four networks studied based on four characteristics. Each
of these characteristics is now discussed in turn.
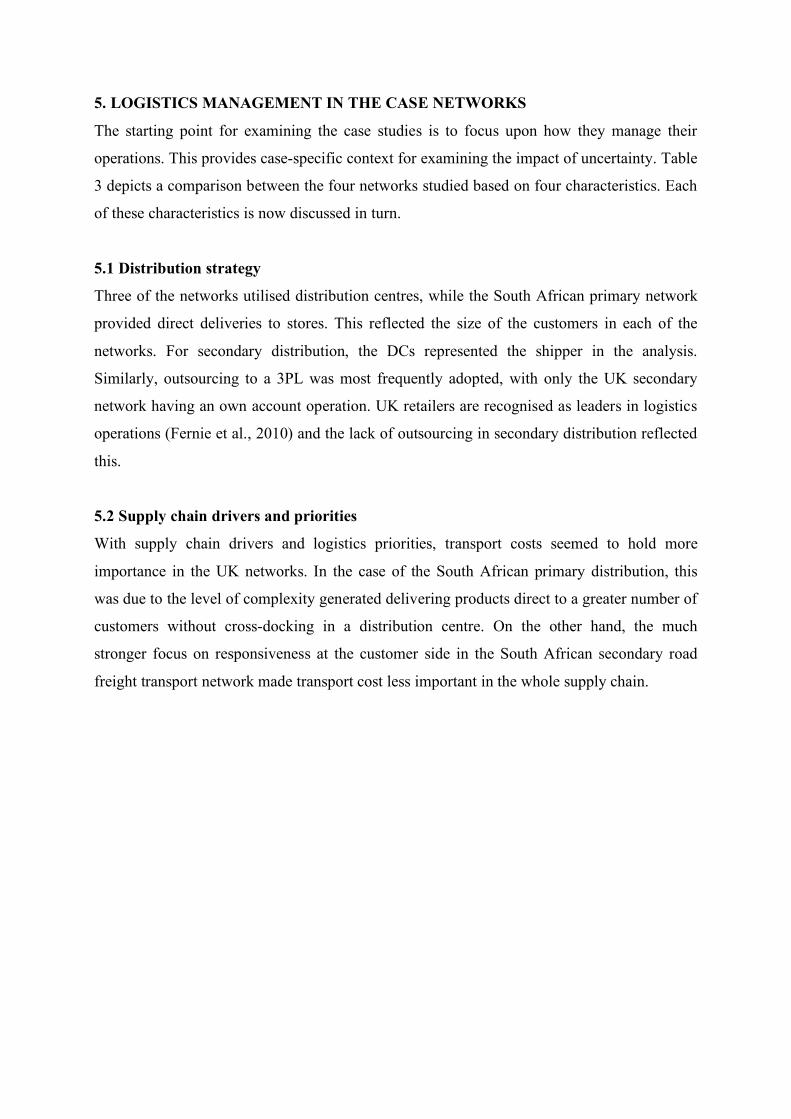
5.1 Distribution strategy
Three of the networks utilised distribution centres, while the South African primary network
provided direct deliveries to stores. This reflected the size of the customers in each of the
networks. For secondary distribution, the DCs represented the shipper in the analysis.
Similarly, outsourcing to a 3PL was most frequently adopted, with only the UK secondary
network having an own account operation. UK retailers are recognised as leaders in logistics
operations (Fernie et al., 2010) and the lack of outsourcing in secondary distribution reflected
this.
5.2 Supply chain drivers and priorities
With supply chain drivers and logistics priorities, transport costs seemed to hold more
importance in the UK networks. In the case of the South African primary distribution, this
was due to the level of complexity generated delivering products direct to a greater number of
customers without cross-docking in a distribution centre. On the other hand, the much
stronger focus on responsiveness at the customer side in the South African secondary road
freight transport network made transport cost less important in the whole supply chain.

UK South Africa
Primary Secondary Primary Secondary Network strategy Cross-docking Cross-docking Direct shipment Cross-docking Distribution
strategy Logistics provider 3PL Own account 3PL 3PL Customer service X X X X Transport costs X X Inventory costs X X X X Responsiveness X X X
Reliability X X X Delivery time compression X X X X
Supply chain drivers and priorities
Volume forecast predictability X X X
Customer delivery points 12 DCs Over 400 stores Over 500 Stores Over 100 Stores
Shipper Over 200 suppliers
22 distribution centres 1 supplier 3 distribution
centres
Carrier(s), excluding subcontractors Single 3PL
Internal transport operation plus five
3PLs Single 3PL Single 3PL
Who drives the network? Retailer Retailer Supplier Retailer
Network characteristics
Transport planning Fairly flexible transport plan
Completely flexible transport plan
Less flexible transport plan
Fairly flexible transport plan
Vehicle ownership 3PL owned and subcontracted
80% retailer owned and 20% 3PL
owned
100% owned by 3PL
100% owned by 3PL
Transport rates paid by Supplier Retailer through internal transaction Supplier Retailer Cost structure
Factors influencing the transport rates
No. vehicles, distance, time
and vehicle utilisation
No. vehicles, distance, time and vehicle utilisation
Vehicle utilisation and distance
No. vehicles, distance and
time
Table 3 – Comparison of distribution network patterns and practices
5.3 Network characteristics
Turning to the network characteristics, the secondary networks were similar in structure and
reflected Figure 1, with a small number of DCs servicing a large number of stores. The UK
primary network was also reflective of Figure 1, with a large number of suppliers delivering
to a DC network. The South African primary network was different in structure, as discussed
earlier, and focused on a single supplier servicing a range of stores. This also suggested that
whereas centralised control of the primary network (driven by the retailers) has become more
common in the UK (Potter et al., 2007), this was not yet evident in South Africa. In terms of
carriers, it was interesting to note that the own account operation included some 3PL services,
to enable benchmarking in performance.
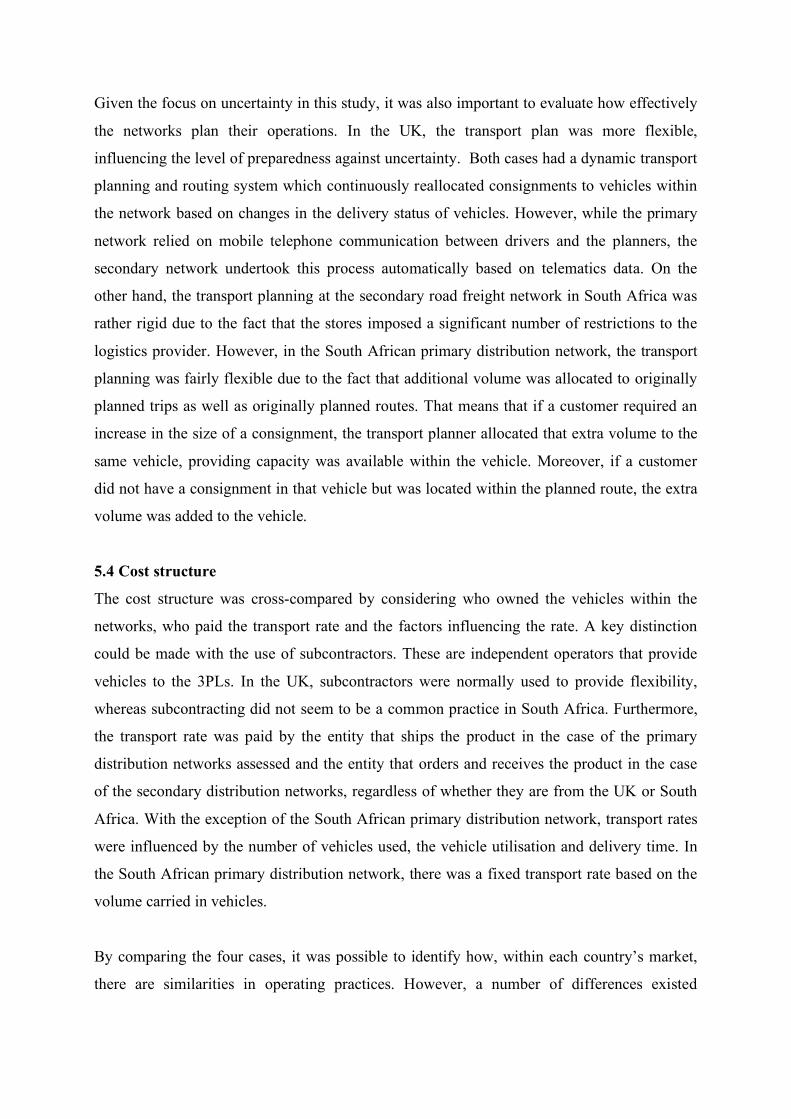
Given the focus on uncertainty in this study, it was also important to evaluate how effectively
the networks plan their operations. In the UK, the transport plan was more flexible,
influencing the level of preparedness against uncertainty. Both cases had a dynamic transport
planning and routing system which continuously reallocated consignments to vehicles within
the network based on changes in the delivery status of vehicles. However, while the primary
network relied on mobile telephone communication between drivers and the planners, the
secondary network undertook this process automatically based on telematics data. On the
other hand, the transport planning at the secondary road freight network in South Africa was
rather rigid due to the fact that the stores imposed a significant number of restrictions to the
logistics provider. However, in the South African primary distribution network, the transport
planning was fairly flexible due to the fact that additional volume was allocated to originally
planned trips as well as originally planned routes. That means that if a customer required an
increase in the size of a consignment, the transport planner allocated that extra volume to the
same vehicle, providing capacity was available within the vehicle. Moreover, if a customer
did not have a consignment in that vehicle but was located within the planned route, the extra
volume was added to the vehicle.
5.4 Cost structure
The cost structure was cross-compared by considering who owned the vehicles within the
networks, who paid the transport rate and the factors influencing the rate. A key distinction
could be made with the use of subcontractors. These are independent operators that provide
vehicles to the 3PLs. In the UK, subcontractors were normally used to provide flexibility,
whereas subcontracting did not seem to be a common practice in South Africa. Furthermore,
the transport rate was paid by the entity that ships the product in the case of the primary
distribution networks assessed and the entity that orders and receives the product in the case
of the secondary distribution networks, regardless of whether they are from the UK or South
Africa. With the exception of the South African primary distribution network, transport rates
were influenced by the number of vehicles used, the vehicle utilisation and delivery time. In
the South African primary distribution network, there was a fixed transport rate based on the
volume carried in vehicles.
By comparing the four cases, it was possible to identify how, within each country’s market,
there are similarities in operating practices. However, a number of differences existed
between the two countries, with UK operations generally appearing more efficient than those
in South Africa. The impact of these differences on managing uncertainty is now considered.
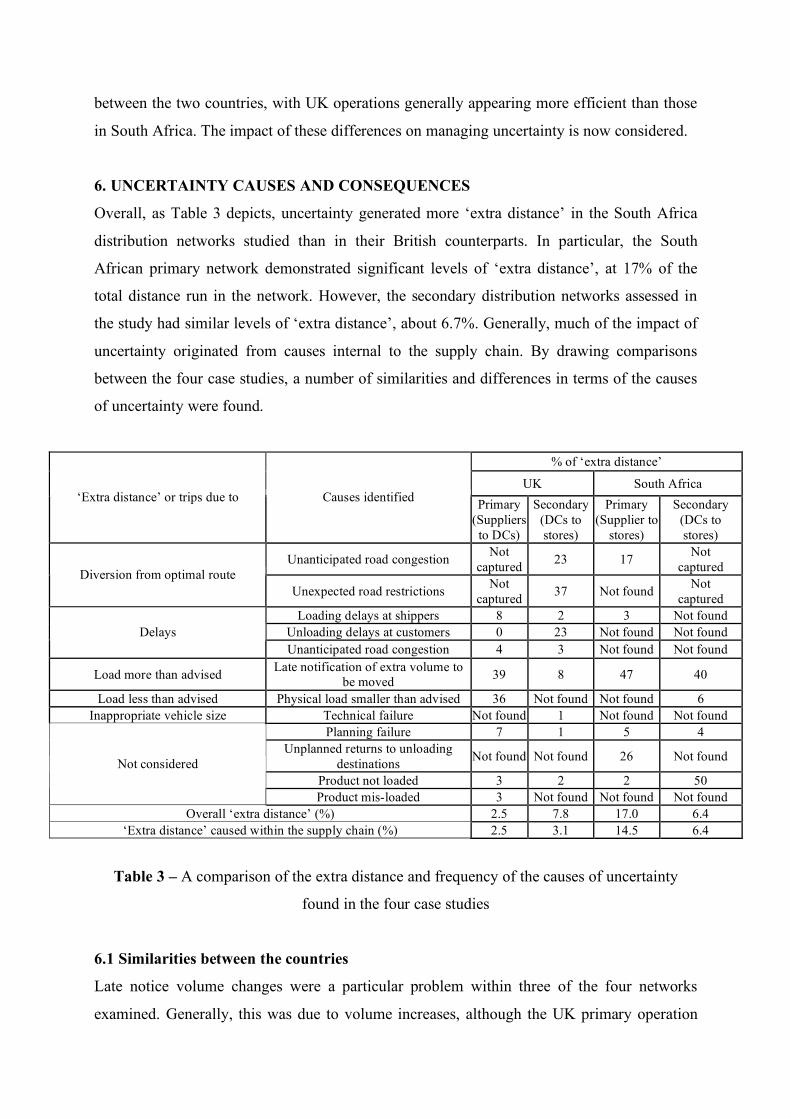
6. UNCERTAINTY CAUSES AND CONSEQUENCES
Overall, as Table 3 depicts, uncertainty generated more ‘extra distance’ in the South Africa
distribution networks studied than in their British counterparts. In particular, the South
African primary network demonstrated significant levels of ‘extra distance’, at 17% of the
total distance run in the network. However, the secondary distribution networks assessed in
the study had similar levels of ‘extra distance’, about 6.7%. Generally, much of the impact of
uncertainty originated from causes internal to the supply chain. By drawing comparisons
between the four case studies, a number of similarities and differences in terms of the causes
of uncertainty were found.
% of ‘extra distance’
UK South Africa ‘Extra distance’ or trips due to Causes identified Primary
(Suppliers to DCs)
Secondary (DCs to stores)
Primary (Supplier to
stores)
Secondary (DCs to stores)
Unanticipated road congestion Not captured 23 17 Not
captured Diversion from optimal route Unexpected road restrictions Not
captured 37 Not found Not captured
Loading delays at shippers 8 2 3 Not found Unloading delays at customers 0 23 Not found Not found Delays Unanticipated road congestion 4 3 Not found Not found
Load more than advised Late notification of extra volume to be moved 39 8 47 40
Load less than advised Physical load smaller than advised 36 Not found Not found 6 Inappropriate vehicle size Technical failure Not found 1 Not found Not found
Planning failure 7 1 5 4 Unplanned returns to unloading
destinations Not found Not found 26 Not found
Product not loaded 3 2 2 50 Not considered
Product mis-loaded 3 Not found Not found Not found Overall ‘extra distance’ (%) 2.5 7.8 17.0 6.4
‘Extra distance’ caused within the supply chain (%) 2.5 3.1 14.5 6.4
Table 3 – A comparison of the extra distance and frequency of the causes of uncertainty
found in the four case studies
6.1 Similarities between the countries
Late notice volume changes were a particular problem within three of the four networks
examined. Generally, this was due to volume increases, although the UK primary operation
also had issues with loads being smaller than expected, leading to the transport plan becoming
sub-optimal. It was interesting to examine the response to this in both countries. In the UK,
the 3PL firstly looked to maximise the utilisation of its own fleet, reflecting the cost and
pricing arrangements that existed. Any shortfall in capacity was met through using
subcontractors. By contrast, subcontracting was not used in South Africa. In the primary
network, additional consignments were frequently added to planned loads, increasing fleet
utilisation. By contrast, in the secondary network, the retailer was willing to pay for excess
capacity and, consequently, the time utilisation of vehicles averaged 55%. Therefore, the
unused capacity could accommodate volume increases. This lack of use of subcontractors
suggested that different practices existed between the two countries.
Congestion was also found to be a common issue between the UK and South Africa.
Although data was only collected in two of the cases, the focus group results suggested that it
would also be an issue in the remaining cases. The UK secondary network was particularly
affected by this (along with road restrictions), which reflected the urban operating
environment of the DC where data was collected. Of particular interest in this research was
the knock on effect from congestion throughout the rest of the network. Because both of these
cases included a degree of dynamism in their transport planning, the wider impact of
congestion was reduced and the disruption minimised.
6.2 Differences between the cases
In the South African primary network, 26% of the extra distance was caused by vehicles
returning to correct mistakes in delivery. The cross-dock approach used in this system
accounted for a large proportion of the uncertainty. This network was driven by small
customers with direct deliveries to their premises. Consequently, the number of deliveries to
be made in each journey was significantly higher than the other cases, with up to 7 deliveries
per journey. By contrast, the secondary networks had up to 3 deliveries.
In the UK secondary distribution network, a significant cause of uncertainty was unloading
delays at customers (in this case, stores), with 23% of the extra distance observed. Stores
frequently delayed vehicles at their facilities, particularly due to the unloading staff not being
ready to receive the vehicle. This added ‘extra distance’ when, because of the delay, the
vehicle could not make a scheduled collection from a supplier. Therefore, the vehicle returned
directly to the depot and an extra return trip then had to be scheduled from the depot to the
supplier to collect the product.
A final difference between the cases related to products not being loaded at distribution
centres. This generated 50% of the ‘extra distance’ in the South African secondary
distribution network. Comparisons between the cases identified the reason for this as being
different approaches to vehicle scheduling in the secondary delivery network. In the UK, the
vehicle waited to be fully loaded, with stores receiving a late delivery if necessary. By
contrast, in South Africa the stores were required to have an on-time delivery, and therefore
the vehicles had to leave regardless of the amount of product loaded, with a second delivery
later on if necessary.
Overall, the causes of uncertainty within the case studies reflected the focus group findings,
with a greater emphasis on issues within the supply chain than external factors. It was also
interesting to note that even if the scale of the impact is the same, the cases adopted different
managerial approaches, reflecting the findings in section 5.
7. DISCUSSION AND CONCLUSIONS
In the focus groups undertaken in both countries, the uncertainty clusters found were very
similar, if not the same. The main four uncertainty clusters affecting road freight transport
operations were: delays, variable demand and/or inaccurate forecast, delivery restrictions and
lack of supply chain coordination and integration. However, when looking into the findings
from the case studies, the ‘extra distance’ generated due to uncertainty within the supply
chain studied was greater in the South African primary distribution network studied than in
the UK counterpart, although the secondary networks were similar. Overall, inefficiency
generated by customers seemed to have much more impact on transport performance in the
South African networks studied.
The study found a strong link between the distribution network patterns and management, and
the uncertainty preparedness and responsiveness. The direct shipment strategy applied within
the South African primary network, with a greater number of drops in each delivery journey,
increased the complexity and transport inefficiency within their network. The fact that cross-
docking and transport consolidation was applied in the other three networks seem to have a
considerable impact on their levels of ‘extra distance’. Furthermore, subcontracting seemed to
enable UK distribution networks to have flexible fleet capacity and, as a result, respond to
uncertainty in a more effective and economically efficient manner. The lack of use of
subcontractors in South Africa may have reflected a desire to maintain service quality levels,
or concerns about delivery security.
Two other similarities between the networks related to volume changes and store unloading.
In the case of the former, it is clear that volume changes were an issue common throughout
the case networks studied, and were also evident from the focus group results. This suggested
that issues related to supply chain coordination were common in both markets. Issues with
store unloading procedures were evident in two of the case examples, one from each country.
This suggested that there is a need to focus on the total logistics process, including store
operations.
Transport costs seemed to be more important for customers in the UK than for South Africa.
This may have reflected the competitive nature of the UK FMCG sector. However, customers
within the South African distribution networks studied generally added more complexity and
restrictions to their networks, such as the rigid delivery plan for the secondary network. Such
constraints increased costs, and reflected a greater focus on, for example, delivery reliability.
Overall, it seems that, while the UK FMCG sector can be considered to be mature in its
logistics operations (Fernie et al., 2010), there are many practices and challenges that are
similar in the South African market. This enhances the transferability of best practice between
these operating environments, to improve the efficiency of logistics networks. The arrival of
global retail brands in South Africa can only help to accelerate this change.
The paper has identified significant differences in terms of uncertainty preparedness and
responsiveness within the distribution networks studied from the UK and South Africa.
Nevertheless, more case studies need to be run in both countries, and in different sectors, to
verify those differences. Further, clarification is needed as to the extent to which
macroeconomic factors, such as the fuel and labour cost, have an impact on road freight
transport costs. Another area for research relates to the level of power that retailers and
logistics providers have within FMCG sectors in both countries, as this can influence
uncertainty generation and mitigation.
REFERENCES Ahlert, D., Blut, M., and Evanschitzky, H. (2010), “Current status and future evolution of retail formats”, in Krafft, M. and Mantrala, M.K. (Ed) Retailing in the 21st Century, 2nd Edition, Springer, Heidelberg, pp. 337-356.
Alexander, N. (1997), International Retailing, Blackwell, Oxford. BBC News (2011), “Wal-Mart cleared to buy South Africa’s Massmart”, 31st May 2011, available at: http://www.bbc.co.uk/news/business-13601247 (accessed 5 September 2011). Bookbinder, J. and Tan, C. (2003), “Comparison of Asian and European logistics systems”, International Journal of Physical Distribution and Logistics Management, Vol. 33, No. 1, pp. 36-58.
Christ, N. and Ferrantino, M.J. (2011), “Land transport for export: The effects of cost, time and uncertainty in sub-Saharan Africa”, World Development, in press.
Cilliers, W.W. and Nagel, P.J.A. (1994), “Logistics trends in South Africa”, International Journal of Physical Distribution and Logistics Management, Vol. 24, No. 7, pp. 4-14.
CSIR (2011) “State of Logistics surveys”, available at: http://www.csir.co.za/sol/ (accessed 5 September 2011).
Fernie, J. (1992) “Distribution strategies of European retailers”, European Journal of Marketing, Vol. 26, No. 8/9, pp. 35-47. Fernie, J. (1995), “International comparisons of supply chain management in grocery retailing”, Service Industries Journal, Vol. 15, No. 4, pp. 134-147. Fernie, J., Sparks, L. and McKinnon, A. (2010), “Retail logistics in the UK: past, present and future”, International Journal of Retail and Distribution Management, Vol. 38, No. 11/12, pp. 894-914.
Fernie J. and Staines H. (2001), “Towards and understanding of European grocery supply chains”, Journal of Retailing and Consumer Services, Vol. 8, pp. 26-36.
Goh, M. and Ang, A. (2000), “Some logistics realities in Indonesia”, International Journal of Physical Distribution and Logistics Management, Vol. 30, No. 10, pp. 887-911.
Hingley, M., Lindgreen, A., Grant, D. and Kane, C. (2011), “Using fourth-party logistics management to improve horizontal collaboration among grocery retailers”, Supply Chain Management: An International Journal, Vol. 16, No. 5, pp. 316-327. Hofman, D., O’Marah, K. and Elvy, C. (2011), “The Gartner Supply Chain Top 25 for 2011”, available at: http://www.gartner.com/DisplayDocument?doc_cd=213740 (accessed 19 December 2011).
Laarhoven, P., Berglund, M. and Peters, M. (2000), “Third-party logistics in Europe – Five years later”, International Journal of Physical Distribution and Logistics Management, Vol. 30, No. 5, pp. 425-442. Lorentz, H. and Hilmola, O-P. (2008), “Supply chain management in emerging market economies: a review of the literature and analysis of the Russian grocery retail sector”, International Journal of Integrated Supply Management, Vol. 4, No. 2, pp. 201-229.
McKinnon, A.C. (2010), “Environmental sustainability: a new priority for logistics managers”, in McKinnon, A. C., Cullinane, S., Browne, M. & Whiteing, A. (Eds.) Green
Logistics - Improving the Environmental Sustainability of Logistics, London, Kogan Page, pp. 3-30. McKinnon, A., Edwards, J., Piecyk, M. and Palmer, A. (2009), “Traffic congestion, reliability and transport performance: A multi-sectoral assessment”, International Journal of Logistics: Research and Applications, Vol. 12, No. 5, pp. 1-15.
Potter, A., Mason, R. and Lalwani, C.S. (2007), “Analysis of Factory Gate Pricing in the UK grocery supply chain”, International Journal of Retail and Distribution Management, Vol. 35, No. 10, pp. 821-834. Randall, W.S., Gibson, B.J., Defee, C.C. and Williams, B.D. (2011), “Retail supply chain management: key priorities and practices”, International Journal of Logistics Management, Vol. 22, No. 3, pp. 390-402.
Sanchez-Rodrigues, V., Cowburn, J., Potter, A., Naim, M. M., and Whiteing, A. (2009), “Defining ‘extra distance as a measure to evaluate road transport performance”, Proceedings of the International Symposium on Logistics, Istanbul, Turkey, 5th– 7th July 2009, pp. 680-687. Smith, D. and Sparks, L. (2004), “Logistics in Tesco: past, present and future”, in Fernie, J. and Sparks, L. (Eds) Logistics and Retail Management, 2nd Edition, Kogan Page, London, pp. 101-120. Sternquist, B. (1998), International Retailing, Fairchild Publications, New York.
Steyn, W. and Bean, W. (2011), “The potential effects of deteriorating road quality and maintenance in South Africa”, in King, D. (Ed) 7th Annual State of Logistics Survey for South Africa 2010, CSIR, Pretoria, pp. 30-35. Stone, M. (2002), “Has Europe fulfilled its promise to UK third-party logistics provision?” European Business Review, Vol. 14, No. 2, pp. 81-91. Wilding, R. and Juraido, R (2004), “Customer perceptions on logistics outsourcing in the European consumer goods industry”, International Journal of Physical Distribution and Logistics Management, Vol. 34, No. 8, pp. 628-644.
Yoffie, D.B. and St. George, A. (1997), “Woolworths South Africa”, Harvard Business School Cases.