a community attitude survey of washtenaw … · a community attitude survey of washtenaw county...
TRANSCRIPT
A COMMUNITY ATTITUDE SURVEY OF WASHTENAW COUNTY VOTERS
REGARDING AATA Final Draft
Survey Conducted - November 2011
A study conducted by: With assistance from:

Project conducted by:
Hugh M. Clark, Ph.D., CJI Research Corporation
Robert R. Dykes, Triad Research Group
Catherine Smithers, CJI Research Corporation
Tiffany Houdeshell, CJI Research Corporation CJI Research Corporation 224 East Gay Street Columbus, Ohio 43215 (614) 338-1008 TRIAD Research Group, Inc. 20325 Center Ridge Road, Suite 450 Cleveland, OH 44116 (440) 895-5353
DRAFT
Page 0
Table of Contents Table of Contents ................................................................................................................................ 0 List of Figures ...................................................................................................................................... 2 Introduction .......................................................................................................................................... 4
Survey Methodology ........................................................................................................................ 5 Survey data source .......................................................................................................................... 7 Survey sample ................................................................................................................................. 8 Survey Purpose ............................................................................................................................. 10
Background: Attitudes toward Change in the Quality of Life in Washtenaw County ........................... 11 Satisfaction with living in Washtenaw County ................................................................................ 12 Is the sense of change in quality of life locally positive or negative? .............................................. 13
Use of and Opinions toward AATA and Transit Service in General .................................................... 15 Voter’s use of AATA ...................................................................................................................... 16 Opinions of AATA service .............................................................................................................. 17
Variation in ratings by region ...................................................................................................... 18 AATA Job Rating ........................................................................................................................... 20 How important do voters believe it is to provide public transit? ...................................................... 22
How important do voters in the several regions believe it is to provide public transit? ................. 23 Awareness of new county-wide transit agency ............................................................................... 24 Awareness of Transit Master Plan ................................................................................................. 27
The Initial Vote................................................................................................................................... 29 How people voted at the outset of the survey ................................................................................ 30 Why respondents said they had voted as they did ......................................................................... 32
Key Factors Associated with Tendencies to Support or Oppose a Transit Expansion Issue .............. 33 Demographics of the initial vote ..................................................................................................... 34
Demographics of sets of pro and anti-issue respondents ............................................................ 35 Voting tendencies of the demographic groups ............................................................................ 36
The vote tendencies by region ....................................................................................................... 38 The vote and the perceived direction of change in Washtenaw County ......................................... 39 The vote and AATA job performance rating ................................................................................... 40 The vote and the belief that it is important to provide public transit service in Washtenaw County . 42
Consistency and Movement in the Transit Expansion Vote................................................................ 43 Strength of support or opposition ................................................................................................... 44 How the regions voted on the re-vote question .............................................................................. 47 Consistency and movement of vote before and after exposure to pro and anti-issue statements ... 48 Composite measure of strength of the vote .................................................................................... 50 How strong and weak vote tendencies vary with demography ....................................................... 51
Reasons for which Some People Vote Against a Millage Increase to Expand Transit Services ......... 55 Anti-issue statements..................................................................................................................... 56
Affordability ................................................................................................................................. 56 Fairness ..................................................................................................................................... 57 The need for public transit service, and the issue of unnecessary transit spending .................... 58 Enough or not enough transit service ......................................................................................... 58
Relationship of perceived need for more transit service and the strength of support or opposition . 59 Comparison of negative statements, 2009 and 2011 ..................................................................... 61 Differences in millage rates among areas of the county ................................................................. 62 Further detail on the effect of different transit tax rates within the county ....................................... 63

DRAFT
Page 1
The economy and attitudes toward funding public transit ............................................................... 64 Slight change in views of the economy .......................................................................................... 65
Arguments in Favor of a Millage to Expand Transit Services ............................................................. 66 Importance of selected service improvements ............................................................................... 67
Importance of service improvements to transit using and non-using households ........................ 70 Using AATA transit tax funds for Washtenaw County share of funds to operate Ann Arbor / Detroit rail service, by voter groups ........................................................................................................... 72
How the Public Perceives Sets of Services as Related ...................................................................... 73 How voters perceive which service improvements "go together" .................................................... 74 Service Improvement tendencies quantified ................................................................................... 76 Combining the two transit improvement attitude tendencies .......................................................... 77
Reasons to Vote for a Transit expansion issue .................................................................................. 78 impact of AATA on the community as reasons to support a transit expansion issue ...................... 79
Region and the reasons to support transit expansion ................................................................. 81 Perceived benefits of transit ........................................................................................................... 82
Appendix A: Survey Questionnaire .................................................................................................... 84 Appendix B: Demographics of the Sample Components .................................................................... 92
Demographics of sample sources .................................................................................................. 93

DRAFT
Page 2
List of Figures Figure 1 Survey data source ................................................................................................................ 7 Figure 2 Washtenaw County divided into analysis regions................................................................... 8 Figure 3 Satisfaction with Quality of Life in Washtenaw County ......................................................... 12 Figure 4 Is Washtenaw County better, worse, or the same as five years ago? .................................. 13 Figure 5 Use of AATA and/or other public transportation ................................................................... 16 Figure 6 Overall opinion of AATA....................................................................................................... 17 Figure 7 How overall opinion of AATA varies among the regions ....................................................... 18 Figure 8 Opinion of AATA by region, among only those ..................................................................... 19 Figure 9 Job rating of AATA ............................................................................................................... 20 Figure 10 How do ratings of AATA as a transit provider vary among the regions? ............................. 21 Figure 11 How do ratings of AATA as a transit provider vary among the regions among only those able to offer an opinion? .................................................................................................................... 21 Figure 12 Perceived importance of providing public transit in Washtenaw County ............................. 22 Figure 13 Region and the perceived importance of transit ................................................................. 23 Figure 14 Awareness of new county-wide transit agency ................................................................... 24 Figure 15 Coded descriptions of what was heard about a new county-wide transit agency ............... 24 Figure 16 Awareness of Transit Master Plan ..................................................................................... 27 Figure 17 The Vote – Initial vote question only .................................................................................. 30 Figure 18 Why respondents said they had voted as they did ............................................................. 32 Figure 19 Demographics of the initial vote (column percentages) ...................................................... 34 Figure 20 The initial vote of demographic groups (row percentages) ................................................. 37 Figure 21 The vote tendencies by region ........................................................................................... 38 Figure 22 Relationship of the vote to the sense of Washtenaw County getting better, worse, same .. 39 Figure 23 How the vote varies (or does not) with perceived job performance .................................... 40 Figure 24 First vote, by job rating....................................................................................................... 41 Figure 25 The vote and perceived importance of providing public transit ........................................... 42 Figure 26 Change from first to second vote question ......................................................................... 44 Figure 27 How the regions voted on the re-vote question .................................................................. 47 Figure 28 Vote and revote ................................................................................................................. 48 Figure 29 Composite measure of strength of the vote ........................................................................ 50 Figure 30 The demography of the vote groupings (column percent) .................................................. 52 Figure 31 Demographics of the vote consistency and vote movement groupings (row percent) ........ 53 Figure 32 Agreement and disagreement with anti-issue statements .................................................. 56 Figure 33 Fairness of varied millage rates ......................................................................................... 57 Figure 34 Perceived need for more transit service and the strength of support or opposition ............. 59 Figure 35 Detail of voter response to negative statements about the transit millage issue ................. 60 Figure 36 Comparison of negative statements, 2009 and 2011 ......................................................... 61 Figure 37 Differences in millage rates among areas of the county ..................................................... 62 Figure 38 Effect of different transit tax rates within the county ........................................................... 63 Figure 39 The economy and attitudes toward funding public transit ................................................... 64 Figure 40 Slight change in views of the economy .............................................................................. 65 Figure 41 Importance of service improvements ................................................................................. 67 Figure 42 Within County variation in perceived importance of transit improvements .......................... 69 Figure 43 Importance of service improvements to transit using and non-transit using households .... 70 Figure 44 Rail to Detroit ..................................................................................................................... 72 Figure 45 How voters perceive which service improvements "go together" ........................................ 74 Figure 46 Service Improvement tendencies quantified ....................................................................... 76
DRAFT
Page 3
Figure 47 Combining the two transit improvement attitude tendencies .............................................. 77 Figure 48 Impact of AATA on the community as reason to support a transit millage issue ................. 79 Figure 49 Reasons to vote for a transit expansion issue, by region ................................................... 81 Figure 50 Perceived benefits of transit ............................................................................................... 82 Figure 51 Demographics of sample sources ...................................................................................... 93

DRAFT
Page 4
Introduction

DRAFT
Page 5
Survey Methodology A survey of Washtenaw County voters was conducted the fall of 2011. It followed a similar survey conducted in 2009. Between October 25, and December 1, 2011, a total of 1,356 interviews were completed with a random sample of registered voters in Washtenaw County. Interviews were conducted by a combination of telephone and online methods. A voter list of all voters in the county was used as the sample frame. (The "sample frame" is the total population from which a sample is drawn.) The list was by household, with all voters in a household included along with key information on their voting history and age. To best reflect the likely voter turnout in any coming election, a sample of voters who participated in two or more of the last four general elections was selected. In addition, all voters registered since January 2010 were also included. In order to allow for the increasing proportion of voters accessible only by cell-phone, the 2011 sample was based on voters' addresses. This approach differs from the 2009 method, which used a traditional random-digit-dialed list of “landline” telephone numbers as the basis for sampling (the "sample frame"). It should be noted that voter lists do not include telephone numbers. Telephone numbers can be added only by matching names and addresses to privately held databases, including credit rating agencies and other proprietary sources. A random sample of households was drawn from the total list. In each household, to adapt to the fact that telephone samples tend to be biased toward older persons (since they are more likely to rely on landlines and to be at home more of the time) the sample was arranged to make the youngest member of the household with an appropriate voting history the first member of the household to be asked for when contacting the household. The sample was matched to telephone numbers using a total of four databases (Targus, Info USA, Experian and Acxiom). A match of 62% was obtained. Those voters with a matched telephone number were included in the telephone portion of the survey and were called by professional interviewers. Thirty-eight percent (38%) of the sample was not matched to a telephone number, a fact indicating a high probability that persons at the address use only cell-phones, although they also could have unpublished numbers. (Cell phones are not included in the matching process unless accidentally because they were very recently "ported" from a landline.) These voters were contacted by mail using the following procedure:
A postcard notification was sent indicating that the voter named would be receiving a second mailing shortly with a small token of appreciation and two options for participation (a simple URL for an online version of the survey and a toll-free number to call to be interviewed).
The postcard also contained the simple URL and a toll-free number to call if the respondent preferred not to wait for the more complete follow-up invitation.

DRAFT
Page 6
Using best practices for mailed surveys, a letter was sent in an 8½ by 11 inch Priority Mail envelope. While very costly, this is attention-getting and signifies to the recipient that something important has arrived. Each letter was personally addressed.
Each envelope contained an invitation to go online to the URL provided or to call a toll-free number during certain hours. Each envelope also contained (again, by "best practices") $2 cash. This practice serves as an indicator of serious intent by the researcher and an implied guarantee that the promise of a further compensation will be honored. This approach has been shown to be far more effective than promises of compensation upon completion with no
advance cash or sweepstakes – both of which are largely dismissed by an increasingly skeptical public.
No paper copy of the survey was sent. To use a paper copy carries certain methodological problems in controlling the branching and randomization needed within the survey. Response was only online or by telephone.
The purpose of the cash and the priority mail envelope was to signify the fact that the sponsors greatly valued the opinions they were seeking, and to make credible to statement that the respondent would be paid additional money upon completion of the survey.
For those who had not yet responded, a follow-up reminder postcard was mailed.
While this was a very time-consuming process, it paid dividends in excellent information. A total of 1,100 were mailed with the objective of achieving a return rate of 20%, or 220 completions to reach the contracted total of 1,200 respondents. Ultimately response exceeded that target, and 365 responded to the mailing. Of the 1,100 mailed, 104 were returned as undeliverable. Thus, 996 were effectively delivered and 365 responded, for a response rate of 37%. A basic telephone sample of 901 interviews was completed by calling households successfully matched to telephone numbers, for a final sample size of 1,356.

DRAFT
Page 7
Figure 1 Survey data source
Survey data source Figure 1 provides a view of the data sources that resulted from the methods described above. The total unweighted number of interviews conducted by outgoing telephone calling was 991, while the mailed survey resulted in 301 online responses and 64 responses via the toll-free call-in line. When weighted, the data from the outgoing telephone survey accounted for 76% of the responses, while the mailed survey accounted for 24% (20% online and 4% by toll-free call in).
DRAFT
Page 8
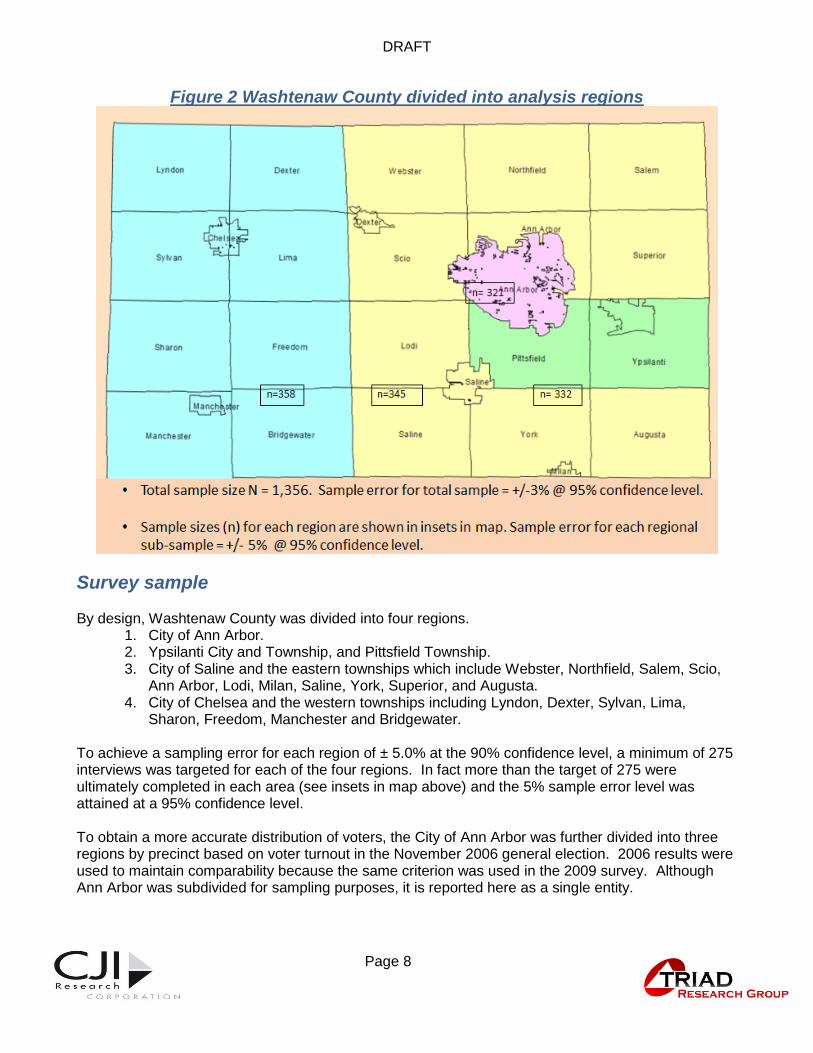
Survey sample By design, Washtenaw County was divided into four regions.
1. City of Ann Arbor. 2. Ypsilanti City and Township, and Pittsfield Township. 3. City of Saline and the eastern townships which include Webster, Northfield, Salem, Scio,
Ann Arbor, Lodi, Milan, Saline, York, Superior, and Augusta. 4. City of Chelsea and the western townships including Lyndon, Dexter, Sylvan, Lima,
Sharon, Freedom, Manchester and Bridgewater.
To achieve a sampling error for each region of ± 5.0% at the 90% confidence level, a minimum of 275 interviews was targeted for each of the four regions. In fact more than the target of 275 were ultimately completed in each area (see insets in map above) and the 5% sample error level was attained at a 95% confidence level. To obtain a more accurate distribution of voters, the City of Ann Arbor was further divided into three regions by precinct based on voter turnout in the November 2006 general election. 2006 results were used to maintain comparability because the same criterion was used in the 2009 survey. Although Ann Arbor was subdivided for sampling purposes, it is reported here as a single entity.
Figure 2 Washtenaw County divided into analysis regions
DRAFT
Page 9
With 1,356 respondents, the overall survey results have a margin of error of no more than ± 2.95% (rounded to +3% in the map above) at the 95% confidence level when the distribution of responses is approximately 50:50, and is less than +2.95% when the distribution is skewed. For example if a response of the entire sample were 80% "yes"/ 20% "no," the sample error for that statistic would be +2%. Upon completion of the interviewing, the results were weighted by region based on the gender and age in proportion to the likely voters in the county overall.
Throughout the report, percentages are rounded to the nearest whole percent. This results in the sum of some percentages equaling 99% or 101%. This is not an error and should be ignored.

DRAFT
Page 10
Survey Purpose
In both 2009 and 2011, the survey had several basic purposes. They are:
Examining attitudes and behaviors in the background of a proposed transit expansion issue, including voters’ opinions of quality of life in Washtenaw County, awareness and household use of public transit service, and the perceived importance of providing and expanding transit service in the county.
Measuring support for a possible one mil property tax increase to fund services that are described in the Transit Master Plan (TMP). That plan was developed through a combination of public participation and formal transportation planning. While public participation is extremely important and useful in developing a plan, as a practical matter only a limited number of citizens tend to participate in such opportunities for input. A scientifically constructed survey tests the concepts in a broader setting providing an opportunity for the voice of a wider public to be heard.
Understanding reasons for supporting or opposing the transit expansion and associated millage increase.
Examining patterns of change that may have occurred since the previous survey in 2009.
In addition, in 2011, the robust, address-based sampling methods, although time-consuming, were used to guarantee that the survey would serve as a benchmark against which future results could be measured with confidence.

DRAFT
Page 11
Background: Attitudes toward Change in the Quality of Life in Washtenaw
County

DRAFT
Page 12
Figure 3 Satisfaction with Quality of Life in Washtenaw County
Satisfaction with living in Washtenaw County As in 2009, total of 95% or respondents are very or somewhat satisfied with Washtenaw County as a place to live1. Of these, 61% are very satisfied and 34% are somewhat satisfied. Only 4% said they are somewhat or very dissatisfied with Washtenaw County. Given the heated rhetoric since 2009 regarding economic conditions, this seems to indicate that the local realities of life-quality are more important than media in creating a sense of satisfaction with life at the local level. A majority of voters in most demographic subgroups said they were very satisfied with Washtenaw County as a place to live. The exceptions were:
The youngest voters (47%, very satisfied) and those earning less than $30,000 (48%). But even in those cases, the sum of those very or somewhat satisfied was 94% and 88%, respectively.
In all sub-groups more than half said they are either very or somewhat satisfied.
The percent of those very satisfied was highest in Ann Arbor (68%) and (as it also was in 2009) slightly lower among residents in the Ypsilanti region (53%).
1 The apparent 1% change in "somewhat satisfied" is a result of a rounding difference of less than 1/2 of 1% and
should be ignored.

DRAFT
Page 13
Figure 4 Is Washtenaw County better, worse, or the same as five years ago?
Is the sense of change in quality of life locally positive or negative? In both 2009 (24%) and 2011 (22%), almost one-fourth of voters said that "Washtenaw County is a better place to live today than it was five years ago." In 2009 another 39% said it was the same as five years previously, while in 2011, statistically the same percentage (40%) thought it was unchanged as a place to live today. As a result, the total percent of optimists saying it is either better or the same remained statistically the same, 63% in 2009 and 62% in 2011. The only statistically significant change was in the percent saying it was worse than five years ago. While in 2009, 25% felt it was worse in 2009 than in 2004, in 2011, 29% felt that way. Given economic news during the past five years, that result is hardly surprising. Overall, with a few exceptions, most voters continue to feel that things are the same or better today than they were five years previously. There was very little demographic variation in response to this question. A plurality of most groups said the county is about the same today as it was five years ago, while the rest were divided between saying it is better or worse. A few groups were slightly more likely to say the county is worse today compared to five years ago. They included:
Voters in the West townships (18% better compared to 30% worse). This group was also more pessimistic than other regions in 2009.
DRAFT
Page 14
35 to 49 year olds (19% to 31%) were also more pessimistic than other age groups in 2009.
There was a change in relative optimism of partisans between 2009 and 2011. In 2009, Republicans were quite pessimistic (19% better to 29% worse), but in 2011, the ratio was much more balanced and optimistic (28% better to 23% worse). However, Independents became the most pessimistic group, with only 16% suggesting that things were better now and 34% that they were worse. Among Independents, that compares to 22% better and 27% worse in 2009.
While national data are not strictly comparable, it is interesting to note that in October, 2009 an NBC News/Wall Street Journal poll taken at roughly the same time as the Washtenaw County survey, found that 32% felt the country was headed in the "right direction," while 52% felt it was headed in the wrong direction2. In October of 2011, only 17% felt it was headed in the "right direction" and 74% in the "wrong direction." This was a major shift toward a very pessimistic view. The questions in the Washtenaw County survey are, of course, quite different from the national survey. The national question is more politically oriented, and the local question reported here is more oriented to quality of life. What is interesting is that the national movement toward a pessimistic sense of a slide in the "wrong direction" and the heated rhetoric suggestive of a great decline in many aspects of life reflected in the national survey has not permeated the local sense of stability of life-quality locally in the same manner.
2 NBC News/Wall Street Journal Poll conducted by the polling organizations of Peter Hart (D) and Bill McInturff
(R). Jan. 22-24, 2012. N=1,000 adults nationwide.
DRAFT
Page 15
Use of and Opinions toward AATA and Transit Service in General

DRAFT
Page 16
Figure 5 Use of AATA and/or other public transportation
Voter’s use of AATA In 2009, forty percent (40%) of survey respondents said they or another household member had ridden AATA or other transit services in Washtenaw County during the past year. That percentage was unchanged in 2011 when, overall, 40% said either they or someone in their household had used transit services in Washtenaw County in the past year. IN addition, 60% are not living in rider households and 1% do not know if others in the household used transit. As we will see later in the report, the subgroups less likely to have used public transit are also less supportive of the proposed transit expansion issue. Groups more likely to say they or someone else in their household have used transit services in the past year included those who are:
Residents of the City of Ann Arbor (66%)
Residents of in the Ypsilanti area (40%)
18 to 34 year olds (45%, down from 56% in 2009)
Democrats (50%)
Those who make all calls on a cell phone (48%)
In contrast, groups least likely to say they or another person in the household have used transit services include voters who are:
Residents of the West townships (23% )
Residents of the East townships (26%)
Men (35% compared to 42% of women)
Seniors 65 or older (29%)
Republicans (21%)
Those who use a cell phone for half their calls (35%) or for fewer than half (37%).

DRAFT
1. Page 17 Page 17
Figure 6 Overall opinion of AATA
Opinions of AATA service Respondents were asked “Have you heard of the Ann Arbor Transportation Authority, which is often called AATA or The Ride?” Just as in 2009, in 2011 95% of the voters said they have heard of it, and only 5% were unaware of AATA. When asked in 2011 if they had a favorable or unfavorable opinion of AATA, a total of 62% said they had either a very or somewhat favorable opinion. This is, for all practical purposes, the same response as the 65% who had that opinion in 2009. The very favorable opinion may have increased slightly from 26% to 28%, but this difference is at the margin of sample error and we cannot be sure it represents a real change. In 2009, only 7% had either an unfavorable opinion of AATA or volunteered that they had mixed opinions. In 2011 those percentages were essentially the same, with a total of 8% unfavorable. However, in both 2009 and 2011 approximately one fourth (23% in 2009 and 25% in 2011) did not have an opinion of the transit authority although they said they had heard of it. Given that AATA operates in only a portion of the county, and that 60% of likely voters live in households in which no one uses any of the county's transit services, this level of uncertainty is not surprising. However, it does suggest that almost one fourth of likely voters' basic attitudes toward AATA are fluid – a fact that represents both an opportunity to make a case for a positive view, and a vulnerability for an agency that would be a core component of a new county-wide system.
DRAFT
1. Page 18 Page 18
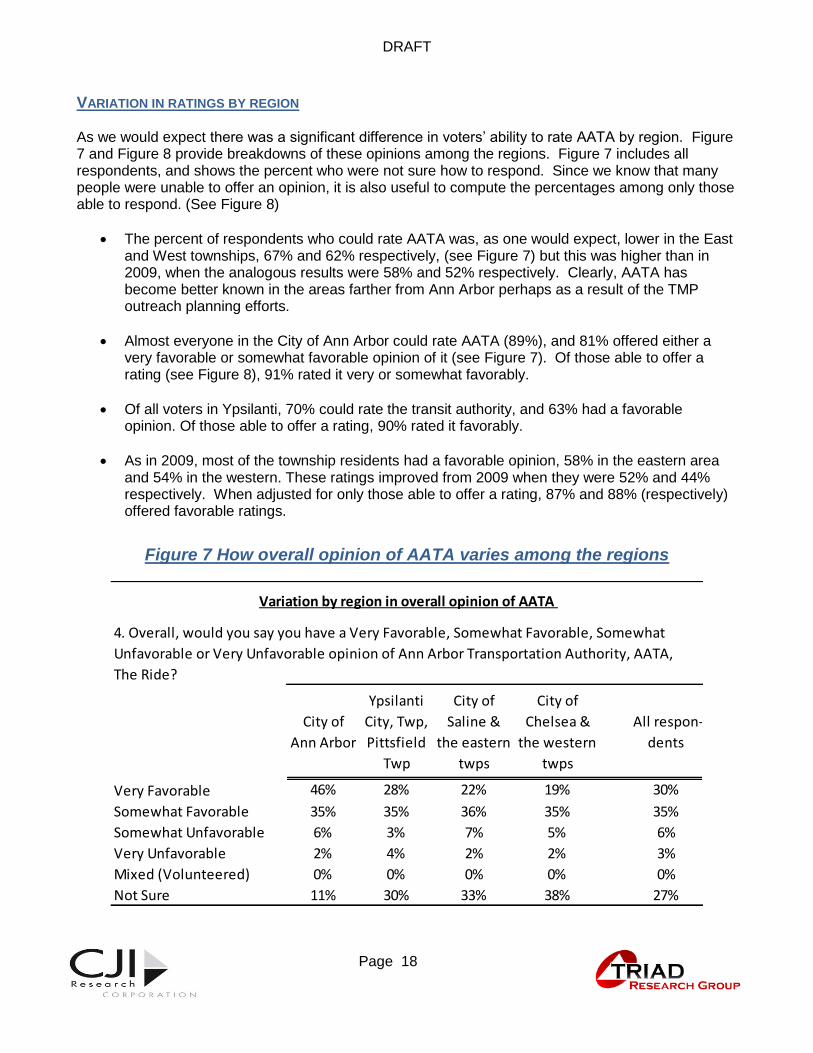
VARIATION IN RATINGS BY REGION As we would expect there was a significant difference in voters’ ability to rate AATA by region. Figure 7 and Figure 8 provide breakdowns of these opinions among the regions. Figure 7 includes all respondents, and shows the percent who were not sure how to respond. Since we know that many people were unable to offer an opinion, it is also useful to compute the percentages among only those able to respond. (See Figure 8)
The percent of respondents who could rate AATA was, as one would expect, lower in the East and West townships, 67% and 62% respectively, (see Figure 7) but this was higher than in 2009, when the analogous results were 58% and 52% respectively. Clearly, AATA has become better known in the areas farther from Ann Arbor perhaps as a result of the TMP outreach planning efforts.
Almost everyone in the City of Ann Arbor could rate AATA (89%), and 81% offered either a very favorable or somewhat favorable opinion of it (see Figure 7). Of those able to offer a rating (see Figure 8), 91% rated it very or somewhat favorably.
Of all voters in Ypsilanti, 70% could rate the transit authority, and 63% had a favorable opinion. Of those able to offer a rating, 90% rated it favorably.
As in 2009, most of the township residents had a favorable opinion, 58% in the eastern area and 54% in the western. These ratings improved from 2009 when they were 52% and 44% respectively. When adjusted for only those able to offer a rating, 87% and 88% (respectively) offered favorable ratings.
Figure 7 How overall opinion of AATA varies among the regions
City of
Ann Arbor
Ypsilanti
City, Twp,
Pittsfield
Twp
City of
Saline &
the eastern
twps
City of
Chelsea &
the western
twps
All respon-
dents
Very Favorable 46% 28% 22% 19% 30%
Somewhat Favorable 35% 35% 36% 35% 35%
Somewhat Unfavorable 6% 3% 7% 5% 6%
Very Unfavorable 2% 4% 2% 2% 3%
Mixed (Volunteered) 0% 0% 0% 0% 0%
Not Sure 11% 30% 33% 38% 27%
4. Overall, would you say you have a Very Favorable, Somewhat Favorable, Somewhat
Unfavorable or Very Unfavorable opinion of Ann Arbor Transportation Authority, AATA,
The Ride?
Variation by region in overall opinion of AATA
DRAFT
1. Page 19 Page 19
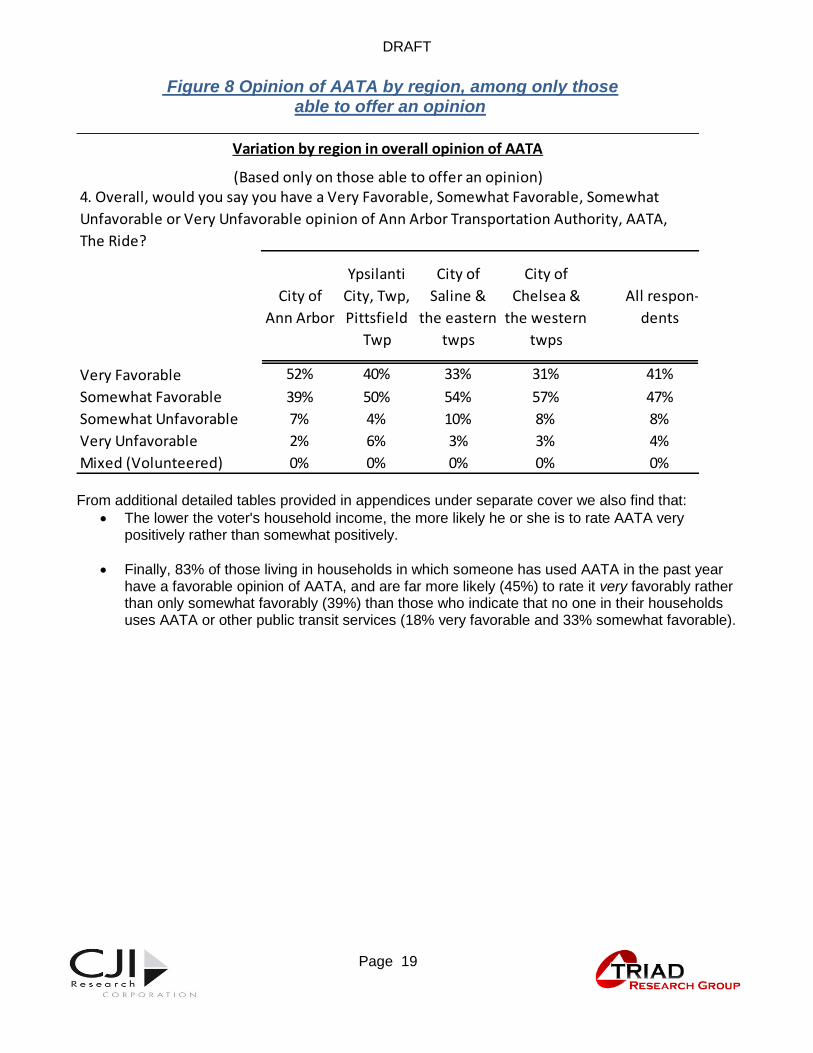
Figure 8 Opinion of AATA by region, among only those able to offer an opinion
From additional detailed tables provided in appendices under separate cover we also find that:
The lower the voter's household income, the more likely he or she is to rate AATA very positively rather than somewhat positively.
Finally, 83% of those living in households in which someone has used AATA in the past year have a favorable opinion of AATA, and are far more likely (45%) to rate it very favorably rather than only somewhat favorably (39%) than those who indicate that no one in their households uses AATA or other public transit services (18% very favorable and 33% somewhat favorable).
City of
Ann Arbor
Ypsilanti
City, Twp,
Pittsfield
Twp
City of
Saline &
the eastern
twps
City of
Chelsea &
the western
twps
All respon-
dents
Very Favorable 52% 40% 33% 31% 41%
Somewhat Favorable 39% 50% 54% 57% 47%
Somewhat Unfavorable 7% 4% 10% 8% 8%
Very Unfavorable 2% 6% 3% 3% 4%
Mixed (Volunteered) 0% 0% 0% 0% 0%
Variation by region in overall opinion of AATA
4. Overall, would you say you have a Very Favorable, Somewhat Favorable, Somewhat
Unfavorable or Very Unfavorable opinion of Ann Arbor Transportation Authority, AATA,
The Ride?
(Based only on those able to offer an opinion)
DRAFT
1. Page 20 Page 20
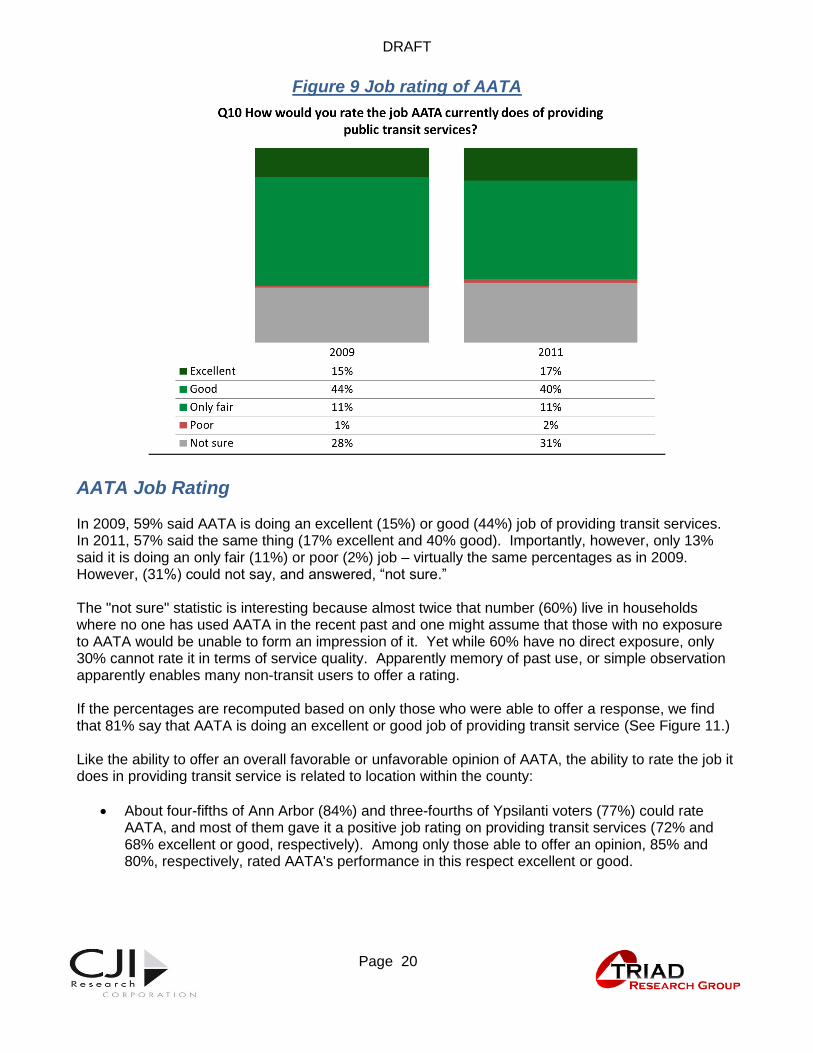
Figure 9 Job rating of AATA
AATA Job Rating In 2009, 59% said AATA is doing an excellent (15%) or good (44%) job of providing transit services. In 2011, 57% said the same thing (17% excellent and 40% good). Importantly, however, only 13% said it is doing an only fair (11%) or poor (2%) job – virtually the same percentages as in 2009. However, (31%) could not say, and answered, “not sure.” The "not sure" statistic is interesting because almost twice that number (60%) live in households where no one has used AATA in the recent past and one might assume that those with no exposure to AATA would be unable to form an impression of it. Yet while 60% have no direct exposure, only 30% cannot rate it in terms of service quality. Apparently memory of past use, or simple observation apparently enables many non-transit users to offer a rating. If the percentages are recomputed based on only those who were able to offer a response, we find that 81% say that AATA is doing an excellent or good job of providing transit service (See Figure 11.) Like the ability to offer an overall favorable or unfavorable opinion of AATA, the ability to rate the job it does in providing transit service is related to location within the county:
About four-fifths of Ann Arbor (84%) and three-fourths of Ypsilanti voters (77%) could rate AATA, and most of them gave it a positive job rating on providing transit services (72% and 68% excellent or good, respectively). Among only those able to offer an opinion, 85% and 80%, respectively, rated AATA's performance in this respect excellent or good.

DRAFT
1. Page 21 Page 21
In contrast, in the eastern townships only 60% and in the West only 57% could rate AATA’s job performance. Also, their ratings of AATA on providing transit services were less positive, probably a reflection of the limited service provided by AATA in these two areas. (East 46% excellent or good, and West 40% excellent or good). Among only those able to offer an opinion, 79% and 81%, respectively, rated AATA's performance in this respect excellent or good.
Figure 10 How do ratings of AATA as a transit provider vary among the regions?
Figure 11 How do ratings of AATA as a transit provider vary among the regions among only those able to offer an opinion?
City of
Ann Arbor
Ypsilanti
City,
Twp,
Pittsfield
Twp
City of
Saline &
the
eastern
twps
City of
Chelsea &
the
western
twps
All
respon-
dents
Excellent 27% 20% 10% 11% 17%
Good 52% 39% 35% 32% 40%
Only Fair 12% 12% 10% 8% 11%
Poor 2% 2% 2% 2% 2%
Not Sure 7% 27% 44% 46% 31%
Variation by region in rating of AATA as a transit provider
10. How would you rate the job A-A-T-A, The Ride currently does of providing public transit
services? Would you say they do an Excellent Job, a Good Job, an Only Fair Job or a Poor
Job?
City of
Ann Arbor
Ypsilanti
City, Twp,
Pittsfield
Twp
City of
Saline &
the
eastern
twps
City of
Chelsea &
the
western
twps
All
respon-
dents
Excellent 29% 27% 18% 21% 24%
Good 56% 53% 61% 60% 57%
Only Fair 13% 16% 18% 15% 16%
Poor 2% 3% 4% 4% 3%
Variation by region in rating of AATA as a transit provider
10. How would you rate the job A-A-T-A, The Ride currently does of providing public transit
services? Would you say they do an Excellent Job, a Good Job, an Only Fair Job or a Poor Job?
(Based only on those able to offer an opinion)

DRAFT
1. Page 22 Page 22
Figure 12 Perceived importance of providing public transit in Washtenaw County
How important do voters believe it is to provide public transit? More than two-thirds of voters (69%) said it is extremely (36%) or very (33%) important to provide public transit services in Washtenaw County. The balance tended to say it is only somewhat important (22%) to provide public transit services in the county, while only a few (8%) said it was not very important.

DRAFT
1. Page 23 Page 23
Figure 13 Region and the perceived importance of transit
HOW IMPORTANT DO VOTERS IN THE SEVERAL REGIONS BELIEVE IT IS TO PROVIDE PUBLIC TRANSIT? Voters in Ann Arbor (total, 80%) and the Ypsilanti area (total, 79%) were more likely to say it is extremely or very important to provide transit services in the county than were voters in the East (total, 60%) and West (total, 56%) townships. Most voters consider transit to have some importance. That is, very few voters (8% county-wide) said it is not very important to have public transit service. The primary differentiation is between the percent perceiving it as "extremely important," and those who perceive it as "very important." In other words most people do not reject public transit, but they assign it varied levels of necessity.
City of Ann
Arbor
Ypsilanti City
and Township,
and Pittsfield
Township
City of Saline
and the
eastern
townships
City of
Chelsea and
the western
townships All voters
Column N % Column N % Column N % Column N % Column N %
Extremely Important 45% 43% 30% 24% 36%
Very Important 35% 36% 30% 32% 33%
Somewhat Important 15% 14% 29% 27% 22%
Not Very Important 5% 5% 9% 18% 9%
Not Sure 0% 1% 3% 1% 1%
11. How important do
you think it is to
provide public transit
services in
Washtenaw County?
Would you say it is
Survey region and the perceived importance of public transit

DRAFT
1. Page 24 Page 24
Figure 14 Awareness of new county-wide transit agency
Awareness of new county-wide transit agency Slightly more than one-third of respondents have heard of a new county-wide transit agency. A new county-wide transit agency is among the key elements of the Transit Master Plan. At the time of the survey in 2011, approximately one-third said they had become aware of it prior to being told about it in the survey. When asked what they remembered, they gave a variety of answers. Their answers were categorized and a
summary appears in Figure 15 showing the percent of respondents answering the question who gave each type of response. A respondent was allowed to give more than one answer. For this reason the sum exceeds 100%.
Figure 15 Coded descriptions of what was heard about a new county-wide transit agency
Category of comment % of responses*
Expansion of bus routes / expansion of AATA 39%
Regional / county-wide / connect cities in the county 28%
One authority or organization / consolidation / unify transit 8%
Mention of rail 7%
Taxes will rise / need millage / need levy 6%
General awareness only/No knowledge of details 30%
What have you heard about a county-wide transit agency?
* Multiple responses allowed. Percentages sum to more than 100%

DRAFT
1. Page 25 Page 25
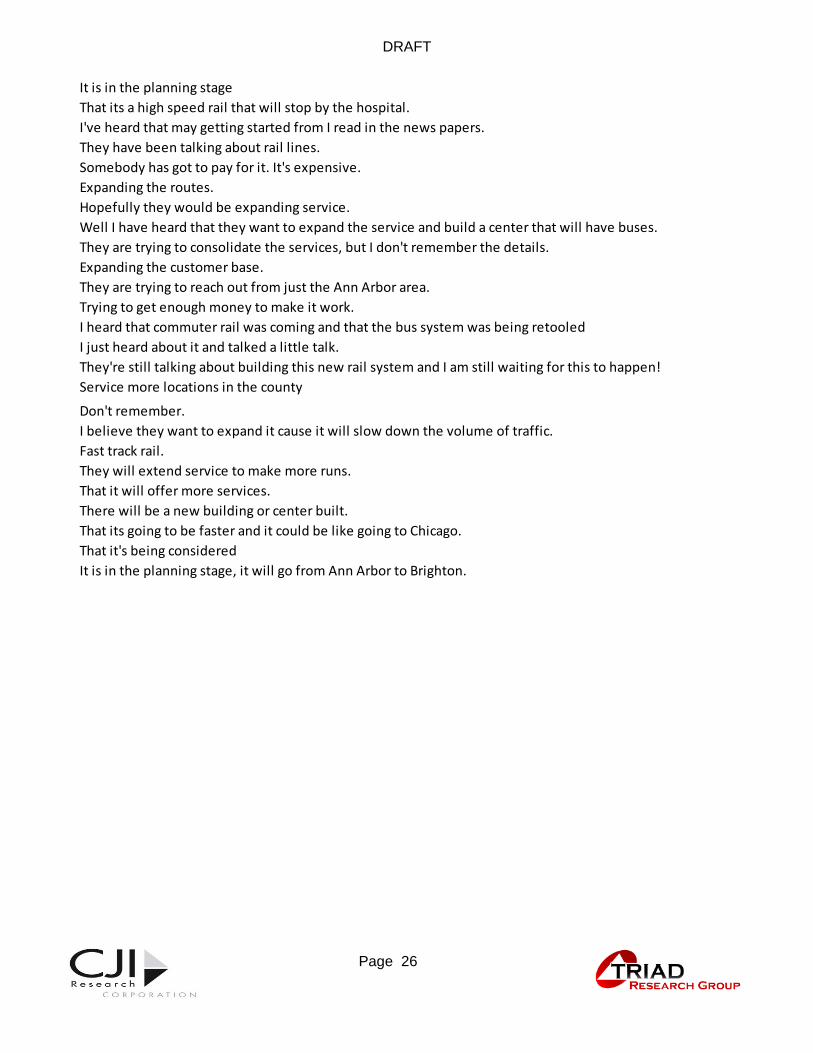
The most frequent comment (39%) was that the existing AATA or service in general would be expanded. The second most common specific comment (28%) was that the system would connect parts of the county or cities within the county. Only very few mentions (8%) were made of organizational structure (all existing services being brought under one entity) or the tax and financial implications of the change (6%). A few (7%) mentioned rail. A random sample of the comments is shown below.
They might do it.
Some connection with a train system
That more public transportation is being considered for areas not currently served by AATA.
just they are going to try and expand and reach the outlying towns.
A committee has been looking at establishing a regional transportation program.
Commuter rail possibility, a new parking structure on Fuller near the UM medical campus.
Transportation from the smaller towns.
Route expansion.
Bringing various public transportation companies in county under one authority.
They are still working on it.
That it will be providing more service cross county wide.
It would improve efficiency
They are being reorganized on a county wide basis.
There is an effort to extend the bus service and possibly introduce light rail. I don't know any details.
Expand services, especially to the University people.
They plan to have county wide transit .
That it would run for longer hours.
I've seen ads that they were looking for input.
There may be a move to add mass transit to the city.
County wide transportation.
Connecting all villages, towns etc to AA
I heard things about a new rail service
They are trying to develop one.
Service expands to serve more people.
That there is a plan in the works
There will be a new train going in.
There will be a rail between Ann Arbor and Willow Run.
They are trying to make a better public transit system.
DRAFT
1. Page 26 Page 26
It is in the planning stage
That its a high speed rail that will stop by the hospital.
I've heard that may getting started from I read in the news papers.
They have been talking about rail lines.
Somebody has got to pay for it. It's expensive.
Expanding the routes.
Hopefully they would be expanding service.
Well I have heard that they want to expand the service and build a center that will have buses.
They are trying to consolidate the services, but I don't remember the details.
Expanding the customer base.
They are trying to reach out from just the Ann Arbor area.
Trying to get enough money to make it work.
I heard that commuter rail was coming and that the bus system was being retooled
I just heard about it and talked a little talk.
They're still talking about building this new rail system and I am still waiting for this to happen!
Service more locations in the county
Don't remember.
I believe they want to expand it cause it will slow down the volume of traffic.
Fast track rail.
They will extend service to make more runs.
That it will offer more services.
There will be a new building or center built.
That its going to be faster and it could be like going to Chicago.
That it's being considered
It is in the planning stage, it will go from Ann Arbor to Brighton.

DRAFT
1. Page 27 Page 27
Figure 16 Awareness of Transit Master Plan
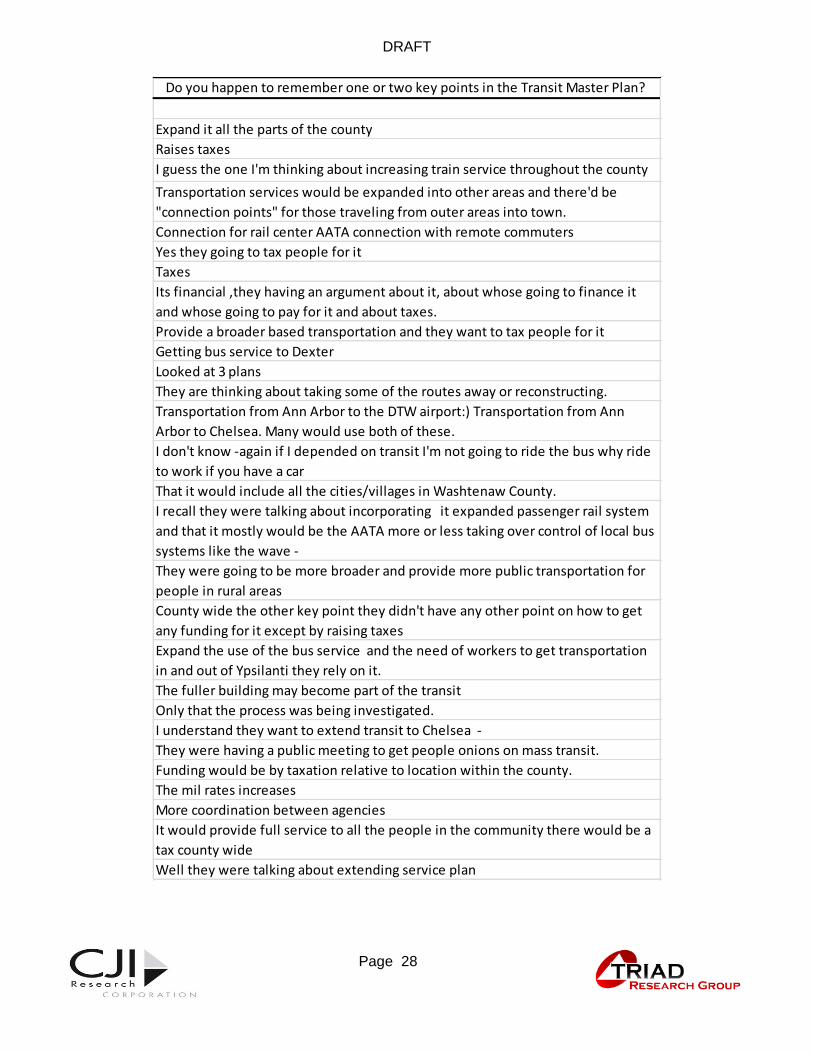
Awareness of Transit Master Plan At the time of the 2011 survey, only a small proportion of respondents had heard enough about the Transit Master Plan (TMP) to feel they could comment on it (17%). Another 14% said they had heard of it but knew nothing significant or specific about it. The balance, 69% said they had not heard of it.
It is extremely difficult to capture people's attention concerning public planning processes in spite of great organizational efforts to do so. Thousands of people became involved in expressing their views. The fact that even with such a high level of public interest and involvement only 17% of voters recall something substantial about the TMP suggests how difficult it is to communicate transit needs and benefits to the public.
On the other hand, although 17% substantive awareness may appear low to some observers, in the context of transit planning efforts, it is not. Only the most interested persons attend such meetings or pay attention to such news. To a busy public it is a peripheral matter. Thus, seventeen percent is actually quite surprisingly high in our experience.
DRAFT
1. Page 28 Page 28
Do you happen to remember one or two key points in the Transit Master Plan?
Expand it all the parts of the county
Raises taxes
I guess the one I'm thinking about increasing train service throughout the county
Transportation services would be expanded into other areas and there'd be
"connection points" for those traveling from outer areas into town.
Connection for rail center AATA connection with remote commuters
Yes they going to tax people for it
Taxes
Its financial ,they having an argument about it, about whose going to finance it
and whose going to pay for it and about taxes.
Provide a broader based transportation and they want to tax people for it
Getting bus service to Dexter
Looked at 3 plans
They are thinking about taking some of the routes away or reconstructing.
Transportation from Ann Arbor to the DTW airport:) Transportation from Ann
Arbor to Chelsea. Many would use both of these.
I don't know -again if I depended on transit I'm not going to ride the bus why ride
to work if you have a car
That it would include all the cities/villages in Washtenaw County.
I recall they were talking about incorporating it expanded passenger rail system
and that it mostly would be the AATA more or less taking over control of local bus
systems like the wave -
They were going to be more broader and provide more public transportation for
people in rural areas
County wide the other key point they didn't have any other point on how to get
any funding for it except by raising taxes
Expand the use of the bus service and the need of workers to get transportation
in and out of Ypsilanti they rely on it.
The fuller building may become part of the transit
Only that the process was being investigated.
I understand they want to extend transit to Chelsea -
They were having a public meeting to get people onions on mass transit.
Funding would be by taxation relative to location within the county.
The mil rates increases
More coordination between agencies
It would provide full service to all the people in the community there would be a
tax county wide
Well they were talking about extending service plan
DRAFT
1. Page 29 Page 29
The Initial Vote
DRAFT
1. Page 30 Page 30
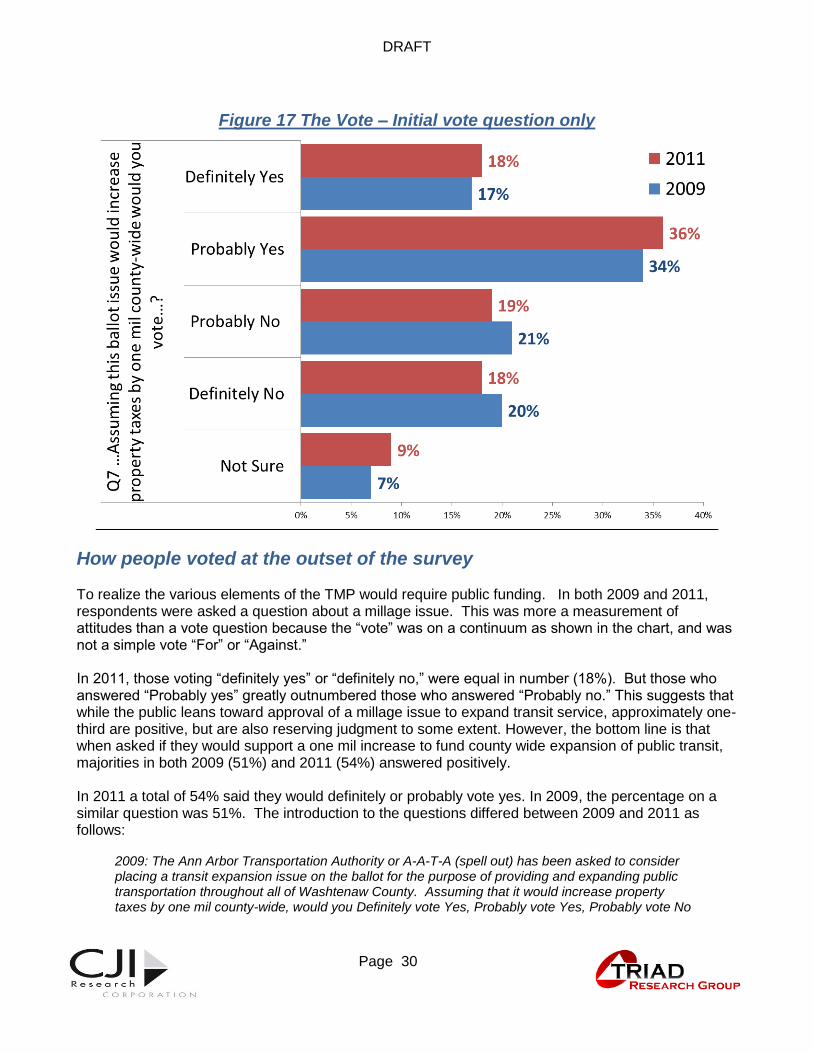
Figure 17 The Vote – Initial vote question only
How people voted at the outset of the survey To realize the various elements of the TMP would require public funding. In both 2009 and 2011, respondents were asked a question about a millage issue. This was more a measurement of attitudes than a vote question because the “vote” was on a continuum as shown in the chart, and was not a simple vote “For” or “Against.” In 2011, those voting “definitely yes” or “definitely no,” were equal in number (18%). But those who answered “Probably yes” greatly outnumbered those who answered “Probably no.” This suggests that while the public leans toward approval of a millage issue to expand transit service, approximately one-third are positive, but are also reserving judgment to some extent. However, the bottom line is that when asked if they would support a one mil increase to fund county wide expansion of public transit, majorities in both 2009 (51%) and 2011 (54%) answered positively. In 2011 a total of 54% said they would definitely or probably vote yes. In 2009, the percentage on a similar question was 51%. The introduction to the questions differed between 2009 and 2011 as follows:
2009: The Ann Arbor Transportation Authority or A-A-T-A (spell out) has been asked to consider placing a transit expansion issue on the ballot for the purpose of providing and expanding public transportation throughout all of Washtenaw County. Assuming that it would increase property taxes by one mil county-wide, would you Definitely vote Yes, Probably vote Yes, Probably vote No

DRAFT
1. Page 31 Page 31
or Definitely vote No on this one mil property tax increase to expand public transit services throughout the county? 2011: The new Washtenaw County transit agency will operate several public transit agencies now serving people in Washtenaw County, including A-A-T-A, The Ride, but also the smaller agencies called People Express, the WAVE, and Manchester Senior services. It will consider placing a transit expansion issue on the ballot for the purpose of increasing public transportation service and extending it throughout all of Washtenaw County. Assuming that this ballot issue would increase property taxes by one mil county-wide, would you Definitely vote Yes, Probably vote Yes, Probably vote No or Definitely vote No on this one mil property tax increase to expand public transit services throughout the county?
Notice that the differences in the question asked in 2011 compared to 2009 involved reference to a new agency, mention of the agencies other than AATA (perhaps most importantly, Manchester Senior Services), and a new county-wide agency to operate the system. There were also strong similarities, in the millage rate and reference to service expansion throughout the county. But given the differences, it may appear surprising that the results in the two surveys were so similar. The similarity indicates how independent such votes are of specific program components such as the promise of specific services. Conversely, it suggests that the basic tendencies of public opinion on a given issue depend less on the specifics of the issue than on a general sense of community needs and the legitimacy of both the issue in general the sponsoring agency in particular. In the first of the two vote questions, slightly more than half of the respondents (54%) said they would definitely (18%) or probably (36%) vote “Yes” on the millage increase while the balance (46%) said either said they would definitely (18%) or probably (19%) vote “No.” Only 9% were undecided. Note that the percent initially saying they would definitely vote “No” (18%) is identical to the percent saying they would definitely vote “Yes” (also 18%). Respondents were asked to re-vote near the end of the survey after they had heard various reasons for and against the issue. We will discuss this re-vote further later in the report. For the moment, we would indicate only that in the re-vote, those supporting the issue increased by 4% to 58% (the same as in 2009). Those voting “No” decreased only 1% to 36%, while 6% remained undecided. The similarity of the voting results in the two surveys in spite of all of the changes at the state and national scenes and the publicized development of the TMP suggests that the vote tendencies are quite stable.
DRAFT
1. Page 32 Page 32
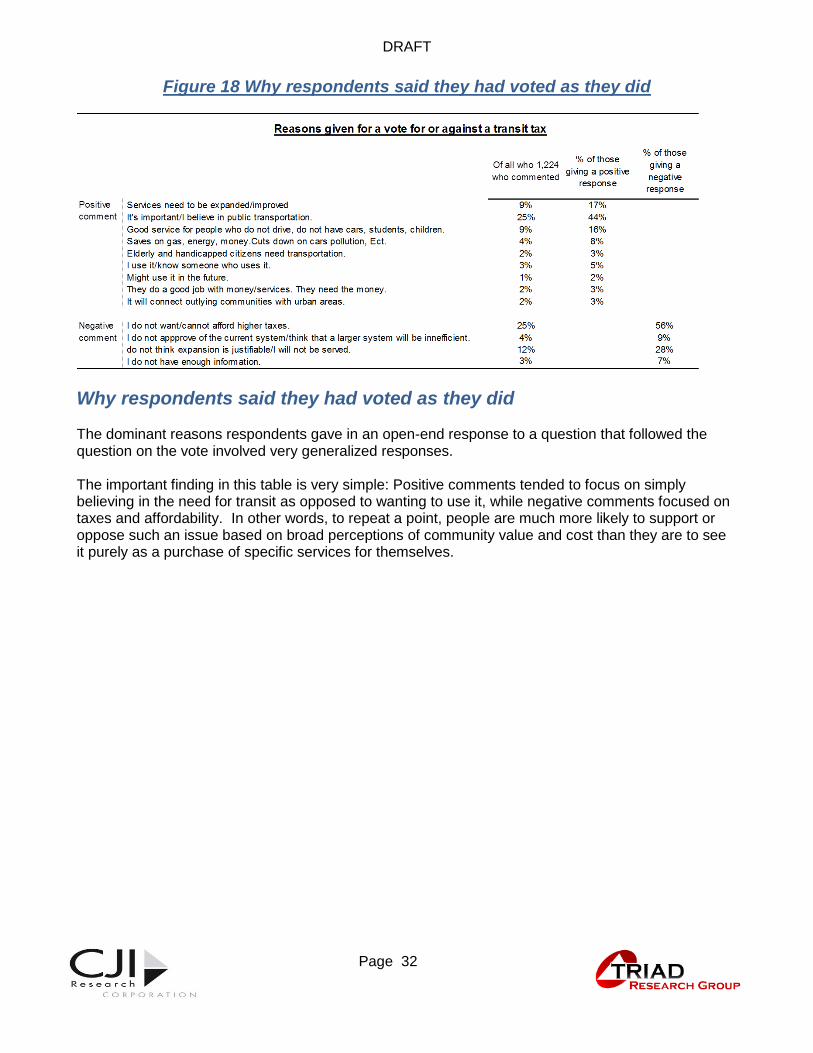
Figure 18 Why respondents said they had voted as they did
Why respondents said they had voted as they did The dominant reasons respondents gave in an open-end response to a question that followed the question on the vote involved very generalized responses. The important finding in this table is very simple: Positive comments tended to focus on simply believing in the need for transit as opposed to wanting to use it, while negative comments focused on taxes and affordability. In other words, to repeat a point, people are much more likely to support or oppose such an issue based on broad perceptions of community value and cost than they are to see it purely as a purchase of specific services for themselves.
DRAFT
1. Page 33 Page 33
Key Factors Associated with Tendencies to Support or Oppose a
Transit Expansion Issue

DRAFT
1. Page 34 Page 34
Figure 19 Demographics of the initial vote (column percentages)
Demographics of the initial vote In this section, we will describe the basic demographics of the vote so that the reader can carry forward into the remainder of the report a mental picture of the respondents supporting and of those opposing the transit expansion issue. We will examine these relationships from two perspectives we can call “column” and “row.”
Definitely
yes
Probably
yes
Probably
no
Definitely
no Not sure
All voters
2011
All voters
2009
Percent of the total sample in this column 18% 36% 19% 18% 9%
Survey region City of Ann Arbor 34% 32% 17% 16% 25% 26% 33%
Ypsilanti City and Township, and Pittsfield Township 25% 24% 25% 19% 27% 24% 25%
City of Saline and the eastern townships 34% 35% 46% 49% 41% 40% 31%
City of Chelsea and the western townships 7% 8% 12% 15% 7% 10% 12%
Male 46% 41% 49% 60% 37% 47% 46%
Female 54% 59% 51% 40% 63% 53% 54%
Yes 8% 9% 7% 4% 6% 7% 9%
No 92% 91% 93% 96% 94% 93% 91%
Age 18 to 34 10% 11% 13% 6% 13% 10% 11%
35 to 49 28% 34% 40% 40% 32% 35% 27%
50 to 64 33% 32% 27% 31% 32% 31% 38%
65 and older 28% 23% 20% 23% 24% 23% 24%
Income Less than $30,000 14% 13% 18% 19% 21% 15% 14%
$30 to $60,000 23% 23% 24% 19% 25% 23% 30%
$60 to $100,000 29% 35% 24% 34% 32% 32% 30%
More than $100,000 34% 29% 34% 27% 23% 30% 25%
Democrat 64% 53% 27% 20% 41% 44% 40%
Republican 3% 15% 33% 35% 16% 19% 13%
Independent 32% 32% 40% 46% 44% 37% 39%
Yes 64% 47% 21% 22% 39% 40% 40%
No 35% 53% 79% 78% 62% 60% 59%
Q7. Initial vote on Transit Expansion Millage (column percentages)
12. In the past year, have you or
anyone in your household ridden
any public transit in Washtenaw
County, including AATA, The Ride,
People Express, the Wave, or
Manchester Senior Services?
Was the respondent male or
female?
Are you currently a college
student?
Do you consider yourself to be a
Democrat, Republican or
Independent?
7. The new Washtenaw County transit agency will operate several public transit agencies now serving people in Washtenaw County, including A-A-T-A, The
Ride, but also the smaller agencies called People Express, the WAVE, and Manchester Senior services. It will consider placing a tax issue on the ballot for
the purpose of increasing public transportation service and extending it throughout all of Washtenaw County. Assuming that this ballot issue would
increase property taxes by one mil county-wide, would you Definitely vote Yes, Probably vote Yes, Probably vote No or Definitely vote No on this one mil
property tax increase to expand public transit services throughout the county?
DRAFT
1. Page 35 Page 35
The column percentages (above) indicate the demographics of each set of levy respondents. Read the table down the column, top to bottom.
The row percentages (next table, Figure 20) indicate the how the several demographic groups vote. Read that table horizontally, across the rows left to right.
DEMOGRAPHICS OF SETS OF PRO AND ANTI-ISSUE RESPONDENTS Note the following in Figure 19:
Definitely pro-issue respondents are more likely to live in Ann Arbor (34%) than are the definitely anti-issue respondents (16%). Conversely, the definitely anti-issue respondents are more likely to live in the eastern township areas (49%) than the definitely pro levy respondents (34%). The probable pro-issue and probable anti-issue respondents follow the same pattern, but – especially among the probable "Yes" respondents - less strongly.
Definitely pro-issue respondents are more likely to be women (54%, roughly their percentage of likely voters) than definitely anti-issue respondents (40%) women. Most definitely anti-issue respondents are men (60%).
Of all respondents, only 7% are college students and 93% are not college students. The definitely and probable pro-issue respondents are more likely (8% & 9%) than the definitely and probably anti-issue respondents (7% & 4%) to be college students.
While the age distributions of both positive and negative respondents tend to reflect the total population of respondents, there are some differences. The most intriguing is that of the definitely pro-issue respondents, 28% of whom are 65 or older. Usually in levy elections, those 65 and older are more likely than other age groups to oppose millage increases. Yet in this case the percentage of 65+ respondents in the definitely "Yes" category is slightly greater than the analogous percentage of the definitely "No" respondents. This is the reverse of what was seen in 2009 when the senior vote was less supportive. The change is quite probably a result of the inclusion of the "Manchester Senior Services" in the introduction to the vote question. Given the propensity of older respondents to turn out to vote, this is a benefit to a transit issue.
There is substantial income variation between pro-issue and anti-issue respondents, with 14% of the definitely pro-issue respondents, but 21% of definitely anti-issue respondents, reporting incomes of less than $30,000.
There is a crystal clear division on this issue by party. A large majority (64%) of definitely pro-issue respondents are Democrats and only 3% are Republicans, while a plurality of definitely anti-issue respondents (46%) are Independents. As is often the case, Independent voters will determine the outcome of any issue like this one. The definitely pro-issue respondents include a combination of Democrats (64%) and Independents (32%), while the definitely anti-issue respondents include a combination of Republicans (20%) and Independents (46%).
There is also a clear divide between those respondents who live in households in which they or others have used AATA in the past year and other households. Of definitely pro-issue
DRAFT
1. Page 36 Page 36
respondents, 64% said they or another person in the household had ridden AATA buses in the past year. The comparable figure for the definitely anti-issue respondents is only 22%.
VOTING TENDENCIES OF THE DEMOGRAPHIC GROUPS Note the following in Figure 20 on the following page (read percentages left to right across the line, not down the columns):
Respondents living in Ann Arbor are much more likely than others to definitely (24%) or probably (44%) vote for the levy.
As in 2009, in 2011, there is little or no difference in the percent of men (18%) and women (19%) who said they would definitely vote for the transit issue. However, more of the women (39%) than men (32%) said they would probably vote for the issue, while men were more likely (23%) to definitely oppose the issue than women (13%). This means that one of the key deciding factors in the eventual outcome will be the women who now are somewhat ambivalent in their favorable vote.
Unlike 2009, the youngest respondents are no more supportive (total of 55% definitely or probably pro-issue respondents) than the oldest respondents (57%). This is unusual. Younger respondents are almost always more supportive of transit and certain other millage issues, as they were in the 2009 survey. Again, the reason may be the difference in the wording of the vote question.
There is no consistent pattern of differences in the voting tendencies of the four income groups.
Democrats favor the issue (total of 75% “Yes” respondents), Republicans oppose (total of 61% “No” respondents”) and Independents are divided (50% support, and 41% oppose).
Respondents in AATA user households support the issue (total of 72% “Yes” respondents), while those in non-user households are divided (total of 43% support and 49% oppose).

DRAFT
1. Page 37 Page 37
Figure 20 The initial vote of demographic groups (row percentages)
Definitely
yes
Probably
yes
Probably
no
Definitely
no Not sure
Percent of the total sample in this column 18% 36% 19% 18% 9%
Survey region City of Ann Arbor 24% 44% 12% 11% 9%
Ypsilanti City and Township, and Pittsfield Township 19% 37% 19% 14% 10%
City of Saline and the eastern townships 16% 32% 21% 22% 9%
City of Chelsea and the western townships 12% 30% 23% 28% 6%
Male 18% 32% 20% 23% 7%
Female 19% 39% 18% 13% 11%
Are you currently a college
student? Yes 20% 43% 19% 10% 8%
No 19% 35% 19% 18% 9%
Age 18 to 34 18% 37% 24% 10% 11%
35 to 49 15% 35% 21% 21% 8%
50 to 64 20% 37% 16% 18% 9%
65 and older 22% 35% 16% 17% 9%
Income Less than $30 19% 32% 20% 20% 9%
$30 to $60 23% 39% 17% 13% 8%
$60 to $100 20% 43% 13% 17% 7%
More than $100 25% 38% 18% 14% 5%
Democrat 29% 45% 11% 8% 7%
Republican 3% 29% 31% 30% 6%
Independent 17% 33% 20% 21% 9%
Yes 30% 42% 10% 10% 9%
No 11% 32% 25% 24% 9%
Do you consider yourself to be a
Democrat, Republican or
Independent?
12. In the past year, have you or
anyone in your household ridden
any public transit in Washtenaw
County, including AATA, The Ride,
People Express, the Wave, or
Manchester Senior Services?
Q7. Initial vote on Transit Expansion Millage (row percentages)
7. The new Washtenaw County transit agency will operate several public transit agencies now serving people in Washtenaw County,
including A-A-T-A, The Ride, but also the smaller agencies called People Express, the WAVE, and Manchester Senior services. It will
consider placing a tax issue on the ballot for the purpose of increasing public transportation service and extending it throughout
all of Washtenaw County. Assuming that this ballot issue would increase property taxes by one mil county-wide, would you
Definitely vote Yes, Probably vote Yes, Probably vote No or Definitely vote No on this one mil property tax increase to expand public
transit services throughout the county?
Was the respondent male or
female?

DRAFT
1. Page 38 Page 38
Figure 21 The vote tendencies by region
The vote tendencies by region The relationship between the location of the respondent's residence and a transit issue vote shows clearly that the primary support for a transit service expansion issue is urban, and the primary opposition, rural and small city. For example, of the Ann Arbor respondents 24% say they would "definitely vote for" the issue but in Chelsea and the western townships only half as many, 12%, said they definitely support it. Other areas fall in between those extremes. It is certainly not surprising that support for the transit expansion diminishes with distance from the urban center. But it is also interesting that a total of 42% say either that they definitely or probably support the issue in even the most distant area of Chelsea and the western townships, and 48% in Saline and the eastern townships. Thus, while the level of support is quite varied, it is clearly not true that support in the more rural parts of the county is entirely lacking.
DRAFT
1. Page 39 Page 39
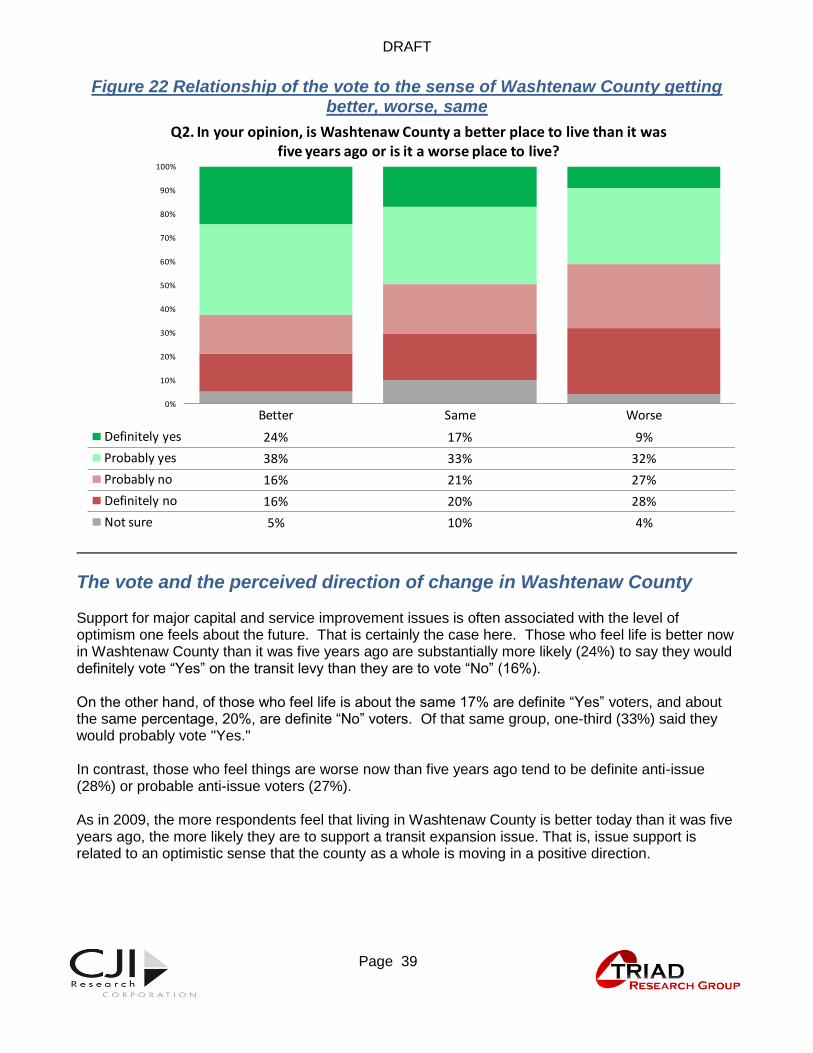
Figure 22 Relationship of the vote to the sense of Washtenaw County getting better, worse, same
The vote and the perceived direction of change in Washtenaw County Support for major capital and service improvement issues is often associated with the level of optimism one feels about the future. That is certainly the case here. Those who feel life is better now in Washtenaw County than it was five years ago are substantially more likely (24%) to say they would definitely vote “Yes” on the transit levy than they are to vote “No” (16%). On the other hand, of those who feel life is about the same 17% are definite “Yes” voters, and about the same percentage, 20%, are definite “No” voters. Of that same group, one-third (33%) said they would probably vote "Yes." In contrast, those who feel things are worse now than five years ago tend to be definite anti-issue (28%) or probable anti-issue voters (27%). As in 2009, the more respondents feel that living in Washtenaw County is better today than it was five years ago, the more likely they are to support a transit expansion issue. That is, issue support is related to an optimistic sense that the county as a whole is moving in a positive direction.
0%
10%
20%
30%
40%
50%
60%
70%
80%
90%
100%
Better Same Worse
Definitely yes 24% 17% 9%
Probably yes 38% 33% 32%
Probably no 16% 21% 27%
Definitely no 16% 20% 28%
Not sure 5% 10% 4%
Q2. In your opinion, is Washtenaw County a better place to live than it was five years ago or is it a worse place to live?

DRAFT
1. Page 40 Page 40
Figure 23 How the vote varies (or does not) with perceived job performance
The vote and AATA job performance rating The AATA job performance rating is closely related to the millage vote, but there are some exceptions. While 36% of the core, definite pro-issue voters rate the service as excellent, only 9% of the definite anti-issue voters rate it as excellent. They apparently oppose the issue for reasons other than job performance. The largest group of probable anti-issue and definite anti-issue voters do not provide a negative rating of AATA's performance. They simply do not know enough about AATA to rate it. Only 1% and 7% (respectively) rate AATA's performance as poor. In each of those vote groups, a plurality of 47% said they were not sure how to rate AATA. This fact illustrates the point that in a millage issue election, there is a clear cost associated with a pro-issue vote (an increase in millage) while an anti-issue vote appears to have no personal consequences, especially for a service a voter does not use in a direct sense. Thus, having no knowledge of AATA, even to the extent of being able to provide a rather general functional performance rating, suggests that for them the case has not been made that there is value f in the transit expansion issue.
DRAFT
1. Page 41 Page 41
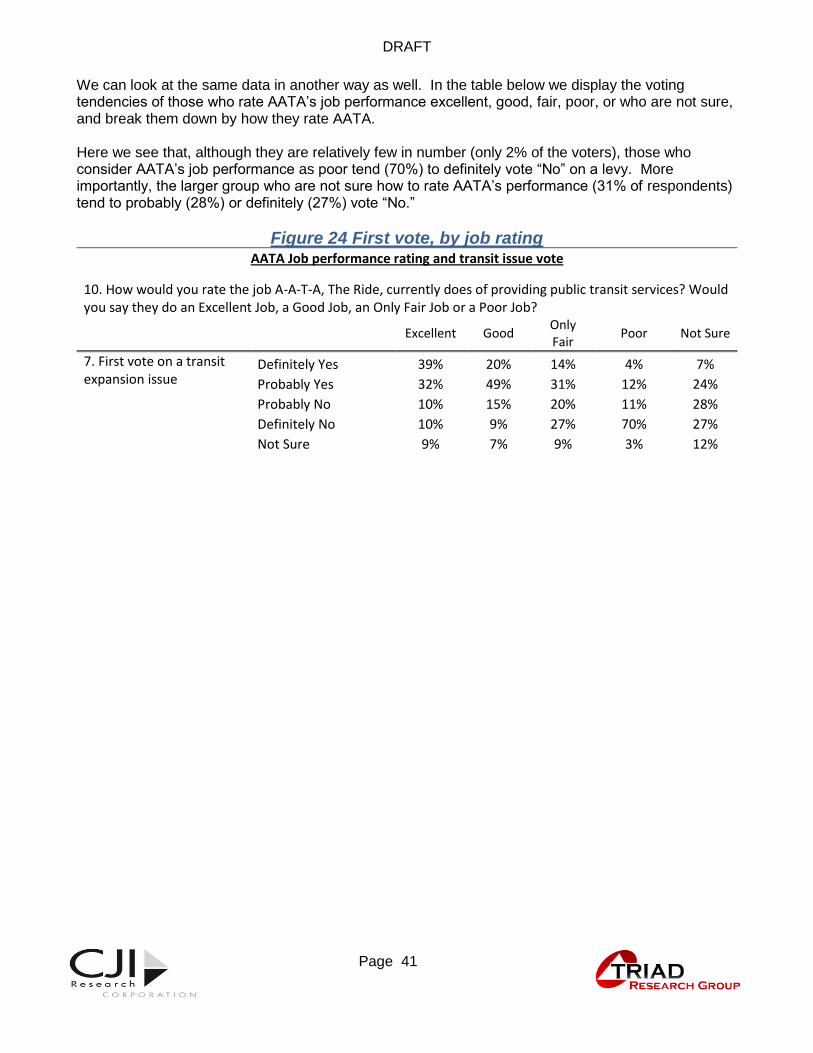
We can look at the same data in another way as well. In the table below we display the voting tendencies of those who rate AATA’s job performance excellent, good, fair, poor, or who are not sure, and break them down by how they rate AATA. Here we see that, although they are relatively few in number (only 2% of the voters), those who consider AATA’s job performance as poor tend (70%) to definitely vote “No” on a levy. More importantly, the larger group who are not sure how to rate AATA’s performance (31% of respondents) tend to probably (28%) or definitely (27%) vote “No.”
Figure 24 First vote, by job rating AATA Job performance rating and transit issue vote
10. How would you rate the job A-A-T-A, The Ride, currently does of providing public transit services? Would you say they do an Excellent Job, a Good Job, an Only Fair Job or a Poor Job?
Excellent Good
Only Fair
Poor Not Sure
7. First vote on a transit expansion issue
Definitely Yes 39% 20% 14% 4% 7%
Probably Yes 32% 49% 31% 12% 24%
Probably No 10% 15% 20% 11% 28%
Definitely No 10% 9% 27% 70% 27%
Not Sure 9% 7% 9% 3% 12%

DRAFT
1. Page 42 Page 42
Figure 25 The vote and perceived importance of providing public transit
The vote and the belief that it is important to provide public transit service in Washtenaw County Nationally, it is quite common for a significant body of public opinion to believe that having public transit service is a necessary aspect of community life, independent of whether those who believe this are themselves transit users or are likely to become so. It is that portion of the public that comprises the support required to provide long-term funding necessary if transit is to play the vital part of which it is capable in the life of a community. In Washtenaw County we have already seen (Figure 12, page 22) that more than two-thirds of respondents believe it is either extremely important or very important to have public transportation available. This belief has a significant impact on the vote. When we examine the relationship between the initial vote and the belief that it is important to provide public transit in Washtenaw County, we can see clearly that those who vote “Yes” are much more likely than those who vote “No” to perceive transit as an important public priority. While 68% of definite pro-issue voters consider public transit as extremely important, only 8% of definite anti-issue voters perceive it as extremely important. If we include those pro-issue voters who say it is very important, the total saying it is substantially important rises to 98%. Most of the negative voters are not saying that transit is unimportant. They tend to say instead that it is somewhat or very important – but they are much less likely than the positive voters to say it is extremely important.

DRAFT
1. Page 43 Page 43
Consistency and Movement in the Transit Expansion Vote
DRAFT
1. Page 44 Page 44
Figure 26 Change from first to second vote question 2011
2009
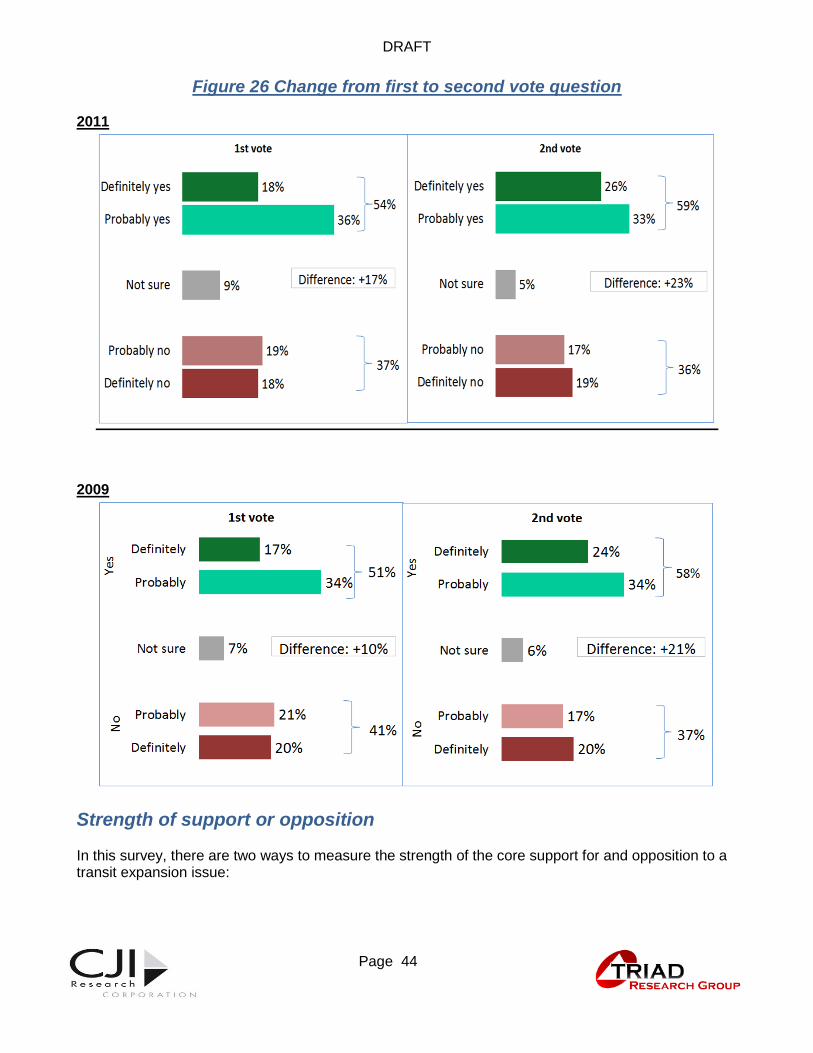
Strength of support or opposition In this survey, there are two ways to measure the strength of the core support for and opposition to a transit expansion issue:
DRAFT
1. Page 45 Page 45
(1) The first is the hypothetical vote question itself which determines not only how people thought they would vote but also how strongly they felt about it. This is more a measure of attitude toward the issue than a prediction of an electoral vote since obviously a real voter on election day does not have a range of choices such as was used in the "vote" question reported in this study. Moreover, the purpose of the study is not to predict an electoral outcome, but to objectively examine attitudes toward the expansion of transit in the county, taking into account both the services propose and the associated cost in the form of an increase of one mil in property tax to fund the expansion. Thus the question asks the degree of support or opposition, not merely a for-or-against question.
(2) The vote question was asked twice, once at the beginning of the survey and once after respondents had heard arguments for and against (more for than against). The second way to measure strength of attitude is to compare responses to the "vote" question at the two points in the survey to determine the extent of change, or fluidity – an indicator that can help revel how firmly held initial attitudes are.
Figure 26 displays results for both approaches. The first method is illustrated for the 2011 survey in the upper left quadrant of the table, and for 2009, in the lower left. In 2011, we can easily see that there is a total of 54% support and 41% opposition. However, within the 54% support, 34% say they only "probably" support the issue and half that many (17%) said they definitely support it. Thus the ratio of definite support to probable support is 1:2 and of definite opposition to probable opposition is 1:1. In this sense, though the opposition is in the minority, it is a more solid, fixed bloc. This is similar to the finding in 2009. The second method of judging the strength of attitudes can be seen for 2011 by comparing the upper left quadrant (first vote in the 2011 survey) with the upper right quadrant (second vote in 2011 survey). The key finding is that after exposure to arguments for and against the transit expansion issue, there was movement in the vote from a 17% overall advantage to a 23% overall advantage for the issue, a shift of 6%. This means that if the public listens to the major arguments pro and con the issue, support for the issue will increase somewhat. The improvement will tend to be not a grand swing but marginal, in the 5% to 10% range. What is also interesting is that the shift in support comes from respondents who, at the first vote, said they would "probably" support the issue or were undecided, but at the second vote shifted to a definitely-support-the-issue stance. Very little of the shift (2%) came from those opposing the issue at the first vote. After exposure to pro and con arguments, opposition changed by a net of only 1%. The six point gain in the total spread between the yes and no votes came entirely from those who would probably vote yes and from those few who were "not sure" when they were first asked the question. In other words, whether we consider the issue by method one or method two, those opposing the transit expansion issue, though in the minority, hold their view strongly and are unlikely to be moved by arguments supporting the issue, while those supporting the issue are likely to be less committed. In 2009, the two vote questions were:
Q5. Sometime next year, the Ann Arbor Transportation Authority or AATA may have a transit expansion issue on the ballot for the purpose of providing and expanding public transportation throughout all of Washtenaw County. Assuming that it would increase property taxes by one mil county-wide, would you Definitely vote “Yes”, Probably vote “Yes”,

DRAFT
1. Page 46 Page 46
Probably vote “No” or Definitely vote “No” on this one mil property tax increase to expand public transit services throughout the county? Q22. Thinking again about the one mil increase in the property tax for AATA and all of the things we have talked about, if an election were held today, would you Definitely vote “Yes”, Probably vote “Yes”, Probably vote “No” or Definitely vote “No” on this one mill property tax increase to expand public transit services throughout the county?
In 2011, the vote questions were:
Q7. The new Washtenaw County transit agency will operate several public transit agencies now serving people in Washtenaw County, including A-A-T-A, The Ride, but also the smaller agencies called People Express, the WAVE, and Manchester Senior services. It will consider placing a transit expansion issue on the ballot for the purpose of increasing public transportation service and extending it throughout all of Washtenaw County. Assuming that this ballot issue would increase property taxes by one mil county-wide, would you definitely vote yes, probably vote yes, probably vote no or definitely vote no on this one mil property tax increase to expand public transit services throughout the county?
Q29. Thinking again about the one mil increase in the property tax for all of the things we’ve talked about to be done by The new Washtenaw County transit agency, if an election were held today, would you definitely vote yes, probably vote yes, probably vote no or definitely vote no on this one mil property tax increase to expand public transit services throughout the county?
Notice that the first vote question in 2011 differed from that used in 2009 when the extent of the proposed organizational and service changes were not yet as well defined.
DRAFT
1. Page 47 Page 47
Figure 27 How the regions voted on the re-vote question
How the regions voted on the re-vote question Just as they had been in the initial question regarding support for or opposition to the transit expansion issue, voters in the more urban areas of Ann Arbor, Ypsilanti, and Pittsfield township were more supportive of the transit issue than voters in Saline and the eastern townships or Chelsea and the western townships. Although there are several ways in which opinions could change from the initial vote to the second vote, the most important ways involve increases or decreases in the definitely supportive and
definitely opposed percentages. The overall increase in the definite support was 8% and definite opposition 1% after hearing statements for and against the issue. In each region, the increase in definite support exceeded the
increase in opposition. The net increase in support was greatest in Ann Arbor (10%), but was also moderate in Saline and the eastern townships (6%), and Chelsea and the western townships (5%). In the Ypsilanti/Pittsfield Township area it was 3%.
City of Ann
Arbor
Ypsilanti
City &
Twp, &
Pittsfield
Twp
City of
Saline &
eastern
twps
City of
Chelsea &
western
twps
All voters
Definitely Yes 35% 23% 24% 17% 26%
Probably Yes 37% 38% 29% 30% 33%
Probably No 12% 20% 17% 20% 17%
Definitely No 12% 15% 24% 28% 19%
Not Sure 5% 5% 7% 5% 5%
29. Thinking again about the one mil increase in the property tax for all of the
things we've talked about to be done by the new Washtenaw County transit
agency, if an election were held today, how would you vote?
Second vote, by region
City of Ann
Arbor
Ypsilanti
City & Twp,
& Pittsfield
Twp
City of
Saline &
eastern
twps
City of
Chelsea &
western
twps
All voters
Change in "Definitely yes"
11% 4% 8% 5% 8%
Change in "Definitely no"
1% 1% 2% 0% 1%

DRAFT
1. Page 48 Page 48
Figure 28 Vote and revote
Consistency and movement of vote before and after exposure to pro and anti-issue statements For further analysis, we combined the results of the two vote questions to create five voter support groups as follows:
Consistent Positive. They answered “Yes” to both questions.
Moved Positive. These voters initially voted “No” or were undecided then voted “Yes” in the second vote question, or they voted “No” initially then said ‘not sure’ the second time asked.
Undecided. They were undecided in both vote questions.
Moved Negative. They initially supported the issue or were undecided, then voted “No” or voted “Yes” the first time, and then were undecided at the second vote.
Consistent Negative. They answered no to both questions. These categories were then further manipulated into the final measurement of vote tendencies used in the balance of the report. These categories will be described on page 50. In spite of the developments in local and national discussions of transportation policy since 2009, and a significantly a changed survey method, there was very little change in the overall profile of the vote consistency measurement. In 2009, 48% were consistently pro-issue. In 2011, 51% were consistently pro-issue. In 2009, 37% were consistently opposed. In 2011, 32% were. The change was minimal in spite of slightly changed question wording and a more inclusive sample in 2011.

DRAFT
1. Page 49 Page 49
People's attitudes toward the issue of expanding transit, and being willing to pay the cost of the expansion, are surprisingly stable. Slightly fewer than half of the respondents (48%) were Consistently Positive in that they said they would vote “Yes” on the transit expansion issue both initially and the second time asked. While this brings the initial positive vote to 51%, the reader should keep in mind that although in some ways these are clearly respondents who support millage for transit expansion, most of them (see Figure 26) said they would only probably vote “Yes”.
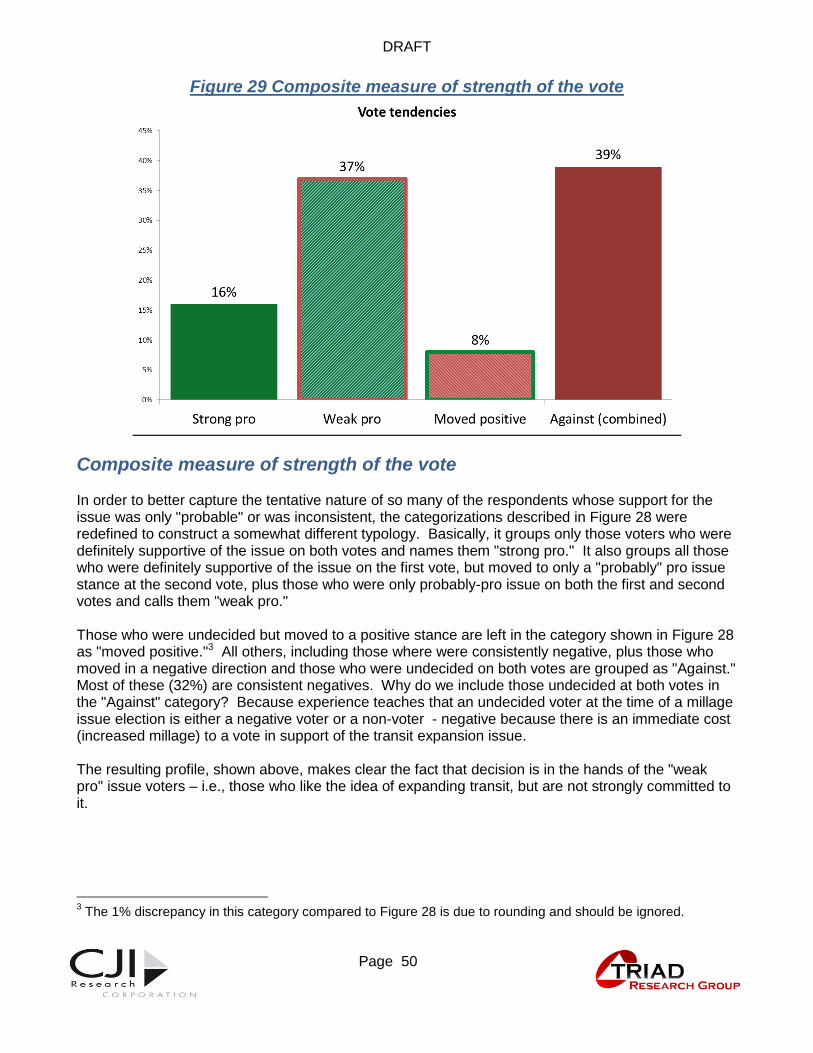
DRAFT
1. Page 50 Page 50
Figure 29 Composite measure of strength of the vote
Composite measure of strength of the vote In order to better capture the tentative nature of so many of the respondents whose support for the issue was only "probable" or was inconsistent, the categorizations described in Figure 28 were redefined to construct a somewhat different typology. Basically, it groups only those voters who were definitely supportive of the issue on both votes and names them "strong pro." It also groups all those who were definitely supportive of the issue on the first vote, but moved to only a "probably" pro issue stance at the second vote, plus those who were only probably-pro issue on both the first and second votes and calls them "weak pro." Those who were undecided but moved to a positive stance are left in the category shown in Figure 28 as "moved positive."3 All others, including those where were consistently negative, plus those who moved in a negative direction and those who were undecided on both votes are grouped as "Against." Most of these (32%) are consistent negatives. Why do we include those undecided at both votes in the "Against" category? Because experience teaches that an undecided voter at the time of a millage issue election is either a negative voter or a non-voter - negative because there is an immediate cost (increased millage) to a vote in support of the transit expansion issue. The resulting profile, shown above, makes clear the fact that decision is in the hands of the "weak pro" issue voters – i.e., those who like the idea of expanding transit, but are not strongly committed to it.
3 The 1% discrepancy in this category compared to Figure 28 is due to rounding and should be ignored.

DRAFT
1. Page 51 Page 51
How strong and weak vote tendencies vary with demography In the tables on the following two pages, we will examine the demography of the vote in two ways. First we will compare demographic characteristics among the several voter groups and then in the second table, compare the vote tendencies among the several demographic groups. In reviewing the tables, notice the following:
The primary differences are between the strong and weak pro voters on the one hand and voters against the issue on the other haand. The response tendencies of the smaller group of "Moved positive" voters are often between the two dominant groups.
Pro issue voters, strong or weak, are more likely to live in Ann Arbor or the Ypsilanti area than are the negative voters. Conversely, the negative voters are more likely than the positive voters to live in the eastern or western township areas.
Positive voters are more likely to be women and negative voters to be men.
While the age distributions of both positive and negative voters tend to reflect the total population of voters, positive voters are more likely (12%) than negative voters (8%) to be in the youngest age range (18 – 34). The age differences are surprisingly small.
There is surprisingly little income variation between positive and negative patterns, although the strong pro issue voters (34%) are more likely than the negative voters to fall into the top income category (28%).
Although 92% of the strong pro and 97% of the weak pro voters are not college students, they are twice as likely (8% and 9% respectively) as the consistently negative voters (4%) to be college students.
A majority of strong and weak pro voters (63% and 53% respectively) are Democrats, while a majority of consistently negative voters are Independents (44%) or Republicans (31%).
Two-thirds of the strong pro issue voters (66%) live in households in which they or others have used public transit in the past year while of the consistently negative voters 76% do not meet that description. Of the weak pro issue voters, about half live in transit-using households (48%) and half do not (50%). This mix helps account for their ambivalence as a group.

DRAFT
1. Page 52 Page 52
Figure 30 The demography of the vote groupings (column percent)
Strong pro Weak proMoved
positive
Against,
leaning
against, or
undecided
All
respondents
Survey region City of Ann Arbor 35% 32% 14% 19% 26%
Ypsilanti City and
Township, and Pittsfield
Township24% 24% 28% 23% 24%
City of Saline and the
eastern townships 34% 36% 48% 45% 40%
City of Chelsea and the
western townships 7% 8% 10% 13% 10%
Gender
Male 46% 40% 44% 53% 47%
Female 54% 60% 56% 47% 53%
Age
18 to 34 years 12% 12% 14% 8% 10%
35 to 49 years 28% 34% 30% 41% 35%
50 to 64 years 34% 33% 25% 29% 31%
65 and over 27% 22% 32% 23% 24%
Household income
Less than $30,000 14% 13% 19% 19% 15%
$30 to $60,000 21% 22% 28% 23% 23%
$60 to $100,000 30% 35% 25% 30% 32%
More than $100,000 34% 30% 28% 28% 30%
Are you currently a college student?
Yes 8% 9% 11% 4% 7%
No 92% 91% 89% 96% 93%
Do you consider yourself to be a Democrat, Republican or Independent?
Democrat 63% 53% 38% 25% 44%
Republican 4% 14% 26% 31% 19%
Independent 33% 32% 36% 44% 37%
Yes 66% 48% 32% 23% 40%
No 33% 51% 66% 76% 59%
Not Sure 1% 0% 2% 1% 1%
Demographics of the vote structure (Column %)
12. In the past year, have you or anyone in your household ridden any public transit in Washtenaw County,
including AATA, The Ride, People Express, the Wave, or Manchester Senior Services?

DRAFT
1. Page 53 Page 53
In the table below, percentages are read left to right. For example, of voters in the City of Ann Arbor, 22% responded in a strong pro issue way, while 42% were weak pro issue voters. Another 4% moved in a positive direction on the issue, and 28% were against the issue.
Figure 31 Demographics of the vote consistency and vote movement groupings (row percent)
In this table we see tendencies reinforcing what was shown in the previous table.
The more urban areas are more supportive; townships less so.
Women more supportive then men, but much of the support is in the weak-pro category (41%). Women are much less likely to oppose the issue (34%).
Strong pro Weak proMoved
positive
Against,
leaning
against, or
undecided
Survey region City of Ann Arbor 22% 46% 4% 28%
Ypsilanti City and
Township, and Pittsfield
Township
17% 37% 9% 37%
City of Saline and the
eastern townships14% 33% 9% 44%
City of Chelsea and the
western townships11% 30% 8% 51%
Gender
Male 16% 32% 8% 45%
Female 16% 41% 11% 34%
Age
18 to 34 years 18% 42% 10% 30%
35 to 49 years 13% 35% 7% 45%
50 to 64 years 18% 40% 6% 36%
65 and over 18% 33% 10% 38%
Household income
Less than $30,000 18% 33% 9% 40%
$30 to $60,000 19% 38% 9% 34%
$60 to $100,000 19% 44% 6% 31%
More than $100,000 22% 39% 7% 31%
Are you currently a college student?
Yes 19% 47% 11% 23%
No 16% 36% 7% 40%
Do you consider yourself to be a Democrat, Republican or Independent?
Democrat 25% 47% 7% 22%
Republican 3% 28% 10% 58%
Independent 15% 34% 7% 44%
Yes 27% 44% 6% 22%
No 9% 32% 9% 50%
Demographics of the vote structure (Row %)
12. In the past year, have you or anyone in your household ridden any public transit in
Washtenaw County, including AATA, The Ride, People Express, the Wave, or Manchester
Senior Services?

DRAFT
1. Page 54 Page 54
The age group most likely to oppose the issue is the 35 – 49 year old group. The groups most likely to be in the swing, weak pro issue group are 18 – 34 and 50 – 64. One-third of the 65 and older voters (33%) are in the weak pro group and as a whole, 51% express either strong support (18% or weak support (33%) for the issue. This is an unusual pattern.
As we saw in Figure 19 (Page 34), one of the major differences in support for the tax increase depends on whether voters live in households in which someone has ridden AATA’s buses in the past year. In the first vote, 71% of AATA riders said they would definitely (27%) or probably (44%) vote “Yes” on the tax increase, while only 25% would vote “No”. In contrast of those in non-rider households, only 38% said they would vote for the issue and 52% would vote against it.
College students are more likely to be in favor of the issue 66%) than other voters.
Democrats are more likely to favor the issue (total of 72%), but much of that support is weak pro support (47%). Republicans clearly tend to oppose the issue (58%), and Independents are split, with 44% opposed and 49% in favor.
Voters in transit-using households tend to favor the issue (total of 71%) while non-transit using households split, with 50% opposed, and the balance either supporting it or moving toward supporting it (9%).

DRAFT
1. Page 55 Page 55
Reasons for which Some People Vote Against a Millage Increase to Expand
Transit Services

DRAFT
1. Page 56 Page 56
Figure 32 Agreement and disagreement with anti-issue statements
Anti-issue statements Seven statements all opposed to a transit expansion issue increase were included in the survey to examine how widely shared these concerns were and how strongly the public felt about them. For these seven statements, a pro-issue position would involve disagreeing with the statement.
AFFORDABILITY First we see that almost half (total of 47%) of the voters agreed that affordability is a concern. That is…
47% agreed that “I’d like to expand public transit, but I cannot afford to pay any more taxes” while 49% disagreed. This is a key concern among many members of the public. Its salience to the AATA issue will vary with the extent to which such concerns motivate voters in the coming years.
Similarly, 43% agreed that “the economy is too uncertain for me to vote for this tax increase” while 55% disagreed with this. The level of disagreement with this statement increased since 2009, when 47% disagreed. Apparently, some people are feeling somewhat more economically secure and this feeling is related to their willingness to consider public investments.

DRAFT
1. Page 57 Page 57
The transit expansion issue is especially significant because, as in 2009, one-third of the weak pro issue voters (32%) agreed that while they would like to expand transit, they cannot afford to pay more taxes. Also as in 2009, 21% agreed the economy is too uncertain to vote for this tax increase. This means that among pro-issue voters a key reason for ambivalence on the vote is economic. An even greater percentage of voters who moved in a positive direction agreed they cannot afford to pay more taxes and that the economy is very uncertain. On the other hand, strong majorities of both the strong and weak-pro voters disagreed with the statement that "The time has come to vote against all tax increases." Even the moved-positive voters disagreed (63%) with this statement. This suggests that their minds remain open to arguments in support of millage increases even while they register concerns about affordability.
FAIRNESS Given the different millage levels and the different levels of service among the areas of the county, the issue of "fairness" has the potential to be rather controversial. For this reason, several charts and tables are devoted to it in this and the following section. Data supporting this discussion, and further discussion, are found in both Figure 32 on the previous page, in Figure 35, page 60 and in Figure 37, page 62 and Figure 38, page 63. Two aspects of "fairness" of the tax burden were discussed in the round of questioning displayed in
Figure 32. Both involved the potential for perceived unfairness in the differential taxes and service levels between the urban and small town/rural areas of the county. However, the hypothetical "victim" of unfairness was reversed in the two statements.
It’s not fair to have everyone in the county pay for something that mostly benefits the cities of Ann Arbor and Ypsilanti (42% agreed)
It’s not fair to have people in the Cities of Ann Arbor and Ypsilanti pay more than anyone else for public transit that will benefit everyone in the county (40% agreed).
The fact that approximately 40% agree in each case indicates that fairness of the tax burden and the benefits will be an issue.
Figure 33 Fairness of varied millage rates
City of Ann
Arbor
Ypsilanti
City and
Township,
and
Pittsfield
Township
City of
Saline and
the eastern
townships
City of
Chelsea
and the
western
townships
Strongly Agree 4% 11% 22% 23%
Agree 20% 27% 29% 35%
Disagree 55% 45% 35% 30%
Strongly Disagree 17% 13% 12% 8%
Don't Know 3% 4% 1% 4%
Strongly Agree 14% 20% 9% 7%
Agree 30% 36% 22% 19%
Disagree 42% 34% 47% 49%
Strongly Disagree 11% 5% 14% 18%
Don't Know 3% 4% 7% 7%
26_C. It's not fair to have everyone in the
county pay for public transit that mostly
benefits the Cities of Ann Arbor and
Ypsilanti.
26_D. It's not fair to have people in the
Cities of Ann Arbor and Ypsilanti pay
more than anyone else for public transit
that will benefit everyone in the county.
How fairness statements are received in four parts of the county
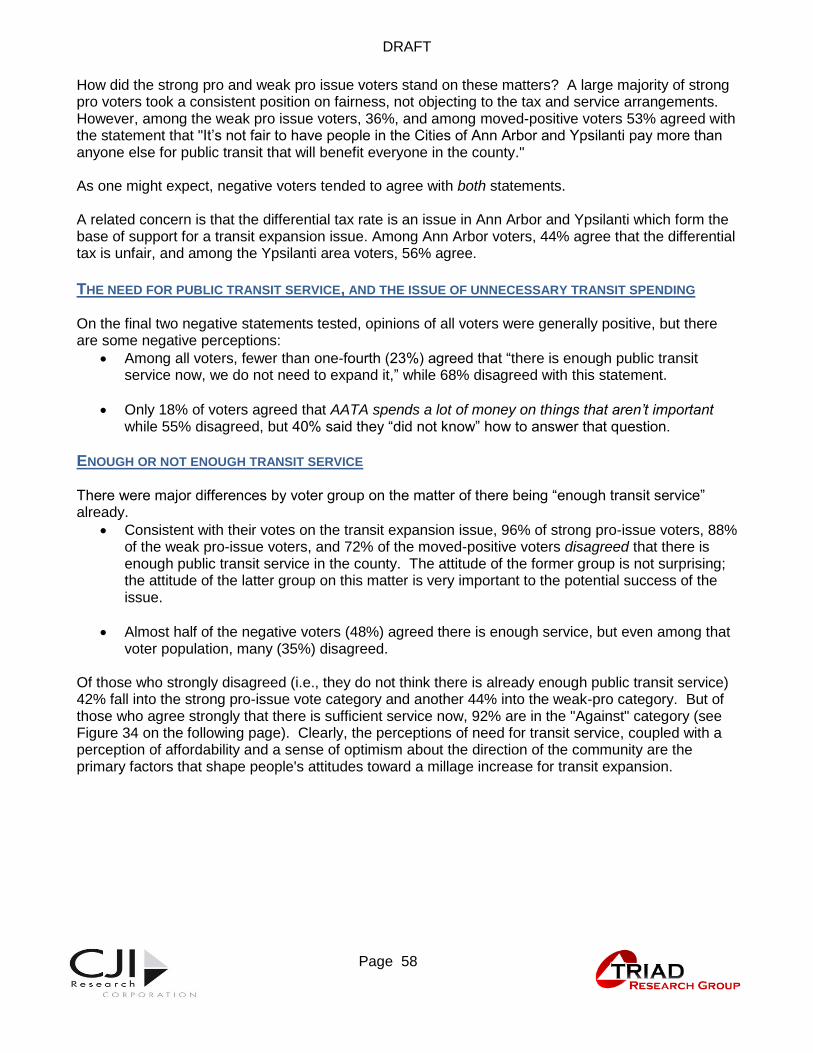
DRAFT
1. Page 58 Page 58
How did the strong pro and weak pro issue voters stand on these matters? A large majority of strong pro voters took a consistent position on fairness, not objecting to the tax and service arrangements. However, among the weak pro issue voters, 36%, and among moved-positive voters 53% agreed with the statement that "It’s not fair to have people in the Cities of Ann Arbor and Ypsilanti pay more than anyone else for public transit that will benefit everyone in the county." As one might expect, negative voters tended to agree with both statements. A related concern is that the differential tax rate is an issue in Ann Arbor and Ypsilanti which form the base of support for a transit expansion issue. Among Ann Arbor voters, 44% agree that the differential tax is unfair, and among the Ypsilanti area voters, 56% agree.
THE NEED FOR PUBLIC TRANSIT SERVICE, AND THE ISSUE OF UNNECESSARY TRANSIT SPENDING On the final two negative statements tested, opinions of all voters were generally positive, but there are some negative perceptions:
Among all voters, fewer than one-fourth (23%) agreed that “there is enough public transit service now, we do not need to expand it,” while 68% disagreed with this statement.
Only 18% of voters agreed that AATA spends a lot of money on things that aren’t important while 55% disagreed, but 40% said they “did not know” how to answer that question.
ENOUGH OR NOT ENOUGH TRANSIT SERVICE There were major differences by voter group on the matter of there being “enough transit service” already.
Consistent with their votes on the transit expansion issue, 96% of strong pro-issue voters, 88% of the weak pro-issue voters, and 72% of the moved-positive voters disagreed that there is enough public transit service in the county. The attitude of the former group is not surprising; the attitude of the latter group on this matter is very important to the potential success of the issue.
Almost half of the negative voters (48%) agreed there is enough service, but even among that voter population, many (35%) disagreed.
Of those who strongly disagreed (i.e., they do not think there is already enough public transit service) 42% fall into the strong pro-issue vote category and another 44% into the weak-pro category. But of those who agree strongly that there is sufficient service now, 92% are in the "Against" category (see Figure 34 on the following page). Clearly, the perceptions of need for transit service, coupled with a perception of affordability and a sense of optimism about the direction of the community are the primary factors that shape people's attitudes toward a millage increase for transit expansion.
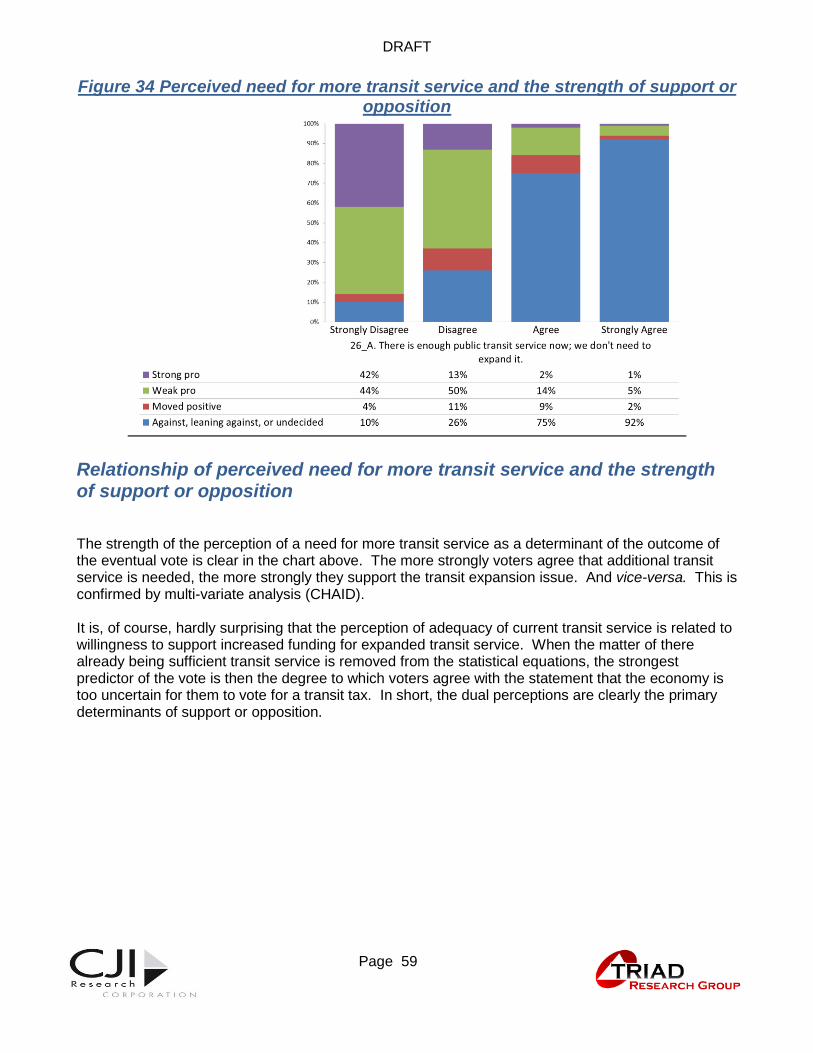
DRAFT
1. Page 59 Page 59
Figure 34 Perceived need for more transit service and the strength of support or opposition
Relationship of perceived need for more transit service and the strength of support or opposition The strength of the perception of a need for more transit service as a determinant of the outcome of the eventual vote is clear in the chart above. The more strongly voters agree that additional transit service is needed, the more strongly they support the transit expansion issue. And vice-versa. This is confirmed by multi-variate analysis (CHAID). It is, of course, hardly surprising that the perception of adequacy of current transit service is related to willingness to support increased funding for expanded transit service. When the matter of there already being sufficient transit service is removed from the statistical equations, the strongest predictor of the vote is then the degree to which voters agree with the statement that the economy is too uncertain for them to vote for a transit tax. In short, the dual perceptions are clearly the primary determinants of support or opposition.

DRAFT
1. Page 60 Page 60
Figure 35 Detail of voter response to negative statements about the transit millage issue
Strong pro Weak proMoved
positive
Against,
leaning
against, or
undecided All Voters
Strongly Agree 1% 1% 1% 16% 7%
Agree 2% 6% 19% 32% 16%
Disagree 35% 59% 61% 29% 44%
Strongly Disagree 61% 29% 11% 6% 24%
Don't Know 2% 4% 7% 17% 9%
Strongly Agree 2% 5% 32% 28% 16%
Agree 8% 32% 36% 38% 31%
Disagree 56% 50% 22% 23% 38%
Strongly Disagree 33% 8% 9% 5% 11%
Don't Know 2% 4% 1% 6% 4%
Strongly Agree 2% 2% 12% 33% 15%
Agree 10% 20% 46% 37% 27%
Disagree 52% 61% 33% 21% 42%
Strongly Disagree 35% 14% 6% 5% 13%
Don't Know 1% 3% 3% 4% 3%
Strongly Agree 5% 6% 13% 22% 13%
Agree 17% 30% 40% 26% 27%
Disagree 49% 52% 35% 34% 43%
Strongly Disagree 26% 7% 7% 11% 12%
Don't Know 3% 5% 5% 7% 5%
Strongly Agree 0% 2% 11% 36% 16%
Agree 6% 21% 40% 38% 27%
Disagree 52% 60% 39% 18% 41%
Strongly Disagree 41% 13% 8% 4% 14%
Don't Know 1% 4% 2% 4% 3%
Strongly Agree 1% 2% 13% 27% 12%
Agree 2% 11% 18% 30% 17%
Disagree 35% 45% 39% 27% 36%
Strongly Disagree 62% 40% 24% 11% 31%
Don't Know 1% 1% 6% 5% 3%
How anti-issue statements are received by vote-tendency groups
26_A. There is enough public transit
service now; we don't need to expand it.
26_B. I'd like to expand public transit,
but I can't afford to pay any more taxes.
26_C. It's not fair to have everyone in the
county pay for public transit that mostly
benefits the Cities of Ann Arbor and
Ypsilanti.
26_D. It's not fair to have people in the
Cities of Ann Arbor and Ypsilanti pay
more than anyone else for public transit
that will benefit everyone in the county.
26_E. The economy is too uncertain for
me to vote for this tax increase.
26_F. The time has come to vote against
all tax increases.
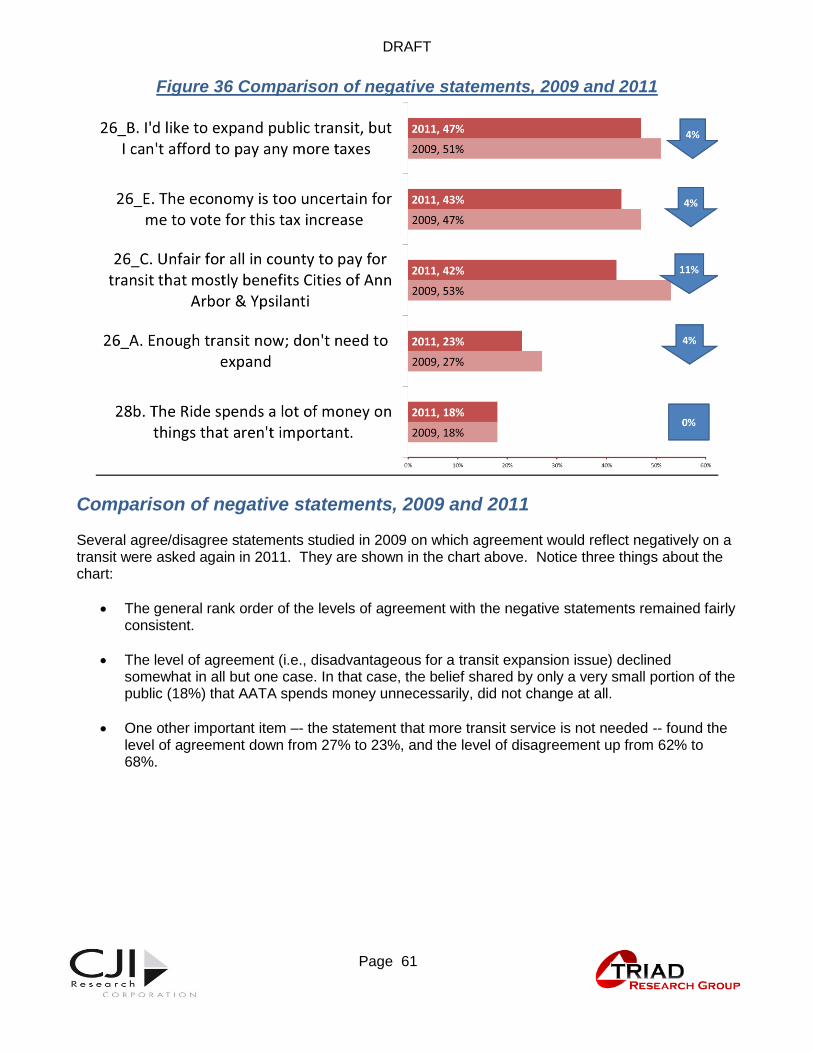
DRAFT
1. Page 61 Page 61
Figure 36 Comparison of negative statements, 2009 and 2011
Comparison of negative statements, 2009 and 2011 Several agree/disagree statements studied in 2009 on which agreement would reflect negatively on a transit were asked again in 2011. They are shown in the chart above. Notice three things about the chart:
The general rank order of the levels of agreement with the negative statements remained fairly consistent.
The level of agreement (i.e., disadvantageous for a transit expansion issue) declined somewhat in all but one case. In that case, the belief shared by only a very small portion of the public (18%) that AATA spends money unnecessarily, did not change at all.
One other important item –- the statement that more transit service is not needed -- found the level of agreement down from 27% to 23%, and the level of disagreement up from 62% to 68%.

DRAFT
1. Page 62 Page 62
Figure 37 Differences in millage rates among areas of the county
Differences in millage rates among areas of the county All respondents were told that residents of Ann Arbor now pay a two mil property tax to support transit services, and Ypsilanti residents, one mil, while no one else in the county now pays any millage for transit. They were also told that if this issue to expand public transit in Ann Arbor, Ypsilanti, and throughout the county is approved, Ann Arbor residents will pay three mils, Ypsilanti two mils, and everyone else will pay one mil. Knowing that Ann Arbor homeowners would pay three times the level some others would pay, just 12% in both 2009 and 2011 were more likely to vote for the property tax while 24% were less likely in 2009 and 20% in 2011. In other words, knowing that transit millage rates differ throughout the county made no difference to most voters in either 2009 or 2011. The percent saying it makes no difference to them is now at 62%, up slightly from 58% in 2009. Negative perception of the millage differentials stands at 20%, down slightly from 24% in 2009.

DRAFT
1. Page 63 Page 63
Figure 38 Effect of different transit tax rates within the county
Further detail on the effect of different transit tax rates within the county The differential tax rate is a negative for Ann Arbor residents who comprise an important element of the core levy vote. Twenty-seven percent (27%) would be less likely to support the transit millage knowing they would be paying three mils for transit services if this levy passes, and only 8% would be more likely to vote in favor. (Comparable percentages in 2009 were 33% and 10%, respectively.) Since much of the opposition to a transit expansion issue resides in the eastern and western townships, one might suppose that the fact that the more urban areas were paying two or three times higher than they would cause strongest opponents to say that the rate differential made them more likely to vote for it. But that is not the case. In fact, almost a third (32%) said it would make them less likely to vote for it, presumably because although their rate would be lower than that paid by others, it would meaning going from paying nothing to paying one mil. This illustrates the fact that there is no argument or tax arrangement that will move those who are opposed now. On the other hand almost one-fourth (23%) of the strong pro voters were positively reinforced by the differential rates and said they are more likely to vote for the issue. In addition, the differential rate does not appear to ameliorate the unfairness argument (that is it not fair for all county residents to pay to support service that primarily serves Ann Arbor residents), since 65% of the eastern and western region voters said it would make no difference to them.
City of Ann
Arbor
Ypsilanti City
and Township,
and Pittsfield
Township
City of Saline
and the
eastern
townships
City of Chelsea
and the western
townships
More Likely 8% 12% 14% 15%
Less Likely 27% 25% 15% 14%
No Difference 58% 58% 65% 65%
Not Sure 6% 5% 5% 6%
Strong pro Weak pro
Moved
positive
Against, leaning
against, or
undecided
More Likely 23% 14% 20% 5%
Less Likely 3% 15% 26% 32%
No Difference 74% 67% 44% 56%
Not Sure 1% 5% 10% 7%
Survey region and attitude toward variation in tax rate among cities
9. Residents of the Cities of Ann Arbor and Ypsilanti now
pay a property tax to support transit services. No one else
in the county pays a transit tax. If voters approve this
ballot issue, Ann Arbor homeowners will pay 3 mils,
Ypsilanti 2 mils, and homeowners elsewhere will pay 1 mil
in property tax. Does knowing that make you more likely
or less likely to vote for this one mil levy or doesn’t that
make any difference to you?
Vote strength and attitude toward variation in tax rate among cities

DRAFT
1. Page 64 Page 64
Figure 39 The economy and attitudes toward funding public transit
The economy and attitudes toward funding public transit
The perceived economic situation can affect voters' attitudes toward transit in multiple ways. A poor economy may be reason to want better public transit, or it may frighten voters with the uncertainty it presents to their incomes. In the case of the issue vote under study here, a large majority (75%) of the likely voters agree that the economy is so uncertain that it is important to have good public transit as a backup form of transportation. The implication here is very general – it is important for the community. On the other hand, fewer, 56% agree that economic uncertainty makes it important to them personally to have good public transit. Tough this still represents an absolute majority, it is 19% fewer than agree it is important for the whole community to have public transit as a backup in uncertain economic times. In other words, there is a certain portion of the voting public that sees transit as a community need but not a personal need, even in times of economic difficulty. Voters are split on whether the economic uncertainty is cause for them to vote against this transit expansion issue with 54% disagreeing, and 43% agreeing that it is a reason to vote against it. Thus the electorate is collectively divided and somewhat ambivalent on this matter. However, it is clear that the interest of the public in supporting expansion of transit service locally is, to a certain extent, constrained by their view of the economy.
DRAFT
1. Page 65 Page 65
Figure 40 Slight change in views of the economy
Slight change in views of the economy The survey was conducted late in 2011 when there were signs that the recession was ending, but unemployment, especially in Michigan, was still high. However, the sense of real crisis that prevailed immediately after the crash of 2008 and into 2009 had to some extent dissipated. This is reflected, though only slightly, in the responses to two questions about the economy and taxes. In 2011, compared to 2009, a total of 43% said that the economy was too uncertain for them to vote for the millage increase. But in 2009, the total had been 6% higher, 49%. Similarly, in 2011 47% said that they would like to expand public transit but could not afford to pay any more taxes. But in 2009 the analogous percentage had been 8% higher, 55%. In both cases the movement was small, but was moving in a direction that would tend to support development of new transit services.
DRAFT
1. Page 66 Page 66
Arguments in Favor of a Millage to Expand Transit Services
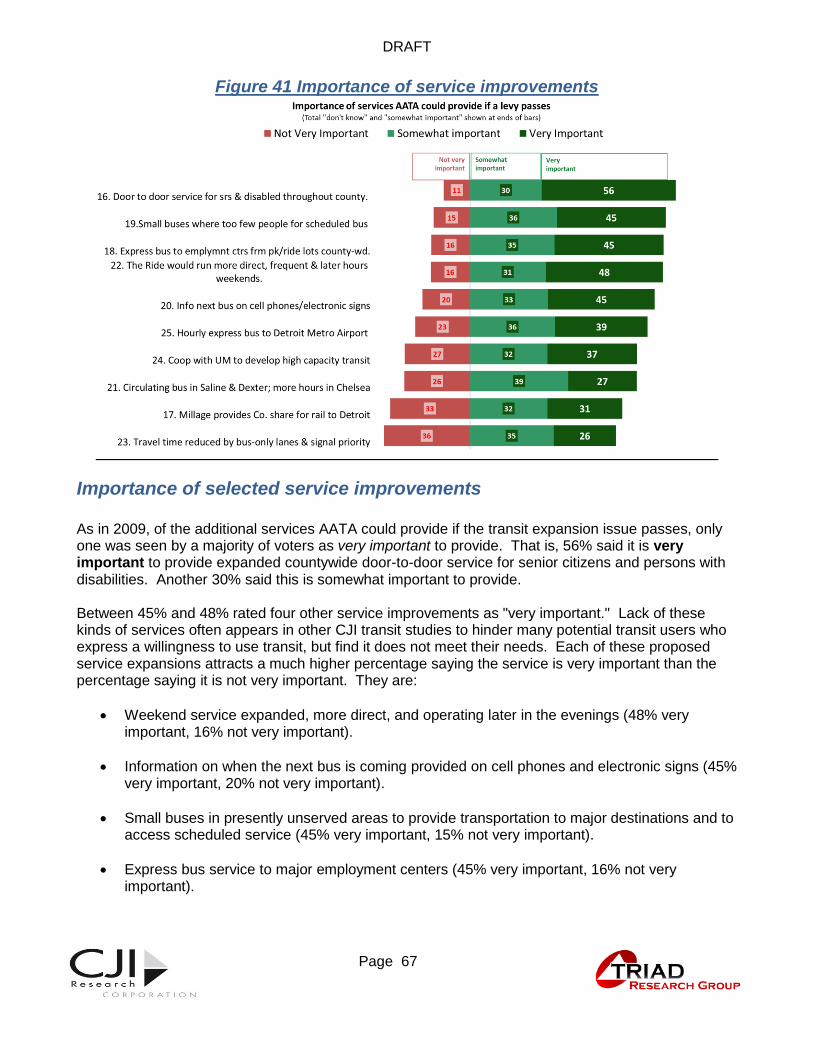
DRAFT
1. Page 67 Page 67
Figure 41 Importance of service improvements
Importance of selected service improvements As in 2009, of the additional services AATA could provide if the transit expansion issue passes, only one was seen by a majority of voters as very important to provide. That is, 56% said it is very important to provide expanded countywide door-to-door service for senior citizens and persons with disabilities. Another 30% said this is somewhat important to provide. Between 45% and 48% rated four other service improvements as "very important." Lack of these kinds of services often appears in other CJI transit studies to hinder many potential transit users who express a willingness to use transit, but find it does not meet their needs. Each of these proposed service expansions attracts a much higher percentage saying the service is very important than the percentage saying it is not very important. They are:
Weekend service expanded, more direct, and operating later in the evenings (48% very important, 16% not very important).
Information on when the next bus is coming provided on cell phones and electronic signs (45% very important, 20% not very important).
Small buses in presently unserved areas to provide transportation to major destinations and to access scheduled service (45% very important, 15% not very important).
Express bus service to major employment centers (45% very important, 16% not very important).

DRAFT
1. Page 68 Page 68
Two other items attract less support than those above, but still garner significantly more responses that the service is very important than responses saying that it is not very important. They are:
Hourly express to Detroit Metro Airport (39% very important, 23% not very important).
Plans with U of M to develop high capacity transit (38% very important, 26% not very important)
Local service in Saline and Dexter and extension of hours in Chelsea are presumably services of interest only in those locations and are thus not strictly comparable to services in the remainder of the list. One might assume that those services would thus be considered more important in those communities than elsewhere and perhaps also more important than other service improvements. However, while there appears to be a slight effect, it is minimal. For example, while 24% voters in Ann Arbor and 26% in the Ypsilanti area consider that new or increased service in Saline, Dexter, and Chelsea very important, 28% of voters in the City of Saline and the Eastern Townships consider it very important. More voters (44%) in that region of the county consider express service (to take one example) very important than consider the local circulator very important. (See Figure 42.) In other words, given that most local residents in those cities do not perceive themselves as being or becoming transit users, the promise of added local service is not especially attractive for them. N the other hand, express service to employment sites, presumably out of their towns, holds greater appeal.
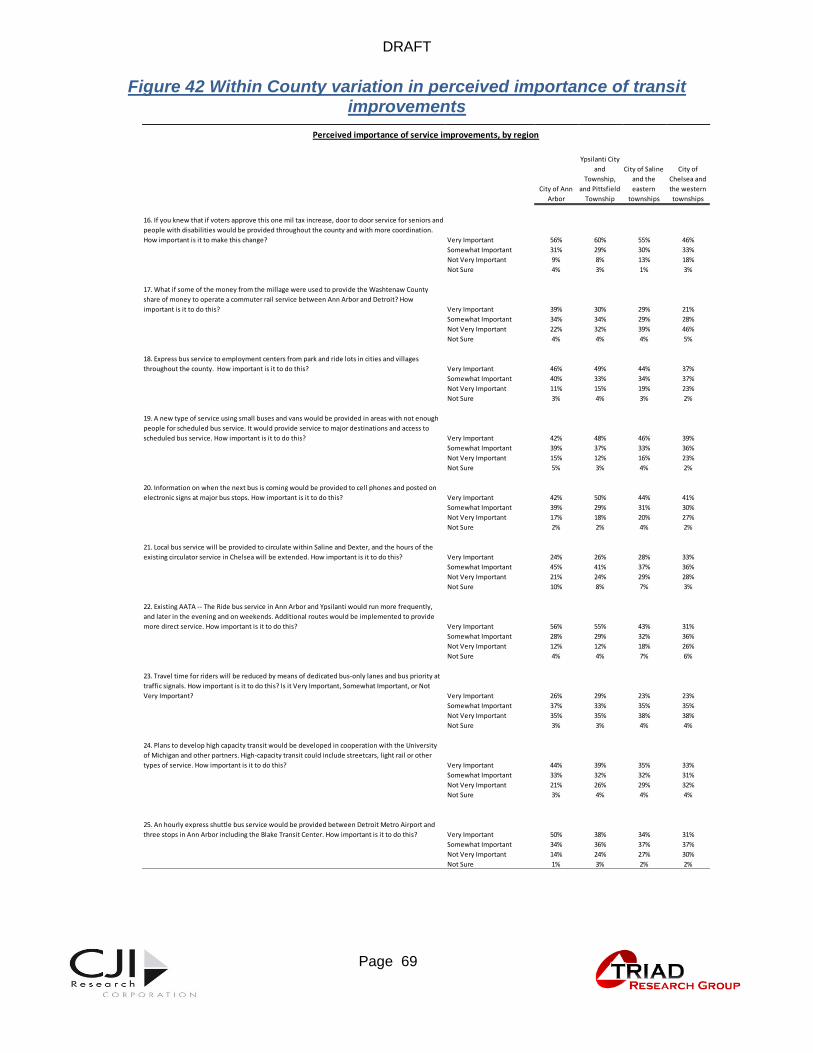
DRAFT
1. Page 69 Page 69
Figure 42 Within County variation in perceived importance of transit improvements
City of Ann
Arbor
Ypsilanti City
and
Township,
and Pittsfield
Township
City of Saline
and the
eastern
townships
City of
Chelsea and
the western
townships
16. If you knew that if voters approve this one mil tax increase, door to door service for seniors and
people with disabilities would be provided throughout the county and with more coordination.
How important is it to make this change? Very Important 56% 60% 55% 46%
Somewhat Important 31% 29% 30% 33%
Not Very Important 9% 8% 13% 18%
Not Sure 4% 3% 1% 3%
17. What if some of the money from the millage were used to provide the Washtenaw County
share of money to operate a commuter rail service between Ann Arbor and Detroit? How
important is it to do this? Very Important 39% 30% 29% 21%
Somewhat Important 34% 34% 29% 28%
Not Very Important 22% 32% 39% 46%
Not Sure 4% 4% 4% 5%
18. Express bus service to employment centers from park and ride lots in cities and villages
throughout the county. How important is it to do this? Very Important 46% 49% 44% 37%
Somewhat Important 40% 33% 34% 37%
Not Very Important 11% 15% 19% 23%
Not Sure 3% 4% 3% 2%
19. A new type of service using small buses and vans would be provided in areas with not enough
people for scheduled bus service. It would provide service to major destinations and access to
scheduled bus service. How important is it to do this? Very Important 42% 48% 46% 39%
Somewhat Important 39% 37% 33% 36%
Not Very Important 15% 12% 16% 23%
Not Sure 5% 3% 4% 2%
20. Information on when the next bus is coming would be provided to cell phones and posted on
electronic signs at major bus stops. How important is it to do this? Very Important 42% 50% 44% 41%
Somewhat Important 39% 29% 31% 30%
Not Very Important 17% 18% 20% 27%
Not Sure 2% 2% 4% 2%
21. Local bus service will be provided to circulate within Saline and Dexter, and the hours of the
existing circulator service in Chelsea will be extended. How important is it to do this? Very Important 24% 26% 28% 33%
Somewhat Important 45% 41% 37% 36%
Not Very Important 21% 24% 29% 28%
Not Sure 10% 8% 7% 3%
22. Existing AATA -- The Ride bus service in Ann Arbor and Ypsilanti would run more frequently,
and later in the evening and on weekends. Additional routes would be implemented to provide
more direct service. How important is it to do this? Very Important 56% 55% 43% 31%
Somewhat Important 28% 29% 32% 36%
Not Very Important 12% 12% 18% 26%
Not Sure 4% 4% 7% 6%
23. Travel time for riders will be reduced by means of dedicated bus-only lanes and bus priority at
traffic signals. How important is it to do this? Is it Very Important, Somewhat Important, or Not
Very Important? Very Important 26% 29% 23% 23%
Somewhat Important 37% 33% 35% 35%
Not Very Important 35% 35% 38% 38%
Not Sure 3% 3% 4% 4%
24. Plans to develop high capacity transit would be developed in cooperation with the University
of Michigan and other partners. High-capacity transit could include streetcars, light rail or other
types of service. How important is it to do this? Very Important 44% 39% 35% 33%
Somewhat Important 33% 32% 32% 31%
Not Very Important 21% 26% 29% 32%
Not Sure 3% 4% 4% 4%
25. An hourly express shuttle bus service would be provided between Detroit Metro Airport and
three stops in Ann Arbor including the Blake Transit Center. How important is it to do this? Very Important 50% 38% 34% 31%
Somewhat Important 34% 36% 37% 37%
Not Very Important 14% 24% 27% 30%
Not Sure 1% 3% 2% 2%
Perceived importance of service improvements, by region

DRAFT
1. Page 70 Page 70
Figure 43 Importance of service improvements to transit using and non-transit using households
IMPORTANCE OF SERVICE IMPROVEMENTS TO TRANSIT USING AND NON-USING HOUSEHOLDS Voters in rider households have a greater vested interest in service improvements than other voters. As the table above shows, they assign greater importance for all service improvements than voters in non-transit-using households. These households also constitute 40% of the electorate, and, though insufficient in numbers to assure approval of a transit expansion issue, they are thus a significant group. One item stands out. In terms of expansion of services for seniors and those with disabilities, voters in user households were much more likely (64%) than voters in non-user households (50%) to rate
Yes No Not Sure
Very Important 64% 50% 68%
Somewhat Important 26% 34% 20%
Not Very Important 7% 14% 0%
Not Sure 3% 2% 11%
Very Important 41% 24% 42%
Somewhat Important 34% 30% 25%
Not Very Important 22% 41% 21%
Not Sure 3% 4% 11%
Very Important 57% 37% 52%
Somewhat Important 32% 38% 34%
Not Very Important 9% 22% 2%
Not Sure 3% 4% 11%
Very Important 52% 40% 52%
Somewhat Important 35% 37% 14%
Not Very Important 10% 19% 2%
Not Sure 4% 3% 32%
Very Important 51% 40% 42%
Somewhat Important 35% 32% 14%
Not Very Important 13% 25% 13%
Not Sure 1% 3% 32%
Very Important 32% 23% 43%
Somewhat Important 42% 38% 44%
Not Very Important 17% 32% 2%
Not Sure 8% 7% 11%
Very Important 61% 39% 63%
Somewhat Important 26% 34% 19%
Not Very Important 8% 21% 18%
Not Sure 5% 6% 0%
Very Important 31% 21% 32%
Somewhat Important 39% 32% 35%
Not Very Important 27% 43% 22%
Not Sure 3% 4% 11%
Very Important 49% 30% 65%
Somewhat Important 33% 32% 24%
Not Very Important 15% 34% 12%
Not Sure 3% 4% 0%
Very Important 50% 31% 79%
Somewhat Important 35% 37% 6%
Not Very Important 14% 30% 9%
Not Sure 1% 2% 5%
Importance of service improvements to users and non-users of transit
12. In the past year, have you or anyone in your household
ridden any public transit in Washtenaw County, including
AATA, The Ride, People Express, the Wave, or Manchester
Senior Services?
20. Information on when the next bus is coming would be provided to cell phones and posted on electronic signs at major
bus stops. How important is it to do this?
21. Local bus service will be provided to circulate within Saline and Dexter, and the hours of the existing circulator service in
Chelsea will be extended. How important is it to do this?
22. Existing AATA -- The Ride bus service in Ann Arbor and Ypsilanti would run more frequently, and later in the evening and
on weekends. Additional routes would be implemented to provide more direct service. How important is it to do this?
23. Travel time for riders will be reduced by means of dedicated bus-only lanes and bus priority at traffic signals. How
important is it to do this? Is it Very Important, Somewhat Important, or Not Very Important?
24. Plans to develop high capacity transit would be developed in cooperation with the University of Michigan and other
partners. High-capacity transit could include streetcars, light rail or other types of service. How important is it to do this?
25. An hourly express shuttle bus service would be provided between Detroit Metro Airport and three stops in Ann Arbor
including the Blake Transit Center. How important is it to do this?
16. If you knew that if voters approve this one mil tax increase, door to door service for seniors and people with disabilities
would be provided throughout the county and with more coordination. How important is it to make this change?
17. What if some of the money from the millage were used to provide the Washtenaw County share of money to operate a
commuter rail service between Ann Arbor and Detroit? How important is it to do this?
18. Express bus service to employment centers from park and ride lots in cities and villages throughout the county. How
important is it to do this?
19. A new type of service using small buses and vans would be provided in areas with not enough people for scheduled bus
service. It would provide service to major destinations and access to scheduled bus service. How important is it to do this?
DRAFT
1. Page 71 Page 71
the improvement as very important. Although fewer voters in non-transit households said this service was very important, half of them did say it is very important. This suggests that there are many likely voters who will not use the service, but nevertheless believe it is important.
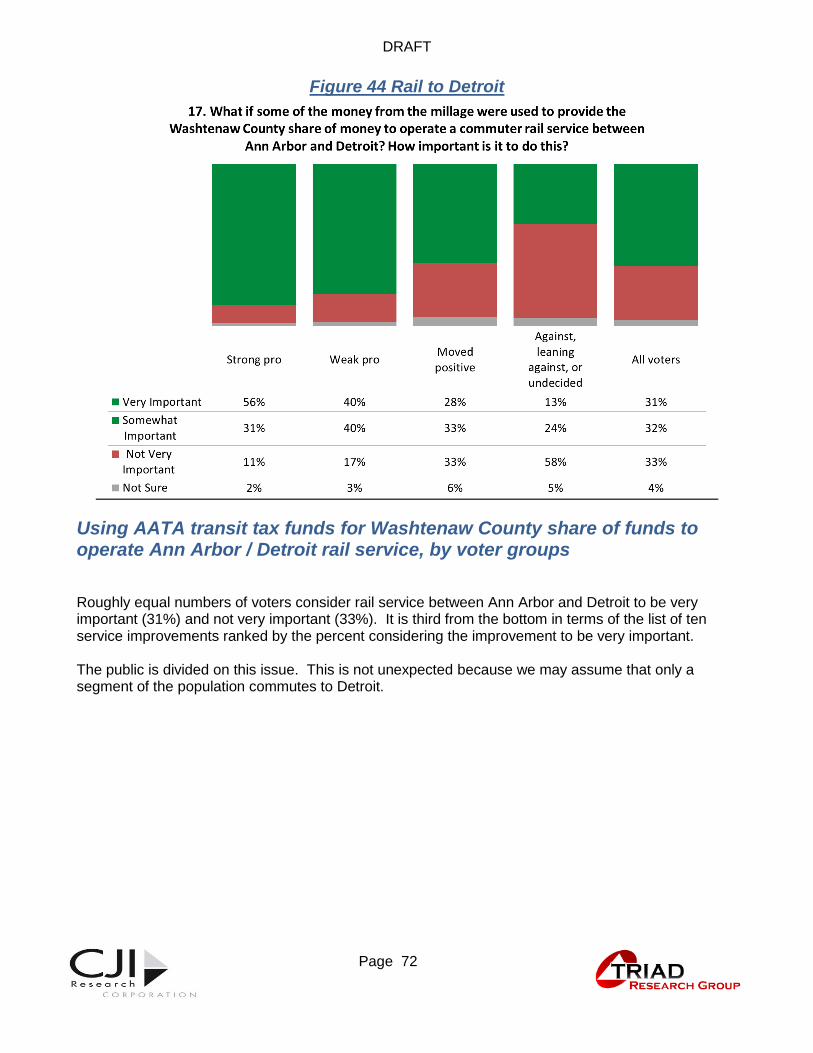
DRAFT
1. Page 72 Page 72
Figure 44 Rail to Detroit
Using AATA transit tax funds for Washtenaw County share of funds to operate Ann Arbor / Detroit rail service, by voter groups Roughly equal numbers of voters consider rail service between Ann Arbor and Detroit to be very important (31%) and not very important (33%). It is third from the bottom in terms of the list of ten service improvements ranked by the percent considering the improvement to be very important. The public is divided on this issue. This is not unexpected because we may assume that only a segment of the population commutes to Detroit.
DRAFT
1. Page 73 Page 73
How the Public Perceives Sets of Services as Related
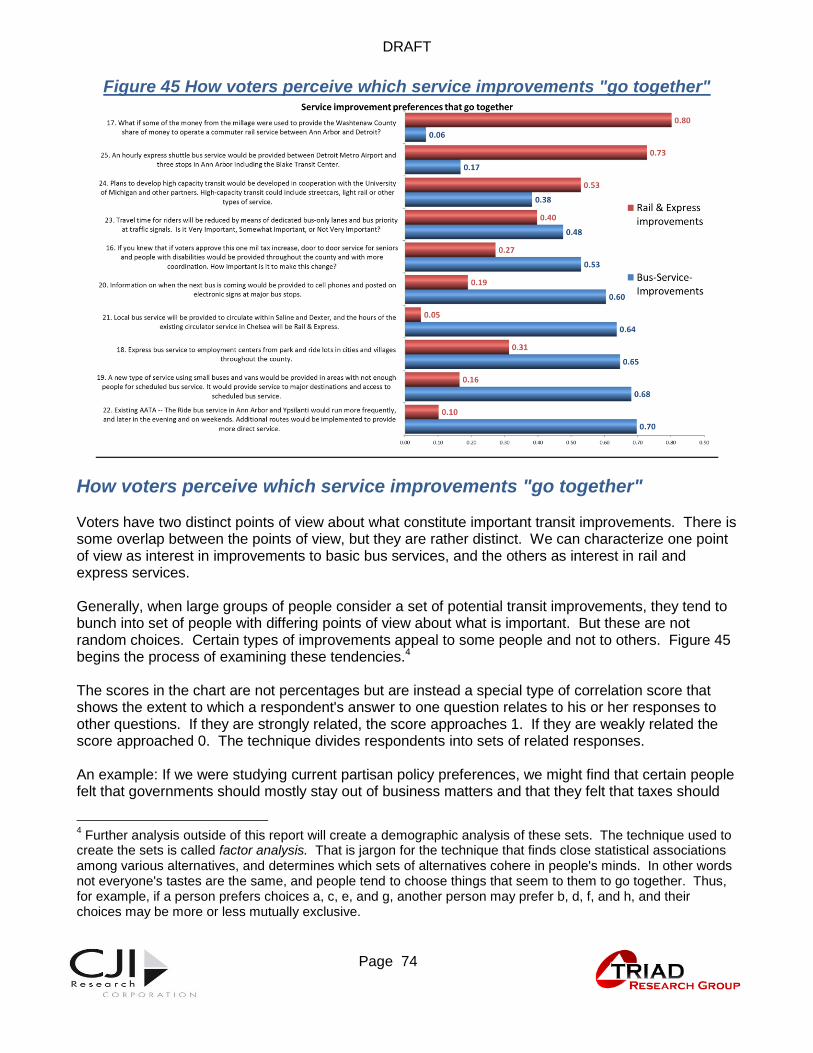
DRAFT
1. Page 74 Page 74
Figure 45 How voters perceive which service improvements "go together"
How voters perceive which service improvements "go together" Voters have two distinct points of view about what constitute important transit improvements. There is some overlap between the points of view, but they are rather distinct. We can characterize one point of view as interest in improvements to basic bus services, and the others as interest in rail and express services. Generally, when large groups of people consider a set of potential transit improvements, they tend to bunch into set of people with differing points of view about what is important. But these are not random choices. Certain types of improvements appeal to some people and not to others. Figure 45 begins the process of examining these tendencies.4 The scores in the chart are not percentages but are instead a special type of correlation score that shows the extent to which a respondent's answer to one question relates to his or her responses to other questions. If they are strongly related, the score approaches 1. If they are weakly related the score approached 0. The technique divides respondents into sets of related responses. An example: If we were studying current partisan policy preferences, we might find that certain people felt that governments should mostly stay out of business matters and that they felt that taxes should
4 Further analysis outside of this report will create a demographic analysis of these sets. The technique used to
create the sets is called factor analysis. That is jargon for the technique that finds close statistical associations among various alternatives, and determines which sets of alternatives cohere in people's minds. In other words not everyone's tastes are the same, and people tend to choose things that seem to them to go together. Thus, for example, if a person prefers choices a, c, e, and g, another person may prefer b, d, f, and h, and their choices may be more or less mutually exclusive.
DRAFT
1. Page 75 Page 75
be reduced. If we knew those things, we would be able to predict some other policy preferences such as their position on deficit reduction, banking regulation, and perhaps others. On the other hand, we might also find a group of people who had pretty much opposing views on all of these matters. To both types of people, their choices make sense as a whole package of opinions. We would likely label the first group "Republicans" and the others "Democrats." Once we knew one or two of their views, we would be able – usually, not always – to make a very good guess about their views on a wide range of topics and to infer their partisan loyalties without ever asking. What we find in the case of service improvements is that there is a set of service preferences that consists of commuter rail between Ann Arbor and Detroit hourly express to Detroit Metro Airport, high capacity transit locally, and some interest in express service to employment centers and in reduction of travel time through dedicated bus lanes, service from park and ride lots to employment centers. We have dubbed that preference tendency "rail and express". However, people who prefer those options have little interest in local services in Saline, Dexter and Chelsea, in extended routes and hours of service on existing AATA routes. And they have little interest in various other service improvements such as small buses service to unserved areas. In other words, these are not people who would be interested in supporting expansion of standard bus service, but could be interested in new types of expanded services, primarily oriented toward speed and often toward rail. Others take a view that is somewhat opposite. They take the stance that, if improvements are to be made at all, that all aspects of basic services are important to improve. But they have no interest in rail service to Detroit or in an hourly express to Detroit Metro Airport. We have labeled that group generically as "Bus service improvements." Neither label is entirely pure since "express" and "bus" overlap. But the purpose is only to give a reasonable label. The two groups are closest in sharing a point of view on reduction of travel time by using dedicated bus lanes and signal priority, and on high capacity transit. What this tells us is that there are two contrasting views in the community, one interested in more long-term extended forms of service improvements, while the other is more interested in incremental improvements in local service. We also know that if we know that is a person wanted, for example, The Ride to provide more weekend service, they would also be highly likely (.68) to want to see small bus and van service in areas not currently served by fixed routes, and express service to employment centers, but we would also know that they would not care much about having millage funds spent on rail to Detroit (.06). Conversely, if we knew that a person considered it very important to use millage funds to support rail service to Detroit, he or she would also very likely (.73) say that it is very important to operate an hourly shuttle from Ann Arbor to Detroit Metro Airport, but they would care very little (.10) about expanded weekend service on The Ride. Keep in mind, however, that these are tendencies, not pure and rigid positions. In the actual world, there are degrees of preference. Some people will want both types of service improvements and other none at all. Some will feel strongly about their preference while others will simply lean in one direction or the other. It is the mix of these that is interesting.

DRAFT
1. Page 76 Page 76
Figure 46 Service Improvement tendencies quantified
Service Improvement tendencies quantified The factor scores shown in Figure 45 on the previous page are only relative scores showing degrees of association with conceptual constructs. In statistical jargon, these are called "factors" but they should be more accurately referred to in common sense terms as attitude tendencies. Because the scores are only relative to the tendencies they represent, using them, we cannot answer the logical questions – How many voters feel one way and how many the other? And how do they each vote? To convert these attitude tendencies to constructs that have some real-world meaning, we took the highest five scoring service improvement items in each attitude tendency and looked at only to the scores "Very important". A top score of 5 would mean that the voter felt all five of the top scoring items were very important. A score of 0 would mean that not a single one of them appealed to the voter as being very important. The scores were then combined as shown in the chart above. It is apparent that the tendencies have similar size constituencies. This, in turn, suggests that unless they are totally polarized on these matters, there is probably overlap.
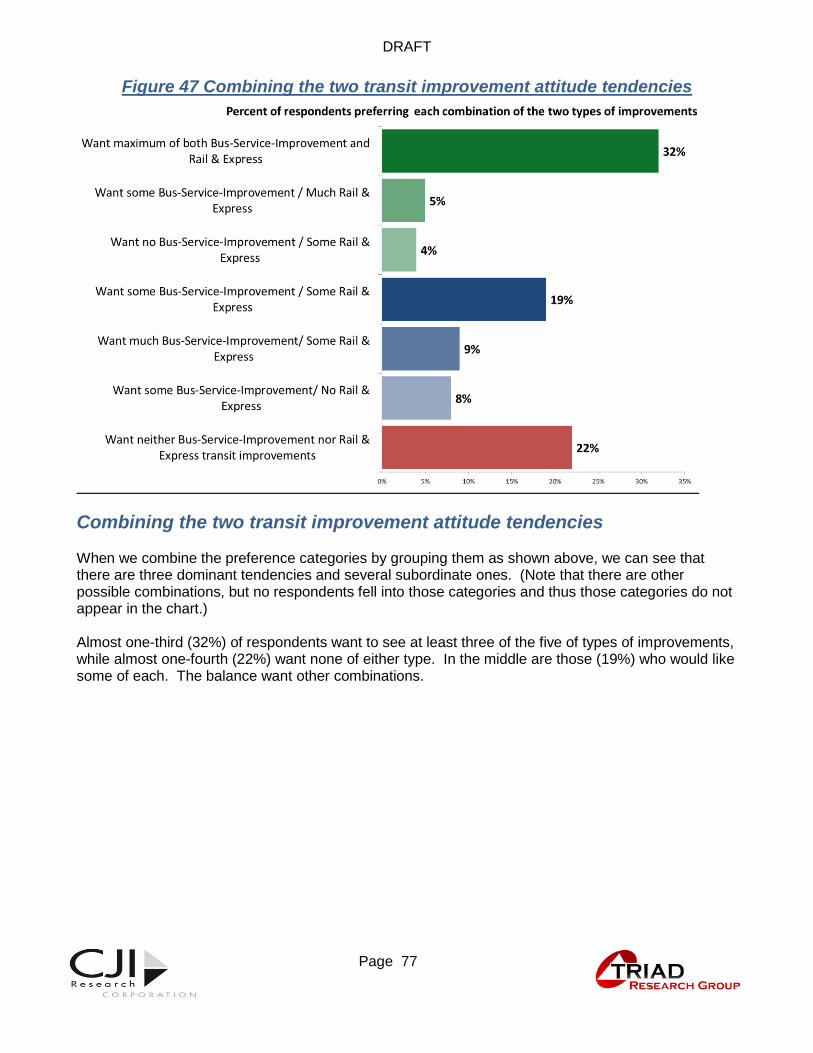
DRAFT
1. Page 77 Page 77
Figure 47 Combining the two transit improvement attitude tendencies
Combining the two transit improvement attitude tendencies When we combine the preference categories by grouping them as shown above, we can see that there are three dominant tendencies and several subordinate ones. (Note that there are other possible combinations, but no respondents fell into those categories and thus those categories do not appear in the chart.) Almost one-third (32%) of respondents want to see at least three of the five of types of improvements, while almost one-fourth (22%) want none of either type. In the middle are those (19%) who would like some of each. The balance want other combinations.

DRAFT
1. Page 78 Page 78
Reasons to Vote for a Transit expansion issue
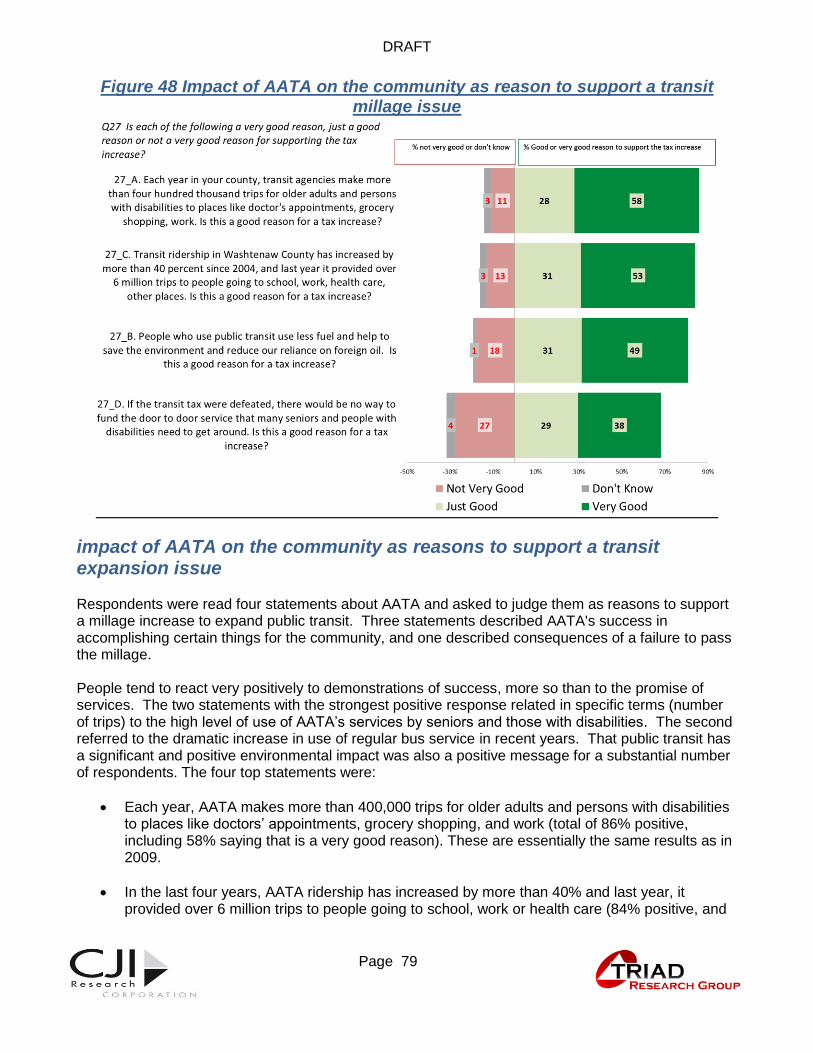
DRAFT
1. Page 79 Page 79
Figure 48 Impact of AATA on the community as reason to support a transit millage issue
impact of AATA on the community as reasons to support a transit expansion issue Respondents were read four statements about AATA and asked to judge them as reasons to support a millage increase to expand public transit. Three statements described AATA's success in accomplishing certain things for the community, and one described consequences of a failure to pass the millage. People tend to react very positively to demonstrations of success, more so than to the promise of services. The two statements with the strongest positive response related in specific terms (number of trips) to the high level of use of AATA’s services by seniors and those with disabilities. The second referred to the dramatic increase in use of regular bus service in recent years. That public transit has a significant and positive environmental impact was also a positive message for a substantial number of respondents. The four top statements were:
Each year, AATA makes more than 400,000 trips for older adults and persons with disabilities to places like doctors’ appointments, grocery shopping, and work (total of 86% positive, including 58% saying that is a very good reason). These are essentially the same results as in 2009.
In the last four years, AATA ridership has increased by more than 40% and last year, it provided over 6 million trips to people going to school, work or health care (84% positive, and

DRAFT
1. Page 80 Page 80
of these 53% saying it is a very good reason). These are statistically identical to the results of 2009.
People who ride AATA use less fuel. This helps to save the environment and reduce our reliance on foreign oil (80% positive, with 49% very good). These results are similar to those of 2009, with the total positive statistically the same but the "very good reason" portion down slightly from 54% to 49%.)
Less important to respondents overall was knowing that if this tax increase fails, service for seniors and the disabled may not be able to be funded. Overall, two-thirds of voters (67%) said that this is a very good or just a good reason to support the tax. However, more importantly, only 38% said it is a very good reason. Thus the positive response was in the more half-hearted "good reason" category. Also, more respondents (27%) said that it was not a good reason to support a tax increase than said that about any of the other three items.
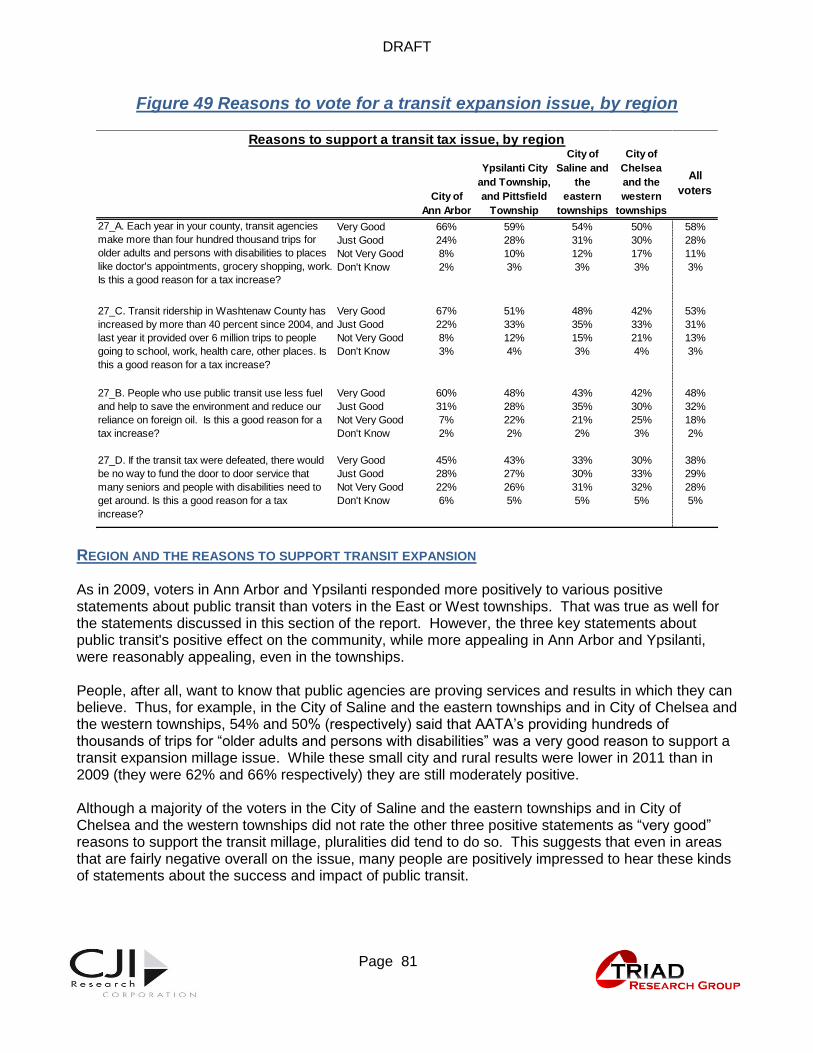
DRAFT
1. Page 81 Page 81
Figure 49 Reasons to vote for a transit expansion issue, by region
REGION AND THE REASONS TO SUPPORT TRANSIT EXPANSION As in 2009, voters in Ann Arbor and Ypsilanti responded more positively to various positive statements about public transit than voters in the East or West townships. That was true as well for the statements discussed in this section of the report. However, the three key statements about public transit's positive effect on the community, while more appealing in Ann Arbor and Ypsilanti, were reasonably appealing, even in the townships. People, after all, want to know that public agencies are proving services and results in which they can believe. Thus, for example, in the City of Saline and the eastern townships and in City of Chelsea and the western townships, 54% and 50% (respectively) said that AATA’s providing hundreds of thousands of trips for “older adults and persons with disabilities” was a very good reason to support a transit expansion millage issue. While these small city and rural results were lower in 2011 than in 2009 (they were 62% and 66% respectively) they are still moderately positive. Although a majority of the voters in the City of Saline and the eastern townships and in City of Chelsea and the western townships did not rate the other three positive statements as “very good” reasons to support the transit millage, pluralities did tend to do so. This suggests that even in areas that are fairly negative overall on the issue, many people are positively impressed to hear these kinds of statements about the success and impact of public transit.
City of
Ann Arbor
Ypsilanti City
and Township,
and Pittsfield
Township
City of
Saline and
the
eastern
townships
City of
Chelsea
and the
western
townships
All
voters
Very Good 66% 59% 54% 50% 58%
Just Good 24% 28% 31% 30% 28%
Not Very Good 8% 10% 12% 17% 11%
Don't Know 2% 3% 3% 3% 3%
Very Good 67% 51% 48% 42% 53%
Just Good 22% 33% 35% 33% 31%
Not Very Good 8% 12% 15% 21% 13%
Don't Know 3% 4% 3% 4% 3%
Very Good 60% 48% 43% 42% 48%
Just Good 31% 28% 35% 30% 32%
Not Very Good 7% 22% 21% 25% 18%
Don't Know 2% 2% 2% 3% 2%
Very Good 45% 43% 33% 30% 38%
Just Good 28% 27% 30% 33% 29%
Not Very Good 22% 26% 31% 32% 28%
Don't Know 6% 5% 5% 5% 5%
27_A. Each year in your county, transit agencies
make more than four hundred thousand trips for
older adults and persons with disabilities to places
like doctor's appointments, grocery shopping, work.
Is this a good reason for a tax increase?
27_C. Transit ridership in Washtenaw County has
increased by more than 40 percent since 2004, and
last year it provided over 6 million trips to people
going to school, work, health care, other places. Is
this a good reason for a tax increase?
27_B. People who use public transit use less fuel
and help to save the environment and reduce our
reliance on foreign oil. Is this a good reason for a
tax increase?
27_D. If the transit tax were defeated, there would
be no way to fund the door to door service that
many seniors and people with disabilities need to
get around. Is this a good reason for a tax
increase?
Reasons to support a transit tax issue, by region

DRAFT
1. Page 82 Page 82
Figure 50 Perceived benefits of transit
Perceived benefits of transit Five attitude statements about public transit were examined. In order of percent agreement with the statements, they are:
34% of respondents agreed strongly and another 43% agreed (for a total of 77%) that having a good reliable public transportation system is important to attracting jobs to the area and improving its economy. (2009 percentages, 38% and 42%, respectively.)
26% agree strongly and 49% agreed that The economy is so uncertain today that it is important to have good public transit as a backup form of transportation. (Not asked in the same way in 2009.)
26% strongly agreed and 44% agreed (for a total of 70% agreeing) that many seniors and people with disabilities who use AATA’s door-to-door service would have no other way of getting around.
At this point in the list, there is a marked fall off in the percent saying that they agree with the statements, and a marked increase in disagreement:
Only 21% agreed strongly and 36% agreed (for a total of 57%) that having public transit service in my community would be worth the cost of the property tax. When the focus of the

DRAFT
1. Page 83 Page 83
proposed service is narrowed like this to "my community" it logically loses force countywide and it moves from the realm of a general social good to the real of the personal. Because most local residents will not personally use transit – though they may benefit indirectly from its use by others - the potential personal benefit is usually less supported than the general public benefit.
Only 20% agreed strongly and 36% agreed (for a total of 56%) that economic uncertainty meant that it was important to them personally to have a backup form of transportation. This is interesting because of the contrast between this response and the response to the more impersonal but community oriented statement about a need for transit in uncertain times shown in the second item on the list. While 75% say they agree that uncertain times mean that a backup is needed, only 56% say that this applies to them personally. Thus, 19% (the difference between the groups) apparently feel that although the uncertainty will not affect their own transportation habits, it is important to have a backup for others.

DRAFT
1. Page 84 Page 84
Appendix A: Survey Questionnaire

DRAFT
1. Page 85 Page 85
WASHTENAW COUNTY SURVEY 2011 AATA Washtenaw Report CJI ver 5a
1. Overall, how satisfied are you with Washtenaw County as a place to live? Would you say that you are very satisfied, somewhat satisfied, somewhat dissatisfied or very dissatisfied with Washtenaw County as a place to live?
1
2
3
4
9
Very Satisfied
Somewhat Satisfied
Somewhat Dissatisfied
Very Dissatisfied
Not Sure
2. In your opinion, is Washtenaw County a better place to live than it was five years ago or is it a worse place to live?
1
2
3
9
Better
Worse
Same (Vol.)
Not Sure
3. Have you heard of the Ann Arbor Transportation Authority, which is often called A-A-T-A, (spell out), The Ride?
1
2
9
Yes (Go to Q4)
No (Skip to Q5)
Not Sure (Skip to Q5)
4. Overall, would you say you have a very favorable, somewhat favorable, somewhat unfavorable or very unfavorable opinion of Ann Arbor Transportation Authority, A-A-T-A, The Ride?
1
2
3
4
5
9
Very Favorable
Somewhat Favorable
Somewhat Unfavorable
Very Unfavorable
Mixed (Vol.)
Not Sure
5. Have you heard anything in the past year about a new county-wide public transit agency in Washtenaw County?
1
2
9
Yes (6)
No (0)
Not sure (0)
6. What is the main thing you have heard? 9 Don't recall
7. The new Washtenaw County transit agency will operate several public transit agencies now serving people in Washtenaw County, including A-A-T-A, The Ride, but also the smaller agencies called People Express, the WAVE, and Manchester Senior services. It will consider placing a transit expansion issue on the ballot for the purpose of increasing public transportation service and extending it throughout all of Washtenaw County.
Assuming that this ballot issue would increase property taxes by one mil county-wide, would you Definitely vote Yes, Probably vote Yes, Probably vote No or Definitely vote No on this one mil property tax increase to expand public transit services throughout the county?
1
2
3
4
9
Definitely Yes (Go to Q8)
Probably Yes (Go to Q8)
Probably No (Go to Q8)
Definitely No (Go to Q8)
Not Sure (Skip to Q9)
8. What is your main reason for voting that way? (PROBE)
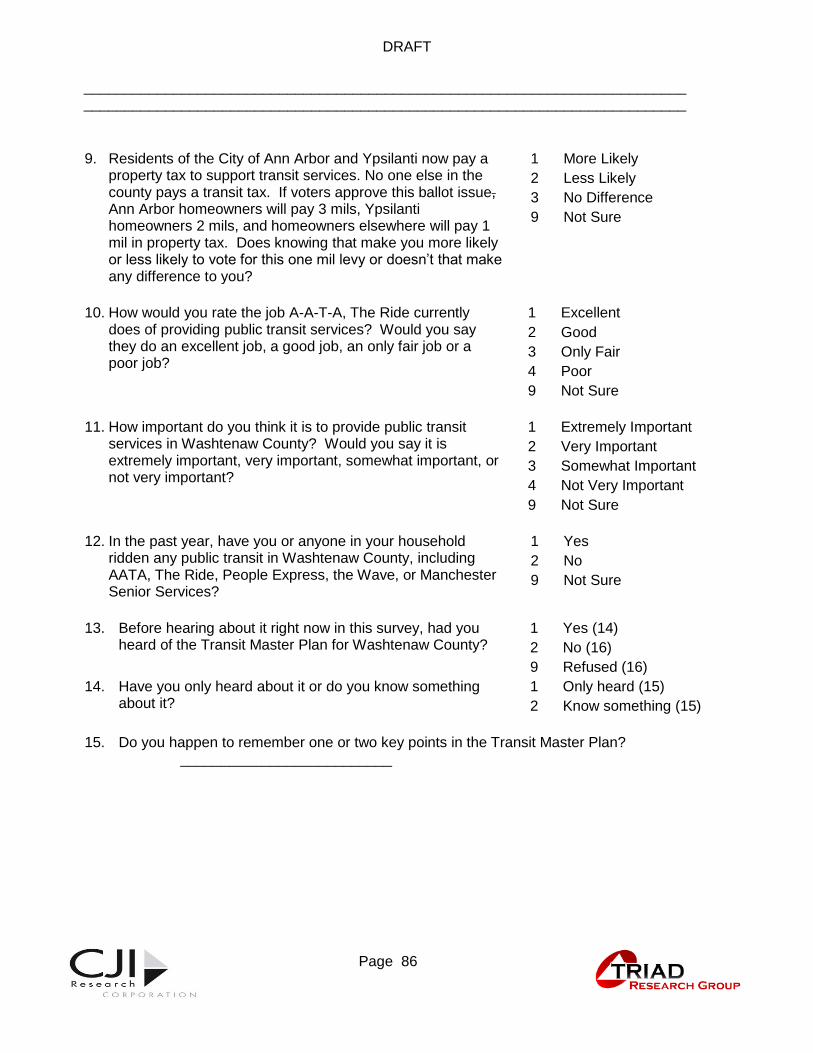
DRAFT
1. Page 86 Page 86
__________________________________________________________________________ __________________________________________________________________________
9. Residents of the City of Ann Arbor and Ypsilanti now pay a property tax to support transit services. No one else in the county pays a transit tax. If voters approve this ballot issue, Ann Arbor homeowners will pay 3 mils, Ypsilanti homeowners 2 mils, and homeowners elsewhere will pay 1 mil in property tax. Does knowing that make you more likely or less likely to vote for this one mil levy or doesn’t that make any difference to you?
1
2
3
9
More Likely
Less Likely
No Difference
Not Sure
10. How would you rate the job A-A-T-A, The Ride currently does of providing public transit services? Would you say they do an excellent job, a good job, an only fair job or a poor job?
1
2
3
4
9
Excellent
Good
Only Fair
Poor
Not Sure
11. How important do you think it is to provide public transit services in Washtenaw County? Would you say it is extremely important, very important, somewhat important, or not very important?
1
2
3
4
9
Extremely Important
Very Important
Somewhat Important
Not Very Important
Not Sure
12. In the past year, have you or anyone in your household ridden any public transit in Washtenaw County, including AATA, The Ride, People Express, the Wave, or Manchester Senior Services?
1
2
9
Yes
No
Not Sure
13. Before hearing about it right now in this survey, had you heard of the Transit Master Plan for Washtenaw County?
1
2
9
Yes (14)
No (16)
Refused (16)
14. Have you only heard about it or do you know something about it?
1
2
Only heard (15)
Know something (15)
15. Do you happen to remember one or two key points in the Transit Master Plan? __________________________

DRAFT
1. Page 87 Page 87
[RANDOMIZE ORDER OF Q16 TO Q25] Now I would like to read you several aspects of transportation service that would change if voters approve the levy we have been discussing. For each one, please tell me if you feel it is very important to make this change, somewhat important or not very important
16. If you knew that if voters approve this one mil tax increase, door to door service for seniors and people with disabilities would be provided throughout the county and with more coordination. How important is it to make this change? Is it Very important, Somewhat important, or not very important?
1
2
3
9
Very important
Somewhat important
Not very important
Not Sure
17. What if some of the money from the millage were used to provide the Washtenaw County share of money to operate a commuter rail service between Ann Arbor and Detroit? How important is it to do this? Is it Very important, Somewhat important, or not very important to make this change?
1
2
3
9
Very important
Somewhat important
Not very important
Not Sure
18. Express bus service to employment centers from park and ride lots in cities and villages throughout the county.
1
2
3
9
Very important
Somewhat important
Not very important
Not Sure
19. A new type of service using small buses and vans would be provided in areas with not enough people for scheduled bus service. It would provide service to major destinations and access to scheduled bus service [If asked: This would be available to all, not just seniors or people with disabilities How important ….
1
2
3
9
Very important
Somewhat important
Not very important
Not Sure
20. Information on when the next bus is coming would be provided to cell phones and posted on electronic signs at major bus stops
1
2
3
9
Very important
Somewhat important
Not very important
Not Sure
21. Local bus service will be provided to circulate within Saline and Dexter, and the hours of the existing circulator service in Chelsea will be extended.
1
2
3
9
Very important
Somewhat important
Not very important
Not Sure
22. Existing AATA – The Ride bus service in Ann Arbor and Ypsilanti would run more frequently, and later in the evening and on weekends. Additional routes would be implemented to provide more direct service.
1
2
3
9
Very important
Somewhat important
Not very important
Not Sure
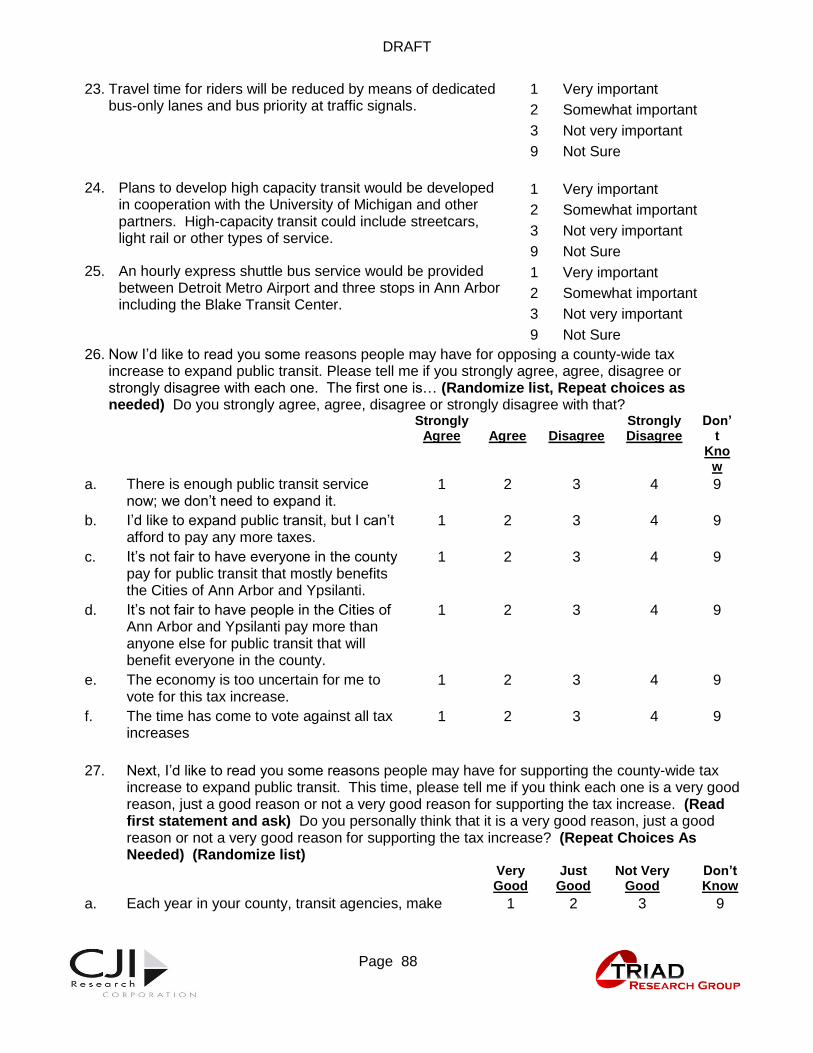
DRAFT
1. Page 88 Page 88
23. Travel time for riders will be reduced by means of dedicated bus-only lanes and bus priority at traffic signals.
1
2
3
9
Very important
Somewhat important
Not very important
Not Sure
24. Plans to develop high capacity transit would be developed in cooperation with the University of Michigan and other partners. High-capacity transit could include streetcars, light rail or other types of service.
1
2
3
9
Very important
Somewhat important
Not very important
Not Sure
25. An hourly express shuttle bus service would be provided between Detroit Metro Airport and three stops in Ann Arbor including the Blake Transit Center.
1
2
3
9
Very important
Somewhat important
Not very important
Not Sure
26. Now I’d like to read you some reasons people may have for opposing a county-wide tax increase to expand public transit. Please tell me if you strongly agree, agree, disagree or strongly disagree with each one. The first one is… (Randomize list, Repeat choices as needed) Do you strongly agree, agree, disagree or strongly disagree with that?
Strongly Agree
Agree
Disagree
Strongly Disagree
Don’t
Know
a. There is enough public transit service now; we don’t need to expand it.
1 2 3 4 9
b. I’d like to expand public transit, but I can’t afford to pay any more taxes.
1 2 3 4 9
c. It’s not fair to have everyone in the county pay for public transit that mostly benefits the Cities of Ann Arbor and Ypsilanti.
1 2 3 4 9
d. It’s not fair to have people in the Cities of Ann Arbor and Ypsilanti pay more than anyone else for public transit that will benefit everyone in the county.
1 2 3 4 9
e. The economy is too uncertain for me to vote for this tax increase.
1 2 3 4 9
f. The time has come to vote against all tax increases
1 2 3 4 9
27. Next, I’d like to read you some reasons people may have for supporting the county-wide tax increase to expand public transit. This time, please tell me if you think each one is a very good reason, just a good reason or not a very good reason for supporting the tax increase. (Read first statement and ask) Do you personally think that it is a very good reason, just a good reason or not a very good reason for supporting the tax increase? (Repeat Choices As Needed) (Randomize list)
Very Good
Just Good
Not Very Good
Don’t Know
a. Each year in your county, transit agencies, make 1 2 3 9
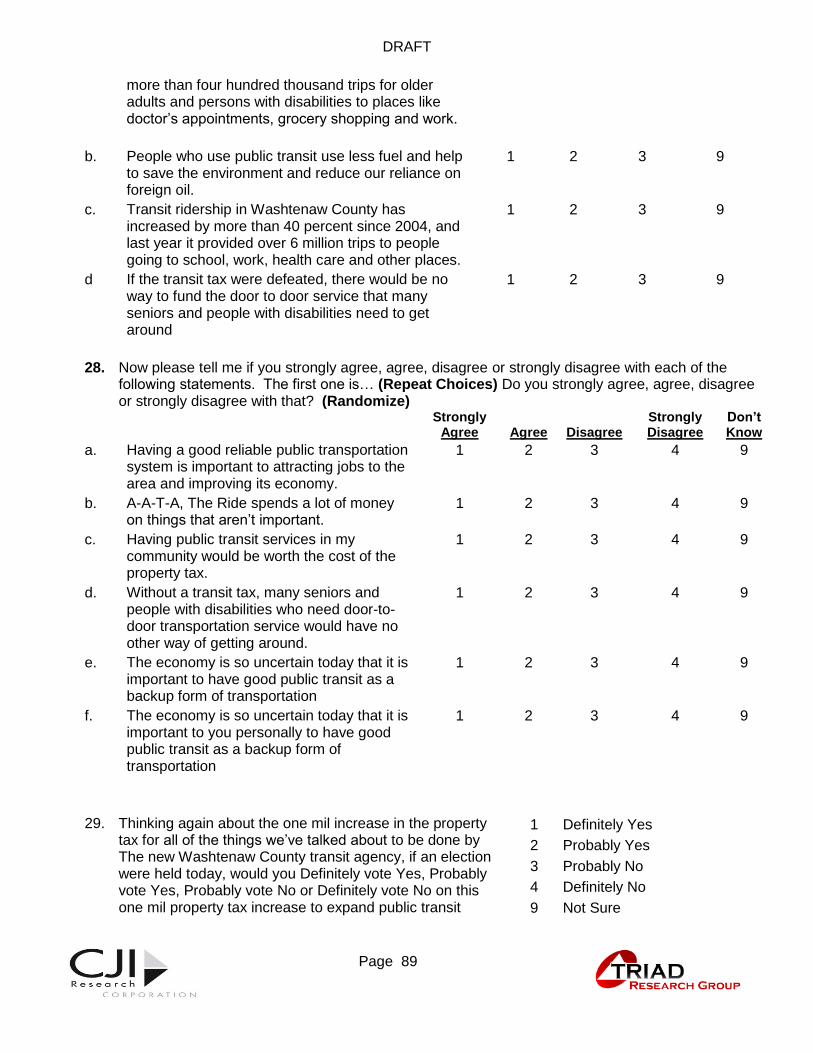
DRAFT
1. Page 89 Page 89
more than four hundred thousand trips for older adults and persons with disabilities to places like doctor’s appointments, grocery shopping and work.
b. People who use public transit use less fuel and help to save the environment and reduce our reliance on foreign oil.
1 2 3 9
c. Transit ridership in Washtenaw County has increased by more than 40 percent since 2004, and last year it provided over 6 million trips to people going to school, work, health care and other places.
1 2 3 9
d If the transit tax were defeated, there would be no way to fund the door to door service that many seniors and people with disabilities need to get around
1 2 3 9
28. Now please tell me if you strongly agree, agree, disagree or strongly disagree with each of the following statements. The first one is… (Repeat Choices) Do you strongly agree, agree, disagree or strongly disagree with that? (Randomize)
Strongly Agree
Agree
Disagree
Strongly Disagree
Don’t Know
a. Having a good reliable public transportation system is important to attracting jobs to the area and improving its economy.
1 2 3 4 9
b. A-A-T-A, The Ride spends a lot of money on things that aren’t important.
1 2 3 4 9
c. Having public transit services in my community would be worth the cost of the property tax.
1 2 3 4 9
d. Without a transit tax, many seniors and people with disabilities who need door-to-door transportation service would have no other way of getting around.
1 2 3 4 9
e. The economy is so uncertain today that it is important to have good public transit as a backup form of transportation
1 2 3 4 9
f. The economy is so uncertain today that it is important to you personally to have good public transit as a backup form of transportation
1 2 3 4 9
29. Thinking again about the one mil increase in the property tax for all of the things we’ve talked about to be done by The new Washtenaw County transit agency, if an election were held today, would you Definitely vote Yes, Probably vote Yes, Probably vote No or Definitely vote No on this one mil property tax increase to expand public transit
1
2
3
4
9
Definitely Yes
Probably Yes
Probably No
Definitely No
Not Sure

DRAFT
1. Page 90 Page 90
services throughout the county? Now I have a few questions for classification purposes only.
30. Into which of the following age groups do you fall? Are you … (read responses 1 through 4)?
1
2
3
4
9
18 to 34 years
35 to 49 years
50 to 64 years
65 and over
Refused
31. Are you currently a college student? 1
2
9
Yes
No
Refused
32. How often, if at all, do you use the social networking sites like Facebook, Twitter, Google Plus, Foursquare or others like them?
1
2
3
4
9
Not at all
Daily
Several times a week
Use it, but less often
Don’t Know/Refused
33. Do you use a cell phone? 1
2
9
Yes (Go to Q34)
No (Go to Q35)
Don’t Know/Refused (Go to Q35)
34. How do you handle your personal telephone calls? Do you…
1
2
3
4
9
use a cell phone for all your calls use a cell phone for more than half your calls use a cell phone for about half your calls use a cell phone for less than half your calls
Don’t Know/Refused
35. Do you consider yourself to be a Democrat, Republican or Independent?
1
2
3
9
Democrat
Republican
Independent
Don’t Know/Refused
36. Would you say your total household is more or less than sixty thousand dollars?
1
2
9
More than $60,000 (Go to Q38)
Less than $60,000 (Go to Q37)
Refused (Vol.) (Go to End)
37. (If less than $60,000) Into which income group would you say your household falls? Would you say it falls into… (Read responses 1-4)
(Go to 39)
1
2
3
4
9
Less than $15,000
$15,000 to $29,999
$30,000 - $44,999
$45,000 to $59,999
(VOL) Refused
38. (If more than $60,000) Into which income group would you 1 $60,000 - $74,999
DRAFT
1. Page 91 Page 91
say your household falls? Would you say it falls into… (Read responses 1-5)
(Go to End)
2
3
4
5
9
$75,000 - $99,999
$100,000 to $149,999
$150,000 - $199,999
More than $200,000 (VOL) Refused
39. (By observation) Was the respondent Male or Female? 1
2
Male
Female
And finally, may I have your first name? (If asked, say so that my supervisor can ask for you if he/she needs to call you to verify my work.) ____________________________________ This is the end of our survey. Thank you very much for your time.
DRAFT
1. Page 92 Page 92
Appendix B: Demographics of the Sample Components
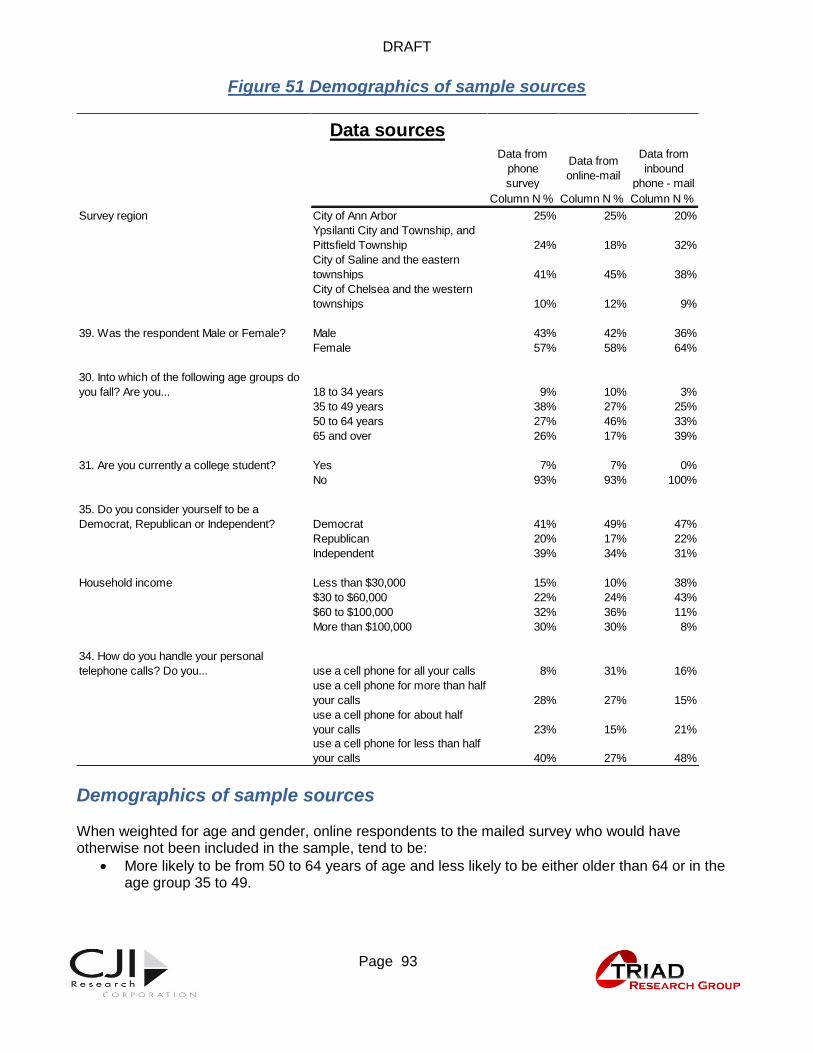
DRAFT
1. Page 93 Page 93
Figure 51 Demographics of sample sources
Demographics of sample sources When weighted for age and gender, online respondents to the mailed survey who would have otherwise not been included in the sample, tend to be:
More likely to be from 50 to 64 years of age and less likely to be either older than 64 or in the age group 35 to 49.
Data from
phone
survey
Data from
online-mail
Data from
inbound
phone - mail
Column N % Column N % Column N %
Survey region City of Ann Arbor 25% 25% 20%
Ypsilanti City and Township, and
Pittsfield Township 24% 18% 32%
City of Saline and the eastern
townships 41% 45% 38%
City of Chelsea and the western
townships 10% 12% 9%
39. Was the respondent Male or Female? Male 43% 42% 36%
Female 57% 58% 64%
30. Into which of the following age groups do
you fall? Are you... 18 to 34 years 9% 10% 3%
35 to 49 years 38% 27% 25%
50 to 64 years 27% 46% 33%
65 and over 26% 17% 39%
31. Are you currently a college student? Yes 7% 7% 0%
No 93% 93% 100%
35. Do you consider yourself to be a
Democrat, Republican or Independent? Democrat 41% 49% 47%
Republican 20% 17% 22%
Independent 39% 34% 31%
Household income Less than $30,000 15% 10% 38%
$30 to $60,000 22% 24% 43%
$60 to $100,000 32% 36% 11%
More than $100,000 30% 30% 8%
34. How do you handle your personal
telephone calls? Do you... use a cell phone for all your calls 8% 31% 16%
use a cell phone for more than half
your calls 28% 27% 15%
use a cell phone for about half
your calls 23% 15% 21%
use a cell phone for less than half
your calls 40% 27% 48%
Data sources

DRAFT
1. Page 94 Page 94
Somewhat more likely to identify themselves as Democrats rather than as either Republicans or Independents.
Less likely to be in the lowest income category (they can afford to be online, almost certainly on broadband).
Much more likely to make all or most of their phone calls by cell phone. In contrast, those who responded by calling the toll free number were more likely than others to be:
Women
65 or older (this relates to gender – women outlive men).
More Republican than those who responded online.
To be in the lowest income category (this relates to age).
More likely than those responding to the phone survey to use a cell phone for all their calls. In short, the effort to obtain additional breadth of representation by means of supplementing the telephone survey with a mailed supplement succeeded in reaching components of the likely voter population that otherwise would not have been included in the sample.