a business plan concept: 5 proposed themes and 15 ... · framing the business plan concept •...
TRANSCRIPT

A Business Plan Concept 5 Proposed Themes and 15 potential lsquobig ideasrsquo
Purpose This document sets out an introduction to 5 proposed themes and a series of potential ideas to include in an initial 3-year CGIAR Business Plan It is intended to inform discussions during a number of agenda items during the System Councilrsquos 6th
meeting on 16-17 May 2018 as referred to in the Provisional Agenda
Document SC6-02Issued 2 May 2018
Prepared by CGIAR System Management Office
At System Council 5th meeting in Cali
bull SC5-04 CGIAR Business Cycle set out a proposal for the CGIAR System to adopt a business planning cycle as a mechanism to deliver a systematic approach to the sequencing of major operational financial and institutional decision-making at the system level
bull Decision SCM5DP4 The System Council endorsed a business planning cycle concept for the CGIAR System with a proposed multi-year business plan for the CGIAR System being brought for final approval to the System Councilrsquos November 2018 meeting (and launched from 1 January 2019) with an update on progress being provided to the System Councilrsquos May 2018 meeting
1
Background on business plan concept
Key delivery dates for a 1st CGIAR Business Plan
Framing the business plan concept
bull Overriding purpose To fully unlock the potential of the 2016 CGIAR governance reforms ndash which opened the door to areinvigorated sense of collective ownership of the Centers to help chart the destiny of the CGIAR System with theSystem Management Board having been created by the Centers and Funders to be a major convening and guiding force
bull What is emerging from consultations since November 2017 Is a business concept whose elements add up to anambitious but achievable set of innovations Not a ldquobig bangrdquo reform but a series of changes aimed to proactivelymanage necessary evolution
bull A major challenge - and opportunity - in putting together the building blocks for the 1st multi-year business plan Isthe absence of clarity on a shared CGIAR business model for how CGIAR as a System can deliver on its ambitious goals inthe context of an accelerating pace of global change
bull Hence the proposed first business plan for 2019-2021 will have the twin goals1 Modernizing and improving todayrsquos CGIAR yet at the same timehellip2 Defining the need and processes for potentially radical rethinking and clarifying a shared CGIAR business
model to inform a clear longer-run strategy for the next portfolio and to provide a framework for anticipatedongoing institutional innovation
bull A key consideration on the emerging issues as the business plan concept evolves - they are self-reinforcing Requiringa change in behavior by all key stakeholders to improve performance For example programs will only be able to betterdrive performance improvements across the System if Funders increase the share of resources allocated to Windows 1and 2 Similarly Funders will only do this if they have increased confidence around a plan to improve performancerequiring action by program leaders and Centers There are many other such symmetries in this business plan concept
2
A possible business plan meta-narrative
The challenge and opportunity focus and simplify bull The pace of change in our operating environment is accelerating ndash we must identify how we can continue to remain relevant in this
context This requires deeper consideration to help frame the business plan and the required planning exercise The food system is at thecenter of climate change health challenges environmental degradation jobs creation and of course food security Drawing on CGIARrsquos newnarrative how can CGIAR position itself in the face of the simultaneous transformations in genomics information technology markets thenatural environment and nutrition
bull We have assets the world is going to need for a long time to come but only if we adapt and create value from them ndash reinventing andrebranding ourselves and what we do as and when required Incredible resources in terms of science capability is at our disposal as well asinfluential assets such as our global presence and critical mass in terms of skilled staff that should allow us to continue to rethink andreconfigure the way we work
bull Shift further from lsquosmall stuffrsquo to lsquobig thingsrsquo - big bundled initiatives that can command the funding and long-term drive enabling us to go forlarge-scale transformational impact in cooperation with partners This was the principle in setting up the CRPs ndash we need to finish the job
bull Tackle any spread repetition and fragmentation For example bundle efforts strategically elicit synergy through cooperation coordinate andalign the work of Centers that are doing similar work bringing the comparative advantages of each cooperatively to bear on the causes weserve
bull Lower transaction costs and overhead related to governance and administration Take internal measures including structural measuresaddressing commons and boundary issues that are unlikely to be fixable by individual Centers acting on their own
3
An overall objective
To position CGIAR for a relevant role in the 21st century through sharp focus and increased relevance and impact in a rapidly changing context where lsquobusiness as usualrsquo approaches no longer apply
A longer-run goal
CGIAR has a high degree of relevance and name recognition as a thought leader agenda-setter and go-to place for continued innovation in the fields of evidence analytics and scalable solutions for natural resource management in a broad sense of the term agriculture and attendant transformations and nutrition health and balanced diets ndash guided by an operational framework that is lean in terms of transaction costs efficient more effective and clear about its brand and unique selling points
Situating the Business Plan - Global Challenges
4
ENVIRONMENT
PROSPERITYCLIMATE
HEALTH
FOOD SECURITYYield increases of staple crops have flatlined struggling to keep pace with growing demand Agricultural output must increase in harmony with the natural environment by improving access to quality inputs extension services and innovations along the value chain
Water land and forests are precious yet finite natural resources Agriculture accounts for about 70 of global water withdrawals and is the biggest cause of forest loss Additionally a third of the worldrsquos soil is classified as degraded
Many of the worldrsquos poor rely on agriculture and natural resources for food and livelihood More than 85 of the worldrsquos 12 billion youth live in developing countries where meaningful employment and entrepreneurial opportunities are limited ndash contributing to migration and political insecurity
Climate change and climate shocks put the most vulnerable people at risk Heat drought flood and unpredictable growing seasons harm farmers and production systems
2016 saw this decadersquos first increase in the number of chronically undernourished now more than 800 million people Two billion people suffer from micronutrient deficiencies an equal number are overweight or obese
Food ndash the way we grow catch transport process trade and consume it ndash is central to the main challenges facing humanity
Source CGIAR Narrative document 2018
Situating the Business Plan Harnessing knowledge-intensive transformations
5
GENOMICS REVOLUTION
ECONOMIC TRANSFORMATION
INFORMATION REVOLUTION
To accelerate development of a new generation of crops and animals to improve yield as well as increase nutrient content and market value ndash while increasing resilience to climate challenges pests and diseases
To revitalize rural economies bring value to consumers and leverage the power of economic growth to reduce poverty ndashtargeting equity and the key role of women in production post-harvest processing and across the value chain
To deliver impact-at-scale by harnessing the power of agriculturally relevant data and analytics for farmers businesses and governments and to facilitate two-way information sharing for learning and decision support
ENVIRONMENTAL TRANSFOMATIONTo drastically cut the environmental cost of agriculture and reverse land degradation by scaling up climate-smart agriculture and improving soil health agroforestry practices natural resource management and water use efficiency
NUTRITION TRANSFORMATIONTo tackle chronic malnutrition hidden hunger and the availability of safe healthy and diverse foods by harnessing the political technological and market potential of food systems
To solve these complex challenges CGIAR partners with governments national research institutes civil society and the private sector on5 global transformationshellip all knowledge intensive
Source CGIAR Narrative document 2018
A possible structure for the Business Plan
There are many ways to divide up the complex set of issues to be addressed in the CGIAR Business Plan that will be developed during 2018
This concept document uses the ldquoStar Modelrdquo by Jay Galbraithsup1 which defines a taxonomy to articulate the elements of a business model with each element individually important as well as being deeply dependent upon and connected to others in the model
STRATEGY
STRUCTURE
PROCESSESREWARDS
PEOPLE
6sup1 From Business Model Generation by Alexander Osterwalder ampYves Pigneur
Section 1 Strategy Improving Strategizing and Planning
Summary 5 themes and 15 potential lsquobig ideasrsquo for an initial CGIAR System 3-year business plan
11 Defining a planning landscape to 203012 Optimizing the current portfolio13 Planning for financial viability
21 Deeper System-wide cooperation and alignment22 Enhancing CGIAR assets and response preparedness23 Strengthened collaboration with delivery partners
31 A program performance management framework32 A 5-point plan to improve System funding modalities33 A 4-point plan for an aligned assurance system
41 Reaffirm funder commitments42 Attract new investments to shared research agenda43 Stewardship visibility and recognition
Interpretation note The ideas listed within each of the 5 business plan elements above represent some of the key concepts that are emerging from consultations across the System However this does not necessarily represent the way in which each idea is covered in this document As some ideas are more developed than others individual ideas within each of the sections may be presented as a part of a combined slide of ideas expanded on a separate slide or described across multiple slides
Section 5 People Attracting retaining and nurturing the best
Section 3 Processes Defining and improving
Section 4 Rewards Securing a long-term funding base
Section 2 Structure Catalyzing institutional innovation
7
Slides 8 to 15
51 Embed gender equity in the workplace52 Operate according to best practice ethical standards53 Monitor metrics around an agreed people strategy
Slides 16 to 21
Slides 22 to 40
Slides 41 to 44
Slides 45 to 46
SECTION 1 STRATEGY SECTION 2 STRUCTURE SECTION 3 PROCESSES SECTION 4 REWARDS SECTION 5 PEOPLE
8
Improving Strategizing and Planning
The opportunityFor CGIAR to adopt a forward-leaningstrategizing and planning process to the2030 SDG lsquomilestone momentrsquo ndashfacilitating constant innovation andproactive change management to headoff problems before they requireldquobig-bangrdquo reforms The acceleratingpace of change in CGIARrsquos operatingenvironment demands this
The ideas
11 Defining a planning landscape to 2030
12 Optimizing the current Portfolio
13 Planning for financial viability
Section 1 ndash Strategy
More detail
Slides 9 - 12
Slide 13
Slide 14 - 15
SECTION 1 STRATEGY
9
Sub-section 11Defining a planning landscape to 2030
STRATEGY
SECTION 1 STRATEGY
The opportunityA key date is 2030 ndash the reconciliation moment in terms of progress against the global SDGs It is also the moment that our Strategy and Results Framework (ldquoSRFrdquo) ends As an anchor date to our forward thinking it therefore seems like a good target date for our planning processes
The ideasFirst the SRF as a broad expression of our overall research strategy and goals ndash running to 2030
Second a CGIAR ldquo2030 Planrdquo that sets out a new round of programming for the 2022-2030 period framed in terms of CGIARrsquos planned contribution to meeting the SDGs The Plan would cover three business cycles This would cover much of the strategic content of current CRPPlatform submissions filling a critical gap in terms of providing clear institutional strategies on key areas and a vision around CGIARrsquos niche and theories of change ndash but would stop short of detailed activity and budgeting plans ndash these would be covered and renewed periodically in successive 3-year business plans Key questions for the 2030 Plan could include whetherhow to re-frame CGIARrsquos objectives and reporting in terms of SDGs what could be the longer-term institutional objectives to 2030 What should be the major lsquoprogramming themesrsquo in the plan ndash and how closely could these relate to the SDGs How could the CGIAR research program modality be further improved Eg Comprehensive or not Larger or smaller Frameworks or programs Role of W12 as now or more narrowly focused How to improve the process Built in flexibility to respond to changing circumstances or fixed over business plan period
Third 3-year CGIAR System Business Plans These would align all key elements into a well-managed cycle (see slide below) Three year program implementation plans in support of the 2030 research themes would be presented from Business Plan 2 which taken collectively are the backbone of the 3-year business plan Key advantages of a 3-year cycle include it fits best with CGIARrsquos funderrsquos typical multi-year approval cycles ndash only a few extend beyond 3 years with those longer funding cycles still welcomed and not requiring shortening it enables a more nimble Portfolio ndash 3 yearly adjustments but based on longer-run program themes in the 2030 Plan to ensure more stability 3 years is short enough to allow for deeper reprogramming and reallocations if required every 3 years simultaneously providing for more within-period stability and space for researchers to focus on implementation a 3-year cycle is typical for multilateral organizations (eg IFAD IDA)
Fourth an annual cycle that has as its focus an SMB submission to November System Council meetings recommending any changes to budgets andor CRP annual programming plans
Center-level planning cycles are foundational Centers have the opportunity to explore any scope of alignment with the 3-year business plans andor the 2030 Plan 10
11 Defining a planning landscape to 2030 - 4 layers
SECTION 1 STRATEGY
11
11 Aligning with the Sustainable Development Goals (SDGs)
The opportunity To align System goals and reporting to the SDGs and improve the quality of measurement of CGIARrsquos contribution to the SDG targets
The ideas
bull In a lsquo2030 Planrsquo CGIAR could reformulate goals and high-level theories of change to align with SDG targets
bull Improve measurement of the CGIAR contribution to SDGs building on ongoing analysis commissioned by ISPC
bull Use of SDG metrics in CGIAR impact assessments
bull Improve the rate of yield increase for major food staples from current lt20 to 25year
bull 150 million more people 50 of them women meeting minimum dietary energy requirements
bull 500 million more people 50 of them women without deficiencies of one or more of the following essential micronutrients iron zinc iodine vitamin A folate and vitamin B12
bull 33 reduction in women of reproductive age who are consuming less than the adequate number of food groups
CGIARSTRATEGIC GOALS
2030 TARGETS AS STATED IN CGIARrsquoS 2016-2030 STRATEGY AND RESULTS FRAMEWORK
bull 350 million more farm households have adopted improved varieties breeds or trees andor improved management practice
bull 100 million people 50 of them women assisted in exiting poverty
bull 20 increase in water and nutrient (inorganic biological) use efficiency in agro-ecosystems including through recycling and reuse
bull Reduce agriculture related greenhouse gas emissions bybull 8 Gt CO2-e yrndash1 (15) compared with a business-as-usual
scenario in 2030bull 190 million hectares (ha) degraded land area restoredbull 5 million ha of forest saved from deforestation
SECTION 1 STRATEGY
12
Key element Preparatory year (2018) Year 1 (2019) Year 2 (2020) Year 3 (2021)1 Business planning
processInitial 3-year (2019-22) business plan prepared and approved by November 2018
Launch implementation of business plan
Initiate planning and scoping for next business cycle
Finalization and initial green-light of 2022-24 business cycle at May SC meeting November SC -agree new 3-year business plan for next cycle
2 Getting to 2030 ndashSDGs CGIAR SRF
SC General Assembly and SMB reflections on case for a lsquo2030 Planrsquo
2030 Plan preparation including planning for check-in moments
May System Council ndash 2030 Plan approval Relevant implementation actions
3 Evaluation Agree a CGIAR evaluation plan over 3-year cycle ndash bringing in visibility of all evaluation work undertaken in System
Carrying out planned evaluations by Centers System other stakeholders
Completion of planned evaluations ndash with main evaluation inputs received by end of year 2
Completion of planned evaluations by end of year 3 and agree next 3-year workplan as part of new business plan
4 Reporting Pilot lsquoCGIAR Annual performance reportrsquo concept on 2017
Annual performance report on 2018 Annual performance report on 2019 Annual performance report on 2020 ndash to include a meta-level assessment of progress towards CGIARrsquos System Level Outcomes + SDGs over cycle
5 Impact Assessment (past research)
Align funding and work plan for SPIA to 3-year business planning cycle
Capacity strengthening in impact assessment + one major cross-cutting thematic review
Lessons learned from SPIA + 1 or 2 major impact assessments of past research to inform broader conversation on CGIARrsquos role
Preparation of next cycle of impact assessment support to Centersprograms
6 Foresight Foresight event aligned to SC November 2018
Year 2 ndash major foresight publicationscience event to help to frame strategic focus of next 3-year research cycle
Potential specific foresight questions to address if specially requested by SC
7 Research programming
For first cycle continue with 2017-2021 Portfolio (amended and improved as appropriate) 3-year indicative Program Plans prepared as basis for Business Plan
Relevant updates to 2019-2021 indicative 3-year Programs Plans
[ Second cycle 2022-2024ndash launch updatednew research themesprograms]
Guided by the lsquo2030 Planrsquo commission development of next round of rolling program implementation plans + set criteria for independent reviewRelevant updates to 2019-2021 indicative 3-year Programs Plans
Independent review of planned next cycle of research + November System Council decision on a new round of 2022-2024 3-year implementation plans towards the lsquo2030 Planrsquo research themesprograms
8 Funding Collective multi-year pledging process (total amounts + at CRPPlatform level)
Annual contributions (and annual pledging for relevant funders)
Annual contributions (and annual pledging for relevant funders)
Multi-year pledging process (total amounts + at CRP level)
9 System Council Funder membership
Possible reconsideration of the timing for considering Funder seating
End of year 2 - reconciliation of last 3-year Funder seating based on contributions
10 Budgeting Prepare 3-year Financing Plan for the System and seek agreement on new funding modalities
Forward looking annual budget review for 2020-2021
Forward looking annual budget review for 2021 November SC - Agree next 3-year programs + platforms + System entities forward indicative budgets
11 Advocacy + communications
System Council++ event Annual theme XX (eg climate) Annual theme XX (eg foresight theme) Annual theme XX (eg progress towards SDG targets)
11 Defining a planning landscape to 2030 - 3-year business plan concept
Interpretation note Slide aims to share the anticipated level of detail in the initial 3-year business plan
Does not seek to cover all elements that would be included
SECTION 1 STRATEGY
13
Topic Challenge1 Breeding Enhance CGIARrsquos key breeding programs in capacity and
the means to capitalize with global suppliers (of inputs including knowledge management) and enter into effective dissemination pathways ndash through the multi-Funder initiative to enhance crop breeding programs
2 Fall Armyworm More strategically target the threat to food security nutrition and livelihoods posed by Fall Armyworm through coordinated action across CGIAR
3 Private sector engagement
Seize opportunities to harness the full potential of our partnerships ndash skills capacity approach and scale
4 Gender in research
Clearly articulate CGIARrsquos approach through adoption of a clear plan on Gender in Research better integration of gender in performance management system
5 Climate change A system-wide institutional strategy on our work on climate change could help underpin CGIARrsquos success and funding on this increasingly urgent and dominant issue
6 Addressing hidden hunger
With a first focus on a cross-Center approach to developing a CGIAR-wide biofortification strategy covering key substantive and institutional issues
7 Anti-microbial resistance
To set out an ambitious contribution of CGIAR to tackle anti-microbial resistance
8 CGIARrsquos genebanks
Address a strategic gap in CGIARrsquos Strategy and Results Framework regarding CGIARrsquos genebanks
Opportunities to improve and clarify in some areas
bull The first 3-year business plan would aim to continue the current portfolio but address various gaps in institutional strategy
bull New areas or tasks may be included in the Portfolio over the business plan period
To note Modalities were set out in document SC5-07 (November 2017 SC meeting) on managing CRP revisions including the process for adding new flagships or major expansions in scope to a flagship
bull A possible additional criteria for entry into the Portfolio during the business cycle would be the requirement for meeting a minimum ISPC rating
bull One implication of a 3 year business plan implementation period would be that the next cycle of programs and platforms would start in 2022 hence the existing CRPs Platforms would be implemented for 5 not 6 years
STRATEGY
To note
Sub-section 12Optimizing the current Portfolio
SECTION 1 STRATEGY
CENTER 2014 2015 20162017 (EST)
AfricaRice 0 -11 -9 -18
IWMI 3 -15 -6 -13
World Fish 2 -2 -5 0
CIFOR -5 -13 -15 -11
Bioversity 0 -2 4 -2
ICARDA -3 -1 0 -2
CIP 3 -5 -2 0 gt 10 deficit
ICRAF 2 -2 -3 -2 5-10 deficit
ICRISAT 3 -4 12 -3 gt0 but lt5 deficit
IRRI -1 -1 -4 -5 0 or surplus
ILRI 1 3 -1 -2
CIAT 4 1 0 -4
IITA 1 1 -1 1
IFPRI 1 0 0 0
CIMMYT 3 2 -1 2
14
STRATEGY
Note Centers ranked by 2017 Center estimated revenue
The issue main driver of recurring net losses appears to be a steep decline in W12 funding since 2014which has reduced overall revenue to Centers and made them rely more heavily on W3 and bilateralprojects that provide insufficient indirect cost recovery (noting cost recovery is covered in more depth onslide 38)
Sub-section 13Planning for financial viability
SECTION 1 STRATEGY
15
STRATEGYThe opportunity A vision for how CGIAR as a partnership of Centers could shift on to a sustainable longer term financial path
Sub-section 13Planning for financial viability
Successful implementation of key elements in each theme in this Business Plan concept would help to strengthen financial performance for example
1 Strategy - improved overall reputation and strategic focus of CGIAR driving maintained and even increased overall funding including at W3 level
2 Structure - further cooperation and alliances between Centers to drive up efficiencies and value for money alongside further planned efforts by individual Center levels to restructure to align costs with revenue
3 Processes ndash the 5-point plan to improve system funding modalities alongside greater assurance on risk management and program performance
4 Rewards ndash a well-mobilized collective funder engagement5 People ndash a well motivated and talented workforce
SECTION 1 STRATEGY SECTION 2 STRUCTURE SECTION 3 PROCESSES SECTION 4 REWARDS SECTION 5 PEOPLE
16
Focusing on reducing fragmentation driving efficiency and increasing value for money
The contextbull From slide 2 above the first of the twin goals of the proposed first CGIAR
business plan is to modernize and improve todayrsquos CGIAR recognizing that doing the same thing in the same way as we have been doing cannot adequately leverage CGIARrsquos capabilities in what is an increasingly changing environment - both in terms of
- Exponential technological institutional and social change and - In the operating context of multiple new stakeholders entering what is
a progressively competitive space for agricultural research for development
bull To set itself up for successful implementation of successive business plans CGIAR will quickly address several structuralinstitutional andor operational barriers that create unnecessary (and inevitably costly) fragmentation in our work
bull Some initiatives are well underway in their strategic planning (eg the multi-Funder initiative on breeding and the System Councilrsquos rethinking of the role of its advisory services thus impacting the role that such bodies will play in the forthcoming business cycle) Others are at a more experimental stage of consideration and will require more analysis to take forward
Section 2 ndash Structure
Image source ndash selected extracts from presentation of John Hagel co-chairman for Deloitte LLPs Center for the Edge titled lsquoInstitutional Innovationrsquo 16 February 2015
Institutional Innovation is about
SECTION 2 STRUCTURE
The opportunityBuilding on the 2016 CGIAR reform andintensive interactions across Centers inpreparation of the business plan it isintended that it will elaborate concretepathways and measures during the 3-yearimplementation period bringing essentialsynergies to the institutional arrangementsthrough which we work
17
Section 2 ndash Structure
The ideas
21 Deeper System-wide cooperation and alignment
22 Enhancing CGIAR assets and response preparedness
23 Strengthened collaboration with delivery partners
More detail
Slides 18-19
Slide 20
Slide 21
Catalyzing institutional innovation
SECTION 2 STRUCTURE
18
STRUCTURE
Sub-section 21Deeper System-wide cooperation and alignment
Theme Potential details for inclusion in the initial 3-year business plan
Enhanced Center alliances to harness synergies
Space to reflect on any progress in ongoing discussions between several Centers on deeper alliances the increase cooperation and alignment to harness synergies accelerate impact and drive efficiencies Will depend on any voluntary actions taken by Centers ndash and not mandated within any Business Plan period Center inputs to date suggest that such actions could potentially include i) any scope for deeper institutional ties between compatible Centers ii) any scope for common Board membershipBoard leadership between compatible Centers iii) any scope for system-wide efforts between Centers to move to a more structured plan of having some level of common Board membersBoard leadership
New shared services to achieve improved institutional efficiency
Shared services not only allow the achievement of institutional cost savings but also institutional efficiencies thereby providing value for money in staff time Centers are proposing to identify a selected set of key areas where they can utilize economies of scale to deliver substantial staff time andor cost savings Scoping work across the 2018 calendar year will identify potential areas for implementation ndash potentially including purchasing efficiencies a common policy nomenclature framework and storage system to facilitate strengthened cross-System best practices sharing and learning andor financial systems further alignment
Modernizing and increasing research data availability
Identify ways to further leverage Big Data capabilities and transform the agricultural R4D sector building on the innovations being introduced through the lsquoGlobal Agricultural Research Data Innovation amp Acceleration Networkrsquo (lsquoGARDIAN toolrsquo) as showcased on the page that follows
Efficiencies in Advisory services
(Led by System Council)
As set out System Council meeting paper SC6-06 SIMEC Think-piece on the future of CGIARrsquos advisory bodies CGIARrsquos Funders have identified the opportunity to (i) improved efficiency (ii) improved communication between the services and the System (iii) improved and systematic linkages between science and development (iv) higher ownership of the advice produced by the services by the System (v) while also ensuring independence of the content-matter of the advice
SECTION 2 STRUCTURE
The opportunityThrough the BigData platform lsquoGARDIANrsquo initiative for CGIAR to be seen as global leader in providing findable accessible interoperable and reusable (lsquoFAIRrsquo) data and publications by year by Center by country and research theme in a seamless and open way
19
21 Deeper System-wide cooperation and alignment Modernizing and increasing research data availability
The ideas1 Incentivize the sharing of high quality interoperable datasets
over progressive business plan cycles (almost 100000 publications and over 2100 datasets are already discoverable but great potential exists) CGIAR Program Performance Management Standards (described below ndash slide 32) can help support this
2 Develop rate analytics and visualization functionalities to facilitate innovative and actionable solutions from the agricultural data generated by CGIAR and its partners
SECTION 2 STRUCTURE
20
Sub-section 22Enhancing CGIAR assets and response preparedness
STRUCTURE
The opportunityLearning from the experience in Fall Armyworm more effectively demonstrate and further build CGIARrsquos ability to respond rapidly to emerging crises such as pests and epidemics ndashwith a focus on ensuring that we have the right systems aligned to be able to contribute to global discussions and follow up in a coordinated way
Initial ideasbull Identifying capacity from within the
System to act as a clearly identifiable coordination point internally and externally (eg appoint Special Envoys dedicated portals for information dissemination etc)
bull Exploration of optimum and efficient responsive funding arrangements for emerging crises such as new pests and diseases
SECTION 2 STRUCTURE
The opportunity
Increasing the reach and impact of CGIAR research activities CGIAR is dependent on partnerships for getting its research disseminated and scaled for development impact Through a more strategic alignment with delivery partners CGIAR research and innovation will have a greater adoption reach and ultimately impact
The ideas
bull Private Sector collaboration Private sector has a significant role to play not only as an upstream partner in providing access to advanced technology and specialized expertise but also as a downstream partner in providing access to markets and enabling the scaling -up and out of our research outputs
bull Country collaboration Through a Country Collaboration approach CGIAR can catalyze the development of a collective CGIAR role and impact scenario in countries in which CGIAR has a significant presence based on meaningful synergies across CGIAR entities National Governments National Systems and other partners to develop strategies and deliver programs directly aligned to key country priorities This can create an enabling environment for other partnerships and delivery initiatives
bull A CGIAR Rome Hub Increasing contribution and relevance of CGIAR in the crossroads of the global food security dialogue and with the major impact delivery partners based on Rome A consolidated CGIAR premises with capacity from Centers and CRPs SMO successors to ISPC SPIA and IEA Internal Audit Function and flex space for visiting Center staffDGs
bull MDB cooperation Establishing structures and potential mechanism(s) for CGIAR knowledge innovation and tools to contribute to design baseline implementation MampE of major development programs in the multilateral development banks
21
23 Strengthened collaboration with delivery partners
The below image is a possible collaboration maturity model where collaboration efforts in particular Countries could be represented in terms of particular stages at a given time and be used to establish collaboration aspirations and activities in those Countries
SECTION 1 STRATEGY SECTION 2 STRUCTURE SECTION 3 PROCESSES SECTION 4 REWARDS SECTION 5 PEOPLE
22
Defining and improving
The opportunity
For CGIAR to be more effectiveand efficient in the delivery ofits programs and systems anddemonstrate this in a morecompelling way to furtherstrengthen trust and supportFeatured in this section are aselection of key processesrequiring strengthening
Selected ideas
31 A program performance management framework
32 A 5-point plan to improve System funding modalities
33 A 4-point plan for an aligned assurance system
Section 3 ndash Processes
More detail
Slides 23-32
Slides 33-38
Slides 39-40
SECTION 3 PROCESSES
23
PROCESSES
Sub-section 31A program performance management framework
The opportunityTo set out an approach to program performance management that is credible and can drive improvements over time ndash providing assurance to key stakeholders
Mechanisms to achieve goal
bull Strengthening reporting and learning from outputs and outcomes of past research
bull Improving management of current program performance
bull Developing components to improve decision-making about future research funding
SECTION 3 PROCESSES
24
31 A program performance management framework
12 Framework Components
Past results reporting1 CGIAR Annual Performance Report2 CRPsPlatform reporting
requirements 3 Common results reporting indicators4 Outcome and impact case studies5 Program Results Dashboard6 Past Evaluations7 Impact Assessments
Present improved management8 Within-cycle reviews and evaluations9 Program Performance
Management Standards
Future improved decision-making10 Quality at Entry Assessment11 Planning landscape12 Allocation criteria and tool
SECTION 3 PROCESSES
The opportunity To pilot a new approach to annual reporting to improve accountability and give confidence to Funders and key supporting partners by (i) a more focused looking-back at achievements from completed research (ii) reflecting on the current CGIAR research portfolio and (iii) reviewing progress and plans for continued improvements in performance
Timelinebull In 2018 the annual report will be published at the end of September The planning and reporting cycle is later than
usual due to new systems being implementedbull Planning and reporting cycles will be revised in 2019 so that the publication will be finalized earlier in the year
25
31 - Annual CGIAR Performance Report a new approach (component 1)
The 2018 report under preparationbull Aims to interest a critical (non-researcher) audience that is
looking for serious discussion of issues and evidencebull Represent a range of voices from across CGIAR and partnersbull Demonstrate progress towards CGIAR goals (SRF) while
reflecting on the approaches and partnerships that promote impact
bull Reflect on the value added of CGIAR Research Programs and Platforms working in Research Centers to deliver results
bull Reflect on how funding has been able to support system goalsbull Incorporate available results from the new reporting systems (to
be introduced in late 2018)
Building on 2018 reports for 2019 and beyond will also incorporatebull New program results dashboard Highlights from the interactive
CGIAR dashboard capturing research innovations outcomes and impacts
It will report and reflect on progress towards CGIARs goals tobull Modernize improve and stabilizebull Provide an enabling environment to improve quality and deliver
impactbull Build an efficient system with reduced transaction costsbull Strengthen and diversify funding (new collaborations initiatives)
to enable a longer-term funding basebull Attract retain and build the highest quality staff
2018 Introducing new reporting approach 2019 harmonization with new CGIAR Business Plan Cycle
SECTION 3 PROCESSES
Selected ideas bull Deliver data interoperability and consolidation from
multiple source systems (including lsquoGARDIANrsquo tool discussed earlier on slide 19) with data interfacing and storage on a central database
bull The on-line results reporting system will be used going forward to streamline the creation of the Annual CGIAR Performance Report
bull The dashboard mockup on the following slides provides visualization ideas aligned with current operational CGIAR Results Reporting guidance
26
31 - A new CGIAR Program Results Dashboard (component 5)
The opportunityThrough making use of modern visualization technology CGIAR will be able to provide real-time program information to Funders partners and other stakeholders via wwwcgiarorg
Filtering will be possible by programplatform by year by outcomeimpact on the ground (by country) and by innovation stage
SDG
Find information by
Program Platform
Partner Institutions
2016 2017 2018
22
Policies
231
Innovation by Stage Peer-reviewed Papers
1918
Partnerships
475 1555
Trainees
Financials
Budget Allocation by CRPPTF
CRP Funding Update
This selection allows filtering of all elements of the page by year
On the home page the heat map indicates the number of evidences by region
5 reporting indicators are highlighted on the home page By clicking on an indicator the user navigates to a more detailed page on innovations policies etc
All pages of the dashboard contain links to search information related to
SDGs CRPs and partners
CGIAR Program Results DashboardProgress towards
System Level Outcomes (SLOs)
Reporting Indicators
28
SLO SDGThe distribution of evidences can be displayed by SLO or by SDG
North AfricaProgress towards SLO 4 evidences reportedOutcome case studies 10 case studies reportedPolicies 5 policies enactedInnovation by stage 10 in stage 4Partnership 50 partners work with usParticipants 15000 people involved in our activitiesTrainees 150 people trainedPeer-reviewed papers 193 in ISI journals
By hovering over a region a window displays key information that is geographically tagged By
clicking on the region the user navigates to the next page
27
SDG
Find information by
Program Platform
Partner Institutions
2016 2017 2018
3
Policies
23
Innovation by Stage Peer-reviewed Papers
1918
Partnerships
41 123
Trainees
Outcome Case Studies
Case Study Title CRPPTF
Adoption of citizen science methodology shapes new linkages between researchers and farmers for climate adaptation
CCAFS
De Brauw 2016 showed that biofortified OFSP varieties have disseminated to an estimated 289M households in 12 SSA countries (125 grams per day meets the daily vitamin A requirement of a child under five)
RTB
CIMMYT FAO and the World Bank found in Kazakhstan that spring wheat yields are as much as 58 higher under (widely-adopted) zero tillage introduced by WHEAT than with conventional technologies
WHEAT
RTB - 2017Western AfricaAdoption of citizen science methodology shapes new linkages between researchers and farmers for climate adaptationSLO Target 21 Improve the rate of yield increase for major food staples from current lt1 to 12-15 per yearIDOSub-IDO 132 Increased livelihood opportunitiesA14 Enhanced capacity to deal with climatic risks and extremesCross-cutting Gender Youth
Outcome Impact on the Ground
This page displays outcome case studies related to a specific region Clicking on the pin displays information on the case study
All case studies for the selected region are listed in this table
CGIAR Program Results Dashboard
Reporting Indicators
Progress towards System Level Outcomes (SLOs)
4
SLO SDG
28
SDG
Program Platform
Partner Institutions
2016 2017 2018
Fish ndash Stage 3 Innovations
Innovation by Stage
9
Innovation Innovation Type
Base populations established for new breeding program of Catla and Silver carps established (Bangladesh) Genetics
Genetic assessment of juvenile rearing methods of Rohu carp (2 Journal articles[1]) Genetics
New knowledge on sex determining genes feed efficiency and resilience in tilapia (journal articles) Genetics
Genomic databases for rohu catla and silver carps Bangladesh) Genetics
Dissemination plans for improved tilapia dissemination prepared with national partners in Cambodia and Myanmar (Practice notes Working papers) Genetics
Clicking on a specific program innovation stage filters rows of the Innovations table accordingly
FISH
Heat map now based on number of innovations per region
Innovation by StageCGIAR Program Results Dashboard
29
SDG
Program Platform
Partner Institutions
2016 2017 2018
CCAFS ndash Peer-reviewed Papers
Journal Paper Journal Open Access ISI
Complete Genome Sequence of Rice hoja blanca tenuivirus Isolated from a Susceptible Rice Cultivar in Colombia Theoretical and Applied Genetics
Common Bean Genomes Mining New Knowledge of a Major Societal Crop Field Crops Research
Breeding implications of drought stress under future climate for upland rice in Brazil Agriculture Ecosystems and Environment
Landscape context does not constrain biological control of Phenacoccus manihoti in intensified cassava systems of southern Vietnam
Agronomy for Sustainable Development
Peer-reviewed Papers
0 10 20 30
FISH
FTA
LIVESTOCK
MAIZE
RICE
RTB
WHEAT
GLDC
A4NH
CCAFS
PIM
WLE
GENEBANK
EiB
BIG DATA
CRP
PTF
Clicking on a specific program filters information on the page accordingly
135
135
CCAFS ndash Social AttentionTop 10 publications by Altmetric score
Publication Score Date View on Altmetric
Natural climate solutions 810 16-10-17 Details page URL
Farming and the geography of nutrient production for human use a transdisciplinary analysis 191 01-04-17 Details page URL
Linking regional stakeholder scenarios and shared socioeconomic pathways Quantified West African food and climate futures in a global context
126 01-03-17 Details page URL
Agriculture production as a major driver of the Earth system exceeding planetary boundaries 107 12-10-17 Details page URL
10 best bet innovations for adaptation in agriculture A supplement to the UNFCCC NAP Technical Guidelines 48 02-11-17 Details page URL
Greenhouse gas emissions from agricultural food production to supply Indian diets Implications for climate change mitigation 40 01-01-17 Details page URL
Special issue on climate-smart agriculture (CSA) 34 13-05-17 Details page URL
lsquoCSA-Planrsquo strategies to put Climate-Smart Agriculture (CSA) into practice 27 06-06-17 Details page URL
Clicking on the link takes the user to the
Altmetric page from which the article can be
accessed
Peer-reviewed PapersCGIAR Program Results Dashboard
Clicking here allows to view a specific program page accordingly
30
5
Policies
6
Innovation by Stage Peer-reviewed Papers
1918
Partnerships
34
Outcome Case StudiesCase Study Title CRP
Describing the rice production context in Latin America policy briefs on rice to the FLAR member countries
RICE
15
Progress Towards Milestones
Flagship Project 1Mapped and contributing to Sub-IDO
2022 CRP outcomes (from proposal)
MilestoneAssessment of risk to achievement (LMH)
Milestone 11 Increased capacity for innovation in partner research organizations
Foresight analyses and priority setting used by RICE and partner scientists to develop and target technology options
Application of the rice monitoring system for national food security program in Cambodia supporting Thailand disaster relief program for rice farmers crop insurance implementation in Tamil Nadu India Cambodia and Mekong River Delta Vietnam and development of remote sensing based rice monitoring system for Bihar India
L support from national partners
Milestone 12 Improved capacity of women and young people to participate in decision-making
Improved role in decision making by women and youth in rice value chains as evidenced by empowerment measures at key action sites
Gender-youth business models in rice value chain reinforced through better understanding of changing roles on decision making of women and youth in rice farming
M Dependence on support from national partners and governments
Flagship project 1 Accelerating impact and equity
Budget by Window of Funding
Filter by Program Year and Flagship
2018
Reporting Indicators
CRP Staffing
Clicking on any indicator will provide the details available in the table below
Link to Program Information on cgiarorgLinkRICE
CGIAR Program Results Dashboard
31
SECTION 3 PROCESSES
32
31 - Program Performance Management Standards (component 9)
The opportunity to strengthen incentives for high-quality program performance management and provide greater assurance to the SMB and System Council
The ideasbull Adoption of a limited set of program
performance standards for each business cycle in response to the challenges of performance assessment inherent in the variety complexity technical specificity and timelines of the research programs
bull Minimum standards required would change be raised over successive business cycles
bull Specific standards to be agreed with Funders CRPsCenters and SMB
bull Would complement and build on other elements of framework ndash egevaluation
32
Minimum standardsexamples of possible measures for Cycle 1 Rationale assumptions Examples of
measurement optionsReliabilityCredibilityProgram governance structures provide an effective challenge and verification function for management prioritization of research including consideration of future scenarios
Program governance (eg steering committees) should provide an effective specialist technical critique and challenge for prioritization decisions
Evaluation of structures and processes based on agreed quality criteria Qualitative passfail
Relevance and DeliveryEffectivenessgt80 of the Programrsquos projects document a clear and credible impact pathway with a clear product and delivery pathway in mind (appropriate to stage of maturity of research)
Written impact pathways are one good way to check a clear lsquooutcome focusrsquo as well as whether the assumptions are credible
Verification of a random sample of projects with W1W2 funding or co-funding based on agreed quality criteria
Delivery Effectiveness and ReputationLegitimacyKey research project documents for each program are available electronically on a central MIS system or another system accessible by central system advisory bodies (covering gt80 of total research budget)
Availability of project documents is a lsquoboring but importantrsquo necessary step for internal assessments of aspects such as impact pathways (above)
Availability of documents checked
ReputationLegitimacyProgram has processes or contracts in place to ensure appropriate ethical approval for all projects [IRB is primary responsibility of Centers]
Ethical approval processes (IRB) are an important part of ensuring ethical work with human subjects
Evaluation of processes and a sample of decisions based on agreed criteria Qualitative passfail
SECTION 3 PROCESSES
33
The 5 points Description
1 Adopt A multi-year pledging process for W1 amp W2 ndash with multi-year pledging at CRPplatform (and flagship where desired) level
A central objective of business plan is to increase the share of multi-annual pledges and to translate these into multi-annual pledges at the CRPplatform level ndash transforming the level of forward predictability for the shared science agenda through W1 ampW2
2 Revise Use of W1 to change the internal hydraulics
De-link W1 from W2 in terms of its ex post ldquoshock absorbingrdquo within each financial year but continue to link W1 to W2 to support the rebalancing of funding ex ante at the start of the multi--year funding period based on W2 forward pledgescommitments
3 Clarify Approach to allocation within and between cycles
Clarification of between and within business-cycle approaches alongside adoption of a funding target-setting approach to guide funding decisions over the remaining time in the current portfolio
4 Efficiency Optimal funding received to manage down transaction costs
Re-concentrate funding in large pooled programs and decrease number of small W3bilateral projects
5 Recovery Full overhead costs of projects
Adoption of collective System Council ambition to cover minimum overhead costs requested by Centers
PROCESSES
The opportunity By resolving long-standing challenges in CGIARrsquos financing system this can build the needed confidence in CGIAR financing so that reliability percentage share and absolute level of overall and system financing can be maintained and even increased
Sub-section 32A 5-point plan to improve System funding modalities
SECTION 3 PROCESSES
34
32 - Point 3 - Clarify Approach to allocation within and between cycles
Between business cycles During each 3-year business cyclePotential reset of starting point in funding across system Fundamental reconsideration of balance of funding between key focus areasprogram themes based on the list of prioritization criteria set out in the Council Paper on an allocation strategy referenced above
Tool simulation tool that aligns potential programs with broader strategic SLOhigher level outcomes potentially also collecting and presenting relevant available information on strategic fit and performance
Overall output of process Program-level W12 funding targets for subsequent business cycle period
Methodology Annual review of funding targets and W1 forward allocations to take into account any exceptional changes -particularly changes in strategic considerations such as a changing risk context (eg new pestdisease) or a potential new funding opportunity
SECTION 3 PROCESSES
Starting premiseThe budgeting process leading to the CRPPlatforms funding request as presented to the System Council in September 2016 was sufficiently robust and detailed to guide funding allocations for the remaining 3-year period of CRPsplatforms
Concept for initial 2019-2021 Business PlanFunding and program planning would be substantiated bybull A 3-year indicative workplan underpinning the
Business Plan and subjected to potential alterations resulting from the breeding initiative or other potential modifications to the current Portfolio
bull Detailed annual programmatic planning through the existing workplan and budgeting process
Key recognitionThe budgeting process for the implementation periods from 2022 needs to learn and evolve from that undertaken in 2015
35
32 - Point 3 - Portfolio Budgets Allocation baseline
Budget by expense category
Funding Plan
SECTION 3 PROCESSES
36
32 - Point 3 - A starting point for ldquobaseline funding targetsrdquo for 2019-2021 Business Plan (Note subject to potential revision for final draft Plan)
W1amp2 proposed budget ($USm original proposals) 2019 2020 2021 Total BaseGrain Legumes and Dryland Cereals 121 127 133 381Fish 74 78 82 233Forests Trees and Agroforestry 120 125 131 377Livestock 223 235 246 704Maize 125 131 138 394Rice 171 175 179 524Roots Tubers and Bananas 243 253 263 760Wheat 165 174 182 521Agriculture 4 Nutrition and Health 218 227 238 683Climate Change Agriculture and Food Security 232 243 255 730Policies Institutions and Markets 194 194 200 587Water Land and Ecosystems 110 116 122 348Genebanks 188 153 132 472Excellence in Breeding 22 23 24 70Big Data 52 45 43 139
Total Portfolio Base Budget 2258 2299 2368 6923
hellipThus - the September 2016 submitted budgets would form the starting point of discussions with the SMB and System Council on the funding targets for the 2019-2021 period as informed by any updated program platform information and any new elements or key changes to the Portfolio
SECTION 3 PROCESSES
A possible goal of the initial 2019-2021 business plan is to explore appropriate incentives to reduce the number of projects that are less than $200K by [X ndash for discussion and agreement]
37
32 - Point 4 - Efficiency Optimal funding received to manage down transaction costs
Ave Annual Grant 2012 2013 2014 2015 2016gt1m 167 182 205 225 212 500k - 999k 175 183 202 224 214 200k - 499k 424 466 454 457 463 lt200k 1674 1570 1280 1356 1398 Total no of projects 2440 2401 2141 2262 2287
Centers continue to manage a large number of restricted W3 and bilateral projects
0
200
400
600
800
1000
1200
2011 2012 2013 2014 2015 2016 2017(est)
Sources of Revenue $million
Bilateral amp other CGIAR Fund W3
0
500
1000
1500
2000
2500
3000
2012 2013 2014 2015 2016
No of W3 and Bilateral Projects
gt1m 500k - 999k 200k - 499k lt200k
2012 2013 2014 2015 2016 -
200
400
600
800
1000
1200
Total Annual Grants Pledged $million
gt1m 500k - 999k 200k - 499k lt200k
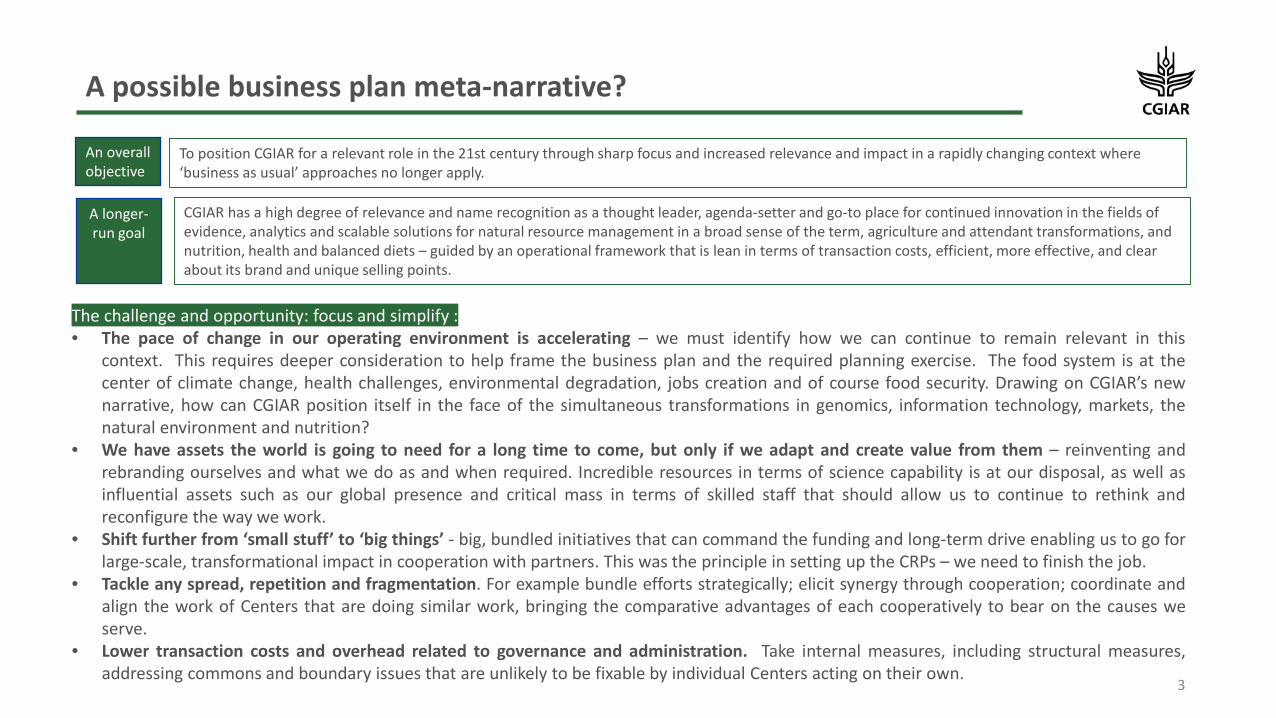

SECTION 1 STRATEGY SECTION 2 STRUCTURE SECTION 3 PROCESSES SECTION 4 REWARDS SECTION 5 PEOPLE
8
Improving Strategizing and Planning
The opportunityFor CGIAR to adopt a forward-leaningstrategizing and planning process to the2030 SDG lsquomilestone momentrsquo ndashfacilitating constant innovation andproactive change management to headoff problems before they requireldquobig-bangrdquo reforms The acceleratingpace of change in CGIARrsquos operatingenvironment demands this
The ideas
11 Defining a planning landscape to 2030
12 Optimizing the current Portfolio
13 Planning for financial viability
Section 1 ndash Strategy
More detail
Slides 9 - 12
Slide 13
Slide 14 - 15
SECTION 1 STRATEGY
9
Sub-section 11Defining a planning landscape to 2030
STRATEGY
SECTION 1 STRATEGY
The opportunityA key date is 2030 ndash the reconciliation moment in terms of progress against the global SDGs It is also the moment that our Strategy and Results Framework (ldquoSRFrdquo) ends As an anchor date to our forward thinking it therefore seems like a good target date for our planning processes
The ideasFirst the SRF as a broad expression of our overall research strategy and goals ndash running to 2030
Second a CGIAR ldquo2030 Planrdquo that sets out a new round of programming for the 2022-2030 period framed in terms of CGIARrsquos planned contribution to meeting the SDGs The Plan would cover three business cycles This would cover much of the strategic content of current CRPPlatform submissions filling a critical gap in terms of providing clear institutional strategies on key areas and a vision around CGIARrsquos niche and theories of change ndash but would stop short of detailed activity and budgeting plans ndash these would be covered and renewed periodically in successive 3-year business plans Key questions for the 2030 Plan could include whetherhow to re-frame CGIARrsquos objectives and reporting in terms of SDGs what could be the longer-term institutional objectives to 2030 What should be the major lsquoprogramming themesrsquo in the plan ndash and how closely could these relate to the SDGs How could the CGIAR research program modality be further improved Eg Comprehensive or not Larger or smaller Frameworks or programs Role of W12 as now or more narrowly focused How to improve the process Built in flexibility to respond to changing circumstances or fixed over business plan period
Third 3-year CGIAR System Business Plans These would align all key elements into a well-managed cycle (see slide below) Three year program implementation plans in support of the 2030 research themes would be presented from Business Plan 2 which taken collectively are the backbone of the 3-year business plan Key advantages of a 3-year cycle include it fits best with CGIARrsquos funderrsquos typical multi-year approval cycles ndash only a few extend beyond 3 years with those longer funding cycles still welcomed and not requiring shortening it enables a more nimble Portfolio ndash 3 yearly adjustments but based on longer-run program themes in the 2030 Plan to ensure more stability 3 years is short enough to allow for deeper reprogramming and reallocations if required every 3 years simultaneously providing for more within-period stability and space for researchers to focus on implementation a 3-year cycle is typical for multilateral organizations (eg IFAD IDA)
Fourth an annual cycle that has as its focus an SMB submission to November System Council meetings recommending any changes to budgets andor CRP annual programming plans
Center-level planning cycles are foundational Centers have the opportunity to explore any scope of alignment with the 3-year business plans andor the 2030 Plan 10
11 Defining a planning landscape to 2030 - 4 layers
SECTION 1 STRATEGY
11
11 Aligning with the Sustainable Development Goals (SDGs)
The opportunity To align System goals and reporting to the SDGs and improve the quality of measurement of CGIARrsquos contribution to the SDG targets
The ideas
bull In a lsquo2030 Planrsquo CGIAR could reformulate goals and high-level theories of change to align with SDG targets
bull Improve measurement of the CGIAR contribution to SDGs building on ongoing analysis commissioned by ISPC
bull Use of SDG metrics in CGIAR impact assessments
bull Improve the rate of yield increase for major food staples from current lt20 to 25year
bull 150 million more people 50 of them women meeting minimum dietary energy requirements
bull 500 million more people 50 of them women without deficiencies of one or more of the following essential micronutrients iron zinc iodine vitamin A folate and vitamin B12
bull 33 reduction in women of reproductive age who are consuming less than the adequate number of food groups
CGIARSTRATEGIC GOALS
2030 TARGETS AS STATED IN CGIARrsquoS 2016-2030 STRATEGY AND RESULTS FRAMEWORK
bull 350 million more farm households have adopted improved varieties breeds or trees andor improved management practice
bull 100 million people 50 of them women assisted in exiting poverty
bull 20 increase in water and nutrient (inorganic biological) use efficiency in agro-ecosystems including through recycling and reuse
bull Reduce agriculture related greenhouse gas emissions bybull 8 Gt CO2-e yrndash1 (15) compared with a business-as-usual
scenario in 2030bull 190 million hectares (ha) degraded land area restoredbull 5 million ha of forest saved from deforestation
SECTION 1 STRATEGY
12
Key element Preparatory year (2018) Year 1 (2019) Year 2 (2020) Year 3 (2021)1 Business planning
processInitial 3-year (2019-22) business plan prepared and approved by November 2018
Launch implementation of business plan
Initiate planning and scoping for next business cycle
Finalization and initial green-light of 2022-24 business cycle at May SC meeting November SC -agree new 3-year business plan for next cycle
2 Getting to 2030 ndashSDGs CGIAR SRF
SC General Assembly and SMB reflections on case for a lsquo2030 Planrsquo
2030 Plan preparation including planning for check-in moments
May System Council ndash 2030 Plan approval Relevant implementation actions
3 Evaluation Agree a CGIAR evaluation plan over 3-year cycle ndash bringing in visibility of all evaluation work undertaken in System
Carrying out planned evaluations by Centers System other stakeholders
Completion of planned evaluations ndash with main evaluation inputs received by end of year 2
Completion of planned evaluations by end of year 3 and agree next 3-year workplan as part of new business plan
4 Reporting Pilot lsquoCGIAR Annual performance reportrsquo concept on 2017
Annual performance report on 2018 Annual performance report on 2019 Annual performance report on 2020 ndash to include a meta-level assessment of progress towards CGIARrsquos System Level Outcomes + SDGs over cycle
5 Impact Assessment (past research)
Align funding and work plan for SPIA to 3-year business planning cycle
Capacity strengthening in impact assessment + one major cross-cutting thematic review
Lessons learned from SPIA + 1 or 2 major impact assessments of past research to inform broader conversation on CGIARrsquos role
Preparation of next cycle of impact assessment support to Centersprograms
6 Foresight Foresight event aligned to SC November 2018
Year 2 ndash major foresight publicationscience event to help to frame strategic focus of next 3-year research cycle
Potential specific foresight questions to address if specially requested by SC
7 Research programming
For first cycle continue with 2017-2021 Portfolio (amended and improved as appropriate) 3-year indicative Program Plans prepared as basis for Business Plan
Relevant updates to 2019-2021 indicative 3-year Programs Plans
[ Second cycle 2022-2024ndash launch updatednew research themesprograms]
Guided by the lsquo2030 Planrsquo commission development of next round of rolling program implementation plans + set criteria for independent reviewRelevant updates to 2019-2021 indicative 3-year Programs Plans
Independent review of planned next cycle of research + November System Council decision on a new round of 2022-2024 3-year implementation plans towards the lsquo2030 Planrsquo research themesprograms
8 Funding Collective multi-year pledging process (total amounts + at CRPPlatform level)
Annual contributions (and annual pledging for relevant funders)
Annual contributions (and annual pledging for relevant funders)
Multi-year pledging process (total amounts + at CRP level)
9 System Council Funder membership
Possible reconsideration of the timing for considering Funder seating
End of year 2 - reconciliation of last 3-year Funder seating based on contributions
10 Budgeting Prepare 3-year Financing Plan for the System and seek agreement on new funding modalities
Forward looking annual budget review for 2020-2021
Forward looking annual budget review for 2021 November SC - Agree next 3-year programs + platforms + System entities forward indicative budgets
11 Advocacy + communications
System Council++ event Annual theme XX (eg climate) Annual theme XX (eg foresight theme) Annual theme XX (eg progress towards SDG targets)
11 Defining a planning landscape to 2030 - 3-year business plan concept
Interpretation note Slide aims to share the anticipated level of detail in the initial 3-year business plan
Does not seek to cover all elements that would be included
SECTION 1 STRATEGY
13
Topic Challenge1 Breeding Enhance CGIARrsquos key breeding programs in capacity and
the means to capitalize with global suppliers (of inputs including knowledge management) and enter into effective dissemination pathways ndash through the multi-Funder initiative to enhance crop breeding programs
2 Fall Armyworm More strategically target the threat to food security nutrition and livelihoods posed by Fall Armyworm through coordinated action across CGIAR
3 Private sector engagement
Seize opportunities to harness the full potential of our partnerships ndash skills capacity approach and scale
4 Gender in research
Clearly articulate CGIARrsquos approach through adoption of a clear plan on Gender in Research better integration of gender in performance management system
5 Climate change A system-wide institutional strategy on our work on climate change could help underpin CGIARrsquos success and funding on this increasingly urgent and dominant issue
6 Addressing hidden hunger
With a first focus on a cross-Center approach to developing a CGIAR-wide biofortification strategy covering key substantive and institutional issues
7 Anti-microbial resistance
To set out an ambitious contribution of CGIAR to tackle anti-microbial resistance
8 CGIARrsquos genebanks
Address a strategic gap in CGIARrsquos Strategy and Results Framework regarding CGIARrsquos genebanks
Opportunities to improve and clarify in some areas
bull The first 3-year business plan would aim to continue the current portfolio but address various gaps in institutional strategy
bull New areas or tasks may be included in the Portfolio over the business plan period
To note Modalities were set out in document SC5-07 (November 2017 SC meeting) on managing CRP revisions including the process for adding new flagships or major expansions in scope to a flagship
bull A possible additional criteria for entry into the Portfolio during the business cycle would be the requirement for meeting a minimum ISPC rating
bull One implication of a 3 year business plan implementation period would be that the next cycle of programs and platforms would start in 2022 hence the existing CRPs Platforms would be implemented for 5 not 6 years
STRATEGY
To note
Sub-section 12Optimizing the current Portfolio
SECTION 1 STRATEGY
CENTER 2014 2015 20162017 (EST)
AfricaRice 0 -11 -9 -18
IWMI 3 -15 -6 -13
World Fish 2 -2 -5 0
CIFOR -5 -13 -15 -11
Bioversity 0 -2 4 -2
ICARDA -3 -1 0 -2
CIP 3 -5 -2 0 gt 10 deficit
ICRAF 2 -2 -3 -2 5-10 deficit
ICRISAT 3 -4 12 -3 gt0 but lt5 deficit
IRRI -1 -1 -4 -5 0 or surplus
ILRI 1 3 -1 -2
CIAT 4 1 0 -4
IITA 1 1 -1 1
IFPRI 1 0 0 0
CIMMYT 3 2 -1 2
14
STRATEGY
Note Centers ranked by 2017 Center estimated revenue
The issue main driver of recurring net losses appears to be a steep decline in W12 funding since 2014which has reduced overall revenue to Centers and made them rely more heavily on W3 and bilateralprojects that provide insufficient indirect cost recovery (noting cost recovery is covered in more depth onslide 38)
Sub-section 13Planning for financial viability
SECTION 1 STRATEGY
15
STRATEGYThe opportunity A vision for how CGIAR as a partnership of Centers could shift on to a sustainable longer term financial path
Sub-section 13Planning for financial viability
Successful implementation of key elements in each theme in this Business Plan concept would help to strengthen financial performance for example
1 Strategy - improved overall reputation and strategic focus of CGIAR driving maintained and even increased overall funding including at W3 level
2 Structure - further cooperation and alliances between Centers to drive up efficiencies and value for money alongside further planned efforts by individual Center levels to restructure to align costs with revenue
3 Processes ndash the 5-point plan to improve system funding modalities alongside greater assurance on risk management and program performance
4 Rewards ndash a well-mobilized collective funder engagement5 People ndash a well motivated and talented workforce
SECTION 1 STRATEGY SECTION 2 STRUCTURE SECTION 3 PROCESSES SECTION 4 REWARDS SECTION 5 PEOPLE
16
Focusing on reducing fragmentation driving efficiency and increasing value for money
The contextbull From slide 2 above the first of the twin goals of the proposed first CGIAR
business plan is to modernize and improve todayrsquos CGIAR recognizing that doing the same thing in the same way as we have been doing cannot adequately leverage CGIARrsquos capabilities in what is an increasingly changing environment - both in terms of
- Exponential technological institutional and social change and - In the operating context of multiple new stakeholders entering what is
a progressively competitive space for agricultural research for development
bull To set itself up for successful implementation of successive business plans CGIAR will quickly address several structuralinstitutional andor operational barriers that create unnecessary (and inevitably costly) fragmentation in our work
bull Some initiatives are well underway in their strategic planning (eg the multi-Funder initiative on breeding and the System Councilrsquos rethinking of the role of its advisory services thus impacting the role that such bodies will play in the forthcoming business cycle) Others are at a more experimental stage of consideration and will require more analysis to take forward
Section 2 ndash Structure
Image source ndash selected extracts from presentation of John Hagel co-chairman for Deloitte LLPs Center for the Edge titled lsquoInstitutional Innovationrsquo 16 February 2015
Institutional Innovation is about
SECTION 2 STRUCTURE
The opportunityBuilding on the 2016 CGIAR reform andintensive interactions across Centers inpreparation of the business plan it isintended that it will elaborate concretepathways and measures during the 3-yearimplementation period bringing essentialsynergies to the institutional arrangementsthrough which we work
17
Section 2 ndash Structure
The ideas
21 Deeper System-wide cooperation and alignment
22 Enhancing CGIAR assets and response preparedness
23 Strengthened collaboration with delivery partners
More detail
Slides 18-19
Slide 20
Slide 21
Catalyzing institutional innovation
SECTION 2 STRUCTURE
18
STRUCTURE
Sub-section 21Deeper System-wide cooperation and alignment
Theme Potential details for inclusion in the initial 3-year business plan
Enhanced Center alliances to harness synergies
Space to reflect on any progress in ongoing discussions between several Centers on deeper alliances the increase cooperation and alignment to harness synergies accelerate impact and drive efficiencies Will depend on any voluntary actions taken by Centers ndash and not mandated within any Business Plan period Center inputs to date suggest that such actions could potentially include i) any scope for deeper institutional ties between compatible Centers ii) any scope for common Board membershipBoard leadership between compatible Centers iii) any scope for system-wide efforts between Centers to move to a more structured plan of having some level of common Board membersBoard leadership
New shared services to achieve improved institutional efficiency
Shared services not only allow the achievement of institutional cost savings but also institutional efficiencies thereby providing value for money in staff time Centers are proposing to identify a selected set of key areas where they can utilize economies of scale to deliver substantial staff time andor cost savings Scoping work across the 2018 calendar year will identify potential areas for implementation ndash potentially including purchasing efficiencies a common policy nomenclature framework and storage system to facilitate strengthened cross-System best practices sharing and learning andor financial systems further alignment
Modernizing and increasing research data availability
Identify ways to further leverage Big Data capabilities and transform the agricultural R4D sector building on the innovations being introduced through the lsquoGlobal Agricultural Research Data Innovation amp Acceleration Networkrsquo (lsquoGARDIAN toolrsquo) as showcased on the page that follows
Efficiencies in Advisory services
(Led by System Council)
As set out System Council meeting paper SC6-06 SIMEC Think-piece on the future of CGIARrsquos advisory bodies CGIARrsquos Funders have identified the opportunity to (i) improved efficiency (ii) improved communication between the services and the System (iii) improved and systematic linkages between science and development (iv) higher ownership of the advice produced by the services by the System (v) while also ensuring independence of the content-matter of the advice
SECTION 2 STRUCTURE
The opportunityThrough the BigData platform lsquoGARDIANrsquo initiative for CGIAR to be seen as global leader in providing findable accessible interoperable and reusable (lsquoFAIRrsquo) data and publications by year by Center by country and research theme in a seamless and open way
19
21 Deeper System-wide cooperation and alignment Modernizing and increasing research data availability
The ideas1 Incentivize the sharing of high quality interoperable datasets
over progressive business plan cycles (almost 100000 publications and over 2100 datasets are already discoverable but great potential exists) CGIAR Program Performance Management Standards (described below ndash slide 32) can help support this
2 Develop rate analytics and visualization functionalities to facilitate innovative and actionable solutions from the agricultural data generated by CGIAR and its partners
SECTION 2 STRUCTURE
20
Sub-section 22Enhancing CGIAR assets and response preparedness
STRUCTURE
The opportunityLearning from the experience in Fall Armyworm more effectively demonstrate and further build CGIARrsquos ability to respond rapidly to emerging crises such as pests and epidemics ndashwith a focus on ensuring that we have the right systems aligned to be able to contribute to global discussions and follow up in a coordinated way
Initial ideasbull Identifying capacity from within the
System to act as a clearly identifiable coordination point internally and externally (eg appoint Special Envoys dedicated portals for information dissemination etc)
bull Exploration of optimum and efficient responsive funding arrangements for emerging crises such as new pests and diseases
SECTION 2 STRUCTURE
The opportunity
Increasing the reach and impact of CGIAR research activities CGIAR is dependent on partnerships for getting its research disseminated and scaled for development impact Through a more strategic alignment with delivery partners CGIAR research and innovation will have a greater adoption reach and ultimately impact
The ideas
bull Private Sector collaboration Private sector has a significant role to play not only as an upstream partner in providing access to advanced technology and specialized expertise but also as a downstream partner in providing access to markets and enabling the scaling -up and out of our research outputs
bull Country collaboration Through a Country Collaboration approach CGIAR can catalyze the development of a collective CGIAR role and impact scenario in countries in which CGIAR has a significant presence based on meaningful synergies across CGIAR entities National Governments National Systems and other partners to develop strategies and deliver programs directly aligned to key country priorities This can create an enabling environment for other partnerships and delivery initiatives
bull A CGIAR Rome Hub Increasing contribution and relevance of CGIAR in the crossroads of the global food security dialogue and with the major impact delivery partners based on Rome A consolidated CGIAR premises with capacity from Centers and CRPs SMO successors to ISPC SPIA and IEA Internal Audit Function and flex space for visiting Center staffDGs
bull MDB cooperation Establishing structures and potential mechanism(s) for CGIAR knowledge innovation and tools to contribute to design baseline implementation MampE of major development programs in the multilateral development banks
21
23 Strengthened collaboration with delivery partners
The below image is a possible collaboration maturity model where collaboration efforts in particular Countries could be represented in terms of particular stages at a given time and be used to establish collaboration aspirations and activities in those Countries
SECTION 1 STRATEGY SECTION 2 STRUCTURE SECTION 3 PROCESSES SECTION 4 REWARDS SECTION 5 PEOPLE
22
Defining and improving
The opportunity
For CGIAR to be more effectiveand efficient in the delivery ofits programs and systems anddemonstrate this in a morecompelling way to furtherstrengthen trust and supportFeatured in this section are aselection of key processesrequiring strengthening
Selected ideas
31 A program performance management framework
32 A 5-point plan to improve System funding modalities
33 A 4-point plan for an aligned assurance system
Section 3 ndash Processes
More detail
Slides 23-32
Slides 33-38
Slides 39-40
SECTION 3 PROCESSES
23
PROCESSES
Sub-section 31A program performance management framework
The opportunityTo set out an approach to program performance management that is credible and can drive improvements over time ndash providing assurance to key stakeholders
Mechanisms to achieve goal
bull Strengthening reporting and learning from outputs and outcomes of past research
bull Improving management of current program performance
bull Developing components to improve decision-making about future research funding
SECTION 3 PROCESSES
24
31 A program performance management framework
12 Framework Components
Past results reporting1 CGIAR Annual Performance Report2 CRPsPlatform reporting
requirements 3 Common results reporting indicators4 Outcome and impact case studies5 Program Results Dashboard6 Past Evaluations7 Impact Assessments
Present improved management8 Within-cycle reviews and evaluations9 Program Performance
Management Standards
Future improved decision-making10 Quality at Entry Assessment11 Planning landscape12 Allocation criteria and tool
SECTION 3 PROCESSES
The opportunity To pilot a new approach to annual reporting to improve accountability and give confidence to Funders and key supporting partners by (i) a more focused looking-back at achievements from completed research (ii) reflecting on the current CGIAR research portfolio and (iii) reviewing progress and plans for continued improvements in performance
Timelinebull In 2018 the annual report will be published at the end of September The planning and reporting cycle is later than
usual due to new systems being implementedbull Planning and reporting cycles will be revised in 2019 so that the publication will be finalized earlier in the year
25
31 - Annual CGIAR Performance Report a new approach (component 1)
The 2018 report under preparationbull Aims to interest a critical (non-researcher) audience that is
looking for serious discussion of issues and evidencebull Represent a range of voices from across CGIAR and partnersbull Demonstrate progress towards CGIAR goals (SRF) while
reflecting on the approaches and partnerships that promote impact
bull Reflect on the value added of CGIAR Research Programs and Platforms working in Research Centers to deliver results
bull Reflect on how funding has been able to support system goalsbull Incorporate available results from the new reporting systems (to
be introduced in late 2018)
Building on 2018 reports for 2019 and beyond will also incorporatebull New program results dashboard Highlights from the interactive
CGIAR dashboard capturing research innovations outcomes and impacts
It will report and reflect on progress towards CGIARs goals tobull Modernize improve and stabilizebull Provide an enabling environment to improve quality and deliver
impactbull Build an efficient system with reduced transaction costsbull Strengthen and diversify funding (new collaborations initiatives)
to enable a longer-term funding basebull Attract retain and build the highest quality staff
2018 Introducing new reporting approach 2019 harmonization with new CGIAR Business Plan Cycle
SECTION 3 PROCESSES
Selected ideas bull Deliver data interoperability and consolidation from
multiple source systems (including lsquoGARDIANrsquo tool discussed earlier on slide 19) with data interfacing and storage on a central database
bull The on-line results reporting system will be used going forward to streamline the creation of the Annual CGIAR Performance Report
bull The dashboard mockup on the following slides provides visualization ideas aligned with current operational CGIAR Results Reporting guidance
26
31 - A new CGIAR Program Results Dashboard (component 5)
The opportunityThrough making use of modern visualization technology CGIAR will be able to provide real-time program information to Funders partners and other stakeholders via wwwcgiarorg
Filtering will be possible by programplatform by year by outcomeimpact on the ground (by country) and by innovation stage
SDG
Find information by
Program Platform
Partner Institutions
2016 2017 2018
22
Policies
231
Innovation by Stage Peer-reviewed Papers
1918
Partnerships
475 1555
Trainees
Financials
Budget Allocation by CRPPTF
CRP Funding Update
This selection allows filtering of all elements of the page by year
On the home page the heat map indicates the number of evidences by region
5 reporting indicators are highlighted on the home page By clicking on an indicator the user navigates to a more detailed page on innovations policies etc
All pages of the dashboard contain links to search information related to
SDGs CRPs and partners
CGIAR Program Results DashboardProgress towards
System Level Outcomes (SLOs)
Reporting Indicators
28
SLO SDGThe distribution of evidences can be displayed by SLO or by SDG
North AfricaProgress towards SLO 4 evidences reportedOutcome case studies 10 case studies reportedPolicies 5 policies enactedInnovation by stage 10 in stage 4Partnership 50 partners work with usParticipants 15000 people involved in our activitiesTrainees 150 people trainedPeer-reviewed papers 193 in ISI journals
By hovering over a region a window displays key information that is geographically tagged By
clicking on the region the user navigates to the next page
27
SDG
Find information by
Program Platform
Partner Institutions
2016 2017 2018
3
Policies
23
Innovation by Stage Peer-reviewed Papers
1918
Partnerships
41 123
Trainees
Outcome Case Studies
Case Study Title CRPPTF
Adoption of citizen science methodology shapes new linkages between researchers and farmers for climate adaptation
CCAFS
De Brauw 2016 showed that biofortified OFSP varieties have disseminated to an estimated 289M households in 12 SSA countries (125 grams per day meets the daily vitamin A requirement of a child under five)
RTB
CIMMYT FAO and the World Bank found in Kazakhstan that spring wheat yields are as much as 58 higher under (widely-adopted) zero tillage introduced by WHEAT than with conventional technologies
WHEAT
RTB - 2017Western AfricaAdoption of citizen science methodology shapes new linkages between researchers and farmers for climate adaptationSLO Target 21 Improve the rate of yield increase for major food staples from current lt1 to 12-15 per yearIDOSub-IDO 132 Increased livelihood opportunitiesA14 Enhanced capacity to deal with climatic risks and extremesCross-cutting Gender Youth
Outcome Impact on the Ground
This page displays outcome case studies related to a specific region Clicking on the pin displays information on the case study
All case studies for the selected region are listed in this table
CGIAR Program Results Dashboard
Reporting Indicators
Progress towards System Level Outcomes (SLOs)
4
SLO SDG
28
SDG
Program Platform
Partner Institutions
2016 2017 2018
Fish ndash Stage 3 Innovations
Innovation by Stage
9
Innovation Innovation Type
Base populations established for new breeding program of Catla and Silver carps established (Bangladesh) Genetics
Genetic assessment of juvenile rearing methods of Rohu carp (2 Journal articles[1]) Genetics
New knowledge on sex determining genes feed efficiency and resilience in tilapia (journal articles) Genetics
Genomic databases for rohu catla and silver carps Bangladesh) Genetics
Dissemination plans for improved tilapia dissemination prepared with national partners in Cambodia and Myanmar (Practice notes Working papers) Genetics
Clicking on a specific program innovation stage filters rows of the Innovations table accordingly
FISH
Heat map now based on number of innovations per region
Innovation by StageCGIAR Program Results Dashboard
29
SDG
Program Platform
Partner Institutions
2016 2017 2018
CCAFS ndash Peer-reviewed Papers
Journal Paper Journal Open Access ISI
Complete Genome Sequence of Rice hoja blanca tenuivirus Isolated from a Susceptible Rice Cultivar in Colombia Theoretical and Applied Genetics
Common Bean Genomes Mining New Knowledge of a Major Societal Crop Field Crops Research
Breeding implications of drought stress under future climate for upland rice in Brazil Agriculture Ecosystems and Environment
Landscape context does not constrain biological control of Phenacoccus manihoti in intensified cassava systems of southern Vietnam
Agronomy for Sustainable Development
Peer-reviewed Papers
0 10 20 30
FISH
FTA
LIVESTOCK
MAIZE
RICE
RTB
WHEAT
GLDC
A4NH
CCAFS
PIM
WLE
GENEBANK
EiB
BIG DATA
CRP
PTF
Clicking on a specific program filters information on the page accordingly
135
135
CCAFS ndash Social AttentionTop 10 publications by Altmetric score
Publication Score Date View on Altmetric
Natural climate solutions 810 16-10-17 Details page URL
Farming and the geography of nutrient production for human use a transdisciplinary analysis 191 01-04-17 Details page URL
Linking regional stakeholder scenarios and shared socioeconomic pathways Quantified West African food and climate futures in a global context
126 01-03-17 Details page URL
Agriculture production as a major driver of the Earth system exceeding planetary boundaries 107 12-10-17 Details page URL
10 best bet innovations for adaptation in agriculture A supplement to the UNFCCC NAP Technical Guidelines 48 02-11-17 Details page URL
Greenhouse gas emissions from agricultural food production to supply Indian diets Implications for climate change mitigation 40 01-01-17 Details page URL
Special issue on climate-smart agriculture (CSA) 34 13-05-17 Details page URL
lsquoCSA-Planrsquo strategies to put Climate-Smart Agriculture (CSA) into practice 27 06-06-17 Details page URL
Clicking on the link takes the user to the
Altmetric page from which the article can be
accessed
Peer-reviewed PapersCGIAR Program Results Dashboard
Clicking here allows to view a specific program page accordingly
30
5
Policies
6
Innovation by Stage Peer-reviewed Papers
1918
Partnerships
34
Outcome Case StudiesCase Study Title CRP
Describing the rice production context in Latin America policy briefs on rice to the FLAR member countries
RICE
15
Progress Towards Milestones
Flagship Project 1Mapped and contributing to Sub-IDO
2022 CRP outcomes (from proposal)
MilestoneAssessment of risk to achievement (LMH)
Milestone 11 Increased capacity for innovation in partner research organizations
Foresight analyses and priority setting used by RICE and partner scientists to develop and target technology options
Application of the rice monitoring system for national food security program in Cambodia supporting Thailand disaster relief program for rice farmers crop insurance implementation in Tamil Nadu India Cambodia and Mekong River Delta Vietnam and development of remote sensing based rice monitoring system for Bihar India
L support from national partners
Milestone 12 Improved capacity of women and young people to participate in decision-making
Improved role in decision making by women and youth in rice value chains as evidenced by empowerment measures at key action sites
Gender-youth business models in rice value chain reinforced through better understanding of changing roles on decision making of women and youth in rice farming
M Dependence on support from national partners and governments
Flagship project 1 Accelerating impact and equity
Budget by Window of Funding
Filter by Program Year and Flagship
2018
Reporting Indicators
CRP Staffing
Clicking on any indicator will provide the details available in the table below
Link to Program Information on cgiarorgLinkRICE
CGIAR Program Results Dashboard
31
SECTION 3 PROCESSES
32
31 - Program Performance Management Standards (component 9)
The opportunity to strengthen incentives for high-quality program performance management and provide greater assurance to the SMB and System Council
The ideasbull Adoption of a limited set of program
performance standards for each business cycle in response to the challenges of performance assessment inherent in the variety complexity technical specificity and timelines of the research programs
bull Minimum standards required would change be raised over successive business cycles
bull Specific standards to be agreed with Funders CRPsCenters and SMB
bull Would complement and build on other elements of framework ndash egevaluation
32
Minimum standardsexamples of possible measures for Cycle 1 Rationale assumptions Examples of
measurement optionsReliabilityCredibilityProgram governance structures provide an effective challenge and verification function for management prioritization of research including consideration of future scenarios
Program governance (eg steering committees) should provide an effective specialist technical critique and challenge for prioritization decisions
Evaluation of structures and processes based on agreed quality criteria Qualitative passfail
Relevance and DeliveryEffectivenessgt80 of the Programrsquos projects document a clear and credible impact pathway with a clear product and delivery pathway in mind (appropriate to stage of maturity of research)
Written impact pathways are one good way to check a clear lsquooutcome focusrsquo as well as whether the assumptions are credible
Verification of a random sample of projects with W1W2 funding or co-funding based on agreed quality criteria
Delivery Effectiveness and ReputationLegitimacyKey research project documents for each program are available electronically on a central MIS system or another system accessible by central system advisory bodies (covering gt80 of total research budget)
Availability of project documents is a lsquoboring but importantrsquo necessary step for internal assessments of aspects such as impact pathways (above)
Availability of documents checked
ReputationLegitimacyProgram has processes or contracts in place to ensure appropriate ethical approval for all projects [IRB is primary responsibility of Centers]
Ethical approval processes (IRB) are an important part of ensuring ethical work with human subjects
Evaluation of processes and a sample of decisions based on agreed criteria Qualitative passfail
SECTION 3 PROCESSES
33
The 5 points Description
1 Adopt A multi-year pledging process for W1 amp W2 ndash with multi-year pledging at CRPplatform (and flagship where desired) level
A central objective of business plan is to increase the share of multi-annual pledges and to translate these into multi-annual pledges at the CRPplatform level ndash transforming the level of forward predictability for the shared science agenda through W1 ampW2
2 Revise Use of W1 to change the internal hydraulics
De-link W1 from W2 in terms of its ex post ldquoshock absorbingrdquo within each financial year but continue to link W1 to W2 to support the rebalancing of funding ex ante at the start of the multi--year funding period based on W2 forward pledgescommitments
3 Clarify Approach to allocation within and between cycles
Clarification of between and within business-cycle approaches alongside adoption of a funding target-setting approach to guide funding decisions over the remaining time in the current portfolio
4 Efficiency Optimal funding received to manage down transaction costs
Re-concentrate funding in large pooled programs and decrease number of small W3bilateral projects
5 Recovery Full overhead costs of projects
Adoption of collective System Council ambition to cover minimum overhead costs requested by Centers
PROCESSES
The opportunity By resolving long-standing challenges in CGIARrsquos financing system this can build the needed confidence in CGIAR financing so that reliability percentage share and absolute level of overall and system financing can be maintained and even increased
Sub-section 32A 5-point plan to improve System funding modalities
SECTION 3 PROCESSES
34
32 - Point 3 - Clarify Approach to allocation within and between cycles
Between business cycles During each 3-year business cyclePotential reset of starting point in funding across system Fundamental reconsideration of balance of funding between key focus areasprogram themes based on the list of prioritization criteria set out in the Council Paper on an allocation strategy referenced above
Tool simulation tool that aligns potential programs with broader strategic SLOhigher level outcomes potentially also collecting and presenting relevant available information on strategic fit and performance
Overall output of process Program-level W12 funding targets for subsequent business cycle period
Methodology Annual review of funding targets and W1 forward allocations to take into account any exceptional changes -particularly changes in strategic considerations such as a changing risk context (eg new pestdisease) or a potential new funding opportunity
SECTION 3 PROCESSES
Starting premiseThe budgeting process leading to the CRPPlatforms funding request as presented to the System Council in September 2016 was sufficiently robust and detailed to guide funding allocations for the remaining 3-year period of CRPsplatforms
Concept for initial 2019-2021 Business PlanFunding and program planning would be substantiated bybull A 3-year indicative workplan underpinning the
Business Plan and subjected to potential alterations resulting from the breeding initiative or other potential modifications to the current Portfolio
bull Detailed annual programmatic planning through the existing workplan and budgeting process
Key recognitionThe budgeting process for the implementation periods from 2022 needs to learn and evolve from that undertaken in 2015
35
32 - Point 3 - Portfolio Budgets Allocation baseline
Budget by expense category
Funding Plan
SECTION 3 PROCESSES
36
32 - Point 3 - A starting point for ldquobaseline funding targetsrdquo for 2019-2021 Business Plan (Note subject to potential revision for final draft Plan)
W1amp2 proposed budget ($USm original proposals) 2019 2020 2021 Total BaseGrain Legumes and Dryland Cereals 121 127 133 381Fish 74 78 82 233Forests Trees and Agroforestry 120 125 131 377Livestock 223 235 246 704Maize 125 131 138 394Rice 171 175 179 524Roots Tubers and Bananas 243 253 263 760Wheat 165 174 182 521Agriculture 4 Nutrition and Health 218 227 238 683Climate Change Agriculture and Food Security 232 243 255 730Policies Institutions and Markets 194 194 200 587Water Land and Ecosystems 110 116 122 348Genebanks 188 153 132 472Excellence in Breeding 22 23 24 70Big Data 52 45 43 139
Total Portfolio Base Budget 2258 2299 2368 6923
hellipThus - the September 2016 submitted budgets would form the starting point of discussions with the SMB and System Council on the funding targets for the 2019-2021 period as informed by any updated program platform information and any new elements or key changes to the Portfolio
SECTION 3 PROCESSES
A possible goal of the initial 2019-2021 business plan is to explore appropriate incentives to reduce the number of projects that are less than $200K by [X ndash for discussion and agreement]
37
32 - Point 4 - Efficiency Optimal funding received to manage down transaction costs
Ave Annual Grant 2012 2013 2014 2015 2016gt1m 167 182 205 225 212 500k - 999k 175 183 202 224 214 200k - 499k 424 466 454 457 463 lt200k 1674 1570 1280 1356 1398 Total no of projects 2440 2401 2141 2262 2287
Centers continue to manage a large number of restricted W3 and bilateral projects
0
200
400
600
800
1000
1200
2011 2012 2013 2014 2015 2016 2017(est)
Sources of Revenue $million
Bilateral amp other CGIAR Fund W3
0
500
1000
1500
2000
2500
3000
2012 2013 2014 2015 2016
No of W3 and Bilateral Projects
gt1m 500k - 999k 200k - 499k lt200k
2012 2013 2014 2015 2016 -
200
400
600
800
1000
1200
Total Annual Grants Pledged $million
gt1m 500k - 999k 200k - 499k lt200k
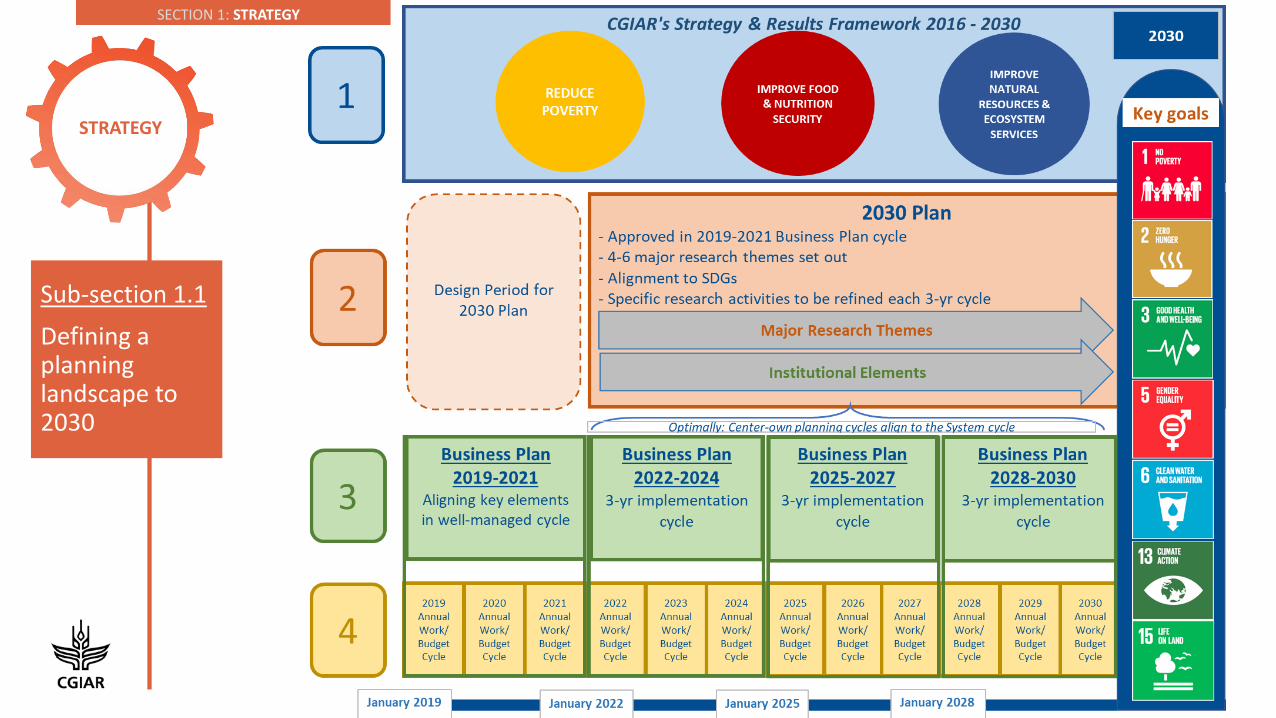
SECTION 1 STRATEGY
9
Sub-section 11Defining a planning landscape to 2030
STRATEGY
SECTION 1 STRATEGY
The opportunityA key date is 2030 ndash the reconciliation moment in terms of progress against the global SDGs It is also the moment that our Strategy and Results Framework (ldquoSRFrdquo) ends As an anchor date to our forward thinking it therefore seems like a good target date for our planning processes
The ideasFirst the SRF as a broad expression of our overall research strategy and goals ndash running to 2030
Second a CGIAR ldquo2030 Planrdquo that sets out a new round of programming for the 2022-2030 period framed in terms of CGIARrsquos planned contribution to meeting the SDGs The Plan would cover three business cycles This would cover much of the strategic content of current CRPPlatform submissions filling a critical gap in terms of providing clear institutional strategies on key areas and a vision around CGIARrsquos niche and theories of change ndash but would stop short of detailed activity and budgeting plans ndash these would be covered and renewed periodically in successive 3-year business plans Key questions for the 2030 Plan could include whetherhow to re-frame CGIARrsquos objectives and reporting in terms of SDGs what could be the longer-term institutional objectives to 2030 What should be the major lsquoprogramming themesrsquo in the plan ndash and how closely could these relate to the SDGs How could the CGIAR research program modality be further improved Eg Comprehensive or not Larger or smaller Frameworks or programs Role of W12 as now or more narrowly focused How to improve the process Built in flexibility to respond to changing circumstances or fixed over business plan period
Third 3-year CGIAR System Business Plans These would align all key elements into a well-managed cycle (see slide below) Three year program implementation plans in support of the 2030 research themes would be presented from Business Plan 2 which taken collectively are the backbone of the 3-year business plan Key advantages of a 3-year cycle include it fits best with CGIARrsquos funderrsquos typical multi-year approval cycles ndash only a few extend beyond 3 years with those longer funding cycles still welcomed and not requiring shortening it enables a more nimble Portfolio ndash 3 yearly adjustments but based on longer-run program themes in the 2030 Plan to ensure more stability 3 years is short enough to allow for deeper reprogramming and reallocations if required every 3 years simultaneously providing for more within-period stability and space for researchers to focus on implementation a 3-year cycle is typical for multilateral organizations (eg IFAD IDA)
Fourth an annual cycle that has as its focus an SMB submission to November System Council meetings recommending any changes to budgets andor CRP annual programming plans
Center-level planning cycles are foundational Centers have the opportunity to explore any scope of alignment with the 3-year business plans andor the 2030 Plan 10
11 Defining a planning landscape to 2030 - 4 layers
SECTION 1 STRATEGY
11
11 Aligning with the Sustainable Development Goals (SDGs)
The opportunity To align System goals and reporting to the SDGs and improve the quality of measurement of CGIARrsquos contribution to the SDG targets
The ideas
bull In a lsquo2030 Planrsquo CGIAR could reformulate goals and high-level theories of change to align with SDG targets
bull Improve measurement of the CGIAR contribution to SDGs building on ongoing analysis commissioned by ISPC
bull Use of SDG metrics in CGIAR impact assessments
bull Improve the rate of yield increase for major food staples from current lt20 to 25year
bull 150 million more people 50 of them women meeting minimum dietary energy requirements
bull 500 million more people 50 of them women without deficiencies of one or more of the following essential micronutrients iron zinc iodine vitamin A folate and vitamin B12
bull 33 reduction in women of reproductive age who are consuming less than the adequate number of food groups
CGIARSTRATEGIC GOALS
2030 TARGETS AS STATED IN CGIARrsquoS 2016-2030 STRATEGY AND RESULTS FRAMEWORK
bull 350 million more farm households have adopted improved varieties breeds or trees andor improved management practice
bull 100 million people 50 of them women assisted in exiting poverty
bull 20 increase in water and nutrient (inorganic biological) use efficiency in agro-ecosystems including through recycling and reuse
bull Reduce agriculture related greenhouse gas emissions bybull 8 Gt CO2-e yrndash1 (15) compared with a business-as-usual
scenario in 2030bull 190 million hectares (ha) degraded land area restoredbull 5 million ha of forest saved from deforestation
SECTION 1 STRATEGY
12
Key element Preparatory year (2018) Year 1 (2019) Year 2 (2020) Year 3 (2021)1 Business planning
processInitial 3-year (2019-22) business plan prepared and approved by November 2018
Launch implementation of business plan
Initiate planning and scoping for next business cycle
Finalization and initial green-light of 2022-24 business cycle at May SC meeting November SC -agree new 3-year business plan for next cycle
2 Getting to 2030 ndashSDGs CGIAR SRF
SC General Assembly and SMB reflections on case for a lsquo2030 Planrsquo
2030 Plan preparation including planning for check-in moments
May System Council ndash 2030 Plan approval Relevant implementation actions
3 Evaluation Agree a CGIAR evaluation plan over 3-year cycle ndash bringing in visibility of all evaluation work undertaken in System
Carrying out planned evaluations by Centers System other stakeholders
Completion of planned evaluations ndash with main evaluation inputs received by end of year 2
Completion of planned evaluations by end of year 3 and agree next 3-year workplan as part of new business plan
4 Reporting Pilot lsquoCGIAR Annual performance reportrsquo concept on 2017
Annual performance report on 2018 Annual performance report on 2019 Annual performance report on 2020 ndash to include a meta-level assessment of progress towards CGIARrsquos System Level Outcomes + SDGs over cycle
5 Impact Assessment (past research)
Align funding and work plan for SPIA to 3-year business planning cycle
Capacity strengthening in impact assessment + one major cross-cutting thematic review
Lessons learned from SPIA + 1 or 2 major impact assessments of past research to inform broader conversation on CGIARrsquos role
Preparation of next cycle of impact assessment support to Centersprograms
6 Foresight Foresight event aligned to SC November 2018
Year 2 ndash major foresight publicationscience event to help to frame strategic focus of next 3-year research cycle
Potential specific foresight questions to address if specially requested by SC
7 Research programming
For first cycle continue with 2017-2021 Portfolio (amended and improved as appropriate) 3-year indicative Program Plans prepared as basis for Business Plan
Relevant updates to 2019-2021 indicative 3-year Programs Plans
[ Second cycle 2022-2024ndash launch updatednew research themesprograms]
Guided by the lsquo2030 Planrsquo commission development of next round of rolling program implementation plans + set criteria for independent reviewRelevant updates to 2019-2021 indicative 3-year Programs Plans
Independent review of planned next cycle of research + November System Council decision on a new round of 2022-2024 3-year implementation plans towards the lsquo2030 Planrsquo research themesprograms
8 Funding Collective multi-year pledging process (total amounts + at CRPPlatform level)
Annual contributions (and annual pledging for relevant funders)
Annual contributions (and annual pledging for relevant funders)
Multi-year pledging process (total amounts + at CRP level)
9 System Council Funder membership
Possible reconsideration of the timing for considering Funder seating
End of year 2 - reconciliation of last 3-year Funder seating based on contributions
10 Budgeting Prepare 3-year Financing Plan for the System and seek agreement on new funding modalities
Forward looking annual budget review for 2020-2021
Forward looking annual budget review for 2021 November SC - Agree next 3-year programs + platforms + System entities forward indicative budgets
11 Advocacy + communications
System Council++ event Annual theme XX (eg climate) Annual theme XX (eg foresight theme) Annual theme XX (eg progress towards SDG targets)
11 Defining a planning landscape to 2030 - 3-year business plan concept
Interpretation note Slide aims to share the anticipated level of detail in the initial 3-year business plan
Does not seek to cover all elements that would be included
SECTION 1 STRATEGY
13
Topic Challenge1 Breeding Enhance CGIARrsquos key breeding programs in capacity and
the means to capitalize with global suppliers (of inputs including knowledge management) and enter into effective dissemination pathways ndash through the multi-Funder initiative to enhance crop breeding programs
2 Fall Armyworm More strategically target the threat to food security nutrition and livelihoods posed by Fall Armyworm through coordinated action across CGIAR
3 Private sector engagement
Seize opportunities to harness the full potential of our partnerships ndash skills capacity approach and scale
4 Gender in research
Clearly articulate CGIARrsquos approach through adoption of a clear plan on Gender in Research better integration of gender in performance management system
5 Climate change A system-wide institutional strategy on our work on climate change could help underpin CGIARrsquos success and funding on this increasingly urgent and dominant issue
6 Addressing hidden hunger
With a first focus on a cross-Center approach to developing a CGIAR-wide biofortification strategy covering key substantive and institutional issues
7 Anti-microbial resistance
To set out an ambitious contribution of CGIAR to tackle anti-microbial resistance
8 CGIARrsquos genebanks
Address a strategic gap in CGIARrsquos Strategy and Results Framework regarding CGIARrsquos genebanks
Opportunities to improve and clarify in some areas
bull The first 3-year business plan would aim to continue the current portfolio but address various gaps in institutional strategy
bull New areas or tasks may be included in the Portfolio over the business plan period
To note Modalities were set out in document SC5-07 (November 2017 SC meeting) on managing CRP revisions including the process for adding new flagships or major expansions in scope to a flagship
bull A possible additional criteria for entry into the Portfolio during the business cycle would be the requirement for meeting a minimum ISPC rating
bull One implication of a 3 year business plan implementation period would be that the next cycle of programs and platforms would start in 2022 hence the existing CRPs Platforms would be implemented for 5 not 6 years
STRATEGY
To note
Sub-section 12Optimizing the current Portfolio
SECTION 1 STRATEGY
CENTER 2014 2015 20162017 (EST)
AfricaRice 0 -11 -9 -18
IWMI 3 -15 -6 -13
World Fish 2 -2 -5 0
CIFOR -5 -13 -15 -11
Bioversity 0 -2 4 -2
ICARDA -3 -1 0 -2
CIP 3 -5 -2 0 gt 10 deficit
ICRAF 2 -2 -3 -2 5-10 deficit
ICRISAT 3 -4 12 -3 gt0 but lt5 deficit
IRRI -1 -1 -4 -5 0 or surplus
ILRI 1 3 -1 -2
CIAT 4 1 0 -4
IITA 1 1 -1 1
IFPRI 1 0 0 0
CIMMYT 3 2 -1 2
14
STRATEGY
Note Centers ranked by 2017 Center estimated revenue
The issue main driver of recurring net losses appears to be a steep decline in W12 funding since 2014which has reduced overall revenue to Centers and made them rely more heavily on W3 and bilateralprojects that provide insufficient indirect cost recovery (noting cost recovery is covered in more depth onslide 38)
Sub-section 13Planning for financial viability
SECTION 1 STRATEGY
15
STRATEGYThe opportunity A vision for how CGIAR as a partnership of Centers could shift on to a sustainable longer term financial path
Sub-section 13Planning for financial viability
Successful implementation of key elements in each theme in this Business Plan concept would help to strengthen financial performance for example
1 Strategy - improved overall reputation and strategic focus of CGIAR driving maintained and even increased overall funding including at W3 level
2 Structure - further cooperation and alliances between Centers to drive up efficiencies and value for money alongside further planned efforts by individual Center levels to restructure to align costs with revenue
3 Processes ndash the 5-point plan to improve system funding modalities alongside greater assurance on risk management and program performance
4 Rewards ndash a well-mobilized collective funder engagement5 People ndash a well motivated and talented workforce
SECTION 1 STRATEGY SECTION 2 STRUCTURE SECTION 3 PROCESSES SECTION 4 REWARDS SECTION 5 PEOPLE
16
Focusing on reducing fragmentation driving efficiency and increasing value for money
The contextbull From slide 2 above the first of the twin goals of the proposed first CGIAR
business plan is to modernize and improve todayrsquos CGIAR recognizing that doing the same thing in the same way as we have been doing cannot adequately leverage CGIARrsquos capabilities in what is an increasingly changing environment - both in terms of
- Exponential technological institutional and social change and - In the operating context of multiple new stakeholders entering what is
a progressively competitive space for agricultural research for development
bull To set itself up for successful implementation of successive business plans CGIAR will quickly address several structuralinstitutional andor operational barriers that create unnecessary (and inevitably costly) fragmentation in our work
bull Some initiatives are well underway in their strategic planning (eg the multi-Funder initiative on breeding and the System Councilrsquos rethinking of the role of its advisory services thus impacting the role that such bodies will play in the forthcoming business cycle) Others are at a more experimental stage of consideration and will require more analysis to take forward
Section 2 ndash Structure
Image source ndash selected extracts from presentation of John Hagel co-chairman for Deloitte LLPs Center for the Edge titled lsquoInstitutional Innovationrsquo 16 February 2015
Institutional Innovation is about
SECTION 2 STRUCTURE
The opportunityBuilding on the 2016 CGIAR reform andintensive interactions across Centers inpreparation of the business plan it isintended that it will elaborate concretepathways and measures during the 3-yearimplementation period bringing essentialsynergies to the institutional arrangementsthrough which we work
17
Section 2 ndash Structure
The ideas
21 Deeper System-wide cooperation and alignment
22 Enhancing CGIAR assets and response preparedness
23 Strengthened collaboration with delivery partners
More detail
Slides 18-19
Slide 20
Slide 21
Catalyzing institutional innovation
SECTION 2 STRUCTURE
18
STRUCTURE
Sub-section 21Deeper System-wide cooperation and alignment
Theme Potential details for inclusion in the initial 3-year business plan
Enhanced Center alliances to harness synergies
Space to reflect on any progress in ongoing discussions between several Centers on deeper alliances the increase cooperation and alignment to harness synergies accelerate impact and drive efficiencies Will depend on any voluntary actions taken by Centers ndash and not mandated within any Business Plan period Center inputs to date suggest that such actions could potentially include i) any scope for deeper institutional ties between compatible Centers ii) any scope for common Board membershipBoard leadership between compatible Centers iii) any scope for system-wide efforts between Centers to move to a more structured plan of having some level of common Board membersBoard leadership
New shared services to achieve improved institutional efficiency
Shared services not only allow the achievement of institutional cost savings but also institutional efficiencies thereby providing value for money in staff time Centers are proposing to identify a selected set of key areas where they can utilize economies of scale to deliver substantial staff time andor cost savings Scoping work across the 2018 calendar year will identify potential areas for implementation ndash potentially including purchasing efficiencies a common policy nomenclature framework and storage system to facilitate strengthened cross-System best practices sharing and learning andor financial systems further alignment
Modernizing and increasing research data availability
Identify ways to further leverage Big Data capabilities and transform the agricultural R4D sector building on the innovations being introduced through the lsquoGlobal Agricultural Research Data Innovation amp Acceleration Networkrsquo (lsquoGARDIAN toolrsquo) as showcased on the page that follows
Efficiencies in Advisory services
(Led by System Council)
As set out System Council meeting paper SC6-06 SIMEC Think-piece on the future of CGIARrsquos advisory bodies CGIARrsquos Funders have identified the opportunity to (i) improved efficiency (ii) improved communication between the services and the System (iii) improved and systematic linkages between science and development (iv) higher ownership of the advice produced by the services by the System (v) while also ensuring independence of the content-matter of the advice
SECTION 2 STRUCTURE
The opportunityThrough the BigData platform lsquoGARDIANrsquo initiative for CGIAR to be seen as global leader in providing findable accessible interoperable and reusable (lsquoFAIRrsquo) data and publications by year by Center by country and research theme in a seamless and open way
19
21 Deeper System-wide cooperation and alignment Modernizing and increasing research data availability
The ideas1 Incentivize the sharing of high quality interoperable datasets
over progressive business plan cycles (almost 100000 publications and over 2100 datasets are already discoverable but great potential exists) CGIAR Program Performance Management Standards (described below ndash slide 32) can help support this
2 Develop rate analytics and visualization functionalities to facilitate innovative and actionable solutions from the agricultural data generated by CGIAR and its partners
SECTION 2 STRUCTURE
20
Sub-section 22Enhancing CGIAR assets and response preparedness
STRUCTURE
The opportunityLearning from the experience in Fall Armyworm more effectively demonstrate and further build CGIARrsquos ability to respond rapidly to emerging crises such as pests and epidemics ndashwith a focus on ensuring that we have the right systems aligned to be able to contribute to global discussions and follow up in a coordinated way
Initial ideasbull Identifying capacity from within the
System to act as a clearly identifiable coordination point internally and externally (eg appoint Special Envoys dedicated portals for information dissemination etc)
bull Exploration of optimum and efficient responsive funding arrangements for emerging crises such as new pests and diseases
SECTION 2 STRUCTURE
The opportunity
Increasing the reach and impact of CGIAR research activities CGIAR is dependent on partnerships for getting its research disseminated and scaled for development impact Through a more strategic alignment with delivery partners CGIAR research and innovation will have a greater adoption reach and ultimately impact
The ideas
bull Private Sector collaboration Private sector has a significant role to play not only as an upstream partner in providing access to advanced technology and specialized expertise but also as a downstream partner in providing access to markets and enabling the scaling -up and out of our research outputs
bull Country collaboration Through a Country Collaboration approach CGIAR can catalyze the development of a collective CGIAR role and impact scenario in countries in which CGIAR has a significant presence based on meaningful synergies across CGIAR entities National Governments National Systems and other partners to develop strategies and deliver programs directly aligned to key country priorities This can create an enabling environment for other partnerships and delivery initiatives
bull A CGIAR Rome Hub Increasing contribution and relevance of CGIAR in the crossroads of the global food security dialogue and with the major impact delivery partners based on Rome A consolidated CGIAR premises with capacity from Centers and CRPs SMO successors to ISPC SPIA and IEA Internal Audit Function and flex space for visiting Center staffDGs
bull MDB cooperation Establishing structures and potential mechanism(s) for CGIAR knowledge innovation and tools to contribute to design baseline implementation MampE of major development programs in the multilateral development banks
21
23 Strengthened collaboration with delivery partners
The below image is a possible collaboration maturity model where collaboration efforts in particular Countries could be represented in terms of particular stages at a given time and be used to establish collaboration aspirations and activities in those Countries
SECTION 1 STRATEGY SECTION 2 STRUCTURE SECTION 3 PROCESSES SECTION 4 REWARDS SECTION 5 PEOPLE
22
Defining and improving
The opportunity
For CGIAR to be more effectiveand efficient in the delivery ofits programs and systems anddemonstrate this in a morecompelling way to furtherstrengthen trust and supportFeatured in this section are aselection of key processesrequiring strengthening
Selected ideas
31 A program performance management framework
32 A 5-point plan to improve System funding modalities
33 A 4-point plan for an aligned assurance system
Section 3 ndash Processes
More detail
Slides 23-32
Slides 33-38
Slides 39-40
SECTION 3 PROCESSES
23
PROCESSES
Sub-section 31A program performance management framework
The opportunityTo set out an approach to program performance management that is credible and can drive improvements over time ndash providing assurance to key stakeholders
Mechanisms to achieve goal
bull Strengthening reporting and learning from outputs and outcomes of past research
bull Improving management of current program performance
bull Developing components to improve decision-making about future research funding
SECTION 3 PROCESSES
24
31 A program performance management framework
12 Framework Components
Past results reporting1 CGIAR Annual Performance Report2 CRPsPlatform reporting
requirements 3 Common results reporting indicators4 Outcome and impact case studies5 Program Results Dashboard6 Past Evaluations7 Impact Assessments
Present improved management8 Within-cycle reviews and evaluations9 Program Performance
Management Standards
Future improved decision-making10 Quality at Entry Assessment11 Planning landscape12 Allocation criteria and tool
SECTION 3 PROCESSES
The opportunity To pilot a new approach to annual reporting to improve accountability and give confidence to Funders and key supporting partners by (i) a more focused looking-back at achievements from completed research (ii) reflecting on the current CGIAR research portfolio and (iii) reviewing progress and plans for continued improvements in performance
Timelinebull In 2018 the annual report will be published at the end of September The planning and reporting cycle is later than
usual due to new systems being implementedbull Planning and reporting cycles will be revised in 2019 so that the publication will be finalized earlier in the year
25
31 - Annual CGIAR Performance Report a new approach (component 1)
The 2018 report under preparationbull Aims to interest a critical (non-researcher) audience that is
looking for serious discussion of issues and evidencebull Represent a range of voices from across CGIAR and partnersbull Demonstrate progress towards CGIAR goals (SRF) while
reflecting on the approaches and partnerships that promote impact
bull Reflect on the value added of CGIAR Research Programs and Platforms working in Research Centers to deliver results
bull Reflect on how funding has been able to support system goalsbull Incorporate available results from the new reporting systems (to
be introduced in late 2018)
Building on 2018 reports for 2019 and beyond will also incorporatebull New program results dashboard Highlights from the interactive
CGIAR dashboard capturing research innovations outcomes and impacts
It will report and reflect on progress towards CGIARs goals tobull Modernize improve and stabilizebull Provide an enabling environment to improve quality and deliver
impactbull Build an efficient system with reduced transaction costsbull Strengthen and diversify funding (new collaborations initiatives)
to enable a longer-term funding basebull Attract retain and build the highest quality staff
2018 Introducing new reporting approach 2019 harmonization with new CGIAR Business Plan Cycle
SECTION 3 PROCESSES
Selected ideas bull Deliver data interoperability and consolidation from
multiple source systems (including lsquoGARDIANrsquo tool discussed earlier on slide 19) with data interfacing and storage on a central database
bull The on-line results reporting system will be used going forward to streamline the creation of the Annual CGIAR Performance Report
bull The dashboard mockup on the following slides provides visualization ideas aligned with current operational CGIAR Results Reporting guidance
26
31 - A new CGIAR Program Results Dashboard (component 5)
The opportunityThrough making use of modern visualization technology CGIAR will be able to provide real-time program information to Funders partners and other stakeholders via wwwcgiarorg
Filtering will be possible by programplatform by year by outcomeimpact on the ground (by country) and by innovation stage
SDG
Find information by
Program Platform
Partner Institutions
2016 2017 2018
22
Policies
231
Innovation by Stage Peer-reviewed Papers
1918
Partnerships
475 1555
Trainees
Financials
Budget Allocation by CRPPTF
CRP Funding Update
This selection allows filtering of all elements of the page by year
On the home page the heat map indicates the number of evidences by region
5 reporting indicators are highlighted on the home page By clicking on an indicator the user navigates to a more detailed page on innovations policies etc
All pages of the dashboard contain links to search information related to
SDGs CRPs and partners
CGIAR Program Results DashboardProgress towards
System Level Outcomes (SLOs)
Reporting Indicators
28
SLO SDGThe distribution of evidences can be displayed by SLO or by SDG
North AfricaProgress towards SLO 4 evidences reportedOutcome case studies 10 case studies reportedPolicies 5 policies enactedInnovation by stage 10 in stage 4Partnership 50 partners work with usParticipants 15000 people involved in our activitiesTrainees 150 people trainedPeer-reviewed papers 193 in ISI journals
By hovering over a region a window displays key information that is geographically tagged By
clicking on the region the user navigates to the next page
27
SDG
Find information by
Program Platform
Partner Institutions
2016 2017 2018
3
Policies
23
Innovation by Stage Peer-reviewed Papers
1918
Partnerships
41 123
Trainees
Outcome Case Studies
Case Study Title CRPPTF
Adoption of citizen science methodology shapes new linkages between researchers and farmers for climate adaptation
CCAFS
De Brauw 2016 showed that biofortified OFSP varieties have disseminated to an estimated 289M households in 12 SSA countries (125 grams per day meets the daily vitamin A requirement of a child under five)
RTB
CIMMYT FAO and the World Bank found in Kazakhstan that spring wheat yields are as much as 58 higher under (widely-adopted) zero tillage introduced by WHEAT than with conventional technologies
WHEAT
RTB - 2017Western AfricaAdoption of citizen science methodology shapes new linkages between researchers and farmers for climate adaptationSLO Target 21 Improve the rate of yield increase for major food staples from current lt1 to 12-15 per yearIDOSub-IDO 132 Increased livelihood opportunitiesA14 Enhanced capacity to deal with climatic risks and extremesCross-cutting Gender Youth
Outcome Impact on the Ground
This page displays outcome case studies related to a specific region Clicking on the pin displays information on the case study
All case studies for the selected region are listed in this table
CGIAR Program Results Dashboard
Reporting Indicators
Progress towards System Level Outcomes (SLOs)
4
SLO SDG
28
SDG
Program Platform
Partner Institutions
2016 2017 2018
Fish ndash Stage 3 Innovations
Innovation by Stage
9
Innovation Innovation Type
Base populations established for new breeding program of Catla and Silver carps established (Bangladesh) Genetics
Genetic assessment of juvenile rearing methods of Rohu carp (2 Journal articles[1]) Genetics
New knowledge on sex determining genes feed efficiency and resilience in tilapia (journal articles) Genetics
Genomic databases for rohu catla and silver carps Bangladesh) Genetics
Dissemination plans for improved tilapia dissemination prepared with national partners in Cambodia and Myanmar (Practice notes Working papers) Genetics
Clicking on a specific program innovation stage filters rows of the Innovations table accordingly
FISH
Heat map now based on number of innovations per region
Innovation by StageCGIAR Program Results Dashboard
29
SDG
Program Platform
Partner Institutions
2016 2017 2018
CCAFS ndash Peer-reviewed Papers
Journal Paper Journal Open Access ISI
Complete Genome Sequence of Rice hoja blanca tenuivirus Isolated from a Susceptible Rice Cultivar in Colombia Theoretical and Applied Genetics
Common Bean Genomes Mining New Knowledge of a Major Societal Crop Field Crops Research
Breeding implications of drought stress under future climate for upland rice in Brazil Agriculture Ecosystems and Environment
Landscape context does not constrain biological control of Phenacoccus manihoti in intensified cassava systems of southern Vietnam
Agronomy for Sustainable Development
Peer-reviewed Papers
0 10 20 30
FISH
FTA
LIVESTOCK
MAIZE
RICE
RTB
WHEAT
GLDC
A4NH
CCAFS
PIM
WLE
GENEBANK
EiB
BIG DATA
CRP
PTF
Clicking on a specific program filters information on the page accordingly
135
135
CCAFS ndash Social AttentionTop 10 publications by Altmetric score
Publication Score Date View on Altmetric
Natural climate solutions 810 16-10-17 Details page URL
Farming and the geography of nutrient production for human use a transdisciplinary analysis 191 01-04-17 Details page URL
Linking regional stakeholder scenarios and shared socioeconomic pathways Quantified West African food and climate futures in a global context
126 01-03-17 Details page URL
Agriculture production as a major driver of the Earth system exceeding planetary boundaries 107 12-10-17 Details page URL
10 best bet innovations for adaptation in agriculture A supplement to the UNFCCC NAP Technical Guidelines 48 02-11-17 Details page URL
Greenhouse gas emissions from agricultural food production to supply Indian diets Implications for climate change mitigation 40 01-01-17 Details page URL
Special issue on climate-smart agriculture (CSA) 34 13-05-17 Details page URL
lsquoCSA-Planrsquo strategies to put Climate-Smart Agriculture (CSA) into practice 27 06-06-17 Details page URL
Clicking on the link takes the user to the
Altmetric page from which the article can be
accessed
Peer-reviewed PapersCGIAR Program Results Dashboard
Clicking here allows to view a specific program page accordingly
30
5
Policies
6
Innovation by Stage Peer-reviewed Papers
1918
Partnerships
34
Outcome Case StudiesCase Study Title CRP
Describing the rice production context in Latin America policy briefs on rice to the FLAR member countries
RICE
15
Progress Towards Milestones
Flagship Project 1Mapped and contributing to Sub-IDO
2022 CRP outcomes (from proposal)
MilestoneAssessment of risk to achievement (LMH)
Milestone 11 Increased capacity for innovation in partner research organizations
Foresight analyses and priority setting used by RICE and partner scientists to develop and target technology options
Application of the rice monitoring system for national food security program in Cambodia supporting Thailand disaster relief program for rice farmers crop insurance implementation in Tamil Nadu India Cambodia and Mekong River Delta Vietnam and development of remote sensing based rice monitoring system for Bihar India
L support from national partners
Milestone 12 Improved capacity of women and young people to participate in decision-making
Improved role in decision making by women and youth in rice value chains as evidenced by empowerment measures at key action sites
Gender-youth business models in rice value chain reinforced through better understanding of changing roles on decision making of women and youth in rice farming
M Dependence on support from national partners and governments
Flagship project 1 Accelerating impact and equity
Budget by Window of Funding
Filter by Program Year and Flagship
2018
Reporting Indicators
CRP Staffing
Clicking on any indicator will provide the details available in the table below
Link to Program Information on cgiarorgLinkRICE
CGIAR Program Results Dashboard
31
SECTION 3 PROCESSES
32
31 - Program Performance Management Standards (component 9)
The opportunity to strengthen incentives for high-quality program performance management and provide greater assurance to the SMB and System Council
The ideasbull Adoption of a limited set of program
performance standards for each business cycle in response to the challenges of performance assessment inherent in the variety complexity technical specificity and timelines of the research programs
bull Minimum standards required would change be raised over successive business cycles
bull Specific standards to be agreed with Funders CRPsCenters and SMB
bull Would complement and build on other elements of framework ndash egevaluation
32
Minimum standardsexamples of possible measures for Cycle 1 Rationale assumptions Examples of
measurement optionsReliabilityCredibilityProgram governance structures provide an effective challenge and verification function for management prioritization of research including consideration of future scenarios
Program governance (eg steering committees) should provide an effective specialist technical critique and challenge for prioritization decisions
Evaluation of structures and processes based on agreed quality criteria Qualitative passfail
Relevance and DeliveryEffectivenessgt80 of the Programrsquos projects document a clear and credible impact pathway with a clear product and delivery pathway in mind (appropriate to stage of maturity of research)
Written impact pathways are one good way to check a clear lsquooutcome focusrsquo as well as whether the assumptions are credible
Verification of a random sample of projects with W1W2 funding or co-funding based on agreed quality criteria
Delivery Effectiveness and ReputationLegitimacyKey research project documents for each program are available electronically on a central MIS system or another system accessible by central system advisory bodies (covering gt80 of total research budget)
Availability of project documents is a lsquoboring but importantrsquo necessary step for internal assessments of aspects such as impact pathways (above)
Availability of documents checked
ReputationLegitimacyProgram has processes or contracts in place to ensure appropriate ethical approval for all projects [IRB is primary responsibility of Centers]
Ethical approval processes (IRB) are an important part of ensuring ethical work with human subjects
Evaluation of processes and a sample of decisions based on agreed criteria Qualitative passfail
SECTION 3 PROCESSES
33
The 5 points Description
1 Adopt A multi-year pledging process for W1 amp W2 ndash with multi-year pledging at CRPplatform (and flagship where desired) level
A central objective of business plan is to increase the share of multi-annual pledges and to translate these into multi-annual pledges at the CRPplatform level ndash transforming the level of forward predictability for the shared science agenda through W1 ampW2
2 Revise Use of W1 to change the internal hydraulics
De-link W1 from W2 in terms of its ex post ldquoshock absorbingrdquo within each financial year but continue to link W1 to W2 to support the rebalancing of funding ex ante at the start of the multi--year funding period based on W2 forward pledgescommitments
3 Clarify Approach to allocation within and between cycles
Clarification of between and within business-cycle approaches alongside adoption of a funding target-setting approach to guide funding decisions over the remaining time in the current portfolio
4 Efficiency Optimal funding received to manage down transaction costs
Re-concentrate funding in large pooled programs and decrease number of small W3bilateral projects
5 Recovery Full overhead costs of projects
Adoption of collective System Council ambition to cover minimum overhead costs requested by Centers
PROCESSES
The opportunity By resolving long-standing challenges in CGIARrsquos financing system this can build the needed confidence in CGIAR financing so that reliability percentage share and absolute level of overall and system financing can be maintained and even increased
Sub-section 32A 5-point plan to improve System funding modalities
SECTION 3 PROCESSES
34
32 - Point 3 - Clarify Approach to allocation within and between cycles
Between business cycles During each 3-year business cyclePotential reset of starting point in funding across system Fundamental reconsideration of balance of funding between key focus areasprogram themes based on the list of prioritization criteria set out in the Council Paper on an allocation strategy referenced above
Tool simulation tool that aligns potential programs with broader strategic SLOhigher level outcomes potentially also collecting and presenting relevant available information on strategic fit and performance
Overall output of process Program-level W12 funding targets for subsequent business cycle period
Methodology Annual review of funding targets and W1 forward allocations to take into account any exceptional changes -particularly changes in strategic considerations such as a changing risk context (eg new pestdisease) or a potential new funding opportunity
SECTION 3 PROCESSES
Starting premiseThe budgeting process leading to the CRPPlatforms funding request as presented to the System Council in September 2016 was sufficiently robust and detailed to guide funding allocations for the remaining 3-year period of CRPsplatforms
Concept for initial 2019-2021 Business PlanFunding and program planning would be substantiated bybull A 3-year indicative workplan underpinning the
Business Plan and subjected to potential alterations resulting from the breeding initiative or other potential modifications to the current Portfolio
bull Detailed annual programmatic planning through the existing workplan and budgeting process
Key recognitionThe budgeting process for the implementation periods from 2022 needs to learn and evolve from that undertaken in 2015
35
32 - Point 3 - Portfolio Budgets Allocation baseline
Budget by expense category
Funding Plan
SECTION 3 PROCESSES
36
32 - Point 3 - A starting point for ldquobaseline funding targetsrdquo for 2019-2021 Business Plan (Note subject to potential revision for final draft Plan)
W1amp2 proposed budget ($USm original proposals) 2019 2020 2021 Total BaseGrain Legumes and Dryland Cereals 121 127 133 381Fish 74 78 82 233Forests Trees and Agroforestry 120 125 131 377Livestock 223 235 246 704Maize 125 131 138 394Rice 171 175 179 524Roots Tubers and Bananas 243 253 263 760Wheat 165 174 182 521Agriculture 4 Nutrition and Health 218 227 238 683Climate Change Agriculture and Food Security 232 243 255 730Policies Institutions and Markets 194 194 200 587Water Land and Ecosystems 110 116 122 348Genebanks 188 153 132 472Excellence in Breeding 22 23 24 70Big Data 52 45 43 139
Total Portfolio Base Budget 2258 2299 2368 6923
hellipThus - the September 2016 submitted budgets would form the starting point of discussions with the SMB and System Council on the funding targets for the 2019-2021 period as informed by any updated program platform information and any new elements or key changes to the Portfolio
SECTION 3 PROCESSES
A possible goal of the initial 2019-2021 business plan is to explore appropriate incentives to reduce the number of projects that are less than $200K by [X ndash for discussion and agreement]
37
32 - Point 4 - Efficiency Optimal funding received to manage down transaction costs
Ave Annual Grant 2012 2013 2014 2015 2016gt1m 167 182 205 225 212 500k - 999k 175 183 202 224 214 200k - 499k 424 466 454 457 463 lt200k 1674 1570 1280 1356 1398 Total no of projects 2440 2401 2141 2262 2287
Centers continue to manage a large number of restricted W3 and bilateral projects
0
200
400
600
800
1000
1200
2011 2012 2013 2014 2015 2016 2017(est)
Sources of Revenue $million
Bilateral amp other CGIAR Fund W3
0
500
1000
1500
2000
2500
3000
2012 2013 2014 2015 2016
No of W3 and Bilateral Projects
gt1m 500k - 999k 200k - 499k lt200k
2012 2013 2014 2015 2016 -
200
400
600
800
1000
1200
Total Annual Grants Pledged $million
gt1m 500k - 999k 200k - 499k lt200k

SECTION 1 STRATEGY
11
11 Aligning with the Sustainable Development Goals (SDGs)
The opportunity To align System goals and reporting to the SDGs and improve the quality of measurement of CGIARrsquos contribution to the SDG targets
The ideas
bull In a lsquo2030 Planrsquo CGIAR could reformulate goals and high-level theories of change to align with SDG targets
bull Improve measurement of the CGIAR contribution to SDGs building on ongoing analysis commissioned by ISPC
bull Use of SDG metrics in CGIAR impact assessments
bull Improve the rate of yield increase for major food staples from current lt20 to 25year
bull 150 million more people 50 of them women meeting minimum dietary energy requirements
bull 500 million more people 50 of them women without deficiencies of one or more of the following essential micronutrients iron zinc iodine vitamin A folate and vitamin B12
bull 33 reduction in women of reproductive age who are consuming less than the adequate number of food groups
CGIARSTRATEGIC GOALS
2030 TARGETS AS STATED IN CGIARrsquoS 2016-2030 STRATEGY AND RESULTS FRAMEWORK
bull 350 million more farm households have adopted improved varieties breeds or trees andor improved management practice
bull 100 million people 50 of them women assisted in exiting poverty
bull 20 increase in water and nutrient (inorganic biological) use efficiency in agro-ecosystems including through recycling and reuse
bull Reduce agriculture related greenhouse gas emissions bybull 8 Gt CO2-e yrndash1 (15) compared with a business-as-usual
scenario in 2030bull 190 million hectares (ha) degraded land area restoredbull 5 million ha of forest saved from deforestation
SECTION 1 STRATEGY
12
Key element Preparatory year (2018) Year 1 (2019) Year 2 (2020) Year 3 (2021)1 Business planning
processInitial 3-year (2019-22) business plan prepared and approved by November 2018
Launch implementation of business plan
Initiate planning and scoping for next business cycle
Finalization and initial green-light of 2022-24 business cycle at May SC meeting November SC -agree new 3-year business plan for next cycle
2 Getting to 2030 ndashSDGs CGIAR SRF
SC General Assembly and SMB reflections on case for a lsquo2030 Planrsquo
2030 Plan preparation including planning for check-in moments
May System Council ndash 2030 Plan approval Relevant implementation actions
3 Evaluation Agree a CGIAR evaluation plan over 3-year cycle ndash bringing in visibility of all evaluation work undertaken in System
Carrying out planned evaluations by Centers System other stakeholders
Completion of planned evaluations ndash with main evaluation inputs received by end of year 2
Completion of planned evaluations by end of year 3 and agree next 3-year workplan as part of new business plan
4 Reporting Pilot lsquoCGIAR Annual performance reportrsquo concept on 2017
Annual performance report on 2018 Annual performance report on 2019 Annual performance report on 2020 ndash to include a meta-level assessment of progress towards CGIARrsquos System Level Outcomes + SDGs over cycle
5 Impact Assessment (past research)
Align funding and work plan for SPIA to 3-year business planning cycle
Capacity strengthening in impact assessment + one major cross-cutting thematic review
Lessons learned from SPIA + 1 or 2 major impact assessments of past research to inform broader conversation on CGIARrsquos role
Preparation of next cycle of impact assessment support to Centersprograms
6 Foresight Foresight event aligned to SC November 2018
Year 2 ndash major foresight publicationscience event to help to frame strategic focus of next 3-year research cycle
Potential specific foresight questions to address if specially requested by SC
7 Research programming
For first cycle continue with 2017-2021 Portfolio (amended and improved as appropriate) 3-year indicative Program Plans prepared as basis for Business Plan
Relevant updates to 2019-2021 indicative 3-year Programs Plans
[ Second cycle 2022-2024ndash launch updatednew research themesprograms]
Guided by the lsquo2030 Planrsquo commission development of next round of rolling program implementation plans + set criteria for independent reviewRelevant updates to 2019-2021 indicative 3-year Programs Plans
Independent review of planned next cycle of research + November System Council decision on a new round of 2022-2024 3-year implementation plans towards the lsquo2030 Planrsquo research themesprograms
8 Funding Collective multi-year pledging process (total amounts + at CRPPlatform level)
Annual contributions (and annual pledging for relevant funders)
Annual contributions (and annual pledging for relevant funders)
Multi-year pledging process (total amounts + at CRP level)
9 System Council Funder membership
Possible reconsideration of the timing for considering Funder seating
End of year 2 - reconciliation of last 3-year Funder seating based on contributions
10 Budgeting Prepare 3-year Financing Plan for the System and seek agreement on new funding modalities
Forward looking annual budget review for 2020-2021
Forward looking annual budget review for 2021 November SC - Agree next 3-year programs + platforms + System entities forward indicative budgets
11 Advocacy + communications
System Council++ event Annual theme XX (eg climate) Annual theme XX (eg foresight theme) Annual theme XX (eg progress towards SDG targets)
11 Defining a planning landscape to 2030 - 3-year business plan concept
Interpretation note Slide aims to share the anticipated level of detail in the initial 3-year business plan
Does not seek to cover all elements that would be included
SECTION 1 STRATEGY
13
Topic Challenge1 Breeding Enhance CGIARrsquos key breeding programs in capacity and
the means to capitalize with global suppliers (of inputs including knowledge management) and enter into effective dissemination pathways ndash through the multi-Funder initiative to enhance crop breeding programs
2 Fall Armyworm More strategically target the threat to food security nutrition and livelihoods posed by Fall Armyworm through coordinated action across CGIAR
3 Private sector engagement
Seize opportunities to harness the full potential of our partnerships ndash skills capacity approach and scale
4 Gender in research
Clearly articulate CGIARrsquos approach through adoption of a clear plan on Gender in Research better integration of gender in performance management system
5 Climate change A system-wide institutional strategy on our work on climate change could help underpin CGIARrsquos success and funding on this increasingly urgent and dominant issue
6 Addressing hidden hunger
With a first focus on a cross-Center approach to developing a CGIAR-wide biofortification strategy covering key substantive and institutional issues
7 Anti-microbial resistance
To set out an ambitious contribution of CGIAR to tackle anti-microbial resistance
8 CGIARrsquos genebanks
Address a strategic gap in CGIARrsquos Strategy and Results Framework regarding CGIARrsquos genebanks
Opportunities to improve and clarify in some areas
bull The first 3-year business plan would aim to continue the current portfolio but address various gaps in institutional strategy
bull New areas or tasks may be included in the Portfolio over the business plan period
To note Modalities were set out in document SC5-07 (November 2017 SC meeting) on managing CRP revisions including the process for adding new flagships or major expansions in scope to a flagship
bull A possible additional criteria for entry into the Portfolio during the business cycle would be the requirement for meeting a minimum ISPC rating
bull One implication of a 3 year business plan implementation period would be that the next cycle of programs and platforms would start in 2022 hence the existing CRPs Platforms would be implemented for 5 not 6 years
STRATEGY
To note
Sub-section 12Optimizing the current Portfolio
SECTION 1 STRATEGY
CENTER 2014 2015 20162017 (EST)
AfricaRice 0 -11 -9 -18
IWMI 3 -15 -6 -13
World Fish 2 -2 -5 0
CIFOR -5 -13 -15 -11
Bioversity 0 -2 4 -2
ICARDA -3 -1 0 -2
CIP 3 -5 -2 0 gt 10 deficit
ICRAF 2 -2 -3 -2 5-10 deficit
ICRISAT 3 -4 12 -3 gt0 but lt5 deficit
IRRI -1 -1 -4 -5 0 or surplus
ILRI 1 3 -1 -2
CIAT 4 1 0 -4
IITA 1 1 -1 1
IFPRI 1 0 0 0
CIMMYT 3 2 -1 2
14
STRATEGY
Note Centers ranked by 2017 Center estimated revenue
The issue main driver of recurring net losses appears to be a steep decline in W12 funding since 2014which has reduced overall revenue to Centers and made them rely more heavily on W3 and bilateralprojects that provide insufficient indirect cost recovery (noting cost recovery is covered in more depth onslide 38)
Sub-section 13Planning for financial viability
SECTION 1 STRATEGY
15
STRATEGYThe opportunity A vision for how CGIAR as a partnership of Centers could shift on to a sustainable longer term financial path
Sub-section 13Planning for financial viability
Successful implementation of key elements in each theme in this Business Plan concept would help to strengthen financial performance for example
1 Strategy - improved overall reputation and strategic focus of CGIAR driving maintained and even increased overall funding including at W3 level
2 Structure - further cooperation and alliances between Centers to drive up efficiencies and value for money alongside further planned efforts by individual Center levels to restructure to align costs with revenue
3 Processes ndash the 5-point plan to improve system funding modalities alongside greater assurance on risk management and program performance
4 Rewards ndash a well-mobilized collective funder engagement5 People ndash a well motivated and talented workforce
SECTION 1 STRATEGY SECTION 2 STRUCTURE SECTION 3 PROCESSES SECTION 4 REWARDS SECTION 5 PEOPLE
16
Focusing on reducing fragmentation driving efficiency and increasing value for money
The contextbull From slide 2 above the first of the twin goals of the proposed first CGIAR
business plan is to modernize and improve todayrsquos CGIAR recognizing that doing the same thing in the same way as we have been doing cannot adequately leverage CGIARrsquos capabilities in what is an increasingly changing environment - both in terms of
- Exponential technological institutional and social change and - In the operating context of multiple new stakeholders entering what is
a progressively competitive space for agricultural research for development
bull To set itself up for successful implementation of successive business plans CGIAR will quickly address several structuralinstitutional andor operational barriers that create unnecessary (and inevitably costly) fragmentation in our work
bull Some initiatives are well underway in their strategic planning (eg the multi-Funder initiative on breeding and the System Councilrsquos rethinking of the role of its advisory services thus impacting the role that such bodies will play in the forthcoming business cycle) Others are at a more experimental stage of consideration and will require more analysis to take forward
Section 2 ndash Structure
Image source ndash selected extracts from presentation of John Hagel co-chairman for Deloitte LLPs Center for the Edge titled lsquoInstitutional Innovationrsquo 16 February 2015
Institutional Innovation is about
SECTION 2 STRUCTURE
The opportunityBuilding on the 2016 CGIAR reform andintensive interactions across Centers inpreparation of the business plan it isintended that it will elaborate concretepathways and measures during the 3-yearimplementation period bringing essentialsynergies to the institutional arrangementsthrough which we work
17
Section 2 ndash Structure
The ideas
21 Deeper System-wide cooperation and alignment
22 Enhancing CGIAR assets and response preparedness
23 Strengthened collaboration with delivery partners
More detail
Slides 18-19
Slide 20
Slide 21
Catalyzing institutional innovation
SECTION 2 STRUCTURE
18
STRUCTURE
Sub-section 21Deeper System-wide cooperation and alignment
Theme Potential details for inclusion in the initial 3-year business plan
Enhanced Center alliances to harness synergies
Space to reflect on any progress in ongoing discussions between several Centers on deeper alliances the increase cooperation and alignment to harness synergies accelerate impact and drive efficiencies Will depend on any voluntary actions taken by Centers ndash and not mandated within any Business Plan period Center inputs to date suggest that such actions could potentially include i) any scope for deeper institutional ties between compatible Centers ii) any scope for common Board membershipBoard leadership between compatible Centers iii) any scope for system-wide efforts between Centers to move to a more structured plan of having some level of common Board membersBoard leadership
New shared services to achieve improved institutional efficiency
Shared services not only allow the achievement of institutional cost savings but also institutional efficiencies thereby providing value for money in staff time Centers are proposing to identify a selected set of key areas where they can utilize economies of scale to deliver substantial staff time andor cost savings Scoping work across the 2018 calendar year will identify potential areas for implementation ndash potentially including purchasing efficiencies a common policy nomenclature framework and storage system to facilitate strengthened cross-System best practices sharing and learning andor financial systems further alignment
Modernizing and increasing research data availability
Identify ways to further leverage Big Data capabilities and transform the agricultural R4D sector building on the innovations being introduced through the lsquoGlobal Agricultural Research Data Innovation amp Acceleration Networkrsquo (lsquoGARDIAN toolrsquo) as showcased on the page that follows
Efficiencies in Advisory services
(Led by System Council)
As set out System Council meeting paper SC6-06 SIMEC Think-piece on the future of CGIARrsquos advisory bodies CGIARrsquos Funders have identified the opportunity to (i) improved efficiency (ii) improved communication between the services and the System (iii) improved and systematic linkages between science and development (iv) higher ownership of the advice produced by the services by the System (v) while also ensuring independence of the content-matter of the advice
SECTION 2 STRUCTURE
The opportunityThrough the BigData platform lsquoGARDIANrsquo initiative for CGIAR to be seen as global leader in providing findable accessible interoperable and reusable (lsquoFAIRrsquo) data and publications by year by Center by country and research theme in a seamless and open way
19
21 Deeper System-wide cooperation and alignment Modernizing and increasing research data availability
The ideas1 Incentivize the sharing of high quality interoperable datasets
over progressive business plan cycles (almost 100000 publications and over 2100 datasets are already discoverable but great potential exists) CGIAR Program Performance Management Standards (described below ndash slide 32) can help support this
2 Develop rate analytics and visualization functionalities to facilitate innovative and actionable solutions from the agricultural data generated by CGIAR and its partners
SECTION 2 STRUCTURE
20
Sub-section 22Enhancing CGIAR assets and response preparedness
STRUCTURE
The opportunityLearning from the experience in Fall Armyworm more effectively demonstrate and further build CGIARrsquos ability to respond rapidly to emerging crises such as pests and epidemics ndashwith a focus on ensuring that we have the right systems aligned to be able to contribute to global discussions and follow up in a coordinated way
Initial ideasbull Identifying capacity from within the
System to act as a clearly identifiable coordination point internally and externally (eg appoint Special Envoys dedicated portals for information dissemination etc)
bull Exploration of optimum and efficient responsive funding arrangements for emerging crises such as new pests and diseases
SECTION 2 STRUCTURE
The opportunity
Increasing the reach and impact of CGIAR research activities CGIAR is dependent on partnerships for getting its research disseminated and scaled for development impact Through a more strategic alignment with delivery partners CGIAR research and innovation will have a greater adoption reach and ultimately impact
The ideas
bull Private Sector collaboration Private sector has a significant role to play not only as an upstream partner in providing access to advanced technology and specialized expertise but also as a downstream partner in providing access to markets and enabling the scaling -up and out of our research outputs
bull Country collaboration Through a Country Collaboration approach CGIAR can catalyze the development of a collective CGIAR role and impact scenario in countries in which CGIAR has a significant presence based on meaningful synergies across CGIAR entities National Governments National Systems and other partners to develop strategies and deliver programs directly aligned to key country priorities This can create an enabling environment for other partnerships and delivery initiatives
bull A CGIAR Rome Hub Increasing contribution and relevance of CGIAR in the crossroads of the global food security dialogue and with the major impact delivery partners based on Rome A consolidated CGIAR premises with capacity from Centers and CRPs SMO successors to ISPC SPIA and IEA Internal Audit Function and flex space for visiting Center staffDGs
bull MDB cooperation Establishing structures and potential mechanism(s) for CGIAR knowledge innovation and tools to contribute to design baseline implementation MampE of major development programs in the multilateral development banks
21
23 Strengthened collaboration with delivery partners
The below image is a possible collaboration maturity model where collaboration efforts in particular Countries could be represented in terms of particular stages at a given time and be used to establish collaboration aspirations and activities in those Countries
SECTION 1 STRATEGY SECTION 2 STRUCTURE SECTION 3 PROCESSES SECTION 4 REWARDS SECTION 5 PEOPLE
22
Defining and improving
The opportunity
For CGIAR to be more effectiveand efficient in the delivery ofits programs and systems anddemonstrate this in a morecompelling way to furtherstrengthen trust and supportFeatured in this section are aselection of key processesrequiring strengthening
Selected ideas
31 A program performance management framework
32 A 5-point plan to improve System funding modalities
33 A 4-point plan for an aligned assurance system
Section 3 ndash Processes
More detail
Slides 23-32
Slides 33-38
Slides 39-40
SECTION 3 PROCESSES
23
PROCESSES
Sub-section 31A program performance management framework
The opportunityTo set out an approach to program performance management that is credible and can drive improvements over time ndash providing assurance to key stakeholders
Mechanisms to achieve goal
bull Strengthening reporting and learning from outputs and outcomes of past research
bull Improving management of current program performance
bull Developing components to improve decision-making about future research funding
SECTION 3 PROCESSES
24
31 A program performance management framework
12 Framework Components
Past results reporting1 CGIAR Annual Performance Report2 CRPsPlatform reporting
requirements 3 Common results reporting indicators4 Outcome and impact case studies5 Program Results Dashboard6 Past Evaluations7 Impact Assessments
Present improved management8 Within-cycle reviews and evaluations9 Program Performance
Management Standards
Future improved decision-making10 Quality at Entry Assessment11 Planning landscape12 Allocation criteria and tool
SECTION 3 PROCESSES
The opportunity To pilot a new approach to annual reporting to improve accountability and give confidence to Funders and key supporting partners by (i) a more focused looking-back at achievements from completed research (ii) reflecting on the current CGIAR research portfolio and (iii) reviewing progress and plans for continued improvements in performance
Timelinebull In 2018 the annual report will be published at the end of September The planning and reporting cycle is later than
usual due to new systems being implementedbull Planning and reporting cycles will be revised in 2019 so that the publication will be finalized earlier in the year
25
31 - Annual CGIAR Performance Report a new approach (component 1)
The 2018 report under preparationbull Aims to interest a critical (non-researcher) audience that is
looking for serious discussion of issues and evidencebull Represent a range of voices from across CGIAR and partnersbull Demonstrate progress towards CGIAR goals (SRF) while
reflecting on the approaches and partnerships that promote impact
bull Reflect on the value added of CGIAR Research Programs and Platforms working in Research Centers to deliver results
bull Reflect on how funding has been able to support system goalsbull Incorporate available results from the new reporting systems (to
be introduced in late 2018)
Building on 2018 reports for 2019 and beyond will also incorporatebull New program results dashboard Highlights from the interactive
CGIAR dashboard capturing research innovations outcomes and impacts
It will report and reflect on progress towards CGIARs goals tobull Modernize improve and stabilizebull Provide an enabling environment to improve quality and deliver
impactbull Build an efficient system with reduced transaction costsbull Strengthen and diversify funding (new collaborations initiatives)
to enable a longer-term funding basebull Attract retain and build the highest quality staff
2018 Introducing new reporting approach 2019 harmonization with new CGIAR Business Plan Cycle
SECTION 3 PROCESSES
Selected ideas bull Deliver data interoperability and consolidation from
multiple source systems (including lsquoGARDIANrsquo tool discussed earlier on slide 19) with data interfacing and storage on a central database
bull The on-line results reporting system will be used going forward to streamline the creation of the Annual CGIAR Performance Report
bull The dashboard mockup on the following slides provides visualization ideas aligned with current operational CGIAR Results Reporting guidance
26
31 - A new CGIAR Program Results Dashboard (component 5)
The opportunityThrough making use of modern visualization technology CGIAR will be able to provide real-time program information to Funders partners and other stakeholders via wwwcgiarorg
Filtering will be possible by programplatform by year by outcomeimpact on the ground (by country) and by innovation stage
SDG
Find information by
Program Platform
Partner Institutions
2016 2017 2018
22
Policies
231
Innovation by Stage Peer-reviewed Papers
1918
Partnerships
475 1555
Trainees
Financials
Budget Allocation by CRPPTF
CRP Funding Update
This selection allows filtering of all elements of the page by year
On the home page the heat map indicates the number of evidences by region
5 reporting indicators are highlighted on the home page By clicking on an indicator the user navigates to a more detailed page on innovations policies etc
All pages of the dashboard contain links to search information related to
SDGs CRPs and partners
CGIAR Program Results DashboardProgress towards
System Level Outcomes (SLOs)
Reporting Indicators
28
SLO SDGThe distribution of evidences can be displayed by SLO or by SDG
North AfricaProgress towards SLO 4 evidences reportedOutcome case studies 10 case studies reportedPolicies 5 policies enactedInnovation by stage 10 in stage 4Partnership 50 partners work with usParticipants 15000 people involved in our activitiesTrainees 150 people trainedPeer-reviewed papers 193 in ISI journals
By hovering over a region a window displays key information that is geographically tagged By
clicking on the region the user navigates to the next page
27
SDG
Find information by
Program Platform
Partner Institutions
2016 2017 2018
3
Policies
23
Innovation by Stage Peer-reviewed Papers
1918
Partnerships
41 123
Trainees
Outcome Case Studies
Case Study Title CRPPTF
Adoption of citizen science methodology shapes new linkages between researchers and farmers for climate adaptation
CCAFS
De Brauw 2016 showed that biofortified OFSP varieties have disseminated to an estimated 289M households in 12 SSA countries (125 grams per day meets the daily vitamin A requirement of a child under five)
RTB
CIMMYT FAO and the World Bank found in Kazakhstan that spring wheat yields are as much as 58 higher under (widely-adopted) zero tillage introduced by WHEAT than with conventional technologies
WHEAT
RTB - 2017Western AfricaAdoption of citizen science methodology shapes new linkages between researchers and farmers for climate adaptationSLO Target 21 Improve the rate of yield increase for major food staples from current lt1 to 12-15 per yearIDOSub-IDO 132 Increased livelihood opportunitiesA14 Enhanced capacity to deal with climatic risks and extremesCross-cutting Gender Youth
Outcome Impact on the Ground
This page displays outcome case studies related to a specific region Clicking on the pin displays information on the case study
All case studies for the selected region are listed in this table
CGIAR Program Results Dashboard
Reporting Indicators
Progress towards System Level Outcomes (SLOs)
4
SLO SDG
28
SDG
Program Platform
Partner Institutions
2016 2017 2018
Fish ndash Stage 3 Innovations
Innovation by Stage
9
Innovation Innovation Type
Base populations established for new breeding program of Catla and Silver carps established (Bangladesh) Genetics
Genetic assessment of juvenile rearing methods of Rohu carp (2 Journal articles[1]) Genetics
New knowledge on sex determining genes feed efficiency and resilience in tilapia (journal articles) Genetics
Genomic databases for rohu catla and silver carps Bangladesh) Genetics
Dissemination plans for improved tilapia dissemination prepared with national partners in Cambodia and Myanmar (Practice notes Working papers) Genetics
Clicking on a specific program innovation stage filters rows of the Innovations table accordingly
FISH
Heat map now based on number of innovations per region
Innovation by StageCGIAR Program Results Dashboard
29
SDG
Program Platform
Partner Institutions
2016 2017 2018
CCAFS ndash Peer-reviewed Papers
Journal Paper Journal Open Access ISI
Complete Genome Sequence of Rice hoja blanca tenuivirus Isolated from a Susceptible Rice Cultivar in Colombia Theoretical and Applied Genetics
Common Bean Genomes Mining New Knowledge of a Major Societal Crop Field Crops Research
Breeding implications of drought stress under future climate for upland rice in Brazil Agriculture Ecosystems and Environment
Landscape context does not constrain biological control of Phenacoccus manihoti in intensified cassava systems of southern Vietnam
Agronomy for Sustainable Development
Peer-reviewed Papers
0 10 20 30
FISH
FTA
LIVESTOCK
MAIZE
RICE
RTB
WHEAT
GLDC
A4NH
CCAFS
PIM
WLE
GENEBANK
EiB
BIG DATA
CRP
PTF
Clicking on a specific program filters information on the page accordingly
135
135
CCAFS ndash Social AttentionTop 10 publications by Altmetric score
Publication Score Date View on Altmetric
Natural climate solutions 810 16-10-17 Details page URL
Farming and the geography of nutrient production for human use a transdisciplinary analysis 191 01-04-17 Details page URL
Linking regional stakeholder scenarios and shared socioeconomic pathways Quantified West African food and climate futures in a global context
126 01-03-17 Details page URL
Agriculture production as a major driver of the Earth system exceeding planetary boundaries 107 12-10-17 Details page URL
10 best bet innovations for adaptation in agriculture A supplement to the UNFCCC NAP Technical Guidelines 48 02-11-17 Details page URL
Greenhouse gas emissions from agricultural food production to supply Indian diets Implications for climate change mitigation 40 01-01-17 Details page URL
Special issue on climate-smart agriculture (CSA) 34 13-05-17 Details page URL
lsquoCSA-Planrsquo strategies to put Climate-Smart Agriculture (CSA) into practice 27 06-06-17 Details page URL
Clicking on the link takes the user to the
Altmetric page from which the article can be
accessed
Peer-reviewed PapersCGIAR Program Results Dashboard
Clicking here allows to view a specific program page accordingly
30
5
Policies
6
Innovation by Stage Peer-reviewed Papers
1918
Partnerships
34
Outcome Case StudiesCase Study Title CRP
Describing the rice production context in Latin America policy briefs on rice to the FLAR member countries
RICE
15
Progress Towards Milestones
Flagship Project 1Mapped and contributing to Sub-IDO
2022 CRP outcomes (from proposal)
MilestoneAssessment of risk to achievement (LMH)
Milestone 11 Increased capacity for innovation in partner research organizations
Foresight analyses and priority setting used by RICE and partner scientists to develop and target technology options
Application of the rice monitoring system for national food security program in Cambodia supporting Thailand disaster relief program for rice farmers crop insurance implementation in Tamil Nadu India Cambodia and Mekong River Delta Vietnam and development of remote sensing based rice monitoring system for Bihar India
L support from national partners
Milestone 12 Improved capacity of women and young people to participate in decision-making
Improved role in decision making by women and youth in rice value chains as evidenced by empowerment measures at key action sites
Gender-youth business models in rice value chain reinforced through better understanding of changing roles on decision making of women and youth in rice farming
M Dependence on support from national partners and governments
Flagship project 1 Accelerating impact and equity
Budget by Window of Funding
Filter by Program Year and Flagship
2018
Reporting Indicators
CRP Staffing
Clicking on any indicator will provide the details available in the table below
Link to Program Information on cgiarorgLinkRICE
CGIAR Program Results Dashboard
31
SECTION 3 PROCESSES
32
31 - Program Performance Management Standards (component 9)
The opportunity to strengthen incentives for high-quality program performance management and provide greater assurance to the SMB and System Council
The ideasbull Adoption of a limited set of program
performance standards for each business cycle in response to the challenges of performance assessment inherent in the variety complexity technical specificity and timelines of the research programs
bull Minimum standards required would change be raised over successive business cycles
bull Specific standards to be agreed with Funders CRPsCenters and SMB
bull Would complement and build on other elements of framework ndash egevaluation
32
Minimum standardsexamples of possible measures for Cycle 1 Rationale assumptions Examples of
measurement optionsReliabilityCredibilityProgram governance structures provide an effective challenge and verification function for management prioritization of research including consideration of future scenarios
Program governance (eg steering committees) should provide an effective specialist technical critique and challenge for prioritization decisions
Evaluation of structures and processes based on agreed quality criteria Qualitative passfail
Relevance and DeliveryEffectivenessgt80 of the Programrsquos projects document a clear and credible impact pathway with a clear product and delivery pathway in mind (appropriate to stage of maturity of research)
Written impact pathways are one good way to check a clear lsquooutcome focusrsquo as well as whether the assumptions are credible
Verification of a random sample of projects with W1W2 funding or co-funding based on agreed quality criteria
Delivery Effectiveness and ReputationLegitimacyKey research project documents for each program are available electronically on a central MIS system or another system accessible by central system advisory bodies (covering gt80 of total research budget)
Availability of project documents is a lsquoboring but importantrsquo necessary step for internal assessments of aspects such as impact pathways (above)
Availability of documents checked
ReputationLegitimacyProgram has processes or contracts in place to ensure appropriate ethical approval for all projects [IRB is primary responsibility of Centers]
Ethical approval processes (IRB) are an important part of ensuring ethical work with human subjects
Evaluation of processes and a sample of decisions based on agreed criteria Qualitative passfail
SECTION 3 PROCESSES
33
The 5 points Description
1 Adopt A multi-year pledging process for W1 amp W2 ndash with multi-year pledging at CRPplatform (and flagship where desired) level
A central objective of business plan is to increase the share of multi-annual pledges and to translate these into multi-annual pledges at the CRPplatform level ndash transforming the level of forward predictability for the shared science agenda through W1 ampW2
2 Revise Use of W1 to change the internal hydraulics
De-link W1 from W2 in terms of its ex post ldquoshock absorbingrdquo within each financial year but continue to link W1 to W2 to support the rebalancing of funding ex ante at the start of the multi--year funding period based on W2 forward pledgescommitments
3 Clarify Approach to allocation within and between cycles
Clarification of between and within business-cycle approaches alongside adoption of a funding target-setting approach to guide funding decisions over the remaining time in the current portfolio
4 Efficiency Optimal funding received to manage down transaction costs
Re-concentrate funding in large pooled programs and decrease number of small W3bilateral projects
5 Recovery Full overhead costs of projects
Adoption of collective System Council ambition to cover minimum overhead costs requested by Centers
PROCESSES
The opportunity By resolving long-standing challenges in CGIARrsquos financing system this can build the needed confidence in CGIAR financing so that reliability percentage share and absolute level of overall and system financing can be maintained and even increased
Sub-section 32A 5-point plan to improve System funding modalities
SECTION 3 PROCESSES
34
32 - Point 3 - Clarify Approach to allocation within and between cycles
Between business cycles During each 3-year business cyclePotential reset of starting point in funding across system Fundamental reconsideration of balance of funding between key focus areasprogram themes based on the list of prioritization criteria set out in the Council Paper on an allocation strategy referenced above
Tool simulation tool that aligns potential programs with broader strategic SLOhigher level outcomes potentially also collecting and presenting relevant available information on strategic fit and performance
Overall output of process Program-level W12 funding targets for subsequent business cycle period
Methodology Annual review of funding targets and W1 forward allocations to take into account any exceptional changes -particularly changes in strategic considerations such as a changing risk context (eg new pestdisease) or a potential new funding opportunity
SECTION 3 PROCESSES
Starting premiseThe budgeting process leading to the CRPPlatforms funding request as presented to the System Council in September 2016 was sufficiently robust and detailed to guide funding allocations for the remaining 3-year period of CRPsplatforms
Concept for initial 2019-2021 Business PlanFunding and program planning would be substantiated bybull A 3-year indicative workplan underpinning the
Business Plan and subjected to potential alterations resulting from the breeding initiative or other potential modifications to the current Portfolio
bull Detailed annual programmatic planning through the existing workplan and budgeting process
Key recognitionThe budgeting process for the implementation periods from 2022 needs to learn and evolve from that undertaken in 2015
35
32 - Point 3 - Portfolio Budgets Allocation baseline
Budget by expense category
Funding Plan
SECTION 3 PROCESSES
36
32 - Point 3 - A starting point for ldquobaseline funding targetsrdquo for 2019-2021 Business Plan (Note subject to potential revision for final draft Plan)
W1amp2 proposed budget ($USm original proposals) 2019 2020 2021 Total BaseGrain Legumes and Dryland Cereals 121 127 133 381Fish 74 78 82 233Forests Trees and Agroforestry 120 125 131 377Livestock 223 235 246 704Maize 125 131 138 394Rice 171 175 179 524Roots Tubers and Bananas 243 253 263 760Wheat 165 174 182 521Agriculture 4 Nutrition and Health 218 227 238 683Climate Change Agriculture and Food Security 232 243 255 730Policies Institutions and Markets 194 194 200 587Water Land and Ecosystems 110 116 122 348Genebanks 188 153 132 472Excellence in Breeding 22 23 24 70Big Data 52 45 43 139
Total Portfolio Base Budget 2258 2299 2368 6923
hellipThus - the September 2016 submitted budgets would form the starting point of discussions with the SMB and System Council on the funding targets for the 2019-2021 period as informed by any updated program platform information and any new elements or key changes to the Portfolio
SECTION 3 PROCESSES
A possible goal of the initial 2019-2021 business plan is to explore appropriate incentives to reduce the number of projects that are less than $200K by [X ndash for discussion and agreement]
37
32 - Point 4 - Efficiency Optimal funding received to manage down transaction costs
Ave Annual Grant 2012 2013 2014 2015 2016gt1m 167 182 205 225 212 500k - 999k 175 183 202 224 214 200k - 499k 424 466 454 457 463 lt200k 1674 1570 1280 1356 1398 Total no of projects 2440 2401 2141 2262 2287
Centers continue to manage a large number of restricted W3 and bilateral projects
0
200
400
600
800
1000
1200
2011 2012 2013 2014 2015 2016 2017(est)
Sources of Revenue $million
Bilateral amp other CGIAR Fund W3
0
500
1000
1500
2000
2500
3000
2012 2013 2014 2015 2016
No of W3 and Bilateral Projects
gt1m 500k - 999k 200k - 499k lt200k
2012 2013 2014 2015 2016 -
200
400
600
800
1000
1200
Total Annual Grants Pledged $million
gt1m 500k - 999k 200k - 499k lt200k
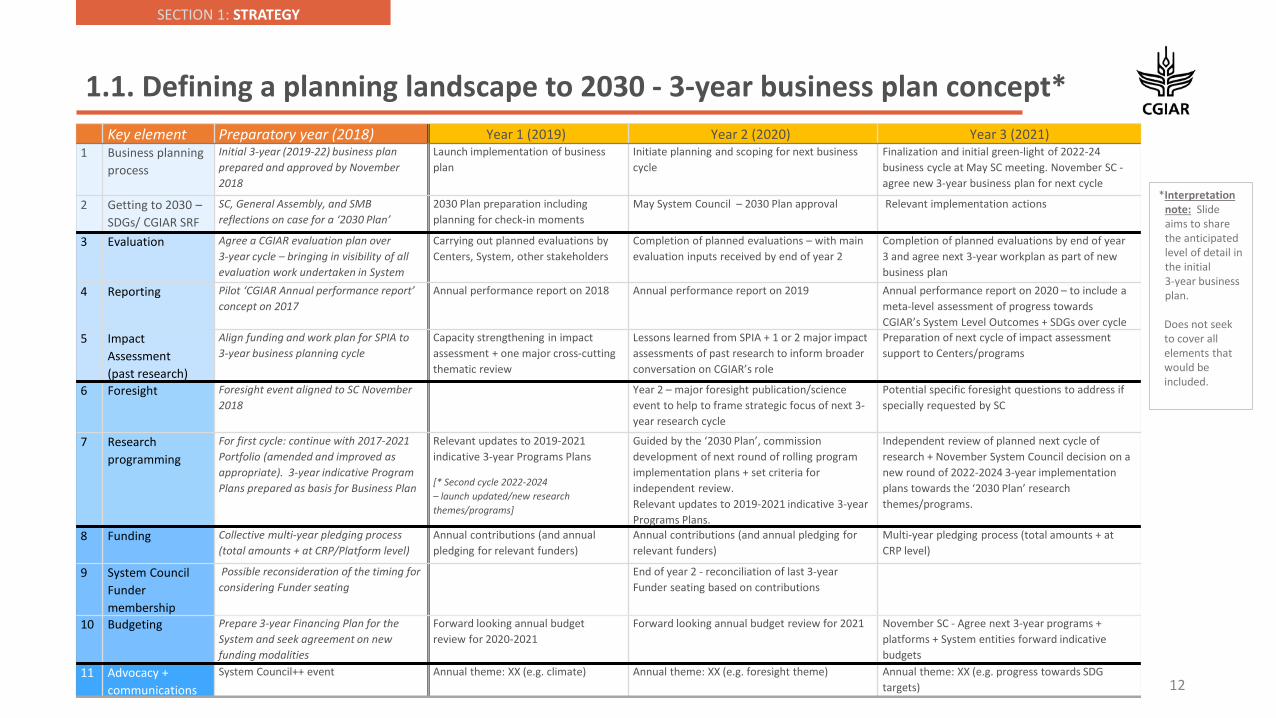
SECTION 1 STRATEGY
15
STRATEGYThe opportunity A vision for how CGIAR as a partnership of Centers could shift on to a sustainable longer term financial path
Sub-section 13Planning for financial viability
Successful implementation of key elements in each theme in this Business Plan concept would help to strengthen financial performance for example
1 Strategy - improved overall reputation and strategic focus of CGIAR driving maintained and even increased overall funding including at W3 level
2 Structure - further cooperation and alliances between Centers to drive up efficiencies and value for money alongside further planned efforts by individual Center levels to restructure to align costs with revenue
3 Processes ndash the 5-point plan to improve system funding modalities alongside greater assurance on risk management and program performance
4 Rewards ndash a well-mobilized collective funder engagement5 People ndash a well motivated and talented workforce
SECTION 1 STRATEGY SECTION 2 STRUCTURE SECTION 3 PROCESSES SECTION 4 REWARDS SECTION 5 PEOPLE
16
Focusing on reducing fragmentation driving efficiency and increasing value for money
The contextbull From slide 2 above the first of the twin goals of the proposed first CGIAR
business plan is to modernize and improve todayrsquos CGIAR recognizing that doing the same thing in the same way as we have been doing cannot adequately leverage CGIARrsquos capabilities in what is an increasingly changing environment - both in terms of
- Exponential technological institutional and social change and - In the operating context of multiple new stakeholders entering what is
a progressively competitive space for agricultural research for development
bull To set itself up for successful implementation of successive business plans CGIAR will quickly address several structuralinstitutional andor operational barriers that create unnecessary (and inevitably costly) fragmentation in our work
bull Some initiatives are well underway in their strategic planning (eg the multi-Funder initiative on breeding and the System Councilrsquos rethinking of the role of its advisory services thus impacting the role that such bodies will play in the forthcoming business cycle) Others are at a more experimental stage of consideration and will require more analysis to take forward
Section 2 ndash Structure
Image source ndash selected extracts from presentation of John Hagel co-chairman for Deloitte LLPs Center for the Edge titled lsquoInstitutional Innovationrsquo 16 February 2015
Institutional Innovation is about
SECTION 2 STRUCTURE
The opportunityBuilding on the 2016 CGIAR reform andintensive interactions across Centers inpreparation of the business plan it isintended that it will elaborate concretepathways and measures during the 3-yearimplementation period bringing essentialsynergies to the institutional arrangementsthrough which we work
17
Section 2 ndash Structure
The ideas
21 Deeper System-wide cooperation and alignment
22 Enhancing CGIAR assets and response preparedness
23 Strengthened collaboration with delivery partners
More detail
Slides 18-19
Slide 20
Slide 21
Catalyzing institutional innovation
SECTION 2 STRUCTURE
18
STRUCTURE
Sub-section 21Deeper System-wide cooperation and alignment
Theme Potential details for inclusion in the initial 3-year business plan
Enhanced Center alliances to harness synergies
Space to reflect on any progress in ongoing discussions between several Centers on deeper alliances the increase cooperation and alignment to harness synergies accelerate impact and drive efficiencies Will depend on any voluntary actions taken by Centers ndash and not mandated within any Business Plan period Center inputs to date suggest that such actions could potentially include i) any scope for deeper institutional ties between compatible Centers ii) any scope for common Board membershipBoard leadership between compatible Centers iii) any scope for system-wide efforts between Centers to move to a more structured plan of having some level of common Board membersBoard leadership
New shared services to achieve improved institutional efficiency
Shared services not only allow the achievement of institutional cost savings but also institutional efficiencies thereby providing value for money in staff time Centers are proposing to identify a selected set of key areas where they can utilize economies of scale to deliver substantial staff time andor cost savings Scoping work across the 2018 calendar year will identify potential areas for implementation ndash potentially including purchasing efficiencies a common policy nomenclature framework and storage system to facilitate strengthened cross-System best practices sharing and learning andor financial systems further alignment
Modernizing and increasing research data availability
Identify ways to further leverage Big Data capabilities and transform the agricultural R4D sector building on the innovations being introduced through the lsquoGlobal Agricultural Research Data Innovation amp Acceleration Networkrsquo (lsquoGARDIAN toolrsquo) as showcased on the page that follows
Efficiencies in Advisory services
(Led by System Council)
As set out System Council meeting paper SC6-06 SIMEC Think-piece on the future of CGIARrsquos advisory bodies CGIARrsquos Funders have identified the opportunity to (i) improved efficiency (ii) improved communication between the services and the System (iii) improved and systematic linkages between science and development (iv) higher ownership of the advice produced by the services by the System (v) while also ensuring independence of the content-matter of the advice
SECTION 2 STRUCTURE
The opportunityThrough the BigData platform lsquoGARDIANrsquo initiative for CGIAR to be seen as global leader in providing findable accessible interoperable and reusable (lsquoFAIRrsquo) data and publications by year by Center by country and research theme in a seamless and open way
19
21 Deeper System-wide cooperation and alignment Modernizing and increasing research data availability
The ideas1 Incentivize the sharing of high quality interoperable datasets
over progressive business plan cycles (almost 100000 publications and over 2100 datasets are already discoverable but great potential exists) CGIAR Program Performance Management Standards (described below ndash slide 32) can help support this
2 Develop rate analytics and visualization functionalities to facilitate innovative and actionable solutions from the agricultural data generated by CGIAR and its partners
SECTION 2 STRUCTURE
20
Sub-section 22Enhancing CGIAR assets and response preparedness
STRUCTURE
The opportunityLearning from the experience in Fall Armyworm more effectively demonstrate and further build CGIARrsquos ability to respond rapidly to emerging crises such as pests and epidemics ndashwith a focus on ensuring that we have the right systems aligned to be able to contribute to global discussions and follow up in a coordinated way
Initial ideasbull Identifying capacity from within the
System to act as a clearly identifiable coordination point internally and externally (eg appoint Special Envoys dedicated portals for information dissemination etc)
bull Exploration of optimum and efficient responsive funding arrangements for emerging crises such as new pests and diseases
SECTION 2 STRUCTURE
The opportunity
Increasing the reach and impact of CGIAR research activities CGIAR is dependent on partnerships for getting its research disseminated and scaled for development impact Through a more strategic alignment with delivery partners CGIAR research and innovation will have a greater adoption reach and ultimately impact
The ideas
bull Private Sector collaboration Private sector has a significant role to play not only as an upstream partner in providing access to advanced technology and specialized expertise but also as a downstream partner in providing access to markets and enabling the scaling -up and out of our research outputs
bull Country collaboration Through a Country Collaboration approach CGIAR can catalyze the development of a collective CGIAR role and impact scenario in countries in which CGIAR has a significant presence based on meaningful synergies across CGIAR entities National Governments National Systems and other partners to develop strategies and deliver programs directly aligned to key country priorities This can create an enabling environment for other partnerships and delivery initiatives
bull A CGIAR Rome Hub Increasing contribution and relevance of CGIAR in the crossroads of the global food security dialogue and with the major impact delivery partners based on Rome A consolidated CGIAR premises with capacity from Centers and CRPs SMO successors to ISPC SPIA and IEA Internal Audit Function and flex space for visiting Center staffDGs
bull MDB cooperation Establishing structures and potential mechanism(s) for CGIAR knowledge innovation and tools to contribute to design baseline implementation MampE of major development programs in the multilateral development banks
21
23 Strengthened collaboration with delivery partners
The below image is a possible collaboration maturity model where collaboration efforts in particular Countries could be represented in terms of particular stages at a given time and be used to establish collaboration aspirations and activities in those Countries
SECTION 1 STRATEGY SECTION 2 STRUCTURE SECTION 3 PROCESSES SECTION 4 REWARDS SECTION 5 PEOPLE
22
Defining and improving
The opportunity
For CGIAR to be more effectiveand efficient in the delivery ofits programs and systems anddemonstrate this in a morecompelling way to furtherstrengthen trust and supportFeatured in this section are aselection of key processesrequiring strengthening
Selected ideas
31 A program performance management framework
32 A 5-point plan to improve System funding modalities
33 A 4-point plan for an aligned assurance system
Section 3 ndash Processes
More detail
Slides 23-32
Slides 33-38
Slides 39-40
SECTION 3 PROCESSES
23
PROCESSES
Sub-section 31A program performance management framework
The opportunityTo set out an approach to program performance management that is credible and can drive improvements over time ndash providing assurance to key stakeholders
Mechanisms to achieve goal
bull Strengthening reporting and learning from outputs and outcomes of past research
bull Improving management of current program performance
bull Developing components to improve decision-making about future research funding
SECTION 3 PROCESSES
24
31 A program performance management framework
12 Framework Components
Past results reporting1 CGIAR Annual Performance Report2 CRPsPlatform reporting
requirements 3 Common results reporting indicators4 Outcome and impact case studies5 Program Results Dashboard6 Past Evaluations7 Impact Assessments
Present improved management8 Within-cycle reviews and evaluations9 Program Performance
Management Standards
Future improved decision-making10 Quality at Entry Assessment11 Planning landscape12 Allocation criteria and tool
SECTION 3 PROCESSES
The opportunity To pilot a new approach to annual reporting to improve accountability and give confidence to Funders and key supporting partners by (i) a more focused looking-back at achievements from completed research (ii) reflecting on the current CGIAR research portfolio and (iii) reviewing progress and plans for continued improvements in performance
Timelinebull In 2018 the annual report will be published at the end of September The planning and reporting cycle is later than
usual due to new systems being implementedbull Planning and reporting cycles will be revised in 2019 so that the publication will be finalized earlier in the year
25
31 - Annual CGIAR Performance Report a new approach (component 1)
The 2018 report under preparationbull Aims to interest a critical (non-researcher) audience that is
looking for serious discussion of issues and evidencebull Represent a range of voices from across CGIAR and partnersbull Demonstrate progress towards CGIAR goals (SRF) while
reflecting on the approaches and partnerships that promote impact
bull Reflect on the value added of CGIAR Research Programs and Platforms working in Research Centers to deliver results
bull Reflect on how funding has been able to support system goalsbull Incorporate available results from the new reporting systems (to
be introduced in late 2018)
Building on 2018 reports for 2019 and beyond will also incorporatebull New program results dashboard Highlights from the interactive
CGIAR dashboard capturing research innovations outcomes and impacts
It will report and reflect on progress towards CGIARs goals tobull Modernize improve and stabilizebull Provide an enabling environment to improve quality and deliver
impactbull Build an efficient system with reduced transaction costsbull Strengthen and diversify funding (new collaborations initiatives)
to enable a longer-term funding basebull Attract retain and build the highest quality staff
2018 Introducing new reporting approach 2019 harmonization with new CGIAR Business Plan Cycle
SECTION 3 PROCESSES
Selected ideas bull Deliver data interoperability and consolidation from
multiple source systems (including lsquoGARDIANrsquo tool discussed earlier on slide 19) with data interfacing and storage on a central database
bull The on-line results reporting system will be used going forward to streamline the creation of the Annual CGIAR Performance Report
bull The dashboard mockup on the following slides provides visualization ideas aligned with current operational CGIAR Results Reporting guidance
26
31 - A new CGIAR Program Results Dashboard (component 5)
The opportunityThrough making use of modern visualization technology CGIAR will be able to provide real-time program information to Funders partners and other stakeholders via wwwcgiarorg
Filtering will be possible by programplatform by year by outcomeimpact on the ground (by country) and by innovation stage
SDG
Find information by
Program Platform
Partner Institutions
2016 2017 2018
22
Policies
231
Innovation by Stage Peer-reviewed Papers
1918
Partnerships
475 1555
Trainees
Financials
Budget Allocation by CRPPTF
CRP Funding Update
This selection allows filtering of all elements of the page by year
On the home page the heat map indicates the number of evidences by region
5 reporting indicators are highlighted on the home page By clicking on an indicator the user navigates to a more detailed page on innovations policies etc
All pages of the dashboard contain links to search information related to
SDGs CRPs and partners
CGIAR Program Results DashboardProgress towards
System Level Outcomes (SLOs)
Reporting Indicators
28
SLO SDGThe distribution of evidences can be displayed by SLO or by SDG
North AfricaProgress towards SLO 4 evidences reportedOutcome case studies 10 case studies reportedPolicies 5 policies enactedInnovation by stage 10 in stage 4Partnership 50 partners work with usParticipants 15000 people involved in our activitiesTrainees 150 people trainedPeer-reviewed papers 193 in ISI journals
By hovering over a region a window displays key information that is geographically tagged By
clicking on the region the user navigates to the next page
27
SDG
Find information by
Program Platform
Partner Institutions
2016 2017 2018
3
Policies
23
Innovation by Stage Peer-reviewed Papers
1918
Partnerships
41 123
Trainees
Outcome Case Studies
Case Study Title CRPPTF
Adoption of citizen science methodology shapes new linkages between researchers and farmers for climate adaptation
CCAFS
De Brauw 2016 showed that biofortified OFSP varieties have disseminated to an estimated 289M households in 12 SSA countries (125 grams per day meets the daily vitamin A requirement of a child under five)
RTB
CIMMYT FAO and the World Bank found in Kazakhstan that spring wheat yields are as much as 58 higher under (widely-adopted) zero tillage introduced by WHEAT than with conventional technologies
WHEAT
RTB - 2017Western AfricaAdoption of citizen science methodology shapes new linkages between researchers and farmers for climate adaptationSLO Target 21 Improve the rate of yield increase for major food staples from current lt1 to 12-15 per yearIDOSub-IDO 132 Increased livelihood opportunitiesA14 Enhanced capacity to deal with climatic risks and extremesCross-cutting Gender Youth
Outcome Impact on the Ground
This page displays outcome case studies related to a specific region Clicking on the pin displays information on the case study
All case studies for the selected region are listed in this table
CGIAR Program Results Dashboard
Reporting Indicators
Progress towards System Level Outcomes (SLOs)
4
SLO SDG
28
SDG
Program Platform
Partner Institutions
2016 2017 2018
Fish ndash Stage 3 Innovations
Innovation by Stage
9
Innovation Innovation Type
Base populations established for new breeding program of Catla and Silver carps established (Bangladesh) Genetics
Genetic assessment of juvenile rearing methods of Rohu carp (2 Journal articles[1]) Genetics
New knowledge on sex determining genes feed efficiency and resilience in tilapia (journal articles) Genetics
Genomic databases for rohu catla and silver carps Bangladesh) Genetics
Dissemination plans for improved tilapia dissemination prepared with national partners in Cambodia and Myanmar (Practice notes Working papers) Genetics
Clicking on a specific program innovation stage filters rows of the Innovations table accordingly
FISH
Heat map now based on number of innovations per region
Innovation by StageCGIAR Program Results Dashboard
29
SDG
Program Platform
Partner Institutions
2016 2017 2018
CCAFS ndash Peer-reviewed Papers
Journal Paper Journal Open Access ISI
Complete Genome Sequence of Rice hoja blanca tenuivirus Isolated from a Susceptible Rice Cultivar in Colombia Theoretical and Applied Genetics
Common Bean Genomes Mining New Knowledge of a Major Societal Crop Field Crops Research
Breeding implications of drought stress under future climate for upland rice in Brazil Agriculture Ecosystems and Environment
Landscape context does not constrain biological control of Phenacoccus manihoti in intensified cassava systems of southern Vietnam
Agronomy for Sustainable Development
Peer-reviewed Papers
0 10 20 30
FISH
FTA
LIVESTOCK
MAIZE
RICE
RTB
WHEAT
GLDC
A4NH
CCAFS
PIM
WLE
GENEBANK
EiB
BIG DATA
CRP
PTF
Clicking on a specific program filters information on the page accordingly
135
135
CCAFS ndash Social AttentionTop 10 publications by Altmetric score
Publication Score Date View on Altmetric
Natural climate solutions 810 16-10-17 Details page URL
Farming and the geography of nutrient production for human use a transdisciplinary analysis 191 01-04-17 Details page URL
Linking regional stakeholder scenarios and shared socioeconomic pathways Quantified West African food and climate futures in a global context
126 01-03-17 Details page URL
Agriculture production as a major driver of the Earth system exceeding planetary boundaries 107 12-10-17 Details page URL
10 best bet innovations for adaptation in agriculture A supplement to the UNFCCC NAP Technical Guidelines 48 02-11-17 Details page URL
Greenhouse gas emissions from agricultural food production to supply Indian diets Implications for climate change mitigation 40 01-01-17 Details page URL
Special issue on climate-smart agriculture (CSA) 34 13-05-17 Details page URL
lsquoCSA-Planrsquo strategies to put Climate-Smart Agriculture (CSA) into practice 27 06-06-17 Details page URL
Clicking on the link takes the user to the
Altmetric page from which the article can be
accessed
Peer-reviewed PapersCGIAR Program Results Dashboard
Clicking here allows to view a specific program page accordingly
30
5
Policies
6
Innovation by Stage Peer-reviewed Papers
1918
Partnerships
34
Outcome Case StudiesCase Study Title CRP
Describing the rice production context in Latin America policy briefs on rice to the FLAR member countries
RICE
15
Progress Towards Milestones
Flagship Project 1Mapped and contributing to Sub-IDO
2022 CRP outcomes (from proposal)
MilestoneAssessment of risk to achievement (LMH)
Milestone 11 Increased capacity for innovation in partner research organizations
Foresight analyses and priority setting used by RICE and partner scientists to develop and target technology options
Application of the rice monitoring system for national food security program in Cambodia supporting Thailand disaster relief program for rice farmers crop insurance implementation in Tamil Nadu India Cambodia and Mekong River Delta Vietnam and development of remote sensing based rice monitoring system for Bihar India
L support from national partners
Milestone 12 Improved capacity of women and young people to participate in decision-making
Improved role in decision making by women and youth in rice value chains as evidenced by empowerment measures at key action sites
Gender-youth business models in rice value chain reinforced through better understanding of changing roles on decision making of women and youth in rice farming
M Dependence on support from national partners and governments
Flagship project 1 Accelerating impact and equity
Budget by Window of Funding
Filter by Program Year and Flagship
2018
Reporting Indicators
CRP Staffing
Clicking on any indicator will provide the details available in the table below
Link to Program Information on cgiarorgLinkRICE
CGIAR Program Results Dashboard
31
SECTION 3 PROCESSES
32
31 - Program Performance Management Standards (component 9)
The opportunity to strengthen incentives for high-quality program performance management and provide greater assurance to the SMB and System Council
The ideasbull Adoption of a limited set of program
performance standards for each business cycle in response to the challenges of performance assessment inherent in the variety complexity technical specificity and timelines of the research programs
bull Minimum standards required would change be raised over successive business cycles
bull Specific standards to be agreed with Funders CRPsCenters and SMB
bull Would complement and build on other elements of framework ndash egevaluation
32
Minimum standardsexamples of possible measures for Cycle 1 Rationale assumptions Examples of
measurement optionsReliabilityCredibilityProgram governance structures provide an effective challenge and verification function for management prioritization of research including consideration of future scenarios
Program governance (eg steering committees) should provide an effective specialist technical critique and challenge for prioritization decisions
Evaluation of structures and processes based on agreed quality criteria Qualitative passfail
Relevance and DeliveryEffectivenessgt80 of the Programrsquos projects document a clear and credible impact pathway with a clear product and delivery pathway in mind (appropriate to stage of maturity of research)
Written impact pathways are one good way to check a clear lsquooutcome focusrsquo as well as whether the assumptions are credible
Verification of a random sample of projects with W1W2 funding or co-funding based on agreed quality criteria
Delivery Effectiveness and ReputationLegitimacyKey research project documents for each program are available electronically on a central MIS system or another system accessible by central system advisory bodies (covering gt80 of total research budget)
Availability of project documents is a lsquoboring but importantrsquo necessary step for internal assessments of aspects such as impact pathways (above)
Availability of documents checked
ReputationLegitimacyProgram has processes or contracts in place to ensure appropriate ethical approval for all projects [IRB is primary responsibility of Centers]
Ethical approval processes (IRB) are an important part of ensuring ethical work with human subjects
Evaluation of processes and a sample of decisions based on agreed criteria Qualitative passfail
SECTION 3 PROCESSES
33
The 5 points Description
1 Adopt A multi-year pledging process for W1 amp W2 ndash with multi-year pledging at CRPplatform (and flagship where desired) level
A central objective of business plan is to increase the share of multi-annual pledges and to translate these into multi-annual pledges at the CRPplatform level ndash transforming the level of forward predictability for the shared science agenda through W1 ampW2
2 Revise Use of W1 to change the internal hydraulics
De-link W1 from W2 in terms of its ex post ldquoshock absorbingrdquo within each financial year but continue to link W1 to W2 to support the rebalancing of funding ex ante at the start of the multi--year funding period based on W2 forward pledgescommitments
3 Clarify Approach to allocation within and between cycles
Clarification of between and within business-cycle approaches alongside adoption of a funding target-setting approach to guide funding decisions over the remaining time in the current portfolio
4 Efficiency Optimal funding received to manage down transaction costs
Re-concentrate funding in large pooled programs and decrease number of small W3bilateral projects
5 Recovery Full overhead costs of projects
Adoption of collective System Council ambition to cover minimum overhead costs requested by Centers
PROCESSES
The opportunity By resolving long-standing challenges in CGIARrsquos financing system this can build the needed confidence in CGIAR financing so that reliability percentage share and absolute level of overall and system financing can be maintained and even increased
Sub-section 32A 5-point plan to improve System funding modalities
SECTION 3 PROCESSES
34
32 - Point 3 - Clarify Approach to allocation within and between cycles
Between business cycles During each 3-year business cyclePotential reset of starting point in funding across system Fundamental reconsideration of balance of funding between key focus areasprogram themes based on the list of prioritization criteria set out in the Council Paper on an allocation strategy referenced above
Tool simulation tool that aligns potential programs with broader strategic SLOhigher level outcomes potentially also collecting and presenting relevant available information on strategic fit and performance
Overall output of process Program-level W12 funding targets for subsequent business cycle period
Methodology Annual review of funding targets and W1 forward allocations to take into account any exceptional changes -particularly changes in strategic considerations such as a changing risk context (eg new pestdisease) or a potential new funding opportunity
SECTION 3 PROCESSES
Starting premiseThe budgeting process leading to the CRPPlatforms funding request as presented to the System Council in September 2016 was sufficiently robust and detailed to guide funding allocations for the remaining 3-year period of CRPsplatforms
Concept for initial 2019-2021 Business PlanFunding and program planning would be substantiated bybull A 3-year indicative workplan underpinning the
Business Plan and subjected to potential alterations resulting from the breeding initiative or other potential modifications to the current Portfolio
bull Detailed annual programmatic planning through the existing workplan and budgeting process
Key recognitionThe budgeting process for the implementation periods from 2022 needs to learn and evolve from that undertaken in 2015
35
32 - Point 3 - Portfolio Budgets Allocation baseline
Budget by expense category
Funding Plan
SECTION 3 PROCESSES
36
32 - Point 3 - A starting point for ldquobaseline funding targetsrdquo for 2019-2021 Business Plan (Note subject to potential revision for final draft Plan)
W1amp2 proposed budget ($USm original proposals) 2019 2020 2021 Total BaseGrain Legumes and Dryland Cereals 121 127 133 381Fish 74 78 82 233Forests Trees and Agroforestry 120 125 131 377Livestock 223 235 246 704Maize 125 131 138 394Rice 171 175 179 524Roots Tubers and Bananas 243 253 263 760Wheat 165 174 182 521Agriculture 4 Nutrition and Health 218 227 238 683Climate Change Agriculture and Food Security 232 243 255 730Policies Institutions and Markets 194 194 200 587Water Land and Ecosystems 110 116 122 348Genebanks 188 153 132 472Excellence in Breeding 22 23 24 70Big Data 52 45 43 139
Total Portfolio Base Budget 2258 2299 2368 6923
hellipThus - the September 2016 submitted budgets would form the starting point of discussions with the SMB and System Council on the funding targets for the 2019-2021 period as informed by any updated program platform information and any new elements or key changes to the Portfolio
SECTION 3 PROCESSES
A possible goal of the initial 2019-2021 business plan is to explore appropriate incentives to reduce the number of projects that are less than $200K by [X ndash for discussion and agreement]
37
32 - Point 4 - Efficiency Optimal funding received to manage down transaction costs
Ave Annual Grant 2012 2013 2014 2015 2016gt1m 167 182 205 225 212 500k - 999k 175 183 202 224 214 200k - 499k 424 466 454 457 463 lt200k 1674 1570 1280 1356 1398 Total no of projects 2440 2401 2141 2262 2287
Centers continue to manage a large number of restricted W3 and bilateral projects
0
200
400
600
800
1000
1200
2011 2012 2013 2014 2015 2016 2017(est)
Sources of Revenue $million
Bilateral amp other CGIAR Fund W3
0
500
1000
1500
2000
2500
3000
2012 2013 2014 2015 2016
No of W3 and Bilateral Projects
gt1m 500k - 999k 200k - 499k lt200k
2012 2013 2014 2015 2016 -
200
400
600
800
1000
1200
Total Annual Grants Pledged $million
gt1m 500k - 999k 200k - 499k lt200k

SECTION 1 STRATEGY SECTION 2 STRUCTURE SECTION 3 PROCESSES SECTION 4 REWARDS SECTION 5 PEOPLE
16
Focusing on reducing fragmentation driving efficiency and increasing value for money
The contextbull From slide 2 above the first of the twin goals of the proposed first CGIAR
business plan is to modernize and improve todayrsquos CGIAR recognizing that doing the same thing in the same way as we have been doing cannot adequately leverage CGIARrsquos capabilities in what is an increasingly changing environment - both in terms of
- Exponential technological institutional and social change and - In the operating context of multiple new stakeholders entering what is
a progressively competitive space for agricultural research for development
bull To set itself up for successful implementation of successive business plans CGIAR will quickly address several structuralinstitutional andor operational barriers that create unnecessary (and inevitably costly) fragmentation in our work
bull Some initiatives are well underway in their strategic planning (eg the multi-Funder initiative on breeding and the System Councilrsquos rethinking of the role of its advisory services thus impacting the role that such bodies will play in the forthcoming business cycle) Others are at a more experimental stage of consideration and will require more analysis to take forward
Section 2 ndash Structure
Image source ndash selected extracts from presentation of John Hagel co-chairman for Deloitte LLPs Center for the Edge titled lsquoInstitutional Innovationrsquo 16 February 2015
Institutional Innovation is about
SECTION 2 STRUCTURE
The opportunityBuilding on the 2016 CGIAR reform andintensive interactions across Centers inpreparation of the business plan it isintended that it will elaborate concretepathways and measures during the 3-yearimplementation period bringing essentialsynergies to the institutional arrangementsthrough which we work
17
Section 2 ndash Structure
The ideas
21 Deeper System-wide cooperation and alignment
22 Enhancing CGIAR assets and response preparedness
23 Strengthened collaboration with delivery partners
More detail
Slides 18-19
Slide 20
Slide 21
Catalyzing institutional innovation
SECTION 2 STRUCTURE
18
STRUCTURE
Sub-section 21Deeper System-wide cooperation and alignment
Theme Potential details for inclusion in the initial 3-year business plan
Enhanced Center alliances to harness synergies
Space to reflect on any progress in ongoing discussions between several Centers on deeper alliances the increase cooperation and alignment to harness synergies accelerate impact and drive efficiencies Will depend on any voluntary actions taken by Centers ndash and not mandated within any Business Plan period Center inputs to date suggest that such actions could potentially include i) any scope for deeper institutional ties between compatible Centers ii) any scope for common Board membershipBoard leadership between compatible Centers iii) any scope for system-wide efforts between Centers to move to a more structured plan of having some level of common Board membersBoard leadership
New shared services to achieve improved institutional efficiency
Shared services not only allow the achievement of institutional cost savings but also institutional efficiencies thereby providing value for money in staff time Centers are proposing to identify a selected set of key areas where they can utilize economies of scale to deliver substantial staff time andor cost savings Scoping work across the 2018 calendar year will identify potential areas for implementation ndash potentially including purchasing efficiencies a common policy nomenclature framework and storage system to facilitate strengthened cross-System best practices sharing and learning andor financial systems further alignment
Modernizing and increasing research data availability
Identify ways to further leverage Big Data capabilities and transform the agricultural R4D sector building on the innovations being introduced through the lsquoGlobal Agricultural Research Data Innovation amp Acceleration Networkrsquo (lsquoGARDIAN toolrsquo) as showcased on the page that follows
Efficiencies in Advisory services
(Led by System Council)
As set out System Council meeting paper SC6-06 SIMEC Think-piece on the future of CGIARrsquos advisory bodies CGIARrsquos Funders have identified the opportunity to (i) improved efficiency (ii) improved communication between the services and the System (iii) improved and systematic linkages between science and development (iv) higher ownership of the advice produced by the services by the System (v) while also ensuring independence of the content-matter of the advice
SECTION 2 STRUCTURE
The opportunityThrough the BigData platform lsquoGARDIANrsquo initiative for CGIAR to be seen as global leader in providing findable accessible interoperable and reusable (lsquoFAIRrsquo) data and publications by year by Center by country and research theme in a seamless and open way
19
21 Deeper System-wide cooperation and alignment Modernizing and increasing research data availability
The ideas1 Incentivize the sharing of high quality interoperable datasets
over progressive business plan cycles (almost 100000 publications and over 2100 datasets are already discoverable but great potential exists) CGIAR Program Performance Management Standards (described below ndash slide 32) can help support this
2 Develop rate analytics and visualization functionalities to facilitate innovative and actionable solutions from the agricultural data generated by CGIAR and its partners
SECTION 2 STRUCTURE
20
Sub-section 22Enhancing CGIAR assets and response preparedness
STRUCTURE
The opportunityLearning from the experience in Fall Armyworm more effectively demonstrate and further build CGIARrsquos ability to respond rapidly to emerging crises such as pests and epidemics ndashwith a focus on ensuring that we have the right systems aligned to be able to contribute to global discussions and follow up in a coordinated way
Initial ideasbull Identifying capacity from within the
System to act as a clearly identifiable coordination point internally and externally (eg appoint Special Envoys dedicated portals for information dissemination etc)
bull Exploration of optimum and efficient responsive funding arrangements for emerging crises such as new pests and diseases
SECTION 2 STRUCTURE
The opportunity
Increasing the reach and impact of CGIAR research activities CGIAR is dependent on partnerships for getting its research disseminated and scaled for development impact Through a more strategic alignment with delivery partners CGIAR research and innovation will have a greater adoption reach and ultimately impact
The ideas
bull Private Sector collaboration Private sector has a significant role to play not only as an upstream partner in providing access to advanced technology and specialized expertise but also as a downstream partner in providing access to markets and enabling the scaling -up and out of our research outputs
bull Country collaboration Through a Country Collaboration approach CGIAR can catalyze the development of a collective CGIAR role and impact scenario in countries in which CGIAR has a significant presence based on meaningful synergies across CGIAR entities National Governments National Systems and other partners to develop strategies and deliver programs directly aligned to key country priorities This can create an enabling environment for other partnerships and delivery initiatives
bull A CGIAR Rome Hub Increasing contribution and relevance of CGIAR in the crossroads of the global food security dialogue and with the major impact delivery partners based on Rome A consolidated CGIAR premises with capacity from Centers and CRPs SMO successors to ISPC SPIA and IEA Internal Audit Function and flex space for visiting Center staffDGs
bull MDB cooperation Establishing structures and potential mechanism(s) for CGIAR knowledge innovation and tools to contribute to design baseline implementation MampE of major development programs in the multilateral development banks
21
23 Strengthened collaboration with delivery partners
The below image is a possible collaboration maturity model where collaboration efforts in particular Countries could be represented in terms of particular stages at a given time and be used to establish collaboration aspirations and activities in those Countries
SECTION 1 STRATEGY SECTION 2 STRUCTURE SECTION 3 PROCESSES SECTION 4 REWARDS SECTION 5 PEOPLE
22
Defining and improving
The opportunity
For CGIAR to be more effectiveand efficient in the delivery ofits programs and systems anddemonstrate this in a morecompelling way to furtherstrengthen trust and supportFeatured in this section are aselection of key processesrequiring strengthening
Selected ideas
31 A program performance management framework
32 A 5-point plan to improve System funding modalities
33 A 4-point plan for an aligned assurance system
Section 3 ndash Processes
More detail
Slides 23-32
Slides 33-38
Slides 39-40
SECTION 3 PROCESSES
23
PROCESSES
Sub-section 31A program performance management framework
The opportunityTo set out an approach to program performance management that is credible and can drive improvements over time ndash providing assurance to key stakeholders
Mechanisms to achieve goal
bull Strengthening reporting and learning from outputs and outcomes of past research
bull Improving management of current program performance
bull Developing components to improve decision-making about future research funding
SECTION 3 PROCESSES
24
31 A program performance management framework
12 Framework Components
Past results reporting1 CGIAR Annual Performance Report2 CRPsPlatform reporting
requirements 3 Common results reporting indicators4 Outcome and impact case studies5 Program Results Dashboard6 Past Evaluations7 Impact Assessments
Present improved management8 Within-cycle reviews and evaluations9 Program Performance
Management Standards
Future improved decision-making10 Quality at Entry Assessment11 Planning landscape12 Allocation criteria and tool
SECTION 3 PROCESSES
The opportunity To pilot a new approach to annual reporting to improve accountability and give confidence to Funders and key supporting partners by (i) a more focused looking-back at achievements from completed research (ii) reflecting on the current CGIAR research portfolio and (iii) reviewing progress and plans for continued improvements in performance
Timelinebull In 2018 the annual report will be published at the end of September The planning and reporting cycle is later than
usual due to new systems being implementedbull Planning and reporting cycles will be revised in 2019 so that the publication will be finalized earlier in the year
25
31 - Annual CGIAR Performance Report a new approach (component 1)
The 2018 report under preparationbull Aims to interest a critical (non-researcher) audience that is
looking for serious discussion of issues and evidencebull Represent a range of voices from across CGIAR and partnersbull Demonstrate progress towards CGIAR goals (SRF) while
reflecting on the approaches and partnerships that promote impact
bull Reflect on the value added of CGIAR Research Programs and Platforms working in Research Centers to deliver results
bull Reflect on how funding has been able to support system goalsbull Incorporate available results from the new reporting systems (to
be introduced in late 2018)
Building on 2018 reports for 2019 and beyond will also incorporatebull New program results dashboard Highlights from the interactive
CGIAR dashboard capturing research innovations outcomes and impacts
It will report and reflect on progress towards CGIARs goals tobull Modernize improve and stabilizebull Provide an enabling environment to improve quality and deliver
impactbull Build an efficient system with reduced transaction costsbull Strengthen and diversify funding (new collaborations initiatives)
to enable a longer-term funding basebull Attract retain and build the highest quality staff
2018 Introducing new reporting approach 2019 harmonization with new CGIAR Business Plan Cycle
SECTION 3 PROCESSES
Selected ideas bull Deliver data interoperability and consolidation from
multiple source systems (including lsquoGARDIANrsquo tool discussed earlier on slide 19) with data interfacing and storage on a central database
bull The on-line results reporting system will be used going forward to streamline the creation of the Annual CGIAR Performance Report
bull The dashboard mockup on the following slides provides visualization ideas aligned with current operational CGIAR Results Reporting guidance
26
31 - A new CGIAR Program Results Dashboard (component 5)
The opportunityThrough making use of modern visualization technology CGIAR will be able to provide real-time program information to Funders partners and other stakeholders via wwwcgiarorg
Filtering will be possible by programplatform by year by outcomeimpact on the ground (by country) and by innovation stage
SDG
Find information by
Program Platform
Partner Institutions
2016 2017 2018
22
Policies
231
Innovation by Stage Peer-reviewed Papers
1918
Partnerships
475 1555
Trainees
Financials
Budget Allocation by CRPPTF
CRP Funding Update
This selection allows filtering of all elements of the page by year
On the home page the heat map indicates the number of evidences by region
5 reporting indicators are highlighted on the home page By clicking on an indicator the user navigates to a more detailed page on innovations policies etc
All pages of the dashboard contain links to search information related to
SDGs CRPs and partners
CGIAR Program Results DashboardProgress towards
System Level Outcomes (SLOs)
Reporting Indicators
28
SLO SDGThe distribution of evidences can be displayed by SLO or by SDG
North AfricaProgress towards SLO 4 evidences reportedOutcome case studies 10 case studies reportedPolicies 5 policies enactedInnovation by stage 10 in stage 4Partnership 50 partners work with usParticipants 15000 people involved in our activitiesTrainees 150 people trainedPeer-reviewed papers 193 in ISI journals
By hovering over a region a window displays key information that is geographically tagged By
clicking on the region the user navigates to the next page
27
SDG
Find information by
Program Platform
Partner Institutions
2016 2017 2018
3
Policies
23
Innovation by Stage Peer-reviewed Papers
1918
Partnerships
41 123
Trainees
Outcome Case Studies
Case Study Title CRPPTF
Adoption of citizen science methodology shapes new linkages between researchers and farmers for climate adaptation
CCAFS
De Brauw 2016 showed that biofortified OFSP varieties have disseminated to an estimated 289M households in 12 SSA countries (125 grams per day meets the daily vitamin A requirement of a child under five)
RTB
CIMMYT FAO and the World Bank found in Kazakhstan that spring wheat yields are as much as 58 higher under (widely-adopted) zero tillage introduced by WHEAT than with conventional technologies
WHEAT
RTB - 2017Western AfricaAdoption of citizen science methodology shapes new linkages between researchers and farmers for climate adaptationSLO Target 21 Improve the rate of yield increase for major food staples from current lt1 to 12-15 per yearIDOSub-IDO 132 Increased livelihood opportunitiesA14 Enhanced capacity to deal with climatic risks and extremesCross-cutting Gender Youth
Outcome Impact on the Ground
This page displays outcome case studies related to a specific region Clicking on the pin displays information on the case study
All case studies for the selected region are listed in this table
CGIAR Program Results Dashboard
Reporting Indicators
Progress towards System Level Outcomes (SLOs)
4
SLO SDG
28
SDG
Program Platform
Partner Institutions
2016 2017 2018
Fish ndash Stage 3 Innovations
Innovation by Stage
9
Innovation Innovation Type
Base populations established for new breeding program of Catla and Silver carps established (Bangladesh) Genetics
Genetic assessment of juvenile rearing methods of Rohu carp (2 Journal articles[1]) Genetics
New knowledge on sex determining genes feed efficiency and resilience in tilapia (journal articles) Genetics
Genomic databases for rohu catla and silver carps Bangladesh) Genetics
Dissemination plans for improved tilapia dissemination prepared with national partners in Cambodia and Myanmar (Practice notes Working papers) Genetics
Clicking on a specific program innovation stage filters rows of the Innovations table accordingly
FISH
Heat map now based on number of innovations per region
Innovation by StageCGIAR Program Results Dashboard
29
SDG
Program Platform
Partner Institutions
2016 2017 2018
CCAFS ndash Peer-reviewed Papers
Journal Paper Journal Open Access ISI
Complete Genome Sequence of Rice hoja blanca tenuivirus Isolated from a Susceptible Rice Cultivar in Colombia Theoretical and Applied Genetics
Common Bean Genomes Mining New Knowledge of a Major Societal Crop Field Crops Research
Breeding implications of drought stress under future climate for upland rice in Brazil Agriculture Ecosystems and Environment
Landscape context does not constrain biological control of Phenacoccus manihoti in intensified cassava systems of southern Vietnam
Agronomy for Sustainable Development
Peer-reviewed Papers
0 10 20 30
FISH
FTA
LIVESTOCK
MAIZE
RICE
RTB
WHEAT
GLDC
A4NH
CCAFS
PIM
WLE
GENEBANK
EiB
BIG DATA
CRP
PTF
Clicking on a specific program filters information on the page accordingly
135
135
CCAFS ndash Social AttentionTop 10 publications by Altmetric score
Publication Score Date View on Altmetric
Natural climate solutions 810 16-10-17 Details page URL
Farming and the geography of nutrient production for human use a transdisciplinary analysis 191 01-04-17 Details page URL
Linking regional stakeholder scenarios and shared socioeconomic pathways Quantified West African food and climate futures in a global context
126 01-03-17 Details page URL
Agriculture production as a major driver of the Earth system exceeding planetary boundaries 107 12-10-17 Details page URL
10 best bet innovations for adaptation in agriculture A supplement to the UNFCCC NAP Technical Guidelines 48 02-11-17 Details page URL
Greenhouse gas emissions from agricultural food production to supply Indian diets Implications for climate change mitigation 40 01-01-17 Details page URL
Special issue on climate-smart agriculture (CSA) 34 13-05-17 Details page URL
lsquoCSA-Planrsquo strategies to put Climate-Smart Agriculture (CSA) into practice 27 06-06-17 Details page URL
Clicking on the link takes the user to the
Altmetric page from which the article can be
accessed
Peer-reviewed PapersCGIAR Program Results Dashboard
Clicking here allows to view a specific program page accordingly
30
5
Policies
6
Innovation by Stage Peer-reviewed Papers
1918
Partnerships
34
Outcome Case StudiesCase Study Title CRP
Describing the rice production context in Latin America policy briefs on rice to the FLAR member countries
RICE
15
Progress Towards Milestones
Flagship Project 1Mapped and contributing to Sub-IDO
2022 CRP outcomes (from proposal)
MilestoneAssessment of risk to achievement (LMH)
Milestone 11 Increased capacity for innovation in partner research organizations
Foresight analyses and priority setting used by RICE and partner scientists to develop and target technology options
Application of the rice monitoring system for national food security program in Cambodia supporting Thailand disaster relief program for rice farmers crop insurance implementation in Tamil Nadu India Cambodia and Mekong River Delta Vietnam and development of remote sensing based rice monitoring system for Bihar India
L support from national partners
Milestone 12 Improved capacity of women and young people to participate in decision-making
Improved role in decision making by women and youth in rice value chains as evidenced by empowerment measures at key action sites
Gender-youth business models in rice value chain reinforced through better understanding of changing roles on decision making of women and youth in rice farming
M Dependence on support from national partners and governments
Flagship project 1 Accelerating impact and equity
Budget by Window of Funding
Filter by Program Year and Flagship
2018
Reporting Indicators
CRP Staffing
Clicking on any indicator will provide the details available in the table below
Link to Program Information on cgiarorgLinkRICE
CGIAR Program Results Dashboard
31
SECTION 3 PROCESSES
32
31 - Program Performance Management Standards (component 9)
The opportunity to strengthen incentives for high-quality program performance management and provide greater assurance to the SMB and System Council
The ideasbull Adoption of a limited set of program
performance standards for each business cycle in response to the challenges of performance assessment inherent in the variety complexity technical specificity and timelines of the research programs
bull Minimum standards required would change be raised over successive business cycles
bull Specific standards to be agreed with Funders CRPsCenters and SMB
bull Would complement and build on other elements of framework ndash egevaluation
32
Minimum standardsexamples of possible measures for Cycle 1 Rationale assumptions Examples of
measurement optionsReliabilityCredibilityProgram governance structures provide an effective challenge and verification function for management prioritization of research including consideration of future scenarios
Program governance (eg steering committees) should provide an effective specialist technical critique and challenge for prioritization decisions
Evaluation of structures and processes based on agreed quality criteria Qualitative passfail
Relevance and DeliveryEffectivenessgt80 of the Programrsquos projects document a clear and credible impact pathway with a clear product and delivery pathway in mind (appropriate to stage of maturity of research)
Written impact pathways are one good way to check a clear lsquooutcome focusrsquo as well as whether the assumptions are credible
Verification of a random sample of projects with W1W2 funding or co-funding based on agreed quality criteria
Delivery Effectiveness and ReputationLegitimacyKey research project documents for each program are available electronically on a central MIS system or another system accessible by central system advisory bodies (covering gt80 of total research budget)
Availability of project documents is a lsquoboring but importantrsquo necessary step for internal assessments of aspects such as impact pathways (above)
Availability of documents checked
ReputationLegitimacyProgram has processes or contracts in place to ensure appropriate ethical approval for all projects [IRB is primary responsibility of Centers]
Ethical approval processes (IRB) are an important part of ensuring ethical work with human subjects
Evaluation of processes and a sample of decisions based on agreed criteria Qualitative passfail
SECTION 3 PROCESSES
33
The 5 points Description
1 Adopt A multi-year pledging process for W1 amp W2 ndash with multi-year pledging at CRPplatform (and flagship where desired) level
A central objective of business plan is to increase the share of multi-annual pledges and to translate these into multi-annual pledges at the CRPplatform level ndash transforming the level of forward predictability for the shared science agenda through W1 ampW2
2 Revise Use of W1 to change the internal hydraulics
De-link W1 from W2 in terms of its ex post ldquoshock absorbingrdquo within each financial year but continue to link W1 to W2 to support the rebalancing of funding ex ante at the start of the multi--year funding period based on W2 forward pledgescommitments
3 Clarify Approach to allocation within and between cycles
Clarification of between and within business-cycle approaches alongside adoption of a funding target-setting approach to guide funding decisions over the remaining time in the current portfolio
4 Efficiency Optimal funding received to manage down transaction costs
Re-concentrate funding in large pooled programs and decrease number of small W3bilateral projects
5 Recovery Full overhead costs of projects
Adoption of collective System Council ambition to cover minimum overhead costs requested by Centers
PROCESSES
The opportunity By resolving long-standing challenges in CGIARrsquos financing system this can build the needed confidence in CGIAR financing so that reliability percentage share and absolute level of overall and system financing can be maintained and even increased
Sub-section 32A 5-point plan to improve System funding modalities
SECTION 3 PROCESSES
34
32 - Point 3 - Clarify Approach to allocation within and between cycles
Between business cycles During each 3-year business cyclePotential reset of starting point in funding across system Fundamental reconsideration of balance of funding between key focus areasprogram themes based on the list of prioritization criteria set out in the Council Paper on an allocation strategy referenced above
Tool simulation tool that aligns potential programs with broader strategic SLOhigher level outcomes potentially also collecting and presenting relevant available information on strategic fit and performance
Overall output of process Program-level W12 funding targets for subsequent business cycle period
Methodology Annual review of funding targets and W1 forward allocations to take into account any exceptional changes -particularly changes in strategic considerations such as a changing risk context (eg new pestdisease) or a potential new funding opportunity
SECTION 3 PROCESSES
Starting premiseThe budgeting process leading to the CRPPlatforms funding request as presented to the System Council in September 2016 was sufficiently robust and detailed to guide funding allocations for the remaining 3-year period of CRPsplatforms
Concept for initial 2019-2021 Business PlanFunding and program planning would be substantiated bybull A 3-year indicative workplan underpinning the
Business Plan and subjected to potential alterations resulting from the breeding initiative or other potential modifications to the current Portfolio
bull Detailed annual programmatic planning through the existing workplan and budgeting process
Key recognitionThe budgeting process for the implementation periods from 2022 needs to learn and evolve from that undertaken in 2015
35
32 - Point 3 - Portfolio Budgets Allocation baseline
Budget by expense category
Funding Plan
SECTION 3 PROCESSES
36
32 - Point 3 - A starting point for ldquobaseline funding targetsrdquo for 2019-2021 Business Plan (Note subject to potential revision for final draft Plan)
W1amp2 proposed budget ($USm original proposals) 2019 2020 2021 Total BaseGrain Legumes and Dryland Cereals 121 127 133 381Fish 74 78 82 233Forests Trees and Agroforestry 120 125 131 377Livestock 223 235 246 704Maize 125 131 138 394Rice 171 175 179 524Roots Tubers and Bananas 243 253 263 760Wheat 165 174 182 521Agriculture 4 Nutrition and Health 218 227 238 683Climate Change Agriculture and Food Security 232 243 255 730Policies Institutions and Markets 194 194 200 587Water Land and Ecosystems 110 116 122 348Genebanks 188 153 132 472Excellence in Breeding 22 23 24 70Big Data 52 45 43 139
Total Portfolio Base Budget 2258 2299 2368 6923
hellipThus - the September 2016 submitted budgets would form the starting point of discussions with the SMB and System Council on the funding targets for the 2019-2021 period as informed by any updated program platform information and any new elements or key changes to the Portfolio
SECTION 3 PROCESSES
A possible goal of the initial 2019-2021 business plan is to explore appropriate incentives to reduce the number of projects that are less than $200K by [X ndash for discussion and agreement]
37
32 - Point 4 - Efficiency Optimal funding received to manage down transaction costs
Ave Annual Grant 2012 2013 2014 2015 2016gt1m 167 182 205 225 212 500k - 999k 175 183 202 224 214 200k - 499k 424 466 454 457 463 lt200k 1674 1570 1280 1356 1398 Total no of projects 2440 2401 2141 2262 2287
Centers continue to manage a large number of restricted W3 and bilateral projects
0
200
400
600
800
1000
1200
2011 2012 2013 2014 2015 2016 2017(est)
Sources of Revenue $million
Bilateral amp other CGIAR Fund W3
0
500
1000
1500
2000
2500
3000
2012 2013 2014 2015 2016
No of W3 and Bilateral Projects
gt1m 500k - 999k 200k - 499k lt200k
2012 2013 2014 2015 2016 -
200
400
600
800
1000
1200
Total Annual Grants Pledged $million
gt1m 500k - 999k 200k - 499k lt200k
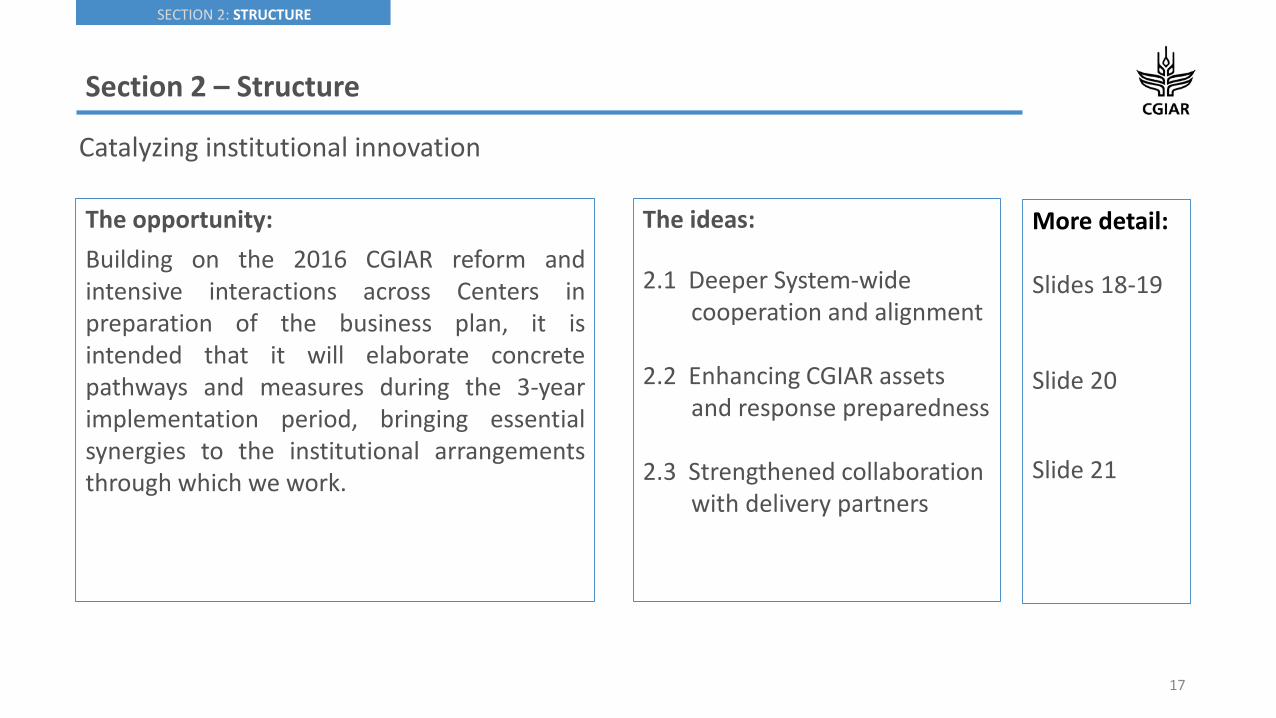
SECTION 2 STRUCTURE
The opportunity
Increasing the reach and impact of CGIAR research activities CGIAR is dependent on partnerships for getting its research disseminated and scaled for development impact Through a more strategic alignment with delivery partners CGIAR research and innovation will have a greater adoption reach and ultimately impact
The ideas
bull Private Sector collaboration Private sector has a significant role to play not only as an upstream partner in providing access to advanced technology and specialized expertise but also as a downstream partner in providing access to markets and enabling the scaling -up and out of our research outputs
bull Country collaboration Through a Country Collaboration approach CGIAR can catalyze the development of a collective CGIAR role and impact scenario in countries in which CGIAR has a significant presence based on meaningful synergies across CGIAR entities National Governments National Systems and other partners to develop strategies and deliver programs directly aligned to key country priorities This can create an enabling environment for other partnerships and delivery initiatives
bull A CGIAR Rome Hub Increasing contribution and relevance of CGIAR in the crossroads of the global food security dialogue and with the major impact delivery partners based on Rome A consolidated CGIAR premises with capacity from Centers and CRPs SMO successors to ISPC SPIA and IEA Internal Audit Function and flex space for visiting Center staffDGs
bull MDB cooperation Establishing structures and potential mechanism(s) for CGIAR knowledge innovation and tools to contribute to design baseline implementation MampE of major development programs in the multilateral development banks
21
23 Strengthened collaboration with delivery partners
The below image is a possible collaboration maturity model where collaboration efforts in particular Countries could be represented in terms of particular stages at a given time and be used to establish collaboration aspirations and activities in those Countries
SECTION 1 STRATEGY SECTION 2 STRUCTURE SECTION 3 PROCESSES SECTION 4 REWARDS SECTION 5 PEOPLE
22
Defining and improving
The opportunity
For CGIAR to be more effectiveand efficient in the delivery ofits programs and systems anddemonstrate this in a morecompelling way to furtherstrengthen trust and supportFeatured in this section are aselection of key processesrequiring strengthening
Selected ideas
31 A program performance management framework
32 A 5-point plan to improve System funding modalities
33 A 4-point plan for an aligned assurance system
Section 3 ndash Processes
More detail
Slides 23-32
Slides 33-38
Slides 39-40
SECTION 3 PROCESSES
23
PROCESSES
Sub-section 31A program performance management framework
The opportunityTo set out an approach to program performance management that is credible and can drive improvements over time ndash providing assurance to key stakeholders
Mechanisms to achieve goal
bull Strengthening reporting and learning from outputs and outcomes of past research
bull Improving management of current program performance
bull Developing components to improve decision-making about future research funding
SECTION 3 PROCESSES
24
31 A program performance management framework
12 Framework Components
Past results reporting1 CGIAR Annual Performance Report2 CRPsPlatform reporting
requirements 3 Common results reporting indicators4 Outcome and impact case studies5 Program Results Dashboard6 Past Evaluations7 Impact Assessments
Present improved management8 Within-cycle reviews and evaluations9 Program Performance
Management Standards
Future improved decision-making10 Quality at Entry Assessment11 Planning landscape12 Allocation criteria and tool
SECTION 3 PROCESSES
The opportunity To pilot a new approach to annual reporting to improve accountability and give confidence to Funders and key supporting partners by (i) a more focused looking-back at achievements from completed research (ii) reflecting on the current CGIAR research portfolio and (iii) reviewing progress and plans for continued improvements in performance
Timelinebull In 2018 the annual report will be published at the end of September The planning and reporting cycle is later than
usual due to new systems being implementedbull Planning and reporting cycles will be revised in 2019 so that the publication will be finalized earlier in the year
25
31 - Annual CGIAR Performance Report a new approach (component 1)
The 2018 report under preparationbull Aims to interest a critical (non-researcher) audience that is
looking for serious discussion of issues and evidencebull Represent a range of voices from across CGIAR and partnersbull Demonstrate progress towards CGIAR goals (SRF) while
reflecting on the approaches and partnerships that promote impact
bull Reflect on the value added of CGIAR Research Programs and Platforms working in Research Centers to deliver results
bull Reflect on how funding has been able to support system goalsbull Incorporate available results from the new reporting systems (to
be introduced in late 2018)
Building on 2018 reports for 2019 and beyond will also incorporatebull New program results dashboard Highlights from the interactive
CGIAR dashboard capturing research innovations outcomes and impacts
It will report and reflect on progress towards CGIARs goals tobull Modernize improve and stabilizebull Provide an enabling environment to improve quality and deliver
impactbull Build an efficient system with reduced transaction costsbull Strengthen and diversify funding (new collaborations initiatives)
to enable a longer-term funding basebull Attract retain and build the highest quality staff
2018 Introducing new reporting approach 2019 harmonization with new CGIAR Business Plan Cycle
SECTION 3 PROCESSES
Selected ideas bull Deliver data interoperability and consolidation from
multiple source systems (including lsquoGARDIANrsquo tool discussed earlier on slide 19) with data interfacing and storage on a central database
bull The on-line results reporting system will be used going forward to streamline the creation of the Annual CGIAR Performance Report
bull The dashboard mockup on the following slides provides visualization ideas aligned with current operational CGIAR Results Reporting guidance
26
31 - A new CGIAR Program Results Dashboard (component 5)
The opportunityThrough making use of modern visualization technology CGIAR will be able to provide real-time program information to Funders partners and other stakeholders via wwwcgiarorg
Filtering will be possible by programplatform by year by outcomeimpact on the ground (by country) and by innovation stage
SDG
Find information by
Program Platform
Partner Institutions
2016 2017 2018
22
Policies
231
Innovation by Stage Peer-reviewed Papers
1918
Partnerships
475 1555
Trainees
Financials
Budget Allocation by CRPPTF
CRP Funding Update
This selection allows filtering of all elements of the page by year
On the home page the heat map indicates the number of evidences by region
5 reporting indicators are highlighted on the home page By clicking on an indicator the user navigates to a more detailed page on innovations policies etc
All pages of the dashboard contain links to search information related to
SDGs CRPs and partners
CGIAR Program Results DashboardProgress towards
System Level Outcomes (SLOs)
Reporting Indicators
28
SLO SDGThe distribution of evidences can be displayed by SLO or by SDG
North AfricaProgress towards SLO 4 evidences reportedOutcome case studies 10 case studies reportedPolicies 5 policies enactedInnovation by stage 10 in stage 4Partnership 50 partners work with usParticipants 15000 people involved in our activitiesTrainees 150 people trainedPeer-reviewed papers 193 in ISI journals
By hovering over a region a window displays key information that is geographically tagged By
clicking on the region the user navigates to the next page
27
SDG
Find information by
Program Platform
Partner Institutions
2016 2017 2018
3
Policies
23
Innovation by Stage Peer-reviewed Papers
1918
Partnerships
41 123
Trainees
Outcome Case Studies
Case Study Title CRPPTF
Adoption of citizen science methodology shapes new linkages between researchers and farmers for climate adaptation
CCAFS
De Brauw 2016 showed that biofortified OFSP varieties have disseminated to an estimated 289M households in 12 SSA countries (125 grams per day meets the daily vitamin A requirement of a child under five)
RTB
CIMMYT FAO and the World Bank found in Kazakhstan that spring wheat yields are as much as 58 higher under (widely-adopted) zero tillage introduced by WHEAT than with conventional technologies
WHEAT
RTB - 2017Western AfricaAdoption of citizen science methodology shapes new linkages between researchers and farmers for climate adaptationSLO Target 21 Improve the rate of yield increase for major food staples from current lt1 to 12-15 per yearIDOSub-IDO 132 Increased livelihood opportunitiesA14 Enhanced capacity to deal with climatic risks and extremesCross-cutting Gender Youth
Outcome Impact on the Ground
This page displays outcome case studies related to a specific region Clicking on the pin displays information on the case study
All case studies for the selected region are listed in this table
CGIAR Program Results Dashboard
Reporting Indicators
Progress towards System Level Outcomes (SLOs)
4
SLO SDG
28
SDG
Program Platform
Partner Institutions
2016 2017 2018
Fish ndash Stage 3 Innovations
Innovation by Stage
9
Innovation Innovation Type
Base populations established for new breeding program of Catla and Silver carps established (Bangladesh) Genetics
Genetic assessment of juvenile rearing methods of Rohu carp (2 Journal articles[1]) Genetics
New knowledge on sex determining genes feed efficiency and resilience in tilapia (journal articles) Genetics
Genomic databases for rohu catla and silver carps Bangladesh) Genetics
Dissemination plans for improved tilapia dissemination prepared with national partners in Cambodia and Myanmar (Practice notes Working papers) Genetics
Clicking on a specific program innovation stage filters rows of the Innovations table accordingly
FISH
Heat map now based on number of innovations per region
Innovation by StageCGIAR Program Results Dashboard
29
SDG
Program Platform
Partner Institutions
2016 2017 2018
CCAFS ndash Peer-reviewed Papers
Journal Paper Journal Open Access ISI
Complete Genome Sequence of Rice hoja blanca tenuivirus Isolated from a Susceptible Rice Cultivar in Colombia Theoretical and Applied Genetics
Common Bean Genomes Mining New Knowledge of a Major Societal Crop Field Crops Research
Breeding implications of drought stress under future climate for upland rice in Brazil Agriculture Ecosystems and Environment
Landscape context does not constrain biological control of Phenacoccus manihoti in intensified cassava systems of southern Vietnam
Agronomy for Sustainable Development
Peer-reviewed Papers
0 10 20 30
FISH
FTA
LIVESTOCK
MAIZE
RICE
RTB
WHEAT
GLDC
A4NH
CCAFS
PIM
WLE
GENEBANK
EiB
BIG DATA
CRP
PTF
Clicking on a specific program filters information on the page accordingly
135
135
CCAFS ndash Social AttentionTop 10 publications by Altmetric score
Publication Score Date View on Altmetric
Natural climate solutions 810 16-10-17 Details page URL
Farming and the geography of nutrient production for human use a transdisciplinary analysis 191 01-04-17 Details page URL
Linking regional stakeholder scenarios and shared socioeconomic pathways Quantified West African food and climate futures in a global context
126 01-03-17 Details page URL
Agriculture production as a major driver of the Earth system exceeding planetary boundaries 107 12-10-17 Details page URL
10 best bet innovations for adaptation in agriculture A supplement to the UNFCCC NAP Technical Guidelines 48 02-11-17 Details page URL
Greenhouse gas emissions from agricultural food production to supply Indian diets Implications for climate change mitigation 40 01-01-17 Details page URL
Special issue on climate-smart agriculture (CSA) 34 13-05-17 Details page URL
lsquoCSA-Planrsquo strategies to put Climate-Smart Agriculture (CSA) into practice 27 06-06-17 Details page URL
Clicking on the link takes the user to the
Altmetric page from which the article can be
accessed
Peer-reviewed PapersCGIAR Program Results Dashboard
Clicking here allows to view a specific program page accordingly
30
5
Policies
6
Innovation by Stage Peer-reviewed Papers
1918
Partnerships
34
Outcome Case StudiesCase Study Title CRP
Describing the rice production context in Latin America policy briefs on rice to the FLAR member countries
RICE
15
Progress Towards Milestones
Flagship Project 1Mapped and contributing to Sub-IDO
2022 CRP outcomes (from proposal)
MilestoneAssessment of risk to achievement (LMH)
Milestone 11 Increased capacity for innovation in partner research organizations
Foresight analyses and priority setting used by RICE and partner scientists to develop and target technology options
Application of the rice monitoring system for national food security program in Cambodia supporting Thailand disaster relief program for rice farmers crop insurance implementation in Tamil Nadu India Cambodia and Mekong River Delta Vietnam and development of remote sensing based rice monitoring system for Bihar India
L support from national partners
Milestone 12 Improved capacity of women and young people to participate in decision-making
Improved role in decision making by women and youth in rice value chains as evidenced by empowerment measures at key action sites
Gender-youth business models in rice value chain reinforced through better understanding of changing roles on decision making of women and youth in rice farming
M Dependence on support from national partners and governments
Flagship project 1 Accelerating impact and equity
Budget by Window of Funding
Filter by Program Year and Flagship
2018
Reporting Indicators
CRP Staffing
Clicking on any indicator will provide the details available in the table below
Link to Program Information on cgiarorgLinkRICE
CGIAR Program Results Dashboard
31
SECTION 3 PROCESSES
32
31 - Program Performance Management Standards (component 9)
The opportunity to strengthen incentives for high-quality program performance management and provide greater assurance to the SMB and System Council
The ideasbull Adoption of a limited set of program
performance standards for each business cycle in response to the challenges of performance assessment inherent in the variety complexity technical specificity and timelines of the research programs
bull Minimum standards required would change be raised over successive business cycles
bull Specific standards to be agreed with Funders CRPsCenters and SMB
bull Would complement and build on other elements of framework ndash egevaluation
32
Minimum standardsexamples of possible measures for Cycle 1 Rationale assumptions Examples of
measurement optionsReliabilityCredibilityProgram governance structures provide an effective challenge and verification function for management prioritization of research including consideration of future scenarios
Program governance (eg steering committees) should provide an effective specialist technical critique and challenge for prioritization decisions
Evaluation of structures and processes based on agreed quality criteria Qualitative passfail
Relevance and DeliveryEffectivenessgt80 of the Programrsquos projects document a clear and credible impact pathway with a clear product and delivery pathway in mind (appropriate to stage of maturity of research)
Written impact pathways are one good way to check a clear lsquooutcome focusrsquo as well as whether the assumptions are credible
Verification of a random sample of projects with W1W2 funding or co-funding based on agreed quality criteria
Delivery Effectiveness and ReputationLegitimacyKey research project documents for each program are available electronically on a central MIS system or another system accessible by central system advisory bodies (covering gt80 of total research budget)
Availability of project documents is a lsquoboring but importantrsquo necessary step for internal assessments of aspects such as impact pathways (above)
Availability of documents checked
ReputationLegitimacyProgram has processes or contracts in place to ensure appropriate ethical approval for all projects [IRB is primary responsibility of Centers]
Ethical approval processes (IRB) are an important part of ensuring ethical work with human subjects
Evaluation of processes and a sample of decisions based on agreed criteria Qualitative passfail
SECTION 3 PROCESSES
33
The 5 points Description
1 Adopt A multi-year pledging process for W1 amp W2 ndash with multi-year pledging at CRPplatform (and flagship where desired) level
A central objective of business plan is to increase the share of multi-annual pledges and to translate these into multi-annual pledges at the CRPplatform level ndash transforming the level of forward predictability for the shared science agenda through W1 ampW2
2 Revise Use of W1 to change the internal hydraulics
De-link W1 from W2 in terms of its ex post ldquoshock absorbingrdquo within each financial year but continue to link W1 to W2 to support the rebalancing of funding ex ante at the start of the multi--year funding period based on W2 forward pledgescommitments
3 Clarify Approach to allocation within and between cycles
Clarification of between and within business-cycle approaches alongside adoption of a funding target-setting approach to guide funding decisions over the remaining time in the current portfolio
4 Efficiency Optimal funding received to manage down transaction costs
Re-concentrate funding in large pooled programs and decrease number of small W3bilateral projects
5 Recovery Full overhead costs of projects
Adoption of collective System Council ambition to cover minimum overhead costs requested by Centers
PROCESSES
The opportunity By resolving long-standing challenges in CGIARrsquos financing system this can build the needed confidence in CGIAR financing so that reliability percentage share and absolute level of overall and system financing can be maintained and even increased
Sub-section 32A 5-point plan to improve System funding modalities
SECTION 3 PROCESSES
34
32 - Point 3 - Clarify Approach to allocation within and between cycles
Between business cycles During each 3-year business cyclePotential reset of starting point in funding across system Fundamental reconsideration of balance of funding between key focus areasprogram themes based on the list of prioritization criteria set out in the Council Paper on an allocation strategy referenced above
Tool simulation tool that aligns potential programs with broader strategic SLOhigher level outcomes potentially also collecting and presenting relevant available information on strategic fit and performance
Overall output of process Program-level W12 funding targets for subsequent business cycle period
Methodology Annual review of funding targets and W1 forward allocations to take into account any exceptional changes -particularly changes in strategic considerations such as a changing risk context (eg new pestdisease) or a potential new funding opportunity
SECTION 3 PROCESSES
Starting premiseThe budgeting process leading to the CRPPlatforms funding request as presented to the System Council in September 2016 was sufficiently robust and detailed to guide funding allocations for the remaining 3-year period of CRPsplatforms
Concept for initial 2019-2021 Business PlanFunding and program planning would be substantiated bybull A 3-year indicative workplan underpinning the
Business Plan and subjected to potential alterations resulting from the breeding initiative or other potential modifications to the current Portfolio
bull Detailed annual programmatic planning through the existing workplan and budgeting process
Key recognitionThe budgeting process for the implementation periods from 2022 needs to learn and evolve from that undertaken in 2015
35
32 - Point 3 - Portfolio Budgets Allocation baseline
Budget by expense category
Funding Plan
SECTION 3 PROCESSES
36
32 - Point 3 - A starting point for ldquobaseline funding targetsrdquo for 2019-2021 Business Plan (Note subject to potential revision for final draft Plan)
W1amp2 proposed budget ($USm original proposals) 2019 2020 2021 Total BaseGrain Legumes and Dryland Cereals 121 127 133 381Fish 74 78 82 233Forests Trees and Agroforestry 120 125 131 377Livestock 223 235 246 704Maize 125 131 138 394Rice 171 175 179 524Roots Tubers and Bananas 243 253 263 760Wheat 165 174 182 521Agriculture 4 Nutrition and Health 218 227 238 683Climate Change Agriculture and Food Security 232 243 255 730Policies Institutions and Markets 194 194 200 587Water Land and Ecosystems 110 116 122 348Genebanks 188 153 132 472Excellence in Breeding 22 23 24 70Big Data 52 45 43 139
Total Portfolio Base Budget 2258 2299 2368 6923
hellipThus - the September 2016 submitted budgets would form the starting point of discussions with the SMB and System Council on the funding targets for the 2019-2021 period as informed by any updated program platform information and any new elements or key changes to the Portfolio
SECTION 3 PROCESSES
A possible goal of the initial 2019-2021 business plan is to explore appropriate incentives to reduce the number of projects that are less than $200K by [X ndash for discussion and agreement]
37
32 - Point 4 - Efficiency Optimal funding received to manage down transaction costs
Ave Annual Grant 2012 2013 2014 2015 2016gt1m 167 182 205 225 212 500k - 999k 175 183 202 224 214 200k - 499k 424 466 454 457 463 lt200k 1674 1570 1280 1356 1398 Total no of projects 2440 2401 2141 2262 2287
Centers continue to manage a large number of restricted W3 and bilateral projects
0
200
400
600
800
1000
1200
2011 2012 2013 2014 2015 2016 2017(est)
Sources of Revenue $million
Bilateral amp other CGIAR Fund W3
0
500
1000
1500
2000
2500
3000
2012 2013 2014 2015 2016
No of W3 and Bilateral Projects
gt1m 500k - 999k 200k - 499k lt200k
2012 2013 2014 2015 2016 -
200
400
600
800
1000
1200
Total Annual Grants Pledged $million
gt1m 500k - 999k 200k - 499k lt200k

SECTION 3 PROCESSES
23
PROCESSES
Sub-section 31A program performance management framework
The opportunityTo set out an approach to program performance management that is credible and can drive improvements over time ndash providing assurance to key stakeholders
Mechanisms to achieve goal
bull Strengthening reporting and learning from outputs and outcomes of past research
bull Improving management of current program performance
bull Developing components to improve decision-making about future research funding
SECTION 3 PROCESSES
24
31 A program performance management framework
12 Framework Components
Past results reporting1 CGIAR Annual Performance Report2 CRPsPlatform reporting
requirements 3 Common results reporting indicators4 Outcome and impact case studies5 Program Results Dashboard6 Past Evaluations7 Impact Assessments
Present improved management8 Within-cycle reviews and evaluations9 Program Performance
Management Standards
Future improved decision-making10 Quality at Entry Assessment11 Planning landscape12 Allocation criteria and tool
SECTION 3 PROCESSES
The opportunity To pilot a new approach to annual reporting to improve accountability and give confidence to Funders and key supporting partners by (i) a more focused looking-back at achievements from completed research (ii) reflecting on the current CGIAR research portfolio and (iii) reviewing progress and plans for continued improvements in performance
Timelinebull In 2018 the annual report will be published at the end of September The planning and reporting cycle is later than
usual due to new systems being implementedbull Planning and reporting cycles will be revised in 2019 so that the publication will be finalized earlier in the year
25
31 - Annual CGIAR Performance Report a new approach (component 1)
The 2018 report under preparationbull Aims to interest a critical (non-researcher) audience that is
looking for serious discussion of issues and evidencebull Represent a range of voices from across CGIAR and partnersbull Demonstrate progress towards CGIAR goals (SRF) while
reflecting on the approaches and partnerships that promote impact
bull Reflect on the value added of CGIAR Research Programs and Platforms working in Research Centers to deliver results
bull Reflect on how funding has been able to support system goalsbull Incorporate available results from the new reporting systems (to
be introduced in late 2018)
Building on 2018 reports for 2019 and beyond will also incorporatebull New program results dashboard Highlights from the interactive
CGIAR dashboard capturing research innovations outcomes and impacts
It will report and reflect on progress towards CGIARs goals tobull Modernize improve and stabilizebull Provide an enabling environment to improve quality and deliver
impactbull Build an efficient system with reduced transaction costsbull Strengthen and diversify funding (new collaborations initiatives)
to enable a longer-term funding basebull Attract retain and build the highest quality staff
2018 Introducing new reporting approach 2019 harmonization with new CGIAR Business Plan Cycle
SECTION 3 PROCESSES
Selected ideas bull Deliver data interoperability and consolidation from
multiple source systems (including lsquoGARDIANrsquo tool discussed earlier on slide 19) with data interfacing and storage on a central database
bull The on-line results reporting system will be used going forward to streamline the creation of the Annual CGIAR Performance Report
bull The dashboard mockup on the following slides provides visualization ideas aligned with current operational CGIAR Results Reporting guidance
26
31 - A new CGIAR Program Results Dashboard (component 5)
The opportunityThrough making use of modern visualization technology CGIAR will be able to provide real-time program information to Funders partners and other stakeholders via wwwcgiarorg
Filtering will be possible by programplatform by year by outcomeimpact on the ground (by country) and by innovation stage
SDG
Find information by
Program Platform
Partner Institutions
2016 2017 2018
22
Policies
231
Innovation by Stage Peer-reviewed Papers
1918
Partnerships
475 1555
Trainees
Financials
Budget Allocation by CRPPTF
CRP Funding Update
This selection allows filtering of all elements of the page by year
On the home page the heat map indicates the number of evidences by region
5 reporting indicators are highlighted on the home page By clicking on an indicator the user navigates to a more detailed page on innovations policies etc
All pages of the dashboard contain links to search information related to
SDGs CRPs and partners
CGIAR Program Results DashboardProgress towards
System Level Outcomes (SLOs)
Reporting Indicators
28
SLO SDGThe distribution of evidences can be displayed by SLO or by SDG
North AfricaProgress towards SLO 4 evidences reportedOutcome case studies 10 case studies reportedPolicies 5 policies enactedInnovation by stage 10 in stage 4Partnership 50 partners work with usParticipants 15000 people involved in our activitiesTrainees 150 people trainedPeer-reviewed papers 193 in ISI journals
By hovering over a region a window displays key information that is geographically tagged By
clicking on the region the user navigates to the next page
27
SDG
Find information by
Program Platform
Partner Institutions
2016 2017 2018
3
Policies
23
Innovation by Stage Peer-reviewed Papers
1918
Partnerships
41 123
Trainees
Outcome Case Studies
Case Study Title CRPPTF
Adoption of citizen science methodology shapes new linkages between researchers and farmers for climate adaptation
CCAFS
De Brauw 2016 showed that biofortified OFSP varieties have disseminated to an estimated 289M households in 12 SSA countries (125 grams per day meets the daily vitamin A requirement of a child under five)
RTB
CIMMYT FAO and the World Bank found in Kazakhstan that spring wheat yields are as much as 58 higher under (widely-adopted) zero tillage introduced by WHEAT than with conventional technologies
WHEAT
RTB - 2017Western AfricaAdoption of citizen science methodology shapes new linkages between researchers and farmers for climate adaptationSLO Target 21 Improve the rate of yield increase for major food staples from current lt1 to 12-15 per yearIDOSub-IDO 132 Increased livelihood opportunitiesA14 Enhanced capacity to deal with climatic risks and extremesCross-cutting Gender Youth
Outcome Impact on the Ground
This page displays outcome case studies related to a specific region Clicking on the pin displays information on the case study
All case studies for the selected region are listed in this table
CGIAR Program Results Dashboard
Reporting Indicators
Progress towards System Level Outcomes (SLOs)
4
SLO SDG
28
SDG
Program Platform
Partner Institutions
2016 2017 2018
Fish ndash Stage 3 Innovations
Innovation by Stage
9
Innovation Innovation Type
Base populations established for new breeding program of Catla and Silver carps established (Bangladesh) Genetics
Genetic assessment of juvenile rearing methods of Rohu carp (2 Journal articles[1]) Genetics
New knowledge on sex determining genes feed efficiency and resilience in tilapia (journal articles) Genetics
Genomic databases for rohu catla and silver carps Bangladesh) Genetics
Dissemination plans for improved tilapia dissemination prepared with national partners in Cambodia and Myanmar (Practice notes Working papers) Genetics
Clicking on a specific program innovation stage filters rows of the Innovations table accordingly
FISH
Heat map now based on number of innovations per region
Innovation by StageCGIAR Program Results Dashboard
29
SDG
Program Platform
Partner Institutions
2016 2017 2018
CCAFS ndash Peer-reviewed Papers
Journal Paper Journal Open Access ISI
Complete Genome Sequence of Rice hoja blanca tenuivirus Isolated from a Susceptible Rice Cultivar in Colombia Theoretical and Applied Genetics
Common Bean Genomes Mining New Knowledge of a Major Societal Crop Field Crops Research
Breeding implications of drought stress under future climate for upland rice in Brazil Agriculture Ecosystems and Environment
Landscape context does not constrain biological control of Phenacoccus manihoti in intensified cassava systems of southern Vietnam
Agronomy for Sustainable Development
Peer-reviewed Papers
0 10 20 30
FISH
FTA
LIVESTOCK
MAIZE
RICE
RTB
WHEAT
GLDC
A4NH
CCAFS
PIM
WLE
GENEBANK
EiB
BIG DATA
CRP
PTF
Clicking on a specific program filters information on the page accordingly
135
135
CCAFS ndash Social AttentionTop 10 publications by Altmetric score
Publication Score Date View on Altmetric
Natural climate solutions 810 16-10-17 Details page URL
Farming and the geography of nutrient production for human use a transdisciplinary analysis 191 01-04-17 Details page URL
Linking regional stakeholder scenarios and shared socioeconomic pathways Quantified West African food and climate futures in a global context
126 01-03-17 Details page URL
Agriculture production as a major driver of the Earth system exceeding planetary boundaries 107 12-10-17 Details page URL
10 best bet innovations for adaptation in agriculture A supplement to the UNFCCC NAP Technical Guidelines 48 02-11-17 Details page URL
Greenhouse gas emissions from agricultural food production to supply Indian diets Implications for climate change mitigation 40 01-01-17 Details page URL
Special issue on climate-smart agriculture (CSA) 34 13-05-17 Details page URL
lsquoCSA-Planrsquo strategies to put Climate-Smart Agriculture (CSA) into practice 27 06-06-17 Details page URL
Clicking on the link takes the user to the
Altmetric page from which the article can be
accessed
Peer-reviewed PapersCGIAR Program Results Dashboard
Clicking here allows to view a specific program page accordingly
30
5
Policies
6
Innovation by Stage Peer-reviewed Papers
1918
Partnerships
34
Outcome Case StudiesCase Study Title CRP
Describing the rice production context in Latin America policy briefs on rice to the FLAR member countries
RICE
15
Progress Towards Milestones
Flagship Project 1Mapped and contributing to Sub-IDO
2022 CRP outcomes (from proposal)
MilestoneAssessment of risk to achievement (LMH)
Milestone 11 Increased capacity for innovation in partner research organizations
Foresight analyses and priority setting used by RICE and partner scientists to develop and target technology options
Application of the rice monitoring system for national food security program in Cambodia supporting Thailand disaster relief program for rice farmers crop insurance implementation in Tamil Nadu India Cambodia and Mekong River Delta Vietnam and development of remote sensing based rice monitoring system for Bihar India
L support from national partners
Milestone 12 Improved capacity of women and young people to participate in decision-making
Improved role in decision making by women and youth in rice value chains as evidenced by empowerment measures at key action sites
Gender-youth business models in rice value chain reinforced through better understanding of changing roles on decision making of women and youth in rice farming
M Dependence on support from national partners and governments
Flagship project 1 Accelerating impact and equity
Budget by Window of Funding
Filter by Program Year and Flagship
2018
Reporting Indicators
CRP Staffing
Clicking on any indicator will provide the details available in the table below
Link to Program Information on cgiarorgLinkRICE
CGIAR Program Results Dashboard
31
SECTION 3 PROCESSES
32
31 - Program Performance Management Standards (component 9)
The opportunity to strengthen incentives for high-quality program performance management and provide greater assurance to the SMB and System Council
The ideasbull Adoption of a limited set of program
performance standards for each business cycle in response to the challenges of performance assessment inherent in the variety complexity technical specificity and timelines of the research programs
bull Minimum standards required would change be raised over successive business cycles
bull Specific standards to be agreed with Funders CRPsCenters and SMB
bull Would complement and build on other elements of framework ndash egevaluation
32
Minimum standardsexamples of possible measures for Cycle 1 Rationale assumptions Examples of
measurement optionsReliabilityCredibilityProgram governance structures provide an effective challenge and verification function for management prioritization of research including consideration of future scenarios
Program governance (eg steering committees) should provide an effective specialist technical critique and challenge for prioritization decisions
Evaluation of structures and processes based on agreed quality criteria Qualitative passfail
Relevance and DeliveryEffectivenessgt80 of the Programrsquos projects document a clear and credible impact pathway with a clear product and delivery pathway in mind (appropriate to stage of maturity of research)
Written impact pathways are one good way to check a clear lsquooutcome focusrsquo as well as whether the assumptions are credible
Verification of a random sample of projects with W1W2 funding or co-funding based on agreed quality criteria
Delivery Effectiveness and ReputationLegitimacyKey research project documents for each program are available electronically on a central MIS system or another system accessible by central system advisory bodies (covering gt80 of total research budget)
Availability of project documents is a lsquoboring but importantrsquo necessary step for internal assessments of aspects such as impact pathways (above)
Availability of documents checked
ReputationLegitimacyProgram has processes or contracts in place to ensure appropriate ethical approval for all projects [IRB is primary responsibility of Centers]
Ethical approval processes (IRB) are an important part of ensuring ethical work with human subjects
Evaluation of processes and a sample of decisions based on agreed criteria Qualitative passfail
SECTION 3 PROCESSES
33
The 5 points Description
1 Adopt A multi-year pledging process for W1 amp W2 ndash with multi-year pledging at CRPplatform (and flagship where desired) level
A central objective of business plan is to increase the share of multi-annual pledges and to translate these into multi-annual pledges at the CRPplatform level ndash transforming the level of forward predictability for the shared science agenda through W1 ampW2
2 Revise Use of W1 to change the internal hydraulics
De-link W1 from W2 in terms of its ex post ldquoshock absorbingrdquo within each financial year but continue to link W1 to W2 to support the rebalancing of funding ex ante at the start of the multi--year funding period based on W2 forward pledgescommitments
3 Clarify Approach to allocation within and between cycles
Clarification of between and within business-cycle approaches alongside adoption of a funding target-setting approach to guide funding decisions over the remaining time in the current portfolio
4 Efficiency Optimal funding received to manage down transaction costs
Re-concentrate funding in large pooled programs and decrease number of small W3bilateral projects
5 Recovery Full overhead costs of projects
Adoption of collective System Council ambition to cover minimum overhead costs requested by Centers
PROCESSES
The opportunity By resolving long-standing challenges in CGIARrsquos financing system this can build the needed confidence in CGIAR financing so that reliability percentage share and absolute level of overall and system financing can be maintained and even increased
Sub-section 32A 5-point plan to improve System funding modalities
SECTION 3 PROCESSES
34
32 - Point 3 - Clarify Approach to allocation within and between cycles
Between business cycles During each 3-year business cyclePotential reset of starting point in funding across system Fundamental reconsideration of balance of funding between key focus areasprogram themes based on the list of prioritization criteria set out in the Council Paper on an allocation strategy referenced above
Tool simulation tool that aligns potential programs with broader strategic SLOhigher level outcomes potentially also collecting and presenting relevant available information on strategic fit and performance
Overall output of process Program-level W12 funding targets for subsequent business cycle period
Methodology Annual review of funding targets and W1 forward allocations to take into account any exceptional changes -particularly changes in strategic considerations such as a changing risk context (eg new pestdisease) or a potential new funding opportunity
SECTION 3 PROCESSES
Starting premiseThe budgeting process leading to the CRPPlatforms funding request as presented to the System Council in September 2016 was sufficiently robust and detailed to guide funding allocations for the remaining 3-year period of CRPsplatforms
Concept for initial 2019-2021 Business PlanFunding and program planning would be substantiated bybull A 3-year indicative workplan underpinning the
Business Plan and subjected to potential alterations resulting from the breeding initiative or other potential modifications to the current Portfolio
bull Detailed annual programmatic planning through the existing workplan and budgeting process
Key recognitionThe budgeting process for the implementation periods from 2022 needs to learn and evolve from that undertaken in 2015
35
32 - Point 3 - Portfolio Budgets Allocation baseline
Budget by expense category
Funding Plan
SECTION 3 PROCESSES
36
32 - Point 3 - A starting point for ldquobaseline funding targetsrdquo for 2019-2021 Business Plan (Note subject to potential revision for final draft Plan)
W1amp2 proposed budget ($USm original proposals) 2019 2020 2021 Total BaseGrain Legumes and Dryland Cereals 121 127 133 381Fish 74 78 82 233Forests Trees and Agroforestry 120 125 131 377Livestock 223 235 246 704Maize 125 131 138 394Rice 171 175 179 524Roots Tubers and Bananas 243 253 263 760Wheat 165 174 182 521Agriculture 4 Nutrition and Health 218 227 238 683Climate Change Agriculture and Food Security 232 243 255 730Policies Institutions and Markets 194 194 200 587Water Land and Ecosystems 110 116 122 348Genebanks 188 153 132 472Excellence in Breeding 22 23 24 70Big Data 52 45 43 139
Total Portfolio Base Budget 2258 2299 2368 6923
hellipThus - the September 2016 submitted budgets would form the starting point of discussions with the SMB and System Council on the funding targets for the 2019-2021 period as informed by any updated program platform information and any new elements or key changes to the Portfolio
SECTION 3 PROCESSES
A possible goal of the initial 2019-2021 business plan is to explore appropriate incentives to reduce the number of projects that are less than $200K by [X ndash for discussion and agreement]
37
32 - Point 4 - Efficiency Optimal funding received to manage down transaction costs
Ave Annual Grant 2012 2013 2014 2015 2016gt1m 167 182 205 225 212 500k - 999k 175 183 202 224 214 200k - 499k 424 466 454 457 463 lt200k 1674 1570 1280 1356 1398 Total no of projects 2440 2401 2141 2262 2287
Centers continue to manage a large number of restricted W3 and bilateral projects
0
200
400
600
800
1000
1200
2011 2012 2013 2014 2015 2016 2017(est)
Sources of Revenue $million
Bilateral amp other CGIAR Fund W3
0
500
1000
1500
2000
2500
3000
2012 2013 2014 2015 2016
No of W3 and Bilateral Projects
gt1m 500k - 999k 200k - 499k lt200k
2012 2013 2014 2015 2016 -
200
400
600
800
1000
1200
Total Annual Grants Pledged $million
gt1m 500k - 999k 200k - 499k lt200k

SECTION 3 PROCESSES
The opportunity To pilot a new approach to annual reporting to improve accountability and give confidence to Funders and key supporting partners by (i) a more focused looking-back at achievements from completed research (ii) reflecting on the current CGIAR research portfolio and (iii) reviewing progress and plans for continued improvements in performance
Timelinebull In 2018 the annual report will be published at the end of September The planning and reporting cycle is later than
usual due to new systems being implementedbull Planning and reporting cycles will be revised in 2019 so that the publication will be finalized earlier in the year
25
31 - Annual CGIAR Performance Report a new approach (component 1)
The 2018 report under preparationbull Aims to interest a critical (non-researcher) audience that is
looking for serious discussion of issues and evidencebull Represent a range of voices from across CGIAR and partnersbull Demonstrate progress towards CGIAR goals (SRF) while
reflecting on the approaches and partnerships that promote impact
bull Reflect on the value added of CGIAR Research Programs and Platforms working in Research Centers to deliver results
bull Reflect on how funding has been able to support system goalsbull Incorporate available results from the new reporting systems (to
be introduced in late 2018)
Building on 2018 reports for 2019 and beyond will also incorporatebull New program results dashboard Highlights from the interactive
CGIAR dashboard capturing research innovations outcomes and impacts
It will report and reflect on progress towards CGIARs goals tobull Modernize improve and stabilizebull Provide an enabling environment to improve quality and deliver
impactbull Build an efficient system with reduced transaction costsbull Strengthen and diversify funding (new collaborations initiatives)
to enable a longer-term funding basebull Attract retain and build the highest quality staff
2018 Introducing new reporting approach 2019 harmonization with new CGIAR Business Plan Cycle
SECTION 3 PROCESSES
Selected ideas bull Deliver data interoperability and consolidation from
multiple source systems (including lsquoGARDIANrsquo tool discussed earlier on slide 19) with data interfacing and storage on a central database
bull The on-line results reporting system will be used going forward to streamline the creation of the Annual CGIAR Performance Report
bull The dashboard mockup on the following slides provides visualization ideas aligned with current operational CGIAR Results Reporting guidance
26
31 - A new CGIAR Program Results Dashboard (component 5)
The opportunityThrough making use of modern visualization technology CGIAR will be able to provide real-time program information to Funders partners and other stakeholders via wwwcgiarorg
Filtering will be possible by programplatform by year by outcomeimpact on the ground (by country) and by innovation stage
SDG
Find information by
Program Platform
Partner Institutions
2016 2017 2018
22
Policies
231
Innovation by Stage Peer-reviewed Papers
1918
Partnerships
475 1555
Trainees
Financials
Budget Allocation by CRPPTF
CRP Funding Update
This selection allows filtering of all elements of the page by year
On the home page the heat map indicates the number of evidences by region
5 reporting indicators are highlighted on the home page By clicking on an indicator the user navigates to a more detailed page on innovations policies etc
All pages of the dashboard contain links to search information related to
SDGs CRPs and partners
CGIAR Program Results DashboardProgress towards
System Level Outcomes (SLOs)
Reporting Indicators
28
SLO SDGThe distribution of evidences can be displayed by SLO or by SDG
North AfricaProgress towards SLO 4 evidences reportedOutcome case studies 10 case studies reportedPolicies 5 policies enactedInnovation by stage 10 in stage 4Partnership 50 partners work with usParticipants 15000 people involved in our activitiesTrainees 150 people trainedPeer-reviewed papers 193 in ISI journals
By hovering over a region a window displays key information that is geographically tagged By
clicking on the region the user navigates to the next page
27
SDG
Find information by
Program Platform
Partner Institutions
2016 2017 2018
3
Policies
23
Innovation by Stage Peer-reviewed Papers
1918
Partnerships
41 123
Trainees
Outcome Case Studies
Case Study Title CRPPTF
Adoption of citizen science methodology shapes new linkages between researchers and farmers for climate adaptation
CCAFS
De Brauw 2016 showed that biofortified OFSP varieties have disseminated to an estimated 289M households in 12 SSA countries (125 grams per day meets the daily vitamin A requirement of a child under five)
RTB
CIMMYT FAO and the World Bank found in Kazakhstan that spring wheat yields are as much as 58 higher under (widely-adopted) zero tillage introduced by WHEAT than with conventional technologies
WHEAT
RTB - 2017Western AfricaAdoption of citizen science methodology shapes new linkages between researchers and farmers for climate adaptationSLO Target 21 Improve the rate of yield increase for major food staples from current lt1 to 12-15 per yearIDOSub-IDO 132 Increased livelihood opportunitiesA14 Enhanced capacity to deal with climatic risks and extremesCross-cutting Gender Youth
Outcome Impact on the Ground
This page displays outcome case studies related to a specific region Clicking on the pin displays information on the case study
All case studies for the selected region are listed in this table
CGIAR Program Results Dashboard
Reporting Indicators
Progress towards System Level Outcomes (SLOs)
4
SLO SDG
28
SDG
Program Platform
Partner Institutions
2016 2017 2018
Fish ndash Stage 3 Innovations
Innovation by Stage
9
Innovation Innovation Type
Base populations established for new breeding program of Catla and Silver carps established (Bangladesh) Genetics
Genetic assessment of juvenile rearing methods of Rohu carp (2 Journal articles[1]) Genetics
New knowledge on sex determining genes feed efficiency and resilience in tilapia (journal articles) Genetics
Genomic databases for rohu catla and silver carps Bangladesh) Genetics
Dissemination plans for improved tilapia dissemination prepared with national partners in Cambodia and Myanmar (Practice notes Working papers) Genetics
Clicking on a specific program innovation stage filters rows of the Innovations table accordingly
FISH
Heat map now based on number of innovations per region
Innovation by StageCGIAR Program Results Dashboard
29
SDG
Program Platform
Partner Institutions
2016 2017 2018
CCAFS ndash Peer-reviewed Papers
Journal Paper Journal Open Access ISI
Complete Genome Sequence of Rice hoja blanca tenuivirus Isolated from a Susceptible Rice Cultivar in Colombia Theoretical and Applied Genetics
Common Bean Genomes Mining New Knowledge of a Major Societal Crop Field Crops Research
Breeding implications of drought stress under future climate for upland rice in Brazil Agriculture Ecosystems and Environment
Landscape context does not constrain biological control of Phenacoccus manihoti in intensified cassava systems of southern Vietnam
Agronomy for Sustainable Development
Peer-reviewed Papers
0 10 20 30
FISH
FTA
LIVESTOCK
MAIZE
RICE
RTB
WHEAT
GLDC
A4NH
CCAFS
PIM
WLE
GENEBANK
EiB
BIG DATA
CRP
PTF
Clicking on a specific program filters information on the page accordingly
135
135
CCAFS ndash Social AttentionTop 10 publications by Altmetric score
Publication Score Date View on Altmetric
Natural climate solutions 810 16-10-17 Details page URL
Farming and the geography of nutrient production for human use a transdisciplinary analysis 191 01-04-17 Details page URL
Linking regional stakeholder scenarios and shared socioeconomic pathways Quantified West African food and climate futures in a global context
126 01-03-17 Details page URL
Agriculture production as a major driver of the Earth system exceeding planetary boundaries 107 12-10-17 Details page URL
10 best bet innovations for adaptation in agriculture A supplement to the UNFCCC NAP Technical Guidelines 48 02-11-17 Details page URL
Greenhouse gas emissions from agricultural food production to supply Indian diets Implications for climate change mitigation 40 01-01-17 Details page URL
Special issue on climate-smart agriculture (CSA) 34 13-05-17 Details page URL
lsquoCSA-Planrsquo strategies to put Climate-Smart Agriculture (CSA) into practice 27 06-06-17 Details page URL
Clicking on the link takes the user to the
Altmetric page from which the article can be
accessed
Peer-reviewed PapersCGIAR Program Results Dashboard
Clicking here allows to view a specific program page accordingly
30
5
Policies
6
Innovation by Stage Peer-reviewed Papers
1918
Partnerships
34
Outcome Case StudiesCase Study Title CRP
Describing the rice production context in Latin America policy briefs on rice to the FLAR member countries
RICE
15
Progress Towards Milestones
Flagship Project 1Mapped and contributing to Sub-IDO
2022 CRP outcomes (from proposal)
MilestoneAssessment of risk to achievement (LMH)
Milestone 11 Increased capacity for innovation in partner research organizations
Foresight analyses and priority setting used by RICE and partner scientists to develop and target technology options
Application of the rice monitoring system for national food security program in Cambodia supporting Thailand disaster relief program for rice farmers crop insurance implementation in Tamil Nadu India Cambodia and Mekong River Delta Vietnam and development of remote sensing based rice monitoring system for Bihar India
L support from national partners
Milestone 12 Improved capacity of women and young people to participate in decision-making
Improved role in decision making by women and youth in rice value chains as evidenced by empowerment measures at key action sites
Gender-youth business models in rice value chain reinforced through better understanding of changing roles on decision making of women and youth in rice farming
M Dependence on support from national partners and governments
Flagship project 1 Accelerating impact and equity
Budget by Window of Funding
Filter by Program Year and Flagship
2018
Reporting Indicators
CRP Staffing
Clicking on any indicator will provide the details available in the table below
Link to Program Information on cgiarorgLinkRICE
CGIAR Program Results Dashboard
31
SECTION 3 PROCESSES
32
31 - Program Performance Management Standards (component 9)
The opportunity to strengthen incentives for high-quality program performance management and provide greater assurance to the SMB and System Council
The ideasbull Adoption of a limited set of program
performance standards for each business cycle in response to the challenges of performance assessment inherent in the variety complexity technical specificity and timelines of the research programs
bull Minimum standards required would change be raised over successive business cycles
bull Specific standards to be agreed with Funders CRPsCenters and SMB
bull Would complement and build on other elements of framework ndash egevaluation
32
Minimum standardsexamples of possible measures for Cycle 1 Rationale assumptions Examples of
measurement optionsReliabilityCredibilityProgram governance structures provide an effective challenge and verification function for management prioritization of research including consideration of future scenarios
Program governance (eg steering committees) should provide an effective specialist technical critique and challenge for prioritization decisions
Evaluation of structures and processes based on agreed quality criteria Qualitative passfail
Relevance and DeliveryEffectivenessgt80 of the Programrsquos projects document a clear and credible impact pathway with a clear product and delivery pathway in mind (appropriate to stage of maturity of research)
Written impact pathways are one good way to check a clear lsquooutcome focusrsquo as well as whether the assumptions are credible
Verification of a random sample of projects with W1W2 funding or co-funding based on agreed quality criteria
Delivery Effectiveness and ReputationLegitimacyKey research project documents for each program are available electronically on a central MIS system or another system accessible by central system advisory bodies (covering gt80 of total research budget)
Availability of project documents is a lsquoboring but importantrsquo necessary step for internal assessments of aspects such as impact pathways (above)
Availability of documents checked
ReputationLegitimacyProgram has processes or contracts in place to ensure appropriate ethical approval for all projects [IRB is primary responsibility of Centers]
Ethical approval processes (IRB) are an important part of ensuring ethical work with human subjects
Evaluation of processes and a sample of decisions based on agreed criteria Qualitative passfail
SECTION 3 PROCESSES
33
The 5 points Description
1 Adopt A multi-year pledging process for W1 amp W2 ndash with multi-year pledging at CRPplatform (and flagship where desired) level
A central objective of business plan is to increase the share of multi-annual pledges and to translate these into multi-annual pledges at the CRPplatform level ndash transforming the level of forward predictability for the shared science agenda through W1 ampW2
2 Revise Use of W1 to change the internal hydraulics
De-link W1 from W2 in terms of its ex post ldquoshock absorbingrdquo within each financial year but continue to link W1 to W2 to support the rebalancing of funding ex ante at the start of the multi--year funding period based on W2 forward pledgescommitments
3 Clarify Approach to allocation within and between cycles
Clarification of between and within business-cycle approaches alongside adoption of a funding target-setting approach to guide funding decisions over the remaining time in the current portfolio
4 Efficiency Optimal funding received to manage down transaction costs
Re-concentrate funding in large pooled programs and decrease number of small W3bilateral projects
5 Recovery Full overhead costs of projects
Adoption of collective System Council ambition to cover minimum overhead costs requested by Centers
PROCESSES
The opportunity By resolving long-standing challenges in CGIARrsquos financing system this can build the needed confidence in CGIAR financing so that reliability percentage share and absolute level of overall and system financing can be maintained and even increased
Sub-section 32A 5-point plan to improve System funding modalities
SECTION 3 PROCESSES
34
32 - Point 3 - Clarify Approach to allocation within and between cycles
Between business cycles During each 3-year business cyclePotential reset of starting point in funding across system Fundamental reconsideration of balance of funding between key focus areasprogram themes based on the list of prioritization criteria set out in the Council Paper on an allocation strategy referenced above
Tool simulation tool that aligns potential programs with broader strategic SLOhigher level outcomes potentially also collecting and presenting relevant available information on strategic fit and performance
Overall output of process Program-level W12 funding targets for subsequent business cycle period
Methodology Annual review of funding targets and W1 forward allocations to take into account any exceptional changes -particularly changes in strategic considerations such as a changing risk context (eg new pestdisease) or a potential new funding opportunity
SECTION 3 PROCESSES
Starting premiseThe budgeting process leading to the CRPPlatforms funding request as presented to the System Council in September 2016 was sufficiently robust and detailed to guide funding allocations for the remaining 3-year period of CRPsplatforms
Concept for initial 2019-2021 Business PlanFunding and program planning would be substantiated bybull A 3-year indicative workplan underpinning the
Business Plan and subjected to potential alterations resulting from the breeding initiative or other potential modifications to the current Portfolio
bull Detailed annual programmatic planning through the existing workplan and budgeting process
Key recognitionThe budgeting process for the implementation periods from 2022 needs to learn and evolve from that undertaken in 2015
35
32 - Point 3 - Portfolio Budgets Allocation baseline
Budget by expense category
Funding Plan
SECTION 3 PROCESSES
36
32 - Point 3 - A starting point for ldquobaseline funding targetsrdquo for 2019-2021 Business Plan (Note subject to potential revision for final draft Plan)
W1amp2 proposed budget ($USm original proposals) 2019 2020 2021 Total BaseGrain Legumes and Dryland Cereals 121 127 133 381Fish 74 78 82 233Forests Trees and Agroforestry 120 125 131 377Livestock 223 235 246 704Maize 125 131 138 394Rice 171 175 179 524Roots Tubers and Bananas 243 253 263 760Wheat 165 174 182 521Agriculture 4 Nutrition and Health 218 227 238 683Climate Change Agriculture and Food Security 232 243 255 730Policies Institutions and Markets 194 194 200 587Water Land and Ecosystems 110 116 122 348Genebanks 188 153 132 472Excellence in Breeding 22 23 24 70Big Data 52 45 43 139
Total Portfolio Base Budget 2258 2299 2368 6923
hellipThus - the September 2016 submitted budgets would form the starting point of discussions with the SMB and System Council on the funding targets for the 2019-2021 period as informed by any updated program platform information and any new elements or key changes to the Portfolio
SECTION 3 PROCESSES
A possible goal of the initial 2019-2021 business plan is to explore appropriate incentives to reduce the number of projects that are less than $200K by [X ndash for discussion and agreement]
37
32 - Point 4 - Efficiency Optimal funding received to manage down transaction costs
Ave Annual Grant 2012 2013 2014 2015 2016gt1m 167 182 205 225 212 500k - 999k 175 183 202 224 214 200k - 499k 424 466 454 457 463 lt200k 1674 1570 1280 1356 1398 Total no of projects 2440 2401 2141 2262 2287
Centers continue to manage a large number of restricted W3 and bilateral projects
0
200
400
600
800
1000
1200
2011 2012 2013 2014 2015 2016 2017(est)
Sources of Revenue $million
Bilateral amp other CGIAR Fund W3
0
500
1000
1500
2000
2500
3000
2012 2013 2014 2015 2016
No of W3 and Bilateral Projects
gt1m 500k - 999k 200k - 499k lt200k
2012 2013 2014 2015 2016 -
200
400
600
800
1000
1200
Total Annual Grants Pledged $million
gt1m 500k - 999k 200k - 499k lt200k
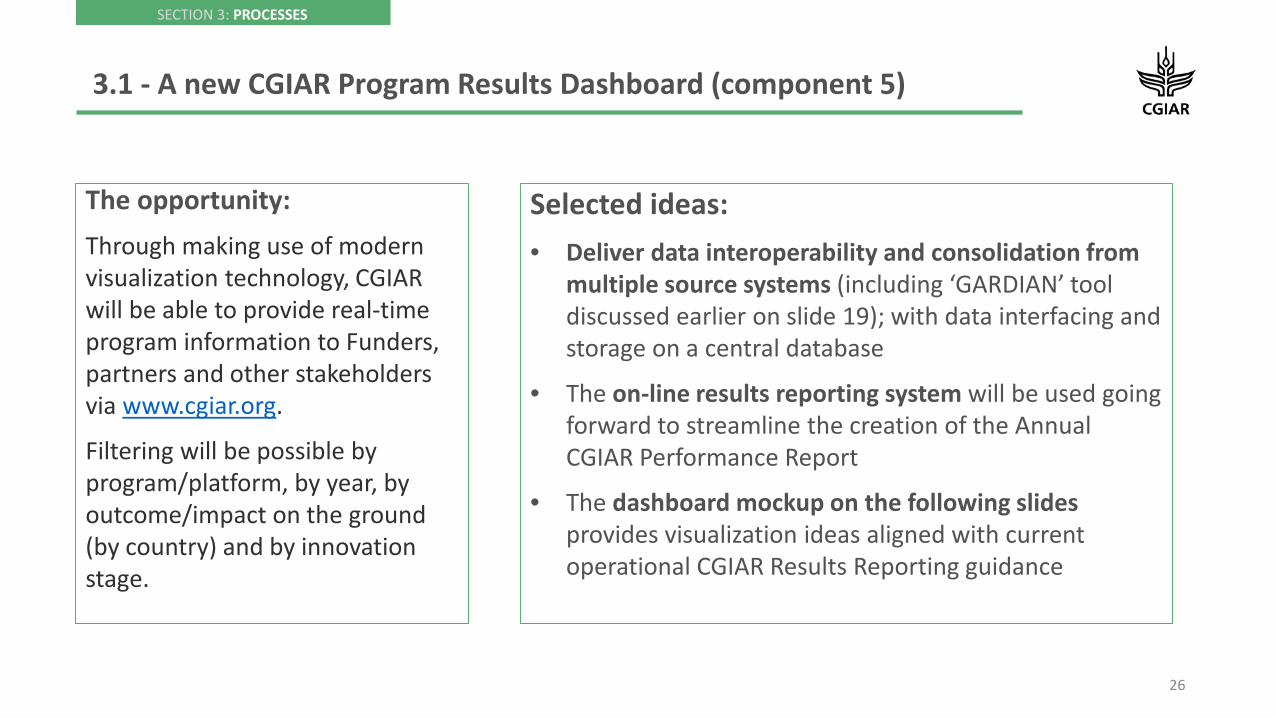
SECTION 3 PROCESSES
Selected ideas bull Deliver data interoperability and consolidation from
multiple source systems (including lsquoGARDIANrsquo tool discussed earlier on slide 19) with data interfacing and storage on a central database
bull The on-line results reporting system will be used going forward to streamline the creation of the Annual CGIAR Performance Report
bull The dashboard mockup on the following slides provides visualization ideas aligned with current operational CGIAR Results Reporting guidance
26
31 - A new CGIAR Program Results Dashboard (component 5)
The opportunityThrough making use of modern visualization technology CGIAR will be able to provide real-time program information to Funders partners and other stakeholders via wwwcgiarorg
Filtering will be possible by programplatform by year by outcomeimpact on the ground (by country) and by innovation stage
SDG
Find information by
Program Platform
Partner Institutions
2016 2017 2018
22
Policies
231
Innovation by Stage Peer-reviewed Papers
1918
Partnerships
475 1555
Trainees
Financials
Budget Allocation by CRPPTF
CRP Funding Update
This selection allows filtering of all elements of the page by year
On the home page the heat map indicates the number of evidences by region
5 reporting indicators are highlighted on the home page By clicking on an indicator the user navigates to a more detailed page on innovations policies etc
All pages of the dashboard contain links to search information related to
SDGs CRPs and partners
CGIAR Program Results DashboardProgress towards
System Level Outcomes (SLOs)
Reporting Indicators
28
SLO SDGThe distribution of evidences can be displayed by SLO or by SDG
North AfricaProgress towards SLO 4 evidences reportedOutcome case studies 10 case studies reportedPolicies 5 policies enactedInnovation by stage 10 in stage 4Partnership 50 partners work with usParticipants 15000 people involved in our activitiesTrainees 150 people trainedPeer-reviewed papers 193 in ISI journals
By hovering over a region a window displays key information that is geographically tagged By
clicking on the region the user navigates to the next page
27
SDG
Find information by
Program Platform
Partner Institutions
2016 2017 2018
3
Policies
23
Innovation by Stage Peer-reviewed Papers
1918
Partnerships
41 123
Trainees
Outcome Case Studies
Case Study Title CRPPTF
Adoption of citizen science methodology shapes new linkages between researchers and farmers for climate adaptation
CCAFS
De Brauw 2016 showed that biofortified OFSP varieties have disseminated to an estimated 289M households in 12 SSA countries (125 grams per day meets the daily vitamin A requirement of a child under five)
RTB
CIMMYT FAO and the World Bank found in Kazakhstan that spring wheat yields are as much as 58 higher under (widely-adopted) zero tillage introduced by WHEAT than with conventional technologies
WHEAT
RTB - 2017Western AfricaAdoption of citizen science methodology shapes new linkages between researchers and farmers for climate adaptationSLO Target 21 Improve the rate of yield increase for major food staples from current lt1 to 12-15 per yearIDOSub-IDO 132 Increased livelihood opportunitiesA14 Enhanced capacity to deal with climatic risks and extremesCross-cutting Gender Youth
Outcome Impact on the Ground
This page displays outcome case studies related to a specific region Clicking on the pin displays information on the case study
All case studies for the selected region are listed in this table
CGIAR Program Results Dashboard
Reporting Indicators
Progress towards System Level Outcomes (SLOs)
4
SLO SDG
28
SDG
Program Platform
Partner Institutions
2016 2017 2018
Fish ndash Stage 3 Innovations
Innovation by Stage
9
Innovation Innovation Type
Base populations established for new breeding program of Catla and Silver carps established (Bangladesh) Genetics
Genetic assessment of juvenile rearing methods of Rohu carp (2 Journal articles[1]) Genetics
New knowledge on sex determining genes feed efficiency and resilience in tilapia (journal articles) Genetics
Genomic databases for rohu catla and silver carps Bangladesh) Genetics
Dissemination plans for improved tilapia dissemination prepared with national partners in Cambodia and Myanmar (Practice notes Working papers) Genetics
Clicking on a specific program innovation stage filters rows of the Innovations table accordingly
FISH
Heat map now based on number of innovations per region
Innovation by StageCGIAR Program Results Dashboard
29
SDG
Program Platform
Partner Institutions
2016 2017 2018
CCAFS ndash Peer-reviewed Papers
Journal Paper Journal Open Access ISI
Complete Genome Sequence of Rice hoja blanca tenuivirus Isolated from a Susceptible Rice Cultivar in Colombia Theoretical and Applied Genetics
Common Bean Genomes Mining New Knowledge of a Major Societal Crop Field Crops Research
Breeding implications of drought stress under future climate for upland rice in Brazil Agriculture Ecosystems and Environment
Landscape context does not constrain biological control of Phenacoccus manihoti in intensified cassava systems of southern Vietnam
Agronomy for Sustainable Development
Peer-reviewed Papers
0 10 20 30
FISH
FTA
LIVESTOCK
MAIZE
RICE
RTB
WHEAT
GLDC
A4NH
CCAFS
PIM
WLE
GENEBANK
EiB
BIG DATA
CRP
PTF
Clicking on a specific program filters information on the page accordingly
135
135
CCAFS ndash Social AttentionTop 10 publications by Altmetric score
Publication Score Date View on Altmetric
Natural climate solutions 810 16-10-17 Details page URL
Farming and the geography of nutrient production for human use a transdisciplinary analysis 191 01-04-17 Details page URL
Linking regional stakeholder scenarios and shared socioeconomic pathways Quantified West African food and climate futures in a global context
126 01-03-17 Details page URL
Agriculture production as a major driver of the Earth system exceeding planetary boundaries 107 12-10-17 Details page URL
10 best bet innovations for adaptation in agriculture A supplement to the UNFCCC NAP Technical Guidelines 48 02-11-17 Details page URL
Greenhouse gas emissions from agricultural food production to supply Indian diets Implications for climate change mitigation 40 01-01-17 Details page URL
Special issue on climate-smart agriculture (CSA) 34 13-05-17 Details page URL
lsquoCSA-Planrsquo strategies to put Climate-Smart Agriculture (CSA) into practice 27 06-06-17 Details page URL
Clicking on the link takes the user to the
Altmetric page from which the article can be
accessed
Peer-reviewed PapersCGIAR Program Results Dashboard
Clicking here allows to view a specific program page accordingly
30
5
Policies
6
Innovation by Stage Peer-reviewed Papers
1918
Partnerships
34
Outcome Case StudiesCase Study Title CRP
Describing the rice production context in Latin America policy briefs on rice to the FLAR member countries
RICE
15
Progress Towards Milestones
Flagship Project 1Mapped and contributing to Sub-IDO
2022 CRP outcomes (from proposal)
MilestoneAssessment of risk to achievement (LMH)
Milestone 11 Increased capacity for innovation in partner research organizations
Foresight analyses and priority setting used by RICE and partner scientists to develop and target technology options
Application of the rice monitoring system for national food security program in Cambodia supporting Thailand disaster relief program for rice farmers crop insurance implementation in Tamil Nadu India Cambodia and Mekong River Delta Vietnam and development of remote sensing based rice monitoring system for Bihar India
L support from national partners
Milestone 12 Improved capacity of women and young people to participate in decision-making
Improved role in decision making by women and youth in rice value chains as evidenced by empowerment measures at key action sites
Gender-youth business models in rice value chain reinforced through better understanding of changing roles on decision making of women and youth in rice farming
M Dependence on support from national partners and governments
Flagship project 1 Accelerating impact and equity
Budget by Window of Funding
Filter by Program Year and Flagship
2018
Reporting Indicators
CRP Staffing
Clicking on any indicator will provide the details available in the table below
Link to Program Information on cgiarorgLinkRICE
CGIAR Program Results Dashboard
31
SECTION 3 PROCESSES
32
31 - Program Performance Management Standards (component 9)
The opportunity to strengthen incentives for high-quality program performance management and provide greater assurance to the SMB and System Council
The ideasbull Adoption of a limited set of program
performance standards for each business cycle in response to the challenges of performance assessment inherent in the variety complexity technical specificity and timelines of the research programs
bull Minimum standards required would change be raised over successive business cycles
bull Specific standards to be agreed with Funders CRPsCenters and SMB
bull Would complement and build on other elements of framework ndash egevaluation
32
Minimum standardsexamples of possible measures for Cycle 1 Rationale assumptions Examples of
measurement optionsReliabilityCredibilityProgram governance structures provide an effective challenge and verification function for management prioritization of research including consideration of future scenarios
Program governance (eg steering committees) should provide an effective specialist technical critique and challenge for prioritization decisions
Evaluation of structures and processes based on agreed quality criteria Qualitative passfail
Relevance and DeliveryEffectivenessgt80 of the Programrsquos projects document a clear and credible impact pathway with a clear product and delivery pathway in mind (appropriate to stage of maturity of research)
Written impact pathways are one good way to check a clear lsquooutcome focusrsquo as well as whether the assumptions are credible
Verification of a random sample of projects with W1W2 funding or co-funding based on agreed quality criteria
Delivery Effectiveness and ReputationLegitimacyKey research project documents for each program are available electronically on a central MIS system or another system accessible by central system advisory bodies (covering gt80 of total research budget)
Availability of project documents is a lsquoboring but importantrsquo necessary step for internal assessments of aspects such as impact pathways (above)
Availability of documents checked
ReputationLegitimacyProgram has processes or contracts in place to ensure appropriate ethical approval for all projects [IRB is primary responsibility of Centers]
Ethical approval processes (IRB) are an important part of ensuring ethical work with human subjects
Evaluation of processes and a sample of decisions based on agreed criteria Qualitative passfail
SECTION 3 PROCESSES
33
The 5 points Description
1 Adopt A multi-year pledging process for W1 amp W2 ndash with multi-year pledging at CRPplatform (and flagship where desired) level
A central objective of business plan is to increase the share of multi-annual pledges and to translate these into multi-annual pledges at the CRPplatform level ndash transforming the level of forward predictability for the shared science agenda through W1 ampW2
2 Revise Use of W1 to change the internal hydraulics
De-link W1 from W2 in terms of its ex post ldquoshock absorbingrdquo within each financial year but continue to link W1 to W2 to support the rebalancing of funding ex ante at the start of the multi--year funding period based on W2 forward pledgescommitments
3 Clarify Approach to allocation within and between cycles
Clarification of between and within business-cycle approaches alongside adoption of a funding target-setting approach to guide funding decisions over the remaining time in the current portfolio
4 Efficiency Optimal funding received to manage down transaction costs
Re-concentrate funding in large pooled programs and decrease number of small W3bilateral projects
5 Recovery Full overhead costs of projects
Adoption of collective System Council ambition to cover minimum overhead costs requested by Centers
PROCESSES
The opportunity By resolving long-standing challenges in CGIARrsquos financing system this can build the needed confidence in CGIAR financing so that reliability percentage share and absolute level of overall and system financing can be maintained and even increased
Sub-section 32A 5-point plan to improve System funding modalities
SECTION 3 PROCESSES
34
32 - Point 3 - Clarify Approach to allocation within and between cycles
Between business cycles During each 3-year business cyclePotential reset of starting point in funding across system Fundamental reconsideration of balance of funding between key focus areasprogram themes based on the list of prioritization criteria set out in the Council Paper on an allocation strategy referenced above
Tool simulation tool that aligns potential programs with broader strategic SLOhigher level outcomes potentially also collecting and presenting relevant available information on strategic fit and performance
Overall output of process Program-level W12 funding targets for subsequent business cycle period
Methodology Annual review of funding targets and W1 forward allocations to take into account any exceptional changes -particularly changes in strategic considerations such as a changing risk context (eg new pestdisease) or a potential new funding opportunity
SECTION 3 PROCESSES
Starting premiseThe budgeting process leading to the CRPPlatforms funding request as presented to the System Council in September 2016 was sufficiently robust and detailed to guide funding allocations for the remaining 3-year period of CRPsplatforms
Concept for initial 2019-2021 Business PlanFunding and program planning would be substantiated bybull A 3-year indicative workplan underpinning the
Business Plan and subjected to potential alterations resulting from the breeding initiative or other potential modifications to the current Portfolio
bull Detailed annual programmatic planning through the existing workplan and budgeting process
Key recognitionThe budgeting process for the implementation periods from 2022 needs to learn and evolve from that undertaken in 2015
35
32 - Point 3 - Portfolio Budgets Allocation baseline
Budget by expense category
Funding Plan
SECTION 3 PROCESSES
36
32 - Point 3 - A starting point for ldquobaseline funding targetsrdquo for 2019-2021 Business Plan (Note subject to potential revision for final draft Plan)
W1amp2 proposed budget ($USm original proposals) 2019 2020 2021 Total BaseGrain Legumes and Dryland Cereals 121 127 133 381Fish 74 78 82 233Forests Trees and Agroforestry 120 125 131 377Livestock 223 235 246 704Maize 125 131 138 394Rice 171 175 179 524Roots Tubers and Bananas 243 253 263 760Wheat 165 174 182 521Agriculture 4 Nutrition and Health 218 227 238 683Climate Change Agriculture and Food Security 232 243 255 730Policies Institutions and Markets 194 194 200 587Water Land and Ecosystems 110 116 122 348Genebanks 188 153 132 472Excellence in Breeding 22 23 24 70Big Data 52 45 43 139
Total Portfolio Base Budget 2258 2299 2368 6923
hellipThus - the September 2016 submitted budgets would form the starting point of discussions with the SMB and System Council on the funding targets for the 2019-2021 period as informed by any updated program platform information and any new elements or key changes to the Portfolio
SECTION 3 PROCESSES
A possible goal of the initial 2019-2021 business plan is to explore appropriate incentives to reduce the number of projects that are less than $200K by [X ndash for discussion and agreement]
37
32 - Point 4 - Efficiency Optimal funding received to manage down transaction costs
Ave Annual Grant 2012 2013 2014 2015 2016gt1m 167 182 205 225 212 500k - 999k 175 183 202 224 214 200k - 499k 424 466 454 457 463 lt200k 1674 1570 1280 1356 1398 Total no of projects 2440 2401 2141 2262 2287
Centers continue to manage a large number of restricted W3 and bilateral projects
0
200
400
600
800
1000
1200
2011 2012 2013 2014 2015 2016 2017(est)
Sources of Revenue $million
Bilateral amp other CGIAR Fund W3
0
500
1000
1500
2000
2500
3000
2012 2013 2014 2015 2016
No of W3 and Bilateral Projects
gt1m 500k - 999k 200k - 499k lt200k
2012 2013 2014 2015 2016 -
200
400
600
800
1000
1200
Total Annual Grants Pledged $million
gt1m 500k - 999k 200k - 499k lt200k
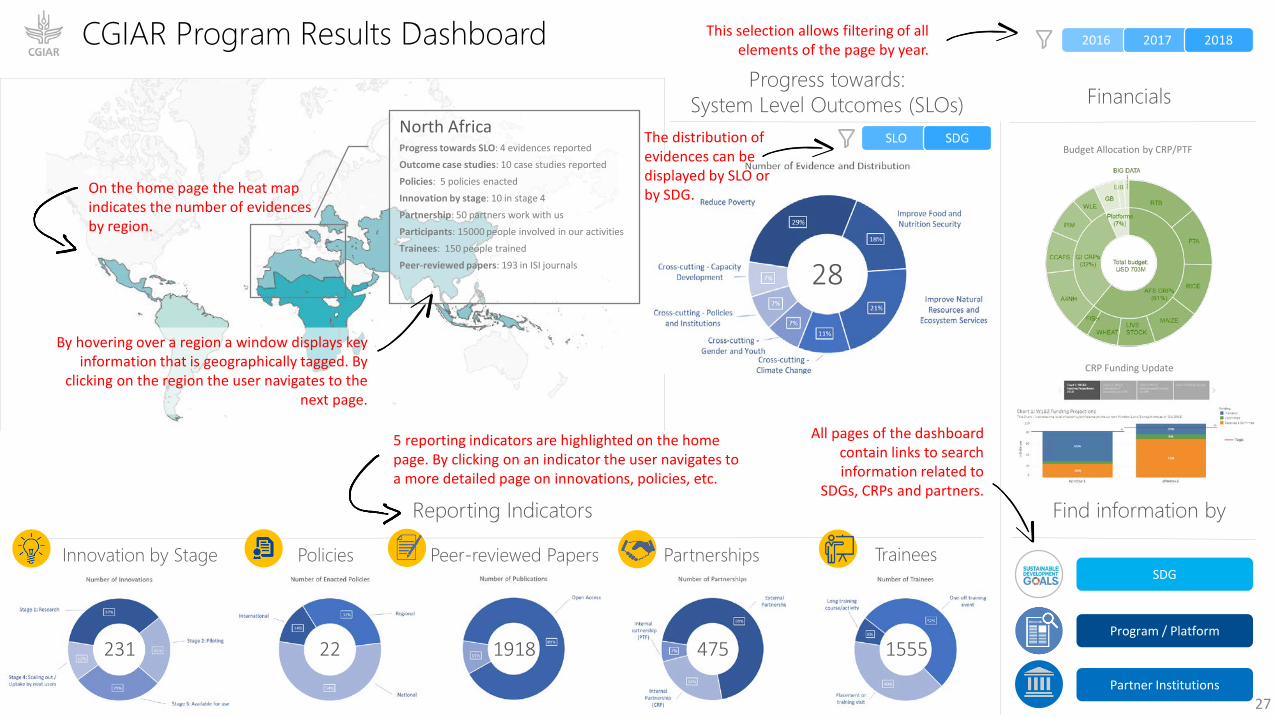
SDG
Find information by
Program Platform
Partner Institutions
2016 2017 2018
3
Policies
23
Innovation by Stage Peer-reviewed Papers
1918
Partnerships
41 123
Trainees
Outcome Case Studies
Case Study Title CRPPTF
Adoption of citizen science methodology shapes new linkages between researchers and farmers for climate adaptation
CCAFS
De Brauw 2016 showed that biofortified OFSP varieties have disseminated to an estimated 289M households in 12 SSA countries (125 grams per day meets the daily vitamin A requirement of a child under five)
RTB
CIMMYT FAO and the World Bank found in Kazakhstan that spring wheat yields are as much as 58 higher under (widely-adopted) zero tillage introduced by WHEAT than with conventional technologies
WHEAT
RTB - 2017Western AfricaAdoption of citizen science methodology shapes new linkages between researchers and farmers for climate adaptationSLO Target 21 Improve the rate of yield increase for major food staples from current lt1 to 12-15 per yearIDOSub-IDO 132 Increased livelihood opportunitiesA14 Enhanced capacity to deal with climatic risks and extremesCross-cutting Gender Youth
Outcome Impact on the Ground
This page displays outcome case studies related to a specific region Clicking on the pin displays information on the case study
All case studies for the selected region are listed in this table
CGIAR Program Results Dashboard
Reporting Indicators
Progress towards System Level Outcomes (SLOs)
4
SLO SDG
28
SDG
Program Platform
Partner Institutions
2016 2017 2018
Fish ndash Stage 3 Innovations
Innovation by Stage
9
Innovation Innovation Type
Base populations established for new breeding program of Catla and Silver carps established (Bangladesh) Genetics
Genetic assessment of juvenile rearing methods of Rohu carp (2 Journal articles[1]) Genetics
New knowledge on sex determining genes feed efficiency and resilience in tilapia (journal articles) Genetics
Genomic databases for rohu catla and silver carps Bangladesh) Genetics
Dissemination plans for improved tilapia dissemination prepared with national partners in Cambodia and Myanmar (Practice notes Working papers) Genetics
Clicking on a specific program innovation stage filters rows of the Innovations table accordingly
FISH
Heat map now based on number of innovations per region
Innovation by StageCGIAR Program Results Dashboard
29
SDG
Program Platform
Partner Institutions
2016 2017 2018
CCAFS ndash Peer-reviewed Papers
Journal Paper Journal Open Access ISI
Complete Genome Sequence of Rice hoja blanca tenuivirus Isolated from a Susceptible Rice Cultivar in Colombia Theoretical and Applied Genetics
Common Bean Genomes Mining New Knowledge of a Major Societal Crop Field Crops Research
Breeding implications of drought stress under future climate for upland rice in Brazil Agriculture Ecosystems and Environment
Landscape context does not constrain biological control of Phenacoccus manihoti in intensified cassava systems of southern Vietnam
Agronomy for Sustainable Development
Peer-reviewed Papers
0 10 20 30
FISH
FTA
LIVESTOCK
MAIZE
RICE
RTB
WHEAT
GLDC
A4NH
CCAFS
PIM
WLE
GENEBANK
EiB
BIG DATA
CRP
PTF
Clicking on a specific program filters information on the page accordingly
135
135
CCAFS ndash Social AttentionTop 10 publications by Altmetric score
Publication Score Date View on Altmetric
Natural climate solutions 810 16-10-17 Details page URL
Farming and the geography of nutrient production for human use a transdisciplinary analysis 191 01-04-17 Details page URL
Linking regional stakeholder scenarios and shared socioeconomic pathways Quantified West African food and climate futures in a global context
126 01-03-17 Details page URL
Agriculture production as a major driver of the Earth system exceeding planetary boundaries 107 12-10-17 Details page URL
10 best bet innovations for adaptation in agriculture A supplement to the UNFCCC NAP Technical Guidelines 48 02-11-17 Details page URL
Greenhouse gas emissions from agricultural food production to supply Indian diets Implications for climate change mitigation 40 01-01-17 Details page URL
Special issue on climate-smart agriculture (CSA) 34 13-05-17 Details page URL
lsquoCSA-Planrsquo strategies to put Climate-Smart Agriculture (CSA) into practice 27 06-06-17 Details page URL
Clicking on the link takes the user to the
Altmetric page from which the article can be
accessed
Peer-reviewed PapersCGIAR Program Results Dashboard
Clicking here allows to view a specific program page accordingly
30
5
Policies
6
Innovation by Stage Peer-reviewed Papers
1918
Partnerships
34
Outcome Case StudiesCase Study Title CRP
Describing the rice production context in Latin America policy briefs on rice to the FLAR member countries
RICE
15
Progress Towards Milestones
Flagship Project 1Mapped and contributing to Sub-IDO
2022 CRP outcomes (from proposal)
MilestoneAssessment of risk to achievement (LMH)
Milestone 11 Increased capacity for innovation in partner research organizations
Foresight analyses and priority setting used by RICE and partner scientists to develop and target technology options
Application of the rice monitoring system for national food security program in Cambodia supporting Thailand disaster relief program for rice farmers crop insurance implementation in Tamil Nadu India Cambodia and Mekong River Delta Vietnam and development of remote sensing based rice monitoring system for Bihar India
L support from national partners
Milestone 12 Improved capacity of women and young people to participate in decision-making
Improved role in decision making by women and youth in rice value chains as evidenced by empowerment measures at key action sites
Gender-youth business models in rice value chain reinforced through better understanding of changing roles on decision making of women and youth in rice farming
M Dependence on support from national partners and governments
Flagship project 1 Accelerating impact and equity
Budget by Window of Funding
Filter by Program Year and Flagship
2018
Reporting Indicators
CRP Staffing
Clicking on any indicator will provide the details available in the table below
Link to Program Information on cgiarorgLinkRICE
CGIAR Program Results Dashboard
31
SECTION 3 PROCESSES
32
31 - Program Performance Management Standards (component 9)
The opportunity to strengthen incentives for high-quality program performance management and provide greater assurance to the SMB and System Council
The ideasbull Adoption of a limited set of program
performance standards for each business cycle in response to the challenges of performance assessment inherent in the variety complexity technical specificity and timelines of the research programs
bull Minimum standards required would change be raised over successive business cycles
bull Specific standards to be agreed with Funders CRPsCenters and SMB
bull Would complement and build on other elements of framework ndash egevaluation
32
Minimum standardsexamples of possible measures for Cycle 1 Rationale assumptions Examples of
measurement optionsReliabilityCredibilityProgram governance structures provide an effective challenge and verification function for management prioritization of research including consideration of future scenarios
Program governance (eg steering committees) should provide an effective specialist technical critique and challenge for prioritization decisions
Evaluation of structures and processes based on agreed quality criteria Qualitative passfail
Relevance and DeliveryEffectivenessgt80 of the Programrsquos projects document a clear and credible impact pathway with a clear product and delivery pathway in mind (appropriate to stage of maturity of research)
Written impact pathways are one good way to check a clear lsquooutcome focusrsquo as well as whether the assumptions are credible
Verification of a random sample of projects with W1W2 funding or co-funding based on agreed quality criteria
Delivery Effectiveness and ReputationLegitimacyKey research project documents for each program are available electronically on a central MIS system or another system accessible by central system advisory bodies (covering gt80 of total research budget)
Availability of project documents is a lsquoboring but importantrsquo necessary step for internal assessments of aspects such as impact pathways (above)
Availability of documents checked
ReputationLegitimacyProgram has processes or contracts in place to ensure appropriate ethical approval for all projects [IRB is primary responsibility of Centers]
Ethical approval processes (IRB) are an important part of ensuring ethical work with human subjects
Evaluation of processes and a sample of decisions based on agreed criteria Qualitative passfail
SECTION 3 PROCESSES
33
The 5 points Description
1 Adopt A multi-year pledging process for W1 amp W2 ndash with multi-year pledging at CRPplatform (and flagship where desired) level
A central objective of business plan is to increase the share of multi-annual pledges and to translate these into multi-annual pledges at the CRPplatform level ndash transforming the level of forward predictability for the shared science agenda through W1 ampW2
2 Revise Use of W1 to change the internal hydraulics
De-link W1 from W2 in terms of its ex post ldquoshock absorbingrdquo within each financial year but continue to link W1 to W2 to support the rebalancing of funding ex ante at the start of the multi--year funding period based on W2 forward pledgescommitments
3 Clarify Approach to allocation within and between cycles
Clarification of between and within business-cycle approaches alongside adoption of a funding target-setting approach to guide funding decisions over the remaining time in the current portfolio
4 Efficiency Optimal funding received to manage down transaction costs
Re-concentrate funding in large pooled programs and decrease number of small W3bilateral projects
5 Recovery Full overhead costs of projects
Adoption of collective System Council ambition to cover minimum overhead costs requested by Centers
PROCESSES
The opportunity By resolving long-standing challenges in CGIARrsquos financing system this can build the needed confidence in CGIAR financing so that reliability percentage share and absolute level of overall and system financing can be maintained and even increased
Sub-section 32A 5-point plan to improve System funding modalities
SECTION 3 PROCESSES
34
32 - Point 3 - Clarify Approach to allocation within and between cycles
Between business cycles During each 3-year business cyclePotential reset of starting point in funding across system Fundamental reconsideration of balance of funding between key focus areasprogram themes based on the list of prioritization criteria set out in the Council Paper on an allocation strategy referenced above
Tool simulation tool that aligns potential programs with broader strategic SLOhigher level outcomes potentially also collecting and presenting relevant available information on strategic fit and performance
Overall output of process Program-level W12 funding targets for subsequent business cycle period
Methodology Annual review of funding targets and W1 forward allocations to take into account any exceptional changes -particularly changes in strategic considerations such as a changing risk context (eg new pestdisease) or a potential new funding opportunity
SECTION 3 PROCESSES
Starting premiseThe budgeting process leading to the CRPPlatforms funding request as presented to the System Council in September 2016 was sufficiently robust and detailed to guide funding allocations for the remaining 3-year period of CRPsplatforms
Concept for initial 2019-2021 Business PlanFunding and program planning would be substantiated bybull A 3-year indicative workplan underpinning the
Business Plan and subjected to potential alterations resulting from the breeding initiative or other potential modifications to the current Portfolio
bull Detailed annual programmatic planning through the existing workplan and budgeting process
Key recognitionThe budgeting process for the implementation periods from 2022 needs to learn and evolve from that undertaken in 2015
35
32 - Point 3 - Portfolio Budgets Allocation baseline
Budget by expense category
Funding Plan
SECTION 3 PROCESSES
36
32 - Point 3 - A starting point for ldquobaseline funding targetsrdquo for 2019-2021 Business Plan (Note subject to potential revision for final draft Plan)
W1amp2 proposed budget ($USm original proposals) 2019 2020 2021 Total BaseGrain Legumes and Dryland Cereals 121 127 133 381Fish 74 78 82 233Forests Trees and Agroforestry 120 125 131 377Livestock 223 235 246 704Maize 125 131 138 394Rice 171 175 179 524Roots Tubers and Bananas 243 253 263 760Wheat 165 174 182 521Agriculture 4 Nutrition and Health 218 227 238 683Climate Change Agriculture and Food Security 232 243 255 730Policies Institutions and Markets 194 194 200 587Water Land and Ecosystems 110 116 122 348Genebanks 188 153 132 472Excellence in Breeding 22 23 24 70Big Data 52 45 43 139
Total Portfolio Base Budget 2258 2299 2368 6923
hellipThus - the September 2016 submitted budgets would form the starting point of discussions with the SMB and System Council on the funding targets for the 2019-2021 period as informed by any updated program platform information and any new elements or key changes to the Portfolio
SECTION 3 PROCESSES
A possible goal of the initial 2019-2021 business plan is to explore appropriate incentives to reduce the number of projects that are less than $200K by [X ndash for discussion and agreement]
37
32 - Point 4 - Efficiency Optimal funding received to manage down transaction costs
Ave Annual Grant 2012 2013 2014 2015 2016gt1m 167 182 205 225 212 500k - 999k 175 183 202 224 214 200k - 499k 424 466 454 457 463 lt200k 1674 1570 1280 1356 1398 Total no of projects 2440 2401 2141 2262 2287
Centers continue to manage a large number of restricted W3 and bilateral projects
0
200
400
600
800
1000
1200
2011 2012 2013 2014 2015 2016 2017(est)
Sources of Revenue $million
Bilateral amp other CGIAR Fund W3
0
500
1000
1500
2000
2500
3000
2012 2013 2014 2015 2016
No of W3 and Bilateral Projects
gt1m 500k - 999k 200k - 499k lt200k
2012 2013 2014 2015 2016 -
200
400
600
800
1000
1200
Total Annual Grants Pledged $million
gt1m 500k - 999k 200k - 499k lt200k

SDG
Program Platform
Partner Institutions
2016 2017 2018
CCAFS ndash Peer-reviewed Papers
Journal Paper Journal Open Access ISI
Complete Genome Sequence of Rice hoja blanca tenuivirus Isolated from a Susceptible Rice Cultivar in Colombia Theoretical and Applied Genetics
Common Bean Genomes Mining New Knowledge of a Major Societal Crop Field Crops Research
Breeding implications of drought stress under future climate for upland rice in Brazil Agriculture Ecosystems and Environment
Landscape context does not constrain biological control of Phenacoccus manihoti in intensified cassava systems of southern Vietnam
Agronomy for Sustainable Development
Peer-reviewed Papers
0 10 20 30
FISH
FTA
LIVESTOCK
MAIZE
RICE
RTB
WHEAT
GLDC
A4NH
CCAFS
PIM
WLE
GENEBANK
EiB
BIG DATA
CRP
PTF
Clicking on a specific program filters information on the page accordingly
135
135
CCAFS ndash Social AttentionTop 10 publications by Altmetric score
Publication Score Date View on Altmetric
Natural climate solutions 810 16-10-17 Details page URL
Farming and the geography of nutrient production for human use a transdisciplinary analysis 191 01-04-17 Details page URL
Linking regional stakeholder scenarios and shared socioeconomic pathways Quantified West African food and climate futures in a global context
126 01-03-17 Details page URL
Agriculture production as a major driver of the Earth system exceeding planetary boundaries 107 12-10-17 Details page URL
10 best bet innovations for adaptation in agriculture A supplement to the UNFCCC NAP Technical Guidelines 48 02-11-17 Details page URL
Greenhouse gas emissions from agricultural food production to supply Indian diets Implications for climate change mitigation 40 01-01-17 Details page URL
Special issue on climate-smart agriculture (CSA) 34 13-05-17 Details page URL
lsquoCSA-Planrsquo strategies to put Climate-Smart Agriculture (CSA) into practice 27 06-06-17 Details page URL
Clicking on the link takes the user to the
Altmetric page from which the article can be
accessed
Peer-reviewed PapersCGIAR Program Results Dashboard
Clicking here allows to view a specific program page accordingly
30
5
Policies
6
Innovation by Stage Peer-reviewed Papers
1918
Partnerships
34
Outcome Case StudiesCase Study Title CRP
Describing the rice production context in Latin America policy briefs on rice to the FLAR member countries
RICE
15
Progress Towards Milestones
Flagship Project 1Mapped and contributing to Sub-IDO
2022 CRP outcomes (from proposal)
MilestoneAssessment of risk to achievement (LMH)
Milestone 11 Increased capacity for innovation in partner research organizations
Foresight analyses and priority setting used by RICE and partner scientists to develop and target technology options
Application of the rice monitoring system for national food security program in Cambodia supporting Thailand disaster relief program for rice farmers crop insurance implementation in Tamil Nadu India Cambodia and Mekong River Delta Vietnam and development of remote sensing based rice monitoring system for Bihar India
L support from national partners
Milestone 12 Improved capacity of women and young people to participate in decision-making
Improved role in decision making by women and youth in rice value chains as evidenced by empowerment measures at key action sites
Gender-youth business models in rice value chain reinforced through better understanding of changing roles on decision making of women and youth in rice farming
M Dependence on support from national partners and governments
Flagship project 1 Accelerating impact and equity
Budget by Window of Funding
Filter by Program Year and Flagship
2018
Reporting Indicators
CRP Staffing
Clicking on any indicator will provide the details available in the table below
Link to Program Information on cgiarorgLinkRICE
CGIAR Program Results Dashboard
31
SECTION 3 PROCESSES
32
31 - Program Performance Management Standards (component 9)
The opportunity to strengthen incentives for high-quality program performance management and provide greater assurance to the SMB and System Council
The ideasbull Adoption of a limited set of program
performance standards for each business cycle in response to the challenges of performance assessment inherent in the variety complexity technical specificity and timelines of the research programs
bull Minimum standards required would change be raised over successive business cycles
bull Specific standards to be agreed with Funders CRPsCenters and SMB
bull Would complement and build on other elements of framework ndash egevaluation
32
Minimum standardsexamples of possible measures for Cycle 1 Rationale assumptions Examples of
measurement optionsReliabilityCredibilityProgram governance structures provide an effective challenge and verification function for management prioritization of research including consideration of future scenarios
Program governance (eg steering committees) should provide an effective specialist technical critique and challenge for prioritization decisions
Evaluation of structures and processes based on agreed quality criteria Qualitative passfail
Relevance and DeliveryEffectivenessgt80 of the Programrsquos projects document a clear and credible impact pathway with a clear product and delivery pathway in mind (appropriate to stage of maturity of research)
Written impact pathways are one good way to check a clear lsquooutcome focusrsquo as well as whether the assumptions are credible
Verification of a random sample of projects with W1W2 funding or co-funding based on agreed quality criteria
Delivery Effectiveness and ReputationLegitimacyKey research project documents for each program are available electronically on a central MIS system or another system accessible by central system advisory bodies (covering gt80 of total research budget)
Availability of project documents is a lsquoboring but importantrsquo necessary step for internal assessments of aspects such as impact pathways (above)
Availability of documents checked
ReputationLegitimacyProgram has processes or contracts in place to ensure appropriate ethical approval for all projects [IRB is primary responsibility of Centers]
Ethical approval processes (IRB) are an important part of ensuring ethical work with human subjects
Evaluation of processes and a sample of decisions based on agreed criteria Qualitative passfail
SECTION 3 PROCESSES
33
The 5 points Description
1 Adopt A multi-year pledging process for W1 amp W2 ndash with multi-year pledging at CRPplatform (and flagship where desired) level
A central objective of business plan is to increase the share of multi-annual pledges and to translate these into multi-annual pledges at the CRPplatform level ndash transforming the level of forward predictability for the shared science agenda through W1 ampW2
2 Revise Use of W1 to change the internal hydraulics
De-link W1 from W2 in terms of its ex post ldquoshock absorbingrdquo within each financial year but continue to link W1 to W2 to support the rebalancing of funding ex ante at the start of the multi--year funding period based on W2 forward pledgescommitments
3 Clarify Approach to allocation within and between cycles
Clarification of between and within business-cycle approaches alongside adoption of a funding target-setting approach to guide funding decisions over the remaining time in the current portfolio
4 Efficiency Optimal funding received to manage down transaction costs
Re-concentrate funding in large pooled programs and decrease number of small W3bilateral projects
5 Recovery Full overhead costs of projects
Adoption of collective System Council ambition to cover minimum overhead costs requested by Centers
PROCESSES
The opportunity By resolving long-standing challenges in CGIARrsquos financing system this can build the needed confidence in CGIAR financing so that reliability percentage share and absolute level of overall and system financing can be maintained and even increased
Sub-section 32A 5-point plan to improve System funding modalities
SECTION 3 PROCESSES
34
32 - Point 3 - Clarify Approach to allocation within and between cycles
Between business cycles During each 3-year business cyclePotential reset of starting point in funding across system Fundamental reconsideration of balance of funding between key focus areasprogram themes based on the list of prioritization criteria set out in the Council Paper on an allocation strategy referenced above
Tool simulation tool that aligns potential programs with broader strategic SLOhigher level outcomes potentially also collecting and presenting relevant available information on strategic fit and performance
Overall output of process Program-level W12 funding targets for subsequent business cycle period
Methodology Annual review of funding targets and W1 forward allocations to take into account any exceptional changes -particularly changes in strategic considerations such as a changing risk context (eg new pestdisease) or a potential new funding opportunity
SECTION 3 PROCESSES
Starting premiseThe budgeting process leading to the CRPPlatforms funding request as presented to the System Council in September 2016 was sufficiently robust and detailed to guide funding allocations for the remaining 3-year period of CRPsplatforms
Concept for initial 2019-2021 Business PlanFunding and program planning would be substantiated bybull A 3-year indicative workplan underpinning the
Business Plan and subjected to potential alterations resulting from the breeding initiative or other potential modifications to the current Portfolio
bull Detailed annual programmatic planning through the existing workplan and budgeting process
Key recognitionThe budgeting process for the implementation periods from 2022 needs to learn and evolve from that undertaken in 2015
35
32 - Point 3 - Portfolio Budgets Allocation baseline
Budget by expense category
Funding Plan
SECTION 3 PROCESSES
36
32 - Point 3 - A starting point for ldquobaseline funding targetsrdquo for 2019-2021 Business Plan (Note subject to potential revision for final draft Plan)
W1amp2 proposed budget ($USm original proposals) 2019 2020 2021 Total BaseGrain Legumes and Dryland Cereals 121 127 133 381Fish 74 78 82 233Forests Trees and Agroforestry 120 125 131 377Livestock 223 235 246 704Maize 125 131 138 394Rice 171 175 179 524Roots Tubers and Bananas 243 253 263 760Wheat 165 174 182 521Agriculture 4 Nutrition and Health 218 227 238 683Climate Change Agriculture and Food Security 232 243 255 730Policies Institutions and Markets 194 194 200 587Water Land and Ecosystems 110 116 122 348Genebanks 188 153 132 472Excellence in Breeding 22 23 24 70Big Data 52 45 43 139
Total Portfolio Base Budget 2258 2299 2368 6923
hellipThus - the September 2016 submitted budgets would form the starting point of discussions with the SMB and System Council on the funding targets for the 2019-2021 period as informed by any updated program platform information and any new elements or key changes to the Portfolio
SECTION 3 PROCESSES
A possible goal of the initial 2019-2021 business plan is to explore appropriate incentives to reduce the number of projects that are less than $200K by [X ndash for discussion and agreement]
37
32 - Point 4 - Efficiency Optimal funding received to manage down transaction costs
Ave Annual Grant 2012 2013 2014 2015 2016gt1m 167 182 205 225 212 500k - 999k 175 183 202 224 214 200k - 499k 424 466 454 457 463 lt200k 1674 1570 1280 1356 1398 Total no of projects 2440 2401 2141 2262 2287
Centers continue to manage a large number of restricted W3 and bilateral projects
0
200
400
600
800
1000
1200
2011 2012 2013 2014 2015 2016 2017(est)
Sources of Revenue $million
Bilateral amp other CGIAR Fund W3
0
500
1000
1500
2000
2500
3000
2012 2013 2014 2015 2016
No of W3 and Bilateral Projects
gt1m 500k - 999k 200k - 499k lt200k
2012 2013 2014 2015 2016 -
200
400
600
800
1000
1200
Total Annual Grants Pledged $million
gt1m 500k - 999k 200k - 499k lt200k

SECTION 3 PROCESSES
32
31 - Program Performance Management Standards (component 9)
The opportunity to strengthen incentives for high-quality program performance management and provide greater assurance to the SMB and System Council
The ideasbull Adoption of a limited set of program
performance standards for each business cycle in response to the challenges of performance assessment inherent in the variety complexity technical specificity and timelines of the research programs
bull Minimum standards required would change be raised over successive business cycles
bull Specific standards to be agreed with Funders CRPsCenters and SMB
bull Would complement and build on other elements of framework ndash egevaluation
32
Minimum standardsexamples of possible measures for Cycle 1 Rationale assumptions Examples of
measurement optionsReliabilityCredibilityProgram governance structures provide an effective challenge and verification function for management prioritization of research including consideration of future scenarios
Program governance (eg steering committees) should provide an effective specialist technical critique and challenge for prioritization decisions
Evaluation of structures and processes based on agreed quality criteria Qualitative passfail
Relevance and DeliveryEffectivenessgt80 of the Programrsquos projects document a clear and credible impact pathway with a clear product and delivery pathway in mind (appropriate to stage of maturity of research)
Written impact pathways are one good way to check a clear lsquooutcome focusrsquo as well as whether the assumptions are credible
Verification of a random sample of projects with W1W2 funding or co-funding based on agreed quality criteria
Delivery Effectiveness and ReputationLegitimacyKey research project documents for each program are available electronically on a central MIS system or another system accessible by central system advisory bodies (covering gt80 of total research budget)
Availability of project documents is a lsquoboring but importantrsquo necessary step for internal assessments of aspects such as impact pathways (above)
Availability of documents checked
ReputationLegitimacyProgram has processes or contracts in place to ensure appropriate ethical approval for all projects [IRB is primary responsibility of Centers]
Ethical approval processes (IRB) are an important part of ensuring ethical work with human subjects
Evaluation of processes and a sample of decisions based on agreed criteria Qualitative passfail
SECTION 3 PROCESSES
33
The 5 points Description
1 Adopt A multi-year pledging process for W1 amp W2 ndash with multi-year pledging at CRPplatform (and flagship where desired) level
A central objective of business plan is to increase the share of multi-annual pledges and to translate these into multi-annual pledges at the CRPplatform level ndash transforming the level of forward predictability for the shared science agenda through W1 ampW2
2 Revise Use of W1 to change the internal hydraulics
De-link W1 from W2 in terms of its ex post ldquoshock absorbingrdquo within each financial year but continue to link W1 to W2 to support the rebalancing of funding ex ante at the start of the multi--year funding period based on W2 forward pledgescommitments
3 Clarify Approach to allocation within and between cycles
Clarification of between and within business-cycle approaches alongside adoption of a funding target-setting approach to guide funding decisions over the remaining time in the current portfolio
4 Efficiency Optimal funding received to manage down transaction costs
Re-concentrate funding in large pooled programs and decrease number of small W3bilateral projects
5 Recovery Full overhead costs of projects
Adoption of collective System Council ambition to cover minimum overhead costs requested by Centers
PROCESSES
The opportunity By resolving long-standing challenges in CGIARrsquos financing system this can build the needed confidence in CGIAR financing so that reliability percentage share and absolute level of overall and system financing can be maintained and even increased
Sub-section 32A 5-point plan to improve System funding modalities
SECTION 3 PROCESSES
34
32 - Point 3 - Clarify Approach to allocation within and between cycles
Between business cycles During each 3-year business cyclePotential reset of starting point in funding across system Fundamental reconsideration of balance of funding between key focus areasprogram themes based on the list of prioritization criteria set out in the Council Paper on an allocation strategy referenced above
Tool simulation tool that aligns potential programs with broader strategic SLOhigher level outcomes potentially also collecting and presenting relevant available information on strategic fit and performance
Overall output of process Program-level W12 funding targets for subsequent business cycle period
Methodology Annual review of funding targets and W1 forward allocations to take into account any exceptional changes -particularly changes in strategic considerations such as a changing risk context (eg new pestdisease) or a potential new funding opportunity
SECTION 3 PROCESSES
Starting premiseThe budgeting process leading to the CRPPlatforms funding request as presented to the System Council in September 2016 was sufficiently robust and detailed to guide funding allocations for the remaining 3-year period of CRPsplatforms
Concept for initial 2019-2021 Business PlanFunding and program planning would be substantiated bybull A 3-year indicative workplan underpinning the
Business Plan and subjected to potential alterations resulting from the breeding initiative or other potential modifications to the current Portfolio
bull Detailed annual programmatic planning through the existing workplan and budgeting process
Key recognitionThe budgeting process for the implementation periods from 2022 needs to learn and evolve from that undertaken in 2015
35
32 - Point 3 - Portfolio Budgets Allocation baseline
Budget by expense category
Funding Plan
SECTION 3 PROCESSES
36
32 - Point 3 - A starting point for ldquobaseline funding targetsrdquo for 2019-2021 Business Plan (Note subject to potential revision for final draft Plan)
W1amp2 proposed budget ($USm original proposals) 2019 2020 2021 Total BaseGrain Legumes and Dryland Cereals 121 127 133 381Fish 74 78 82 233Forests Trees and Agroforestry 120 125 131 377Livestock 223 235 246 704Maize 125 131 138 394Rice 171 175 179 524Roots Tubers and Bananas 243 253 263 760Wheat 165 174 182 521Agriculture 4 Nutrition and Health 218 227 238 683Climate Change Agriculture and Food Security 232 243 255 730Policies Institutions and Markets 194 194 200 587Water Land and Ecosystems 110 116 122 348Genebanks 188 153 132 472Excellence in Breeding 22 23 24 70Big Data 52 45 43 139
Total Portfolio Base Budget 2258 2299 2368 6923
hellipThus - the September 2016 submitted budgets would form the starting point of discussions with the SMB and System Council on the funding targets for the 2019-2021 period as informed by any updated program platform information and any new elements or key changes to the Portfolio
SECTION 3 PROCESSES
A possible goal of the initial 2019-2021 business plan is to explore appropriate incentives to reduce the number of projects that are less than $200K by [X ndash for discussion and agreement]
37
32 - Point 4 - Efficiency Optimal funding received to manage down transaction costs
Ave Annual Grant 2012 2013 2014 2015 2016gt1m 167 182 205 225 212 500k - 999k 175 183 202 224 214 200k - 499k 424 466 454 457 463 lt200k 1674 1570 1280 1356 1398 Total no of projects 2440 2401 2141 2262 2287
Centers continue to manage a large number of restricted W3 and bilateral projects
0
200
400
600
800
1000
1200
2011 2012 2013 2014 2015 2016 2017(est)
Sources of Revenue $million
Bilateral amp other CGIAR Fund W3
0
500
1000
1500
2000
2500
3000
2012 2013 2014 2015 2016
No of W3 and Bilateral Projects
gt1m 500k - 999k 200k - 499k lt200k
2012 2013 2014 2015 2016 -
200
400
600
800
1000
1200
Total Annual Grants Pledged $million
gt1m 500k - 999k 200k - 499k lt200k

SECTION 3 PROCESSES
A possible business plan target ofbull CGIAR indirect cost rate to remain on average at around 15 - with a range of maximum +- 5bull Funder commitment to meet full costing principles and support lsquoCGIAR Cost Principles and Indirect Cost
Guidelinesrsquo (which will be replacing Financial Guidelines 5 by end-2018)
38
32 - Point 5 - Recovery Full overhead costs of projects
Note Cost recovery for 2017 can only be estimated after June 2018
SECTION 3 PROCESSES
39
Sub-section 33A 4-point plan for an aligned assurance system
Item High-level summary (Potential ideas are more fully set out on the following slide)
1 Increase alignment in System-wide assurance systems
Align assurance cycles of the various assurance providers across the System and ensure coordinated planning regarding System risks during each 3-year business plan implementation period As alignment grows the potential exists to integrate Funder-own assurance planning into the 3 year cycles to better co-ordinate the various assurance needs
2 Improve risk maturity
Within each 3-year business plan implementation period work towards increasing risk management maturity and independent assurance of the standard(s) achieved
3 Evolve Internal Audit capability
Periodically assess improve and evolve internal audit activity according to the Institute of Internal Auditors Capability Model framework
4 Move towards a harmonized internal controls framework
Take a strategic look at potential opportunities to strengthen System-wide financial and other operational policy and guidelines to ensure a coherent internal control framework which is periodically reviewed for effectiveness
The OpportunityBuilding on the November 2017 approved CGIAR System Risk Management Framework ensure robust and aligned assurance mechanisms across the System to enhance confidence in and reliance upon CGIARrsquos risk management and assurance systems
PROCESSES
Selected ideas Stewarded by the Centersrsquo Audit Committee Chairs group to bring both a cross-System view and ensure efficient linkages and cascading upwards and downwards of information
SECTION 3 PROCESSES
40
33 ndash A 4-point plan for an aligned assurance system
Item1 Increase
alignment in System-wide assurance systems
Sharing of audit plans and considering relevant steps towards alignment of audit cycles to support a clearer view of System-wide risk-based assurance planning
Coordinated assurance planning focusing on alignment on prioritized key System-wide assurance areas
Alignment of assurance planning across System and Center-ownregional audit arrangements on System-wide risks
2Improve risk maturity
Move towards lsquoRepeatablersquo standard of risk maturity
Move towards and maintain a lsquoRepeatablersquo standard of risk maturity
Move towards and maintain a lsquoManagedrsquo standard of risk maturity
3 Evolve Internal Audit to enhance its capability to deliver value for money
Undertake Internal Audit External Quality Assessment (lsquoEQArsquo) across all Internal Audit arrangements against the IIA capability model
Implementation of recommendations strengthen IA capability and achieve and maintain lsquointegratedrsquo maturity level confirmed by annual self-assessment
Move to lsquoCGIAR Auditing Standardsrsquo that exceed minimum required IIA levels undertake required 5-yearly EQA in mid-cycle in 2nd business plan
4 Move towards a harmonized internal controls framework
Take stock of existing policies and guidelines on internal control Identify prioritized opportunities for improvement vis-agrave-vis best practice within CGIAR
Implement priority activities and develop and adopt a System-wide internal control framework based on best global practice
Periodically assess System-wide internal control framework for adequacy implement improvements as required
Articulation of elements focused on maturity of assurance systems
would be informed by relevant elements of the lsquo2030 Planrsquo and
lessons learned in previous cycles
SECTION 1 STRATEGY SECTION 2 STRUCTURE SECTION 3 PROCESSES SECTION 4 REWARDS SECTION 5 PEOPLE
41
CGIAR operates in an increasingly competitive and results-accountableenvironment Critical to realizing the goals of the SRF and a lsquo2030 Planrsquothe CGIAR Portfolio requires an adequate level of predictable multi-yearinvestment Additionally to build funding resilience new Funders must beengaged and new funding mechanisms developed
The opportunity to stabilize and reverse fall of pooled programmatic funding in the CGIAR Set out a path to support the achievement of a 35 share for W1W2 system investment by demonstrating value-for-money through better program reporting enhanced linkages with delivery partners sharing stories of impact and elevated visibility and recognition for System Funders
The ideas
41 Reaffirm funder commitments
42 Attract new investments to shared research agenda
43 Stewardship visibility and recognition
Section 4 ndash Rewards
More detail
Slide 42
Slide 43
Slide 44
Securing a predictable and long-term funding base
42
REWARDS
Sub-section 41Reaffirm Funder Commitments
Pathways POTENTIAL 2019-2021 BUSINESS PLAN CONTENTUse of W1 to incentivize change
A consideration for the business plan could include whether and how window 1 is being maximized in terms of their incentive affect in supporting the changes set out in the final business plan ndash eg use of W1 to co-finance any major alliance-building measures between Centers
Appropriate incentive framework for reconciliation of System Council Funder seating
Successive 3-year business plans could set out how and upon which basis CGIARrsquos Funders agree to allocate the 15 lsquoFunderrsquo voting members seats for the System Council Potentially there would be the opportunity to build System Council representation into business cycle to maximize incentives for funder pledgesparticipation
Ambitious but achievable funding targets
Funding ambition for business plan - [$750m] [3-year] W12 pledges alongside $[X]m additional W3 pledged and launch of diversified funding initiatives
Increased funding predictability
Secure multi-year pledgesindicative plans from as many System Council Funders as possible ndash at program level too
Increased investments from Funders
Increase level of investment from existing Funders to reach CRP upliftstretch budget Deliver on performance and reporting Identify opportunities for System level efficiencies
43
REWARDS
Sub-section 42Attract new investments to shared research agenda
Pathways POTENTIAL 2019-2021 BUSINESS PLAN CONTENTBring new funders to System
Target key markets for funder engagement to bring increased support to System level funding China Cooperation Germany Norway
Leverage new finance mechanisms
Develop CGIAR capacity and new mechanism to access funding for shared research agenda- A new climate and agriculture research capital fund (RCF)- ECDesira investments in agricultural research- A new MDB partnership strategy
Launch of new lsquoCGIAR crops to end hungerrsquo initiative
Support the development and launch of this initiative securing additional funding where possible
New strategic initiatives launched
Launch new strategic initiatives that crowd in greater investments (eg climate breeding biofortification AMR fall army worm hellip)
44
REWARDS
Sub-section 43Stewardship Visibility amp Recognition
PathwaysPOTENTIAL 2019-2021 BUSINESS PLAN CONTENT
Elevate CGIAR in global agenda
Bring CGIAR to Global dialogue in support of Agricultural Research agenda- Collaborative events in Funder
countries- World Food Prize ndash Borlaug Dialogue- UN General Assembly- FAO Summit for Innovation in
Agriculture- EAT Forum- Davos- G7 G20 Minister Meetings
Establish CGIAR as global voice on sustainable food systems
Elevate CGIAR in main-stream media Publish collective statements and policy documents Establish reputation as first identifierresponder to emerging issues
Take the CGIAR Pledge
Establish common practice for Funder recognition and System wide branding and communications
SECTION 5 PEOPLESECTION 1 STRATEGY SECTION 2 STRUCTURE SECTION 3 PROCESSES SECTION 4 REWARDS SECTION 5 PEOPLE
45
Attracting retaining and nurturing the best
The opportunity
Ensure that CGIAR is recognized as aglobal leader in providing the rightincentives that ensure we as a Systemrecruit develop reward and promotegreat people to allow us to operate atmaximum efficiency recognizing thatmost of the key hiring decisions aremade by Center leadership
Selected ideas for 2019-2021
51 Embed gender equity in the workplace
52 Operate according to best practice ethical standards
53 Monitor metrics tied to an agreed people strategy
Section 5 ndash People
More detail
Slide 46 (for all items)
SECTION 5 PEOPLE
46
Topic Potential Business Plan Content51 Embed
gender equity in the workplace
bull Adoption of high-level CGIAR Vision statement on gender equity building on SMB appointment of Gender championbull Reshaping the CGIAR Diversity and Inclusion Strategy ndash driven by Center HR professionals as sponsored by Board of
Trustee Chairs and Directors Generalbull Agree targets for gender representation across major staff categories + core set of KPIs to inform progressbull Consider possible appropriate incentive framework eg including in Program Performance Management Standards
52 Operate according to best practice ethical standards
bull Linked to CGIAR Risk Management Framework lsquoNon-adherence to appropriate valuesrsquo Risk Family - focus on providing assurance that the Systemrsquos entities are operating according to best practice policies in
bull all forms of harassment and discriminationbull safeguarding preventing and effectively responding to exploitation abuse and violence and bull preventiondetection of corruption andbull effective mitigation of conflicts of interest
bull Key elements System event reporting procedures a plan to respond effectively to detected policy practice and education gaps and periodic assurance thereafter
53 Monitor metrics tied to an agreed people strategy
bull Consider developing and deploying common HR metrics System-wide (eg internal quantitative and qualitative lsquodashboardsrsquo) that provide Boards of Trustees and management with helpful data upon which to take strategic HR decisions
bull Quantitative metrics could include information on diversity attrition performance of HR function (eg recruitment success)
bull Qualitative metrics could for example include results of surveys assessing leadership and employee engagement 360 reviews across CGIAR leadership positions
PEOPLE
Attracting retaining and nurturing the best
Context Amongst many other key developmentsglobalizationdeveloping country sourcing increased competitionfor talent shifts in core operations and the demonstratedbenefits of diversity (together with inherent ethics and culturalchallenges) all necessitate that CGIAR places an increased focuson its people strategy as a key element in any business plan cycle
Adopts idea from a think piece of The Boston Consulting Group on people strategy titled ndash lsquoOpportunities for Actionrsquo 2006
The opportunity Use the balance of2018 for Centers to more fullyexplore possible concepts ndash toprioritize the most importantelements and adopt a forward-looking implementation plan
- A Business Plan Concept 5 Proposed Themes and 15 potential lsquobig ideasrsquo
- Background on business plan concept
- Framing the business plan concept
- A possible business plan meta-narrative
- Situating the Business Plan - Global Challenges
- Situating the Business Plan Harnessing knowledge-intensive transformations
- A possible structure for the Business Plan
- Summary 5 themes and 15 potential lsquobig ideasrsquo for an initial CGIAR System 3-year business plan
- Section 1 ndash Strategy
- Slide Number 10
- 11 Defining a planning landscape to 2030 - 4 layers
- 11 Aligning with the Sustainable Development Goals (SDGs)
- 11 Defining a planning landscape to 2030 - 3-year business plan concept
- Slide Number 14
- Slide Number 15
- Slide Number 16
- Section 2 ndash Structure
- Section 2 ndash Structure
- Slide Number 19
- 21 Deeper System-wide cooperation and alignment Modernizing and increasing research data availability
- Slide Number 21
- 23 Strengthened collaboration with delivery partners
- Section 3 ndash Processes
- Slide Number 24
- 31 A program performance management framework
- 31 - Annual CGIAR Performance Report a new approach (component 1)
- 31 - A new CGIAR Program Results Dashboard (component 5)
- Slide Number 28
- Slide Number 29
- Slide Number 30
- Slide Number 31
- Slide Number 32
- 31 - Program Performance Management Standards (component 9)
- Slide Number 34
- 32 - Point 3 - Clarify Approach to allocation within and between cycles
- 32 - Point 3 - Portfolio Budgets Allocation baseline
- 32 - Point 3 - A starting point for ldquobaseline funding targetsrdquo for 2019-2021 Business Plan (Note subject to potential revision for final draft Plan)
- 32 - Point 4 - Efficiency Optimal funding received to manage down transaction costs
- 32 - Point 5 - Recovery Full overhead costs of projects
- Slide Number 40
- 33 ndash A 4-point plan for an aligned assurance system
- Section 4 ndash Rewards
- Slide Number 43
- Slide Number 44
- Slide Number 45
- Section 5 ndash People
- Slide Number 47
-

SECTION 3 PROCESSES
40
33 ndash A 4-point plan for an aligned assurance system
Item1 Increase
alignment in System-wide assurance systems
Sharing of audit plans and considering relevant steps towards alignment of audit cycles to support a clearer view of System-wide risk-based assurance planning
Coordinated assurance planning focusing on alignment on prioritized key System-wide assurance areas
Alignment of assurance planning across System and Center-ownregional audit arrangements on System-wide risks
2Improve risk maturity
Move towards lsquoRepeatablersquo standard of risk maturity
Move towards and maintain a lsquoRepeatablersquo standard of risk maturity
Move towards and maintain a lsquoManagedrsquo standard of risk maturity
3 Evolve Internal Audit to enhance its capability to deliver value for money
Undertake Internal Audit External Quality Assessment (lsquoEQArsquo) across all Internal Audit arrangements against the IIA capability model
Implementation of recommendations strengthen IA capability and achieve and maintain lsquointegratedrsquo maturity level confirmed by annual self-assessment
Move to lsquoCGIAR Auditing Standardsrsquo that exceed minimum required IIA levels undertake required 5-yearly EQA in mid-cycle in 2nd business plan
4 Move towards a harmonized internal controls framework
Take stock of existing policies and guidelines on internal control Identify prioritized opportunities for improvement vis-agrave-vis best practice within CGIAR
Implement priority activities and develop and adopt a System-wide internal control framework based on best global practice
Periodically assess System-wide internal control framework for adequacy implement improvements as required
Articulation of elements focused on maturity of assurance systems
would be informed by relevant elements of the lsquo2030 Planrsquo and
lessons learned in previous cycles
SECTION 1 STRATEGY SECTION 2 STRUCTURE SECTION 3 PROCESSES SECTION 4 REWARDS SECTION 5 PEOPLE
41
CGIAR operates in an increasingly competitive and results-accountableenvironment Critical to realizing the goals of the SRF and a lsquo2030 Planrsquothe CGIAR Portfolio requires an adequate level of predictable multi-yearinvestment Additionally to build funding resilience new Funders must beengaged and new funding mechanisms developed
The opportunity to stabilize and reverse fall of pooled programmatic funding in the CGIAR Set out a path to support the achievement of a 35 share for W1W2 system investment by demonstrating value-for-money through better program reporting enhanced linkages with delivery partners sharing stories of impact and elevated visibility and recognition for System Funders
The ideas
41 Reaffirm funder commitments
42 Attract new investments to shared research agenda
43 Stewardship visibility and recognition
Section 4 ndash Rewards
More detail
Slide 42
Slide 43
Slide 44
Securing a predictable and long-term funding base
42
REWARDS
Sub-section 41Reaffirm Funder Commitments
Pathways POTENTIAL 2019-2021 BUSINESS PLAN CONTENTUse of W1 to incentivize change
A consideration for the business plan could include whether and how window 1 is being maximized in terms of their incentive affect in supporting the changes set out in the final business plan ndash eg use of W1 to co-finance any major alliance-building measures between Centers
Appropriate incentive framework for reconciliation of System Council Funder seating
Successive 3-year business plans could set out how and upon which basis CGIARrsquos Funders agree to allocate the 15 lsquoFunderrsquo voting members seats for the System Council Potentially there would be the opportunity to build System Council representation into business cycle to maximize incentives for funder pledgesparticipation
Ambitious but achievable funding targets
Funding ambition for business plan - [$750m] [3-year] W12 pledges alongside $[X]m additional W3 pledged and launch of diversified funding initiatives
Increased funding predictability
Secure multi-year pledgesindicative plans from as many System Council Funders as possible ndash at program level too
Increased investments from Funders
Increase level of investment from existing Funders to reach CRP upliftstretch budget Deliver on performance and reporting Identify opportunities for System level efficiencies
43
REWARDS
Sub-section 42Attract new investments to shared research agenda
Pathways POTENTIAL 2019-2021 BUSINESS PLAN CONTENTBring new funders to System
Target key markets for funder engagement to bring increased support to System level funding China Cooperation Germany Norway
Leverage new finance mechanisms
Develop CGIAR capacity and new mechanism to access funding for shared research agenda- A new climate and agriculture research capital fund (RCF)- ECDesira investments in agricultural research- A new MDB partnership strategy
Launch of new lsquoCGIAR crops to end hungerrsquo initiative
Support the development and launch of this initiative securing additional funding where possible
New strategic initiatives launched
Launch new strategic initiatives that crowd in greater investments (eg climate breeding biofortification AMR fall army worm hellip)
44
REWARDS
Sub-section 43Stewardship Visibility amp Recognition
PathwaysPOTENTIAL 2019-2021 BUSINESS PLAN CONTENT
Elevate CGIAR in global agenda
Bring CGIAR to Global dialogue in support of Agricultural Research agenda- Collaborative events in Funder
countries- World Food Prize ndash Borlaug Dialogue- UN General Assembly- FAO Summit for Innovation in
Agriculture- EAT Forum- Davos- G7 G20 Minister Meetings
Establish CGIAR as global voice on sustainable food systems
Elevate CGIAR in main-stream media Publish collective statements and policy documents Establish reputation as first identifierresponder to emerging issues
Take the CGIAR Pledge
Establish common practice for Funder recognition and System wide branding and communications
SECTION 5 PEOPLESECTION 1 STRATEGY SECTION 2 STRUCTURE SECTION 3 PROCESSES SECTION 4 REWARDS SECTION 5 PEOPLE
45
Attracting retaining and nurturing the best
The opportunity
Ensure that CGIAR is recognized as aglobal leader in providing the rightincentives that ensure we as a Systemrecruit develop reward and promotegreat people to allow us to operate atmaximum efficiency recognizing thatmost of the key hiring decisions aremade by Center leadership
Selected ideas for 2019-2021
51 Embed gender equity in the workplace
52 Operate according to best practice ethical standards
53 Monitor metrics tied to an agreed people strategy
Section 5 ndash People
More detail
Slide 46 (for all items)
SECTION 5 PEOPLE
46
Topic Potential Business Plan Content51 Embed
gender equity in the workplace
bull Adoption of high-level CGIAR Vision statement on gender equity building on SMB appointment of Gender championbull Reshaping the CGIAR Diversity and Inclusion Strategy ndash driven by Center HR professionals as sponsored by Board of
Trustee Chairs and Directors Generalbull Agree targets for gender representation across major staff categories + core set of KPIs to inform progressbull Consider possible appropriate incentive framework eg including in Program Performance Management Standards
52 Operate according to best practice ethical standards
bull Linked to CGIAR Risk Management Framework lsquoNon-adherence to appropriate valuesrsquo Risk Family - focus on providing assurance that the Systemrsquos entities are operating according to best practice policies in
bull all forms of harassment and discriminationbull safeguarding preventing and effectively responding to exploitation abuse and violence and bull preventiondetection of corruption andbull effective mitigation of conflicts of interest
bull Key elements System event reporting procedures a plan to respond effectively to detected policy practice and education gaps and periodic assurance thereafter
53 Monitor metrics tied to an agreed people strategy
bull Consider developing and deploying common HR metrics System-wide (eg internal quantitative and qualitative lsquodashboardsrsquo) that provide Boards of Trustees and management with helpful data upon which to take strategic HR decisions
bull Quantitative metrics could include information on diversity attrition performance of HR function (eg recruitment success)
bull Qualitative metrics could for example include results of surveys assessing leadership and employee engagement 360 reviews across CGIAR leadership positions
PEOPLE
Attracting retaining and nurturing the best
Context Amongst many other key developmentsglobalizationdeveloping country sourcing increased competitionfor talent shifts in core operations and the demonstratedbenefits of diversity (together with inherent ethics and culturalchallenges) all necessitate that CGIAR places an increased focuson its people strategy as a key element in any business plan cycle
Adopts idea from a think piece of The Boston Consulting Group on people strategy titled ndash lsquoOpportunities for Actionrsquo 2006
The opportunity Use the balance of2018 for Centers to more fullyexplore possible concepts ndash toprioritize the most importantelements and adopt a forward-looking implementation plan
- A Business Plan Concept 5 Proposed Themes and 15 potential lsquobig ideasrsquo
- Background on business plan concept
- Framing the business plan concept
- A possible business plan meta-narrative
- Situating the Business Plan - Global Challenges
- Situating the Business Plan Harnessing knowledge-intensive transformations
- A possible structure for the Business Plan
- Summary 5 themes and 15 potential lsquobig ideasrsquo for an initial CGIAR System 3-year business plan
- Section 1 ndash Strategy
- Slide Number 10
- 11 Defining a planning landscape to 2030 - 4 layers
- 11 Aligning with the Sustainable Development Goals (SDGs)
- 11 Defining a planning landscape to 2030 - 3-year business plan concept
- Slide Number 14
- Slide Number 15
- Slide Number 16
- Section 2 ndash Structure
- Section 2 ndash Structure
- Slide Number 19
- 21 Deeper System-wide cooperation and alignment Modernizing and increasing research data availability
- Slide Number 21
- 23 Strengthened collaboration with delivery partners
- Section 3 ndash Processes
- Slide Number 24
- 31 A program performance management framework
- 31 - Annual CGIAR Performance Report a new approach (component 1)
- 31 - A new CGIAR Program Results Dashboard (component 5)
- Slide Number 28
- Slide Number 29
- Slide Number 30
- Slide Number 31
- Slide Number 32
- 31 - Program Performance Management Standards (component 9)
- Slide Number 34
- 32 - Point 3 - Clarify Approach to allocation within and between cycles
- 32 - Point 3 - Portfolio Budgets Allocation baseline
- 32 - Point 3 - A starting point for ldquobaseline funding targetsrdquo for 2019-2021 Business Plan (Note subject to potential revision for final draft Plan)
- 32 - Point 4 - Efficiency Optimal funding received to manage down transaction costs
- 32 - Point 5 - Recovery Full overhead costs of projects
- Slide Number 40
- 33 ndash A 4-point plan for an aligned assurance system
- Section 4 ndash Rewards
- Slide Number 43
- Slide Number 44
- Slide Number 45
- Section 5 ndash People
- Slide Number 47
-
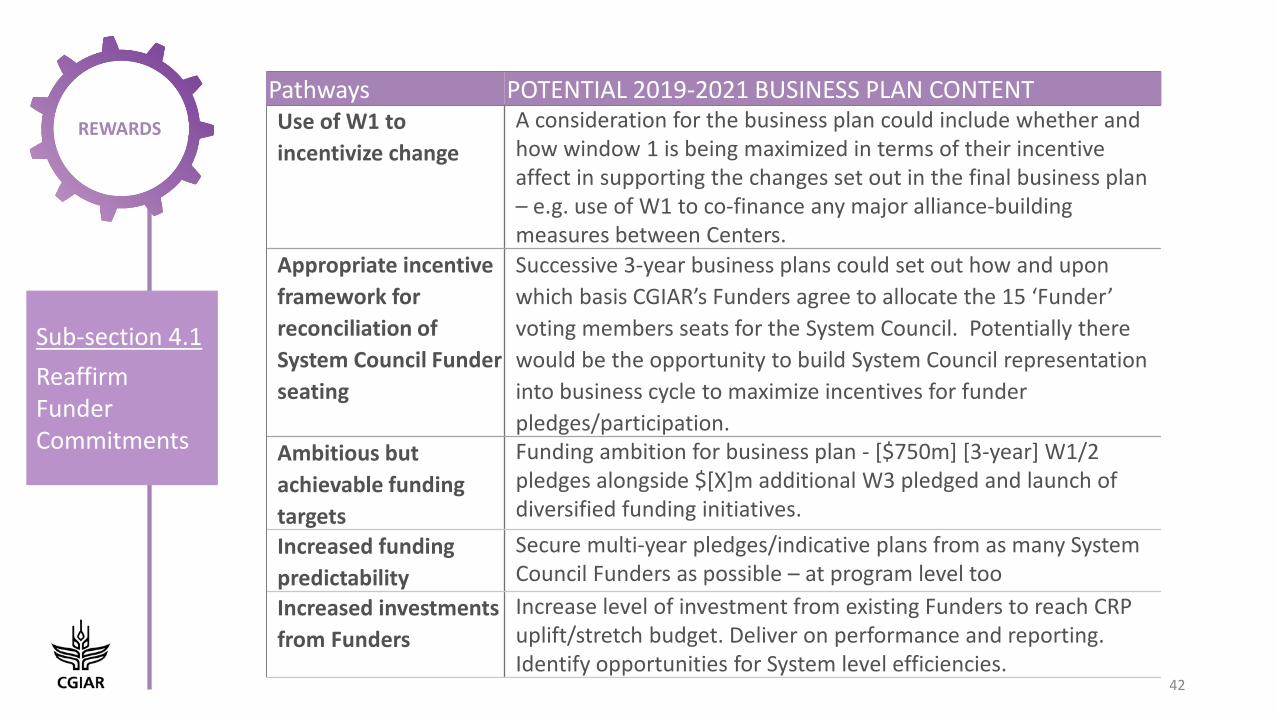