a baseline survey - whoapps.who.int/medicinedocs/documents/s16425e/s16425e.pdf · a baseline survey...
TRANSCRIPT

1
REPUBLIC OF KENYA MINISTRY OF HEALTH
ASSESSMENT OF THE PHARMACEUTICAL
SITUATION IN KENYA A BASELINE SURVEY
WORLD HEALTH ORGANISATION

2
TABLE OF CONTENTS
ACKNOWLEDGEMENTS....................................................................................................................6
1. EXECUTIVE SUMMARY..............................................................................................................7
2. INTRODUCTION............................................................................................................................8
2.1 COUNTRY PROFILE....................................................................................................................8 2.2 STRUCTURE OF HEALTH AND PHARMACEUTICAL SYSTEMS......................................................9 2.3 NATIONAL MEDICINES POLICY ................................................................................................9 2.4 MEDICINE PRODUCTION ...................................................................................................... 10
3. SURVEY DESIGN AND METHODOLOGY............................................................................... 10
3.1 SURVEY PURPOSE AND INDICATORS....................................................................................... 10 3.2 METHODOLOGY...................................................................................................................... 10
4. RESULTS AND ANALYSIS ........................................................................................................ 13
4.1 LEVEL I CORE INDICATORS..................................................................................................... 13 4.2 LEVEL II CORE INDICATORS.................................................................................................... 15
4.2.1 ACCESS...............................................................................................................................18 4.2.2 QUALITY AND SAFETY ................................................................... ……………………… 24 4.2.3 RATIONAL USE .................................................................................................................... 25
5. CONCLUSION…………………………………………………..………………………………….………35
6. POSITIVE ASPECTS AND AREAS FOR IMPROVEMENT ................................................... ..36 7. SUMMARY OF RECOMMENDATIONS………………………..…………………………..……………39 APPENDICES: APPENDIX 1-PROPOSAL……………………………………………………………………………………...40 APPENDIX 2-TRAINING TIMETABLE……………………………………………………………………….43 APPENDIX 3-ALLOCATION OF HEALTH FACILITIES TO DATA COLLECTORS……………………...44 APPENDIX 4- SURVEY FORMS 1-16…………………………………………………………………………45 APPENDIX 5- LIST OF BASKET OF MEDICINES…………………………………………………………...68 APPENDIX 6-LEVEL I QUESTIONNAIRE……………………………………………………………………69

3
LIST OF ABBREVIATIONS
DARE Decentralized HIV and Reproductive Health DFID Department for International Development (UK) DH District Hospital EDL Essential Drugs List GDP Gross Domestic Product GFATM Global Fund to Fight Aids Tuberculosis and Malaria GOK Government of Kenya GSU General Service Unit GTZ/PMU Gesellshaft fuer Technische Zusammenarbeit / Procurement
Management Unit HAI Health Action International HC Health Centre INN International Non-proprietary Name KEDL Kenya Essential Drugs List KEMSA Kenya Medical Supplies Agency KEPI Kenya Expanded Program on Immunization KNDP Kenya National Drug Policy KNH Kenyatta National Hospital MOH Ministry of Health NASCOP National Aids and STI Coordinating Program NLTP National Leprosy and Tuberculosis Program NPHLS National Public Health Laboratories Services ORS Oral Rehydration Salts PGH Provincial General Hospital PHF Public Health Facility PMO Provincial Medical Officer RH Reproductive Health RHDC Rural Health Demonstration Centre SDH Sub-District Hospital SP Sulphadoxine Pyrimethamine STG Standard Treatment Guidelines STI Sexually Transmitted Infection TB Tuberculosis UNICEF United Nations Children's Fund URTI Upper Respiratory Tract Infection WHO World Health Organization

4
LIST OF TABLES Page Table 2.1 General and health indicators 8
Table 2.2 Key Pharmaceutical Indicators 9
Table 4.1 Summary of the national indicator values 15

5
LIST OF FIGURES Page
Figure 4.1. Availability of key medicines in public health facilities (by quartiles)……18 Figure 4.2. Availability of key medicines in regional warehouses (by quartiles)…….. 18
Figure 4.3. Stock-out duration by quartiles in public health facilities and regional
Warehouses………………………………………………………………...19
Figure 4.4 Comparison of availability of key medicines and stock-out duration in
public health facilities and district warehouses……………………………19
Figure 4.5. Adequacy of stock records in public health facilities and regional Warehouses……………………………………………………………….. 20
Figure 4.6 Affordability of treatment at public health facilities and private health pharmacies by lowest daily government salary……………………………21
Figure 4.7 Percent medicines dispensed (by quartiles) in health facilities……………21 Figure 4.8 Sources of consultation…………………………………………………… 22 Figure 4.9 Primary reasons for not obtaining all prescribed medicines……………… 23 Figure 4.10 Average amount spent on medicines from each source of consultation …. 23
Figure 4.11 Adequacy of conservation conditions in public health facilities and regional warehouses………………………………………………………. 25
Figure 4.12 Adequacy of labelling in public health facilities…………………………. 26 Figure 4.13 Percentage of patients at public health facilities who know how to
take medicines……………………………………………………………. 27 Figure 4.14 Number of medicines per prescription (by quartiles) in public health
facilities………………………………………………………………….. 27 Figure 4.15 Percentage of patients prescribed an antibiotic in public health
facilities………………………………………………………………….. 28 Figure 4.16 Percentage of patients receiving one or more injections by quartiles in
public health facilities……………………………………………………. 29 Figure 4.17 Percentage of prescribed medicines on the KEDL………………………. 29 Figure 4.18 Percent availability of STGs and EDL in public health facilities…………. 30 Figure 4.19 Medicine prescribing by INN in public health facilities…………………. 31 Figure 4.20 Treatment of diarrhoea in children under age 5………………………….. 32 Figure 4.21 Treatment of mild/moderate pneumonia in children under age 5………… 32 Figure 4.22 Treatment of URTI using antibiotics…………………………………….. 33 Figure 4.23 Trends in malaria treatment in public health facilities…………………….33 Figure 4.24 Patient compliance in taking prescribed medicines in households………………. 34

6
ACKNOWLEDGEMENTS The Pharmaceutical Sector Baseline Survey was commissioned by the Ministry of Health and
conducted with financial and technical support from the World Health Organization, Department of
Essential Medicines and Policy/Drug Action Programme (WHO EDM), the WHO Country Office in
Kenya and Health Action International (HAI) Africa.
Special gratitude is extended to the Permanent Secretary, Ministry of Health, Director of Medical
Services, Chief Pharmacist and Dr. Bibiana Njue, Deputy Chief Pharmacist for their support in the
exercise. We also thank the Provincial Medical Officers from Coast, Nairobi, Nyanza, Eastern and
Rift Valley Provinces, who ensured that the necessary information was obtained in spite of the
difficult circumstances of data collection, as well as the support and cooperation of the staff at all of
the facilities visited. We appreciate the excellent training and logistical organisation provided by Mr.
Martin Auton WHO consultant, Dr. Charles Kandie, WHO/EDM national programme officer-Kenya,
Ms. Beryl Leach, HAI Africa and Ms. Diane Whitney, WHO/EDM Geneva. Dr. Jennifer Orwa and
Dr. Joseph Mukoko took the lead in analysing the data and compiling the draft report, and they would
like to thank Charles Kandie, Beryl Leach, Martin Auton and Diane Whitney for their valuable inputs
and editorial support in finalising it. Completion of the data entry, analysis and report writing would
not have been possible without the tireless efforts of Ms. Lorna Mueni. And not least, the survey
could not have been done without the interest and commitment of the survey team:
Mr. P. Chweya Dr. S. Kimatu Dr. J. Maina Dr. P. Mbuvi Dr. M. Mucheru Dr. J. Mukoko Dr. W. Ochieng Dr. M. Ojoo Dr. M. Oluka Dr. J. Ombogo Dr. J. Orwa Mr. S. Penni Mrs. D. Too Dr. P. Wanjala Mr. E. Ndubi

7
1. EXECUTIVE SUMMARY Assessing the pharmaceutical situation in a country provides baseline information on whether its population has access to essential medicines that are of good quality, are efficacious and are being used properly. Results for such assessment can be used as a guide by policy makers and managers to develop and define the necessary changes and priority areas that require support for improved health for all. In the light of the above, WHO supported Kenya in April 2003 to carry out a baseline survey in the pharmaceutical sector to assess the current situation regarding access and use of quality medicines. The survey was carried out using the WHO Operational Package for Monitoring and Assessing the Pharmaceutical Situation in Countries (April 2003 version) Kenya has the basic structures considered necessary for implementing a national medicine policy. However, no national assessment study has been conducted in the past to evaluate the impact of policy intervention. Data obtained from this survey show that availability of essential medicines in public health facilities is more than 90% with 97% of public health facilities having greater than 75% availability. 45% of the households surveyed sought healthcare from public health facilities, and 6% of all households surveyed could not obtain all the prescribed medicines due to financial incapability. The cost of treatment of most common diseases in public health facilities demonstrated considerable variation ranging from an equivalent of a quarter of a day’s lowest government salary for the treatment of child malaria in public health facilities to an equivalent of more than a day and a half’s salary for the treatment of adult pneumonia in private pharmacy outlet. More than 70% of the minimum criteria for adequate conservation conditions were met in only 30% of public health facilities. There is a general tendency to over-prescribe medicines especially antibiotics. A national median of 78% patients received antibiotics. Irrational dispensing was also demonstrated – in 70% of public health facilities, more than three-quarters of dispensed medicines were inadequately labelled. In 27% of public health facilities, less than half of the respondents understood how to take their medicines. Performance measures suggest there is a considerable need to improve prescribing and dispensing practices in public health facilities. Prescribers do not have access to key sources of therapeutic information they need in daily practice as Standard treatment guidelines (STG) were found in only 13% and the Essential Drugs Lists (EDL) was found in only 17% of public health facilities. Less than half public health facilities had more than 90% prescribing practice that conforms to the EDL. Only 29% of public health facilities used ORS, the recommended diarrhoea treatment, in greater than 90% of diarrhoea cases. There is need to investigate the reasons for underperformance identified in the areas affecting access, quality and rational use of essential medicines.

8
2. INTRODUCTION
2.1 Country profile
31 million people. The country’s economic growth has been on the decline since 1992 when Kenya embraced the Structural Adjustment Programme recommended by the World Bank and International Monetary Fund. The economy is at its lowest currently with an annual GDP growth of less than 1.4 %. The gradual economic decline has had a proportionate decrease on the Health indicators. The HIV/AIDS scourge has taken its toll on the Kenyan population. An estimated 2.2 million people, representing 13% of Kenya’s sexually active adult population are living with HIV/AIDS.
Table 2.1 General and health indicators1
Total population, 2001 31.3 millionPercentage of urban population, 2002 34Gross Domestic Product (GDP) per capita (US$), 2001 453.2Life expectancy at birth (M/F)(years), 2002 47/49Child mortality (M/F)(years) (probability of dying under age 5 years) (per 1000) 199/109Adult mortality (M/F)(probability of dying between 15 and 59) (per 1000) 560/513Per capita total expenditure on health in international dollars, 2000 115Total expenditure on health as percent of GDP, 2000 8.3Adult literacy rate, 2000 73.6%
1 WHO Country information for Kenya/ “Selected indicators”: http://www.who.int/country/ken/en/ (extracted: 18 August 2003)
Kenya lies on the eastern coast of Africa along the equator with a land area of 582,644 square kilometres inclusive of inland water. The climate and topography are characterised by wide diversions ranging from glaciated mountain peaks (notably Mount Kenya) to cool plateau, the humid coastal plane, and the vast and hot expanse of arid and semi-arid land, which covers the northern half and southern-eastern parts of the country. Administratively, it is divided into 8 provinces namely Central, Coast, Nyanza, Western, Eastern, Nairobi, Rift Valley and North Eastern. It has a population of approximately
9
2.2 Structure of health and pharmaceutical systems 2.2.1 Health care providers There are three different types of health care providers in Kenya. The main one is the Ministry of Health (MOH). Others are Faith-based organizations and private sector. The MOH primary health care centres provided free medical services until 1989 when cost sharing was introduced. ‘Cost sharing’ revenue is used to supplement the tax-financed government expenditure on medicines. In this system minimum fee is charged for health care services. Primary public health facilities provide free medical services to children of less than 5 years of age. Other services provided free are tuberculosis (TB) medicines, contraceptives and immunization. Faith-based organizations, NGOs and non-profit institutions provide care at subsidised rates. Private clinics and hospitals provide services at a fee paid either by private health insurance or by the patient. 2.2.2 Health care services There are five levels of public health care units namely; Dispensary, Health Centre, Sub-District hospital, District Hospital, Provincial General Hospital and Referral hospitals. Rural Health Facilities (Health centres and Dispensaries) constitute approximately 1700 facilities while the hospitals (sub-district hospitals, district hospitals and provincial hospitals) total 160 institutions. There are 2 referral hospitals namely, Kenyatta National Hospital and Moi Teaching and Referral Hospital. The physical accessibility of these health care services is poor, particularly in rural areas where many households are located in more than 10 km from a health facility. 2.2.3 Pharmaceutical systems Table 2.2 Key Pharmaceutical Indicators Date of National Drug Policy 1994 Date of Kenya Essential Drug List 1994 (Last revised 2002) Date of National Standard Treatment Guidelines 1994 (Last revised 2002) Public sector medicines expenditure US$16 million (2002/3) Public sector per capita medicines expenditure US$0.51 Pharmaceutical sector value US$ 130 million Number of registered pharmacists 1650 Number of pharmaceutical technologists 3000 Number of registered pharmacies 630 2.3 National Medicines Policy Before the development of the KNDP, a subsidiary regulation of the registration of all pharmaceutical products was introduced in 1982. The Kenya National Drug Policy was formulated in 1993-94 through a series of nation consensus building workshops and adopted by the Government of Kenya in 1994. The goal of the KNDP is to use available resources to develop pharmaceutical services so as to meet the requirements of all Kenyans in the prevention, diagnosis and treatment of diseases using efficacious, high quality, safe and cost-effective pharmaceutical products. The specific objectives of the KNDP aim to: Ensure constant availability of safe and effective drugs to all segments of the population; Provide drugs through the different sectors at affordable prices; Facilitate rational use of medicines through sound prescribing, dispensing and usage; Ensure that the quality of medicines manufactured in Kenya and those imported into Kenya meet
internationally accepted quality standards; Encourage self sufficiency through local manufacture of medicines for consumption and export; Ensure that the provision of medicines for veterinary services is consistent with the NDP
The pharmaceutical inspectorate as described in the KNDP has not been very effective in the enforcement of all aspects of good manufacturing practices including the storage and dispensing of pharmaceutical products. The existing policy on medicines does not cover traditional medicines even though they have been used by the population for generations. The policy on traditional medicine is not specific and currently these products

10
need not be registered with the MOH. The Pharmacy and Poisons Board is yet to provide specifications for the practice and utilization of traditional medicines. 2.4 Medicine Production There are 34 registered pharmaceutical manufacturers in Kenya. Some of these companies are subsidiaries of multinational pharmaceutical manufacturers. The companies generally repackage drugs or produce pharmaceutical dosage forms from imported raw materials. Pharmaceutical manufacture is a significant aspect of Kenya’s industrial sector. As it responds to challenges and opportunities, the generic pharmaceutical industry will continue to be a major force shaping the economics of medication use. 3. SURVEY DESIGN AND METHODOLOGY 3.1 Survey purpose The purpose of this survey was to assess the pharmaceutical situation in Kenya in order to help the policy makers and managers improve pharmaceutical services. The main objective was to collect baseline information on the pharmaceutical sector from available facility data sets, which will provide a clear picture of national and institutional problems so as to assess strategies and priorities required. 3.2 Methodology The survey was conducted using the WHO Operational Package for Monitoring and Assessing the Pharmaceutical Situation in Countries (April 2003 version). The package contains survey tools for two levels of core indicators and a household survey tool: Level I - Structural and process indicators were used to assess the existing structures and processes in the national pharmaceutical system Level II - Outcome indicators supported level I indicators by providing specific data about the important pharmaceutical outcomes The household survey form complemented the levels I and II indicators by examining issues on access and use of medicines in the community. Levels I and II indicators are almost entirely focussed on health structures and people visiting health facilities. This survey tool ensures data are collected about treatment-seeking behaviour and medicines consumption. The list of indicators is presented below. A description of the purpose of each indicator, together with instructions on how to collect, record and process the data can be found within the operational package. Level I indicators The level I core indicators were collected according to a questionnaire that was completed as part of a desktop exercise (Appendix 6). Level II indicators The level II indicators measure the degree to which Kenya is achieving the strategic pharmaceutical objectives of improved access, quality and rational use of medicines. Survey forms for these indicators can be found in Appendix 4. Access
Availability of key medicines in public health facility pharmacies, private pharmacies and regional warehouses
Stock-out duration in public health facilities and regional warehouses Affordability of treatment at public health facilities and private pharmacies Percentage of prescribed medicines dispensed/administered to patients at public health facility
pharmacies Access to medicines by households Average cost of medicines and related fees in public health facilities Price of key medicines in public health facilities and private pharmacies

11
Adequate stock record keeping at public health facilities and regional warehouses Quality and safety indicators
Presence of expired medicines in public health facility pharmacies, private pharmacies and regional warehouses
Adequacy of conservation conditions and handling of medicines in public health facility pharmacies and regional warehouses.
Rational use of medicines
Percentage of adequately labelled medicines dispensed in public health pharmacies Percentage of patients who know how to take medicines Average number of medicines prescribed in public health facilities Percentage of patients receiving antibiotics in public health facilities Percentage of patients receiving injections in public health facilities Percentage of prescribed medicines on the essential medicines list at public health facilities Percentage of prescribed medicines prescribed by INN/generic name at public health facilities Availability of standard treatment guidelines (STGs) in public health facilities Availability of essential medicines lists in public health facilities Percentage of tracer cases treated with medicines recommended or discouraged in STGs Use of medicines by households
Sampling and survey population Five provinces were selected from a possible eight. Nairobi and Eastern Provinces were chosen as the highest and lowest income-generating areas respectively. The other three provinces were chosen randomly, taking into account reasonable accessibility by the data collectors. The three randomly selected provinces were Nyanza, Rift Valley and Coast Provinces. A list of provinces and health facilities can be found in Appendix 3. In each province, the following units were surveyed:
Six public health facilities treating outpatients and with pharmacy or dispensary units Six private pharmacies One regional medicines warehouse 150 households, divided equitably into those within 5km, those between 5-10km away and those
more than 10km away from a surveyed health facility. Training of the survey team Adaptation of the survey forms for Kenya (see Appendix 5 for the list of key medicines selected for survey), training of 15 data collectors from both the ministry staff and civil society, location and facility selection and field testing were carried out during a training workshop held in Nairobi from 31st March through 4th April 2003. Data collection The survey of public health facilities, public warehouses, private pharmacy outlets and households was conducted between April 8 -17, 2003. Data were collected by five teams each of three data collectors, working concurrently in each of the provinces selected for the study, and all followed the procedures and approaches learned from the WHO operational package during the training. Scope and limitations of the data Sampling was done only in public health facilities leaving out private, NGOs and faith-based health facilities which provide a significant part of pharmaceutical services in Kenya. Preventative aspects of medicine use was not given prominence in this survey and given the importance of this issue in Kenya, there is need for a study to capture access to essential vaccines and preventative pharmaceuticals. To measure rational medicines use indicators, exit interviews with outpatients were used. The patients to be sampled are restricted to general illness encounters, representing a mix of health problems and ages. These

12
indicators have limitations when applied to pre- and post-natal visits, specialist consultations, or even separate clinics for adults and paediatric cases because treatment practices are different. Cases of non-bacterial diarrhoea in children under age 5 years were very few. In most instances, it was impossible to identify 10 cases at a facility. The reason for scarcity could not be established. There were also inadequate tracer cases obtained for mild/moderate pneumonia in children under age 5 years and non-pneumonia ARI in patients of any age. The total number of cases reviewed in some primary health facilities was relatively low because of low patient numbers. Since this was a cross-sectional study, retrospective and prospective sampling was combined. Retrospective sampling had limitations because some health facilities did not have sufficient records for random selection. Lack of co-operation, particularly of non-pharmaceutical personnel charged with medicines stores management, caused delays in data collection in some health facilities. Although in general the household interviews carried out were reliable, some difficulties were encountered in the Nairobi Region as would be expected in an urban centre (security, household members away at work, misunderstanding of symptoms, medicines use and expenditure estimates). Therefore the household results may not be representative of the national household situation.

13
4. RESULTS AND ANALYSIS 4.1 Level I core indicators The summary of the existing infrastructure and key processes of each component of the Kenyan pharmaceutical sector is presented in Appendix 6 in a level I questionnaire completed in April 2003 by the pharmacy division of the Ministry of Health. Below are some of the highlights. 4.1.1 National Medicine Policy • Kenya has an official National Medicine Policy document last updated in 1994. However no national
assessment study has been conducted to evaluate the impact of policy intervention. • The existing policy does not specifically cover the regulations of traditional medicines and the sections
relevant to addressing current public health priorities, such as HIV/AIDS and malaria, are not adequate. 4.1.2 Legislation/regulation • Pharmacy and Poisons Board is legally mandated to register medicines, inspect and licence
pharmaceutical manufacturers and retail outlets. There are no adequate national guidelines for pharmaceutical inspection process, hence there is insufficient ability to enforce compliance with the laid down Medicines legislation and regulations. The average time taken to finalize registration for market authorization is six months.
• Kenya as a member of the World Trade Organisation (WTO) modified its Intellectual Property Act in 2001 to be compliant with the WTO Agreement on Trade-Related Aspects of Intellectual Property Rights (TRIPs). Kenya now provides a 20-year patent protection for both products and processes. The Act is significant for the fact that it incorporates all of the public health protections that are TRIPs-compliant and that can be used to increase access to affordable medicines, namely compulsory licensing, government use, parallel importation and a “Bolar” provision to speed the introduction of generic versions once a patent on a medicine has expired. To date, none of these flexibilities has been used by the government to promote greater availability of cheaper essential medicines.
4.1.3 Quality control of pharmaceuticals • A National Quality Control Laboratory exists, however, it does not function efficiently. Of all the
samples collected within the past one year, less than 20% have been tested for regulatory purposes. 4.1.4 Essential medicines list • Selection of medicines for procurement in the public sector is based on the Kenya Essential Drugs List.
This is a fundamental element in promoting rational drug use and controlling health care cost. According to the Kenya Essential Drug List, the criteria for selection of drugs are quality, safety, efficacy and cost as well as intended level of care at which medicines will be used and epidemiological profile.
4.1.5 Medicines supply system • The MOH and individual health institutions are responsible for procurement and distribution of
medicines in the public sector. The government also contracts private institutions to procure medicines for public health institutions.
• The MOH and private institutions are responsible for 30% and 70% of the total cost of procurement respectively.
• The MOH and individual health institutions are responsible for 80% and 20% of the total cost of distribution respectively.
• EDL is mainly used for procurement in the public sector and medicine registration is a prerequisite for government purchase.
• Procurement is done through International competitive tender and National competitive tender valued at 95% and 5% of the total cost respectively.

14
4.1.6 Medicines financing • Ministry of Health’s recurrent budget during the financial year 2002/2003 was estimated at US$
194,669,215 [Government Printed Estimates 2002/2003] of which US$16,000,000 was earmarked for medicines.
• However, this allocation is hardly sufficient. Facility Improvement Funds (‘cost sharing’) revenue is used to supplement treasury allocations in medicine procurement. In some hospitals, additional funds to purchase medicines and medical supplies have been established with the help of donor agencies.
• There is no pricing policy on medicines that covers both the public and private sector. 4.1.7 Access to essential medicines • Based on a rough estimation from Level One core indicators, it is of the opinion that an estimated 30%
of the Kenyan population has access to essential medicines. This is a less figure compared to a 1988 WHO report showing 60-90 % of the population with access. (The World Drug Situation, WHO, Geneva, 1988).
• The percentage of the population within 1 hr walking distance to the public health facility, private health facility and private retail outlet is 50%, 70% and 80% respectively.
• 60% the public health facility, 30% private health facility and private pharmacy have essential medicines available.
• 60, 30 and 50% of the population can afford essential medicine at public health facility, private health facility and private pharmacy respectively.
4.1.8 Production • Pharmaceutical manufacturing companies in Kenya generally repackage drugs or produce
pharmaceutical dosage forms from imported raw materials. • The 2002 total annual sales for the 34 local pharmaceutical industries in Kenya was US$ 53,000,000. 4.1.9 Rational use • Standard treatment guidelines (STG) produced by the MOH was last reviewed in 2002. • There is no National Medicines Formulary manual. • There are no continuing education programs, medicines information centre or public education campaign
concerning rational medicines use although there is a government department with a specific mandate to promote rational use of medicines and co-ordinate medicines use policies.
• All referral hospitals and a few general hospitals have drugs and therapeutics committees. Interpretation: The results from level I indicators suggest that, although the basic structures that are considered necessary for implementing a national medicine policy exists the performance of the structures is not optimal.
Recommendations: • The KNDP needs to be revised so as to include the regulation of traditional medicines. • Improve the capacity of the Pharmacy and Poisons Board to effectively carry out its role. • There is a need to allocate more funds to the health sector especially to cater for medicines.** • There is need to develop a pricing policy on medicines. • Strategies need to be developed so as to promote rational use of medicines. • A functional National Pharmacy and Therapeutics Committee needs to be established, supported
(financially and technically) and sustained. • A functional National Medicines Management Information System/Logistics Management Information System
needs to be established, supported (financially and technically) and sustained

15
4.2 Level II core indicators Table 4.1 Summary of the national indicator values Median and average values are presented below. However as averages can be skewed by outlying values, elsewhere in the presentation of results, medians are presented and discussed. Public Sector Facilities
Median Average Availability of key medicines (%) 93.30 89.09 Expired medicines on shelves (%) 0.00 1.27 Adequate records (%) 93.30 76.21 Average stockout duration (days) 25.30 38.59 Conservation conditions, Storeroom (%) 68.75 65.92 Conservation conditions, Dispensing area (%) 75.00 67.50
Pneumonia in adults 0.80 1.06 Pneumonia in children 0.47 0.47 Malaria in adults 0.59 0.55
Equivalent no. of day’s wages needed to pay for treatment (cost of treatment divided by lowest government salary)
Malaria in children 0.25 0.28 Pneumonia in adults 1.27 1.47 Pneumonia in children 0.67 0.64 Malaria in adults 0.70 0.77
Ratio of cost of treatment (treatment cost divided by minimum daily wage)
Malaria in children 0.33 0.37 Average number of medicines per prescription 2.80 2.67 Prescribed medicines dispensed or administered (%) 80.15 73.70 Medicines adequately labelled (%) 13.45 17.03 Patients who know how to take medicines (%) 71.95 66.29 Average cost of visit (not including lab fees) (KShs) 49.70 85.55 Patients receiving antibiotics (%) 78.35 73.36 Patients receiving injections (%) 28.35 34.14 Prescribed medicines on EDL (%) 81.33 79.28 Medicines prescribed by INN (%) 48.00 48.57 STG guidelines in the facility (%) 13.0 EDL present in the facility (%) 17.0
Prescribed ORS (%) 25.00 37.81 Prescribed antibiotics (%) 50.00 44.43
Diarrhoea in children under age 5
Prescribed antidiarrhoeal and/or antispasmodic (%) 0.00 2.76
Receiving any one first line antibiotic (%) 50.00 42.07 Mild/moderate (outpatient) pneumonia in children under age 5 Receiving more than one antibiotic (%) 0.00 23.79
URTI Prescribed antibiotics (%) 100.00 72.07 Receiving SP (%) 66.70 54.96 Receiving other one antimalarial (%) 30.00 29.46 Malaria Receiving more than one antimalarial (%) 0.00 13.10
Regional Warehouses Median Average Availability of key medicines (%) 86.70 82.64 Expired medicines on shelves (%) 0.00 6.86 Adequate records (%) 93.30 86.66

16
Median Average Average stockout duration (days) 25.90 43.70 Conservation conditions, Storeroom score (%) 62.50 60.00
Private Pharmacy Outlets
Median Average Availability of key medicines (%) 93.30 91.00 Expired medicines on shelves (%) 0.00 1.19
Pneumonia in adults 1.60 1.74
Pneumonia in children 0.87 0.93 Malaria in adults 0.43 0.48
Equivalent no. of day’s wages needed to pay for treatment (cost of treatment divided by lowest government salary) Malaria in children 0.49 0.53
Pneumonia in adults 2.37 2.55
Pneumonia in children 1.25 1.36 Malaria in adults 0.64 0.70
Ratio of cost of treatment (treatment cost divided by minimum daily wage)
Malaria in children 0.70 0.80 Access and use of Medicines at Household Level
Median Average Within 5km 33 38 5-10 km 30 33 Households surveyed (%) More than 10 km 30 27
Male (%) 44 46 Female (%) 57 54 Under 5 years (%) 29 31 5–15 years (%) 15 15 16–54 years (%) 47 46 55 and older (%) 05 06
Cough/blocked or runny nose/sore throat/ear ache 38 39
Fever/headache 59 56 Diarrhoea/vomiting 13 16 Difficulty breathing 3 5 Thirst/sweating 3 6
Lethargic/cannot sleep/cannot eat 10 15
Don’t know 0 1
Symptoms (%)
Others 19 22 Did nothing 0 2 Consulted traditional healer 0 2 Consulted public health facility 45 52
Consulted private health facility 16 17 Consulted mission/NGO health facility 0 2 Consulted private pharmacist/kiosk 12 14 Sought advice from friend/family 2 4 Used medicine left from another illness 0 2 Bought medicine without consultation 10 10
Treatment sought (%)
Other 0 1

17
Median Average Traditional healer 0 3.41 Public health facility 46.33 55.26 Private health facility 12.08 35.89 Mission/NGO health facility 0.00 3.64 Private pharmacy/kiosk 84.68 120.23 Friends/family 0.00 15.02
Amount spent out-of-pocket during the illness (KShs)
Other 0.00 0.75
Proportion of household expenses spent on medicines during this illness (%) 17.41 27.71
Proportion of household expenses spent on medicines during an average week (%) 16.7 14.1
Household expenses during a week (KShs) 1137.75 1270.72
All 78 69
Some 10 16
Proportion of households taking medicines recommended (%)
None 0 1 Price was too high 0 2 Did not have enough money 6 9 Too many medicines were prescribed 0 0 Did not think all medicines were needed 0 0 Started to feel better 0 1 No time to get all the medicines 0 0 Traditional healer did not have all the medicines 0 0
Public health facility did not have all the medicines 0 5
Private health facility did not have all the medicines 0 1
Mission/NGO health facility did not have all the medicines 0 0
Private pharmacy/kiosk did not have all the medicines 0 1
Reasons for not taking medicines recommended (%)
Other 0 0 None 5 7 Primary 37 36 Secondary 39 37 Vocational 6 8 College 10 10 University 0 5 Post graduate 0 1
Household head’s level of education (%)
Other 0 1 Head of family 88 85 Source of income (%) Other 7 13

18
4.2.1 Access 4.2.1.1 Availability of key medicines in public health facilities, regional warehouses and private
pharmacies
• The median availability of the 15 key medicines in public health facilities, regional warehouses and private pharmacies was found to be 93.3%, 86.7% and 93.3 respectively.
• 97% of public health facilities were found to have greater than 75% of the key medicines available. • 100% of private pharmacies were found to have greater than 75% of the key medicines available. • 60% of the regional warehouses were found to have greater than 75% of the key medicines available.
Figure 4.1 Availability of key medicines in public health facilities (by quartiles)
Figure 4.2 Availability of key medicines in regional warehouses (by quartiles)
4.2.1.2 Stock out duration in public health facilities and regional warehouses
0% 0%3%
97%
0%
10%
20%
30%
40%
50%
60%
70%
80%
90%
100%
0-25% >25% - 50% >50% - 75% >75%
% F
acili
ties
0% 0%
40%
60%
0%
10%
20%
30%
40%
50%
60%
70%
80%
90%
100%
0-25% >25% - 50% >50% - 75% >75%
% F
acili
ties
Median value = 93%
Median value = 87%

19
The median stock-out duration of the basket of medicines in public health facilities and regional warehouses was found to be 25.3 days and 25.9 days respectively.
Only 50% of the public health facilities had a stock-out duration of less than 1 month. 13% of the public health facilities had a stock-out duration of greater than 3 months.
• 60% of regional warehouses had a stock-out duration of less than 1 month and 20% had a stock-out duration of more than 3 months.
Figure 4.3 Stock-out duration by quartiles in public health facilities and regional warehouses
Figure 4.4 Comparison of availability of key medicines and stock-out duration in public health facilities
and district warehouses
9387
25 26
Availability public healthfacilities - %
Availability districtwarehouses - %
Stock-out public healthfacilities (days)
Stock-out districtwarehouses (days
50%
37%
13%
0%
60%
20% 20%
0%0%
10%
20%
30%
40%
50%
60%
70%
80%
90%
100%
< 30 days >30-90 days >90-180 days >180 days
% F
acili
ties
% Public Health Facilities % Regional Warehouses
Median value: Public Health Facilities = 25.3 days Regional warehouses = 25.9 days

20
4.2.1.3 Adequacy* of stock records in public health facilities and regional warehouses *Adequacy of stock records was described as % key medicines with records covering at least 6 months within the previous 12 months of the study period. The median percent medicines with adequate records was 93.3% in both the public health facilities and
the regional warehouses. 4 out of 5 of regional warehouses were found to have less than a quarter of the basket of medicines with
adequate records. 73% of the public health facilities were found to have more than three-quarters of the key medicines with
adequate records.
Figure 4.5 Adequacy of stock records in public health facilities and regional warehouses
4.2.1.4 Affordability of treatment at public health facilities and private pharmacies
The median average cost per visit to a public health facility was found to be KShs. 49.70. The median equivalent number of lowest daily government’s salary (KShs. 88.00) needed for treatment
of adult pneumonia in public health facilities and private pharmacy outlets was found to be 0.8 and 1.6 respectively – the cost of treatment of adult pneumonia in private pharmacy outlets being twice that in public health facilities.
The median equivalent number of days wages needed for treatment of adult malaria in public health facilities and private pharmacy outlets was found to be 0.59 and 0.43 respectively – the cost of treatment of adult malaria in private pharmacy being slightly less than in private health facilities.
The median equivalent number of days wages needed for treatment of child pneumonia in public health facilities and private pharmacy outlets was found to be 0.47 and 0.87 respectively - the cost of treatment of child pneumonia in private pharmacy outlets being twice that in public health facilities
The median equivalent number of days wages needed for treatment of child malaria in public health facilities and private pharmacy outlets was found to be 0.25 and 0.49 respectively- the cost of treatment of child malaria in private pharmacy outlets being twice that in public health facilities
In all cases, the amount paid for treatment was less than 1 day’s wage except for treatment of adult pneumonia where an equivalent of 1.6 day’s wage was paid at private pharmacy.
80%
20%
0% 0%
17%
0%
10%
73%
0%
10%
20%
30%
40%
50%
60%
70%
80%
90%
100%
0-25% >25% - 50% >50% - 75% >75%
% a
dequ
ate
reco
rds
Regional Warehouses Public Health Facilities
Median value Regional warehouses = 93% Public health facilities = 93%

21
Figure 4.6 Affordability of treatment at public health facilities and private health pharmacies by lowest daily government salary
1.60
0.87
0.43 0.49
0.80
0.470.59
0.25
0.00
0.20
0.40
0.60
0.80
1.00
1.20
1.40
1.60
1.80
Pneumonia treatmentfor adults
Pneumonia treatmentchildren
Malaria treatment foradults
Malaria treatment forchildren
Equiv
alent
No. o
f day
s' sa
lary
Private PharmacyPublic health facilities
4.2.1.5 Percentage of prescribed medicines actually dispensed or administered to patients in
Public health facilities The median percentage of medicines actually dispensed or administered in public health facilities was
found to be 80%.
87% facilities dispensed more than half of the prescribed medicines.
30% facilities were found to be dispensing more than 90% of the medicines prescribed with only 13% facilities dispensing less than half of the medicines prescribed.
Figure 4.7 Percent medicines dispensed (by quartiles) in health facilities
10%
3%
27%30% 30%
0%
5%
10%
15%
20%
25%
30%
35%
40%
45%
50%
<25% >25% - 50% >50% - 75% >75% - 90% >90%
% F
acili
ties
Median value = 80%

22
4.2.1.6 Access to medicines by households The median total amount spent on medicines by the households during an illness was found to be KShs.
253.00. The median amount spent on medicines per week was found to be KShs. 169.85. The proportion of household expenses spent on medicines during the illness of previous two weeks of
study is 17.4% while the proportion spent on medicines in an average week is 16.7%. The proportion of households seeking consultation from public health facilities was found to be 45%.
The proportions of households seeking consultation from private health facilities, private pharmacies and advice from friends were found to be 16%, 12% and 2% respectively (Figure 4.8). However, 10% of households use medications without consultation.
The median sum of amount spent on medicines from private pharmacies/kiosks was found to be KShs 84.68 whereas in the public health facilities and private health facilities the sum amount spent was KShs 46.33 and KShs 12.08 respectively. Medicines from traditional healers and mission/NGO health facilities were found to cost less than KShs 1.00.
The primary reason for not obtaining all prescribed medicines was lack of money. (See fig. 4.9). 6% of all households surveyed did not have enough money to buy all the medicines prescribed
The highest amount spent on medicines was from private pharmacy through consultation, (KShs. 84.68) followed by public health facilities (KShs. 46.33) and then private health clinics (12.08). (See figure 4.10)
Figure 4.8 Sources of consultation
45%
16%
12%
2%
10%
0%
10%
20%
30%
40%
50%
60%
Consulted publichealth facility
Consulted privatehealth facility
Consulted privatepharmacist/kiosk
Sought advicefrom friend/family
Bought medicinewithout
consultation
% h
ouse
hold
s

23
Figure 4.9 Primary reason for not obtaining all prescribed medicines
Figure 4.10 Average amount spent on medicines from each source of consultation
2%
9%
1%
5%
1%1%
0%
10%
Price was toohigh
Did not haveenough money
Started to feelbetter
Public healthfacility did nothave all themedicines
Private healthfacility did nothave all themedicines
Privatepharmacy/kioskdid not have allthe medicines
% h
ouse
hold
s
46.33
12.08
84.68
0.00
10.00
20.00
30.00
40.00
50.00
60.00
70.00
80.00
90.00
Public health facility Private health facility Private pharmacy/kiosk
Cost
(Ksh
s)

24
4.2.2 Quality and safety 4.2.2.1 Presence of expired medicines in public health facility pharmacies, regional warehouses and
Private pharmacy outlets The median percentage expired medicines was found to be 0 in all the public health facilities, regional
warehouses and private pharmacy outlets. However, 13.3% of public health facilities and 6.7% of private retail outlets were found to have one or
more expired medicines on their shelves. 4.2.2.2 Adequacy* of Conservation conditions and handling of medicines in public health facility and
regional warehouses *A checklist of minimum criteria for adequate conservation conditions and handling of medicines are given in Survey form 4 (Appendix 4). The values are percentages of the minimum criteria met. The median percent adequacy of conservation conditions in public health facilities was found to be 69%
in the storeroom and 75% in the dispensing area.
In the regional warehouses, the adequacy of conservation conditions was found to be 63%.
80%, 73% and 60% of the regional warehouses, public health facility dispensing areas and public health facility storeroom respectively were found to have adequacy of conservation conditions above 50%.
• 30% of the public health facility storerooms, 27% of the public health facility dispensing area and 20% regional warehouses were found to have less than 50% adequate conservation conditions respectively.
Recommendations: • Develop and implement interventions to increase the availability of medicines in health
facilities. • Investigate and develop interventions to reduce the long stock-out duration in public health
facilities and regional warehouses. • Investigate and develop strategies for improving the quality of stock records in both the public
health facilities and regional warehouses. • Investigate and develop interventions to ensure that all the prescribed medicines are dispensed
to patients in public health facilities. • Design, establish and maintain a system for the monitoring and dissemination of the cost of
essential drugs to both suppliers and consumers so as to ensure the availability of essential drugs to the consumers at the minimum possible prices.

25
Figure 4.11 Adequacy of conservation conditions in public health facilities and regional warehouses
4.2.3 Rational use 4.2.3.1 Adequacy* of labelling of medicines dispensed by public health facility pharmacies *An adequate label includes at least the patient’s name, name and strength of the medicine and written instructions on how to take it. • The median percent medicines adequately labelled was found to be 13.45% - less than 2 in 10 labels
were found to be adequate. 7 out of 10 public health facilities were found to have less than quarter of the medicines dispensed
adequately labelled.
Only 6% public health facilities had more than half of the medicines dispensed with adequate labels.
3%
27%
43%
27%
0%
27%
50%
23%
0%
20%
60%
20%
0%
10%
20%
30%
40%
50%
60%
70%
80%
90%
100%
<25% >25% - 50% >50% - 75% >75%
% F
acili
ties
Public health facility StoreroomPublic health facility - Dispensing areaPublic warehouses
Median value PHF Storeroom = 69% PHF Dispensing area = 75%Public warehouses = 63%

26
Figure 4.12 Adequacy of labelling in public health facilities
4.2.3.2 Percentage of patients at public health facilities who know how to take medicines
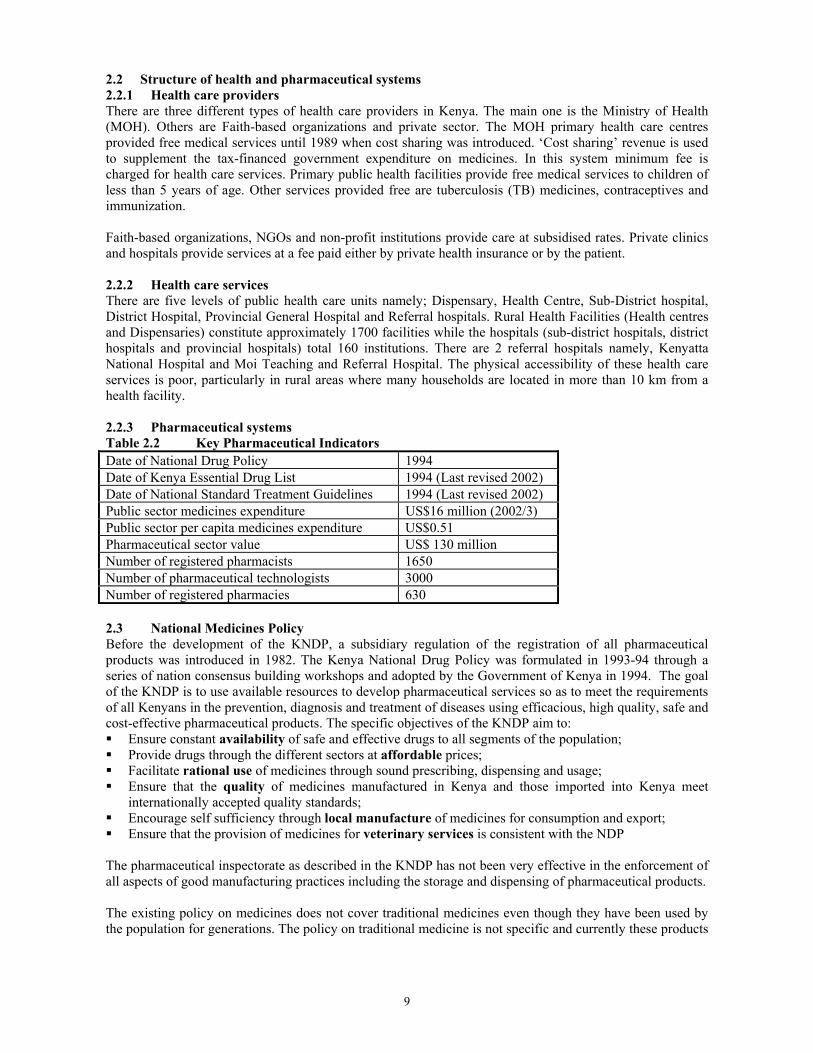
Adequate knowledge is when a patient can report the dosage schedule of all the medicines they receive. Patients are thus evaluated on their knowledge of when and in what quantity each medicine should be taken. Failure to know either of these two points about the medicines should result in patient knowledge being scored as inadequate. The median % of patients who know how to take medicines was found to be 71.95%. This means
that almost 3 out of 4 patients understood correctly how to take their medicines. In 47% health facilities, more than 75% of the patients knew how to take their medicines. In 27% of health facilities less than half of the patients knew how to take their medication.
70%
23%
3% 3%
0%
10%
20%
30%
40%
50%
60%
70%
80%
90%
100%
<25% >25% - 50% >50% - 75% >75%
% F
acili
ties Median value = 13%
27
Figure 4.13 Percentage of patients at public health facilities who know how to take medicines
4.2.3.3 Average number of medicines prescribed in public health facilities
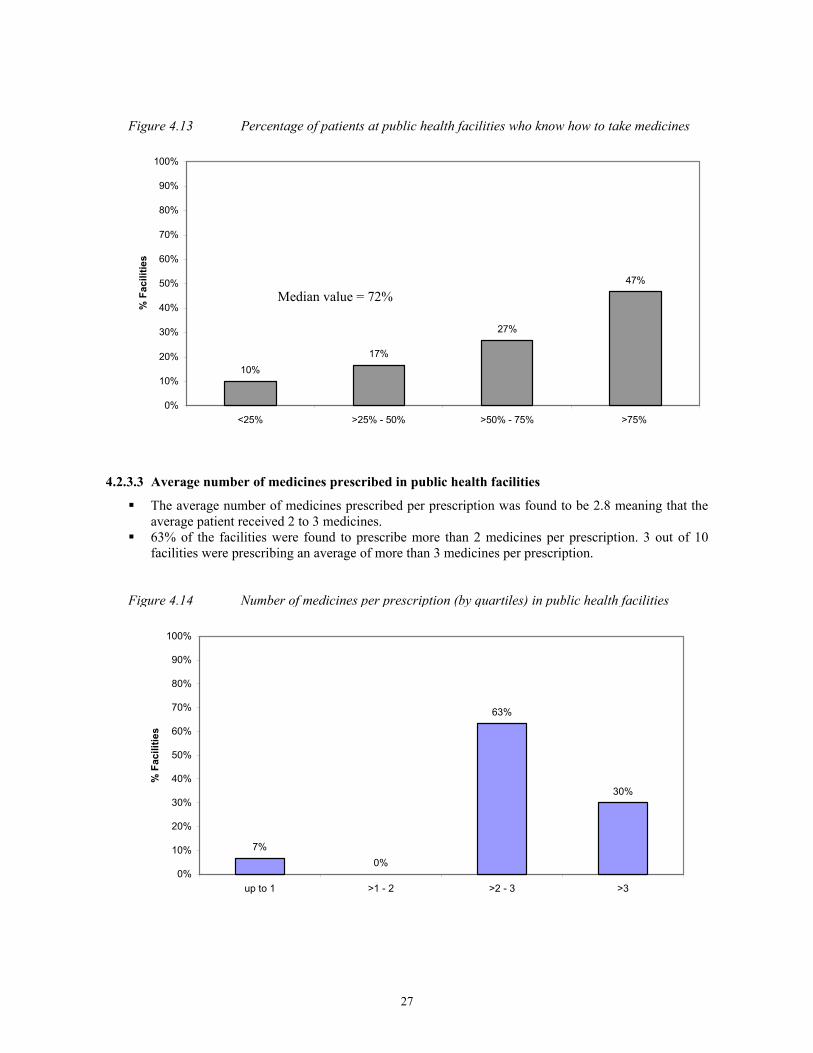
The average number of medicines prescribed per prescription was found to be 2.8 meaning that the average patient received 2 to 3 medicines.
63% of the facilities were found to prescribe more than 2 medicines per prescription. 3 out of 10 facilities were prescribing an average of more than 3 medicines per prescription.
Figure 4.14 Number of medicines per prescription (by quartiles) in public health facilities
7%0%
63%
30%
0%
10%
20%
30%
40%
50%
60%
70%
80%
90%
100%
up to 1 >1 - 2 >2 - 3 >3
% F
acili
ties
10%17%
27%
47%
0%
10%
20%
30%
40%
50%
60%
70%
80%
90%
100%
<25% >25% - 50% >50% - 75% >75%
% F
acili
ties
Median value = 72%

28
4.2.3.4 Percentage of patients at public health facilities receiving antibiotics The median percent of patients prescribed one or more antibiotics in public health facilities was found to
be 78%. In 93% of facilities, more than half of the patients were prescribed one or more antibiotics. In 53% of public health facilities, more than 75% patients were prescribed one or more antibiotics;
however in 7% of facilities less than 50% patients were prescribed one or more antibiotics.
Figure 4.15 Percentage of patients prescribed an antibiotic in public health facilities
4.2.3.5 Percentage of patients prescribed an injection in public health facilities The median percent of patients prescribed one or more injections in public health facilities was found to
be 28%. In only 3% of facilities, more than 75% patients were prescribed one or more injections. • In 23% of the facilities more than half of the patients were receiving one or more injections.
0%7%
40%
53%
0%
10%
20%
30%
40%
50%
60%
70%
80%
90%
100%
<25% >25% - 50% >50% - 75% >75%
% F
acili
ties Median value = 78%

29
Figure 4.16 Percentage of patients receiving one or more injections by quartiles in public health facilities
4.2.3.6 Percentage of medicines prescribed at public health facilities on EDL The median percentage medicines prescribed that were on the Essential Drugs List was found to be
81.3%. • 4 out of 10 public health facilities were found to have more than 90% prescribing according to the
KEDL.
Figure 4.17 Percentage of prescribed medicines on the KEDL
40%33%
23%
3%
0%
10%
20%
30%
40%
50%
60%
70%
80%
90%
100%
<25% >25% - 50% >50% - 75% >75%
% F
acili
ties
3% 0%
23%
33%40%
0%
10%
20%
30%
40%
50%
60%
70%
80%
90%
100%
<25% >25% - 50% >50% - 75% >75% - 90% >90%
% F
acili
ties
Median value = 28%
Median value = 81%

30
4.2.3.7 Percentage availability of STG and EDL at public health facilities
Standard treatment guidelines were found in 13% of public health facilities and the essential drugs list in 17% of the facilities.
• However the median percentage of medicines prescribed that were on the EDL was found to be 81%. The high adherence to prescribing according to EDL compared to the low availability of EDL in public health facilities is probably because the range of medicines procured and supplied to these facilities is within the EDL and generally only those medicines are available.
Figure 4.18 Percent availability of STGs and EDL in public health facilities.
4.2.3.8 Medicine prescribing by INN/generic name The median % medicines prescribed by INN were found to be 48%. 53% of the facilities were found to prescribe less than half of the medicines by INN. Only 3% of facilities were found to prescribe more than three quarters of medicines by INN.
13%17%
0%
20%
40%
60%
80%
100%
STGs EDLs
% F
acili
ties

31
Figure 4.19 Medicine prescribing by INN in public health facilities
.
4.2.3.9 Percentage of tracer cases at public health facilities treated with medicines recommended or discouraged in STGs. Recommended Standard Treatment Guidelines [GOK, MOH. Clinical guidelines, Nairobi, 2002] • Children under age 5 years presenting with diarrhoea are normally prescribed ORS as a policy adopted
by the Ministry of Health. The use of antibiotics and/or antiprotozoals should be for dysentery, suspected cholera or for suspected amoebiasis.
• In the treatment of mild/moderate pneumonia in children under 5 years, the first line antibiotic recommended is Amoxycillin or Co-trimoxazole. The use of more than one antibiotic is recommended in cases of severe pneumonia where two injectable antibiotics may be given.
• URTI is treated by using a first line antibiotic (Amoxycillin) and/or analgesic. • In malaria management, SP drugs are the recommended regimen. However other medicines may be
given but only in cases of SP being contraindicated, in cases of resistance or disease progression. Treatment of diarrhoea in children under the age 5: The median percent use of ORS was found to be 25%. The median percent use of one or more antibiotics was found to be 50%. The median percent use of an antidiarrhoeal and/or antispasmodic was found to be 0%. In 29% of the public health facilities more than 90% of diarrhoea cases were treated using ORS, that is,
less than 3 out of 10 public health facilities use ORS for the management of more than 90% of diarrhoea cases in children.
1 in 4 public health facilities use antibiotics for more than 90% diarrhoea cases in children.
13%
40%43%
3%
0%
10%
20%
30%
40%
50%
60%
70%
80%
90%
100%
<25% >25% - 50% >50% - 75% >75%
% F
acili
ties

32
Figure 4.20 Treatment of diarrhoea in children under age 5
Treatment of mild/moderate pneumonia (outpatient) in children under age 5: The median percent patients receiving any one first line antibiotic were found to be 50% while the
median percent receiving more than one antibiotic was found to be 0%. 29% of the facilities were found to use a first line antibiotic in less than 25% of their patients while 58%
of the facilities were found to use more than one antibiotic in less than 25% of their patients.
Figure 4.21 Treatment of mild/moderate pneumonia in children under age 5
Treatment of URTI: The median percent use of antibiotics was found to be 100%. 67% of facilities were found to prescribe antibiotics for more than 90% of their patients whereas 8% of
the facilities prescribed antibiotics for less than 25% of their patients.
38%33%
0%
29%33%
29%
13%
25%
96%
4%0% 0%
0%
10%
20%
30%
40%
50%
60%
70%
80%
90%
100%
<25% >25% - 75% >75% - 90% >90%
% F
acili
ties
ORS Antibiotics Anti diarrhoea
29% 33%25%
13%
58%
29%
8%4%
0%10%20%30%40%50%60%70%80%90%
100%
<25% >25% - 75% >75% - 90% >90%
% F
acili
ties
First line Antibiotics
More than 1 antibiotics

33
Figure 4.22 Treatment of URTI using antibiotics
Treatment of malaria: The median percent patients receiving SP was found to be 67%. The median percent receiving any other one antimalarial and that receiving more than one antimalarial
was found to be 30% and 0% respectively. In 3 out of every 4 facilities, less than 25% of the patients were prescribed more than one antimalarial. 4% of the facilities had less than one quarter of their patients using SP. 33% of the facilities had less than one quarter of their patients using any other one antimalarial (other
than SP). More than half (58%) of the public health facilities prescribed SP to more than 25% of their patients. Similarly, more than half (58%) of the public health facilities prescribed any other one antimalarial to
more than 25% of their patients. Only 25% of the health facilities had more than one quarter of their patients using more than one
antimalarial.
Figure 4.23 Trends in malaria treatment in public health facilities.
4%
58%
25%
13%
33%
58%
4% 4%
75%
25%
0% 0%0%
10%
20%
30%
40%
50%
60%
70%
80%
90%
100%
<25% >25% - 75% >75% - 90% >90%
% F
acili
ties
% patients prescribed SP % patients prescribed other anti-malarial % patients prescribed more than 1 anti malarial
8% 8%17%
67%
0%
10%
20%
30%
40%
50%
60%
70%
80%
90%
100%
<25% >25% - 75% >75% - 90% >90%
% F
acili
ties

34
4.2.3.10 Use of medicines by households Patient Compliance In 78% of the households, it was found that all prescribed medicines were used. All households interviewed used either some or all of the medicines prescribed.
Figure 4.24 Patient compliance in taking prescribed medicines in households
78%
10%
0%0%
10%
20%
30%
40%
50%
60%
70%
80%
90%
100%
All Some None
% H
ouse
hold
s
Recommendation • Investigate the reasons and propose interventions to improve on the poor or inadequate storage
conditions in the public health facilities and regional warehouses. • Develop and implement mechanisms to ensure there are no medicines that expire in all the public
health facilities and regional warehouses. • Develop guidelines and intervention measures to improve on the labelling of medicines. These should be
supported by extensive campaigns on the community based information, education and communication. • There needs to be developed a mechanism of educating patients so that they know how to take their medicines
correctly. Thus comprehensive community based information, education and communication campaigns need to be organised.
• Investigate and develop interventions to reduce antibiotic use. Intensive prescriber and consumer education initiatives should also be undertaken to lower the demand for antibiotics.
• Investigate and develop interventions aimed at reducing the number of patients receiving injections. • Investigate and develop mechanisms to improve the distribution of STGs and EDL to all health
facilities. • There is need to develop and implement mechanisms of ensuring that prescribing by generic names is
accomplished. • Investigate reasons for current clinical management of the tracer conditions (e.g establish
causes/reasons contributing to irrational medicine use overall). • There is need to develop and implement information, education and communication campaigns to
improve the rational use of medicines in communities. • A functional Medicines Information Centre needs to be established with modern technology,
supported (financially and technically) and sustained.

35
5. CONCLUSION Kenya has the basic structures that are considered necessary for implementing a national medicine policy. However there is no strict framework that ensures adherence to the requirements. Because of the characteristics of medicines which make them different from other goods, technical and material support from the government is required in order to develop strategies and priorities required to keep pace with development in medicine administration and management. Improved performance in legislation and regulation is necessary in order to achieve the objectives of the NDP of providing all Kenyans with safe, effective and affordable pharmaceuticals that are of good quality. The pharmaceutical sector baseline survey gave a good indication of availability of essential medicines in health facilities in Kenya: more than 9 in every 10 public health facilities had more than three quarters of the essential medicines needed to treat common illnesses. However, essential medicines must not only be available but also affordable in order to improve access to all Kenyans. And although various level II core indicators illustrate that medicines represent a significant expenditure for households, there is a crucial need for comprehensive and reliable medicine pricing data to better define the affordability of medicines for Kenyans. Only 1 out of every 10 public health facilities had a stock-out duration of more than three months. This gives some indication about the reliability of medicine supply as well as level of efficiency in management of medicine stocks. However, there is still need to develop ways of improvement so that medicines are in stock 100% of the time. More than 1 out of every 10 public health facilities had one or more expired medicines on their shelves and 6 out of 10 public health facility medicine store rooms met more than half the minimum criteria for adequate conservation conditions. Strategies to improve medicine storage conditions and the quality assurance system should be developed to ensure more than 90% availability of quality medicines everywhere in the country. In Kenya, there is a general tendency to over-prescribe medicines, especially antibiotics. 78% of patients received one or more antibiotics while all the cases of URTI were prescribed antibiotics. Antibiotics and injections are two important but commonly overused and costly forms of medicine therapy. More than 1 in 5 public health facilities prescribed one or more injections to more than half of the patients, though, injection is a type of medicine therapy, which should be used only when oral therapy is not available. Irrational dispensing is also prevalent in public health facilities with only about 10 % of prescribed medicines being labelled appropriately. Prescribers tend to use brand names when prescribing. Essential medicines are widely used in public health facilities (81 % of prescribed medicines are on the KEDL) probably because government procurement is limited to medicines on the essential medicine list. STGs were found in only 13% of public health facilities indicating that prescribers lack the key source of therapeutic information they need in daily practice. There is need for an official continuing education system on rational use of medicines for prescribers and dispensers as this is one of the most cost-effective ways to improve medicine use and thus improve health and reduce costs. Finally, although the baseline survey reveals numerous positive and encouraging characteristics of Kenya’s pharmaceutical sector, there are also significant weaknesses, which need urgent attention in order to improve the sector and make medicines more accessible. The study makes an extensive list of priority recommendations, which should be considered as a comprehensive base on which to build work plans, budgets, timelines, and monitoring and evaluation plans. Given dedicated budgets and broad stakeholder involvement, the pharmaceutical sector can be successfully strengthened to reach the ultimate goal: universal access to good quality and affordable essential medicines for Kenyans, including the poorest and most vulnerable.


37
6. Positive aspects and areas for improvement identified
Positive Aspects Emanating From The Survey Areas For Improvement Apparent From The Survey Accessibility to Medicines Availability of key medicines • 97% of the public health facilities had greater than 75%
availability • 3% of the public health facilities had less than 75% availability • 40% of the regional warehouses had less than 75% availability
Stock-out duration
• 50% of the public health facilities had a stock-out duration of less than 1 month.
• 60% of the regional warehouses had a stock-out duration of less than 1 month.
• 13% of the public health facilities had a stock-out duration of more than 3 months.
• 20% of the regional warehouses had a stock-out duration of more than 3 months.
Adequacy of stock records
• 73% of the public facilities had more than 75% of the medicines with adequate records
• 80% of the regional warehouses had less than 25% of medicines with adequate records
% prescribed medicines actually dispensed
• 30% of the public facilities were found to be dispensing more than 90% of the prescribed medicines.
• 13% of the public facilities were dispensing less than half of the prescribed medicines
Quality of medicines Presence of expired medicines • Extremely low incidence of expired medicines on shelves
(median 0%) • 13.3% of the public health facilities and 6.7% of the regional
warehouses had one or more expired medicines on the shelves Adequacy of storage in public health facilities and regional warehouses
• 80% of the regional warehouses, 73% of the public facility dispensing area and 60% of the public facility storerooms met more than 50% of the minimum criteria for adequate conservation conditions.
• 30% of the public health facility storerooms, 27% of the public health facility dispensing areas and 20% of the regional warehouses met less than half the minimum criteria for adequate conservation conditions
Rational medicine use Adequacy of labelling • 6% of the public facilities had more than 50% of their
medicines with adequate labels • 70% of the public facilities had less than 25% medicines with
adequate labels Adequacy of patient knowledge • 47% of the public facilities had more than 75% of the
patients with adequate knowledge on how to take their medicines
• 27% facilities had less than half of their patients with adequate knowledge on how to take their medicines
Number of medicines prescribed per patient
• 63% of the public facilities had between 2 and 3 medicines prescribed per patient
• 30% of the public facilities had more than 3 medicines prescribed per patient
% patients receiving an antibiotic • 7% of public health facilities prescribed one or more antibiotics to less than half of their patients.
• 93% of public facilities had more than half of their patients prescribed one or more antibiotics.
% patients receiving an injection • 73% of the public facilities had less than 50% of patients prescribed one or more injections
• 26% of the facilities had more than half of the patients prescribed one or more injections
Prescribing according to the Kenya • 81.3% of the medicines prescribed in the public health • 3% of public facilities had up to 25% of prescribed medicines not

38
Essential Drug List (KEDL) facilities were on the KEDL on the KEDL Availability of STGs and KEDL
• Updated STGs and KEDL exist • STGs were found in 13% of the public health facilities whereas the KEDL was found in 17% of the facilities.
Prescribing by INN/Generic name • 48% of medicines in public health facilities were prescribed by INN/generic name
• 53% of public health facilities prescribed less than 50% of the medicines by INN/generic name
Prescribing according to STG • 25% of the children under 5 years with diarrhoea were prescribed ORS
• 50% of the children under 5 years presenting with mild/moderate pneumonia were prescribed any one first line antibiotic
• 67% of the patients with malaria were prescribed SP
• 50% of children under 5 years with diarrhoea were prescribed one or more antibiotics
• 87% of the facilities had at least half of the children with mild/moderate pneumonia prescribed one or more antibiotics
• 75% of the facilities had up to 25% of the patients with malaria prescribed more than one antimalarials

39
7. SUMMARY OF RECOMMENDATIONS Structures and processes
• The KNDP needs to be revised so as to include the regulation of traditional medicines. • Improve the capacity of the Pharmacy and Poisons Board to effectively carry out its role. • There is a need to allocate more funds to the health sector especially to cater for medicines.** • There is need to develop a pricing policy on medicines. • Strategies need to be developed so as to promote rational use of medicines. • A functional National Pharmacy and Therapeutics Committee needs to be established, supported (financially and technically) and sustained. • A functional National Medicines Management Information System/Logistics Management Information System needs to be established, supported (financially and
technically) and sustained ** It is necessary to acknowledge the July 2004 launch of the National Social Health Insurance Fund whose monies could be used to improve access provided sustainability, staffing, training and capacity are adequately addressed within the Fund’s policy.
Accessibility to medicines
• Develop and implement interventions so as to increase the availability of medicines in health facilities. • Investigate and develop interventions to reduce the long stock-out duration in public health facilities and regional warehouses. • Investigate and develop strategies for improving the quality of stock records in both the public health facilities and regional warehouses. • Investigate and develop interventions to ensure that all the prescribed medicines are dispensed to patients in public health facilities. • Design, establish and maintain a system for the monitoring and dissemination of the cost of essential medicines to both suppliers and consumers so as to ensure the availability of essential medicines to the consumers at the minimum possible prices. • Computerization to improve accessibility of drug information.
Quality of medicines
• Investigate the reasons and propose interventions to improve on the poor or inadequate storage conditions in the public health facilities and regional warehouses. • Develop and implement mechanisms to ensure there are no medicines that expire in all the public health facilities and regional warehouses. • Include indicators for assessing personnel qualification in the work place as this may influence quality.
Rational medicine use
• Develop guidelines and intervention measures to improve the labelling of medicines. These should be supported by extensive campaigns on the community based information, education and communication.
• There needs to be developed a mechanism of educating patients so that they know how to take their medicines correctly. Thus comprehensive community based information, education and communication campaigns need to be organised.
• Investigate and develop mechanisms to reduce the antibiotic use. Intensive prescriber and consumer education initiatives should also be undertaken to lower the demand for antibiotics.
• Investigate and develop interventions aimed at reducing the number of patients receiving injections. • Investigate and develop mechanisms to improve the distribution of STGs and KEDL to all health facilities. • There is need to develop and implement mechanisms of ensuring that prescribing by generic names is accomplished. • Investigate reasons for current clinical management of the tracer conditions (e.g establish causes/reasons contributing to irrational medicine use overall). • A functional Medicines Information Centre needs to be established with modern technology, supported (financially and technically) and sustained.
Households • There is need to develop and implement information, education and communication campaigns to improve the rational use of medicines in communities.

40
APPENDIX 1 - PROPOSAL
PROPOSAL FOR MONITORING AND ASSESSING THE PHARMACEUTICAL SECTOR IN KENYA – MOH / WHO USING THE OPERATIONAL PACKAGE FOR MONITORING AND
ASSESSING THE PHARMACEUTICAL SITUATION IN COUNTRIES, WHO/EDM
1. INTRODUCTION Kenya lies on the eastern coast of Africa along the equator with a land area of 582,644 square kilometres inclusive of inland water. The climate and topography are characterised by wide diversions ranging from glaciated mountain peaks (notably Mount Kenya) to cool plateaus, the humid coastal plain, and the vast and hot expanse of arid and semi-arid land which covers the northern half and southern-eastern parts of the country. Administratively, it is divided into 8 main provinces namely; Central, Coastal, Nyanza, Western, Eastern, Nairobi, Rift Valley and North Eastern. It has a population of approximately 30 million people. The country’s economic growth has been on the decline since 1992 when Kenya embraced the Structural Adjustment Programme recommended by the World Bank and International Monetary Fund. The economy is at its lowest currently with GDP of less than 1.4 percent. The gradual economic decline has had a proportionate decrease on the Health indicators The HIV/AIDS scourge has taken toll on the Kenyan population and an estimated 2.2 million people are infected with HIV/AIDS. An estimate of 10% of the infected people, 200,000 of them require treatment. In 1994, the Government of Kenya adopted the Kenya Drug Policy whose goal was “to ensure constant availability of safe cost effective pharmaceuticals for the purposes of prevention diagnosis and treatment of diseases in the Kenyan population. Public sector medicine supply system has been reformed through the establishment of Kenya Medical Supplies Agency as a body corporate with the mandate of developing and operating a viable commercial service for the procurement and sale of medicines and medical supplies to the public health institutions in February 2000. Against the above background, there is need for the Ministry of Health to assess the pharmaceutical situation in the country to evaluate the impact of the reforms undertaken towards improving the quality of pharmaceutical care delivery. The proposed assessment of the pharmaceutical situation in Kenya will indeed help the ministry of Health identify and define the necessary changes and priority areas that require support. The survey will also help define the relevant strategies and collaboration for the forthcoming WHO technical collaboration with the Ministry of Health in the field of essential medicines as well as measure the impact of WHO input to the implementation of the National Drug Policy.
2. OBJECTIVE • To collect baseline information on the pharmaceutical sector from available facility data sets, which
will provide a clear picture of national and institutional problems so as to assess strategies and priorities required.
3. METHODOLOGY
The evaluation and assessment of the pharmaceutical situation will be based on level I and II indicators as described in the ‘operational package for monitoring and assessing the pharmaceutical situation in countries’ as follows;
i) Level I Indicators The level I core indicators will be used to assess existing structures and processes in the Kenya Pharmaceutical system. One senior pharmacist from the Ministry of Health headquarters will gather the information through the office of the Chief Pharmacist.
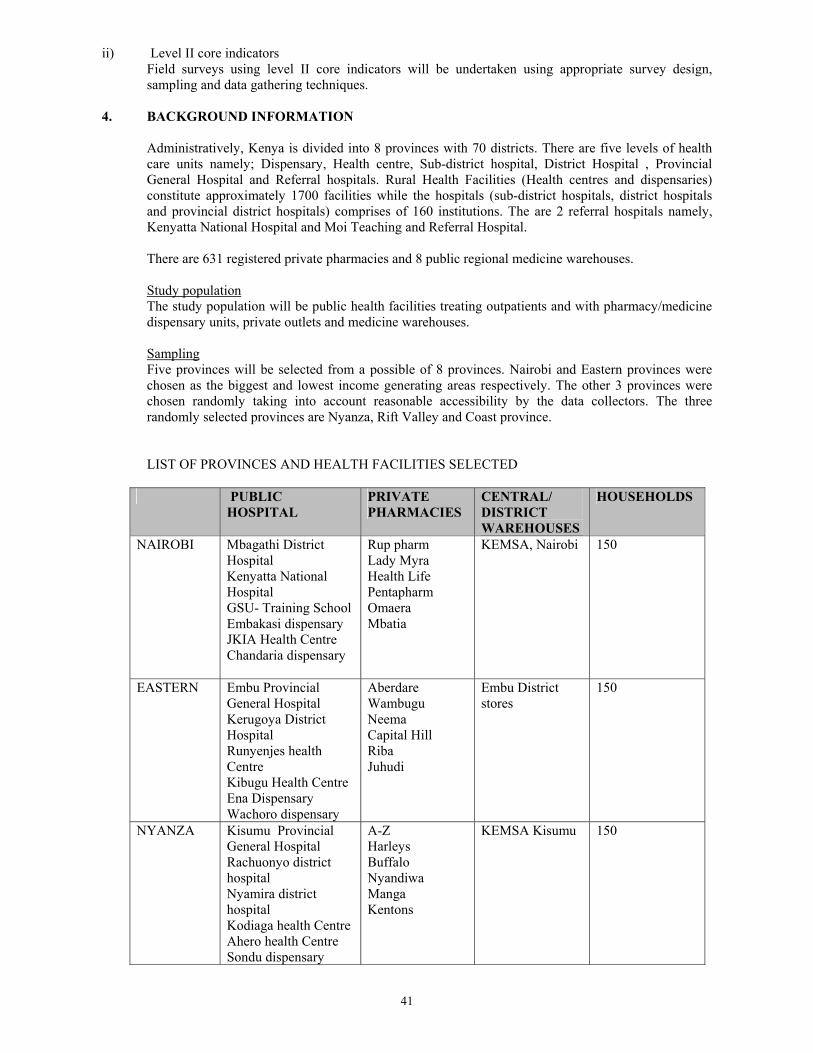
41
ii) Level II core indicators Field surveys using level II core indicators will be undertaken using appropriate survey design, sampling and data gathering techniques.
4. BACKGROUND INFORMATION
Administratively, Kenya is divided into 8 provinces with 70 districts. There are five levels of health care units namely; Dispensary, Health centre, Sub-district hospital, District Hospital , Provincial General Hospital and Referral hospitals. Rural Health Facilities (Health centres and dispensaries) constitute approximately 1700 facilities while the hospitals (sub-district hospitals, district hospitals and provincial district hospitals) comprises of 160 institutions. The are 2 referral hospitals namely, Kenyatta National Hospital and Moi Teaching and Referral Hospital. There are 631 registered private pharmacies and 8 public regional medicine warehouses. Study population The study population will be public health facilities treating outpatients and with pharmacy/medicine dispensary units, private outlets and medicine warehouses. Sampling Five provinces will be selected from a possible of 8 provinces. Nairobi and Eastern provinces were chosen as the biggest and lowest income generating areas respectively. The other 3 provinces were chosen randomly taking into account reasonable accessibility by the data collectors. The three randomly selected provinces are Nyanza, Rift Valley and Coast province. LIST OF PROVINCES AND HEALTH FACILITIES SELECTED
PUBLIC HOSPITAL
PRIVATE PHARMACIES
CENTRAL/ DISTRICT WAREHOUSES
HOUSEHOLDS
NAIROBI Mbagathi District Hospital Kenyatta National Hospital GSU- Training School Embakasi dispensary JKIA Health Centre Chandaria dispensary
Rup pharm Lady Myra Health Life Pentapharm Omaera Mbatia
KEMSA, Nairobi 150
EASTERN Embu Provincial General Hospital Kerugoya District Hospital Runyenjes health Centre Kibugu Health Centre Ena Dispensary Wachoro dispensary
Aberdare Wambugu Neema Capital Hill Riba Juhudi
Embu District stores
150
NYANZA Kisumu Provincial General Hospital Rachuonyo district hospital Nyamira district hospital Kodiaga health Centre Ahero health Centre Sondu dispensary
A-Z Harleys Buffalo Nyandiwa Manga Kentons
KEMSA Kisumu 150

42
PUBLIC HOSPITAL
PRIVATE PHARMACIES
CENTRAL/ DISTRICT WAREHOUSES
HOUSEHOLDS
RIFT VALLEY
Nakuru Provincial General Hospital Bahati Health Centre Njoro Health Centre Kapkuress dispensary Mangu Dispensary Lengenet Dispensary
Oak Mid-Rift Nakuchem Benchchem Maili Kumi Lanet Hill
KEMSA , Nakuru 150
COAST Coast general hospital Likoni health centre Railways health centre Diani Health Centre Shimo la Tewa health centre Mtwapa dispensary
C- Mehta Diani Kisauni Makadara Medichem Faiz pharmacy
KEMSA, Mombasa
150
KEY: KEMSA : Kenya Medical Supplies Agency

43
APPENDIX 2 – TRAINING TIMETABLE
PROGRAMME W.H.O. MISSION FOR ASSESSMENT AND PREPARARTION OF BASELINE SURVEY OF THE PHARMACEUTICAL SECTOR IN KENYA
31 March – 4 April 2003 Date/Time Activities Responsible Sunday 30 March 2003
Meeting of facilitators (WHO/MOH/HAI) Charles/Beryl/Diane/ Martin
Monday 31 March 2003 9h00 – 12h00
Meeting of Facilitators with Counterparts at MOH/WHO offices MoH: Dr Koskey; Dr Bibiana Njue WHO: WR: Dr. Peter Eriki; AO: Mrs. Aster Gashaw- Beza
All Facilitators
12h00 – 14h00 Lunch Break 14h00 – 14h30 Welcome Remarks
Self Introduction Presentation of Program
MOH/Diane/Martin/Beryl All Charles
14h30 – 15h00 Objectives M&E Limitations and sample size
Beryl/Martin
15h00 – 15h45 Selection of key medicines and conditions Martin/Charles 15h45 – 16h00 Coffee Break All 16h00 – 16h45 Geographical Sampling Charles 16h45 –17h00 Process of Data Collection Diane Tuesday 1 April 2003 08h30 – 10h00
Data Collection Forms
Diane/Martin
10h00 – 10h30 Coffee Break All 10h30 – 12h00 Data Collection Forms Diane/Martin 12h00 – 13h00 Data Collection Form 16 Diane 13h00 – 14h00 Lunch Break All 14h00 – 15h00 Summary Forms Martin/Diane 15h00 – 16h00 Discussions 16h00 – 16h15 Coffee Break Martin 16h15 – 17h00 Define Groups & Distribute Forms
Agree on Survey Program Co-ordinator Charles/MOH/Diane/Martin/ Beryl
Wednesday 2 April 2003 9h00- 17h00
Field Test Survey Instrument
All
Thursday 3 April 2003 09h00 – 10h30
Completion of Summary Forms
In Groups
10h30 – 11h00 Coffee Break 11h00 – 13h00 Plenary: Group Presentations/Discussions Co-ordinator 13h00 – 14h00 Lunch Break All 14h00 – 15h30 Presentations of Survey Program/ Discussions Charles/Coordinator 15h30 – 16h30 General Discussions Diane Friday 4 April 2003 09h00 – 12h00
Summary of workshop proceedings and General Discussions
Martin/Beryl
12h00-13h00 Lunch All 13h00-14h00 Debriefing WR & MOH
MoH: Dr Koskey; Dr Bibiana Njue WHO: AO: Mrs. Aster Gashaw- Beza (for WR)
WHO/Diane/Martin/Beryl
HAI Beryl Leach WHO/EDM Diane Whitney, DAP Martin Auton, Consultant/DAP
Charles Kandie, NPO Kenya
44
APPENDIX 3 –ALLOCATION OF HEALTH FACILITIES TO DATA COLLECTORS PROVINCE FACILITIES DATA COLLECTORS
1 COAST • Coast General Hospital • Port Reitz District Hospital • Shimo la Tewa Health Centre • Likoni Health Centre • Diani Health Centre • Mtwapa Dispensary
Dr. J. S. Mukoko Dr. N. Mucheru Dr. J. Ombogo
2 NAIROBI • Kenyatta National Hospital • Mbagathi District Hosp. • GSU (Training) Health Centre • Chandaria Health Centre • Embakasi Health Centre • Langata Women’s Prison Health C.
Dr. Atieno Ojoo Dr. S.M. Kimatu Dr. P. Wanjala
3 EASTERN • Embu Provincial General Hospital • Runyenjes Sub-District Hospital • Karurumo RHDC • Kibugu Health Centre • Ena Dispensary • Police Headquarters Dispensary
Dr. J. N. Mbuva Dr. Margaret N. Oluka Mr. Erastus Ndubi
4 RIFT VALLEY
• Nakuru Provincial General Hospital • Bahati Health Centre • Njoro Health Centre • Kapkures Dispensary • Mang’u Dispensary • Lengenet Dispensary
Ms. Dorcas Too Mr. Philemon Chweya Dr. W. Ochieng
5 NYANZA • Kisumu Provincial General Hospital • Rachuonyo District Hospital • Nyamira District Hospital • Kodiaga Health Centre • Ahero Health Centre • Sondu Dispensary
Dr. J. Orwa Mr. S.R. Penni Dr. J. Maina

45
APPENDIX 4 SURVEY FORMS 1–16
Survey Forms Actual Survey Training
Field Test*
Total number of copies to be
made SF 1 SF 2 SF 3 SF 4 SF 5 SF 6 SF 7 SF 8 SF 9 SF 10 SF 11 SF 12 SF 13 SF 14 SF 15 SF 16
30 copies for public health facility pharmacies/dispensaries 30 copies for public health facility pharmacies/dispensaries 30 copies for public health facility pharmacies/dispensaries 30 copies for public health facility pharmacies/dispensaries 30 copies for public health facility pharmacies/dispensaries 30 copies for public health facility pharmacies/dispensaries 30 copies for public health facilities 30 copies for public health facilities 30 copies for public health facilities 30 copies for private pharmacies/dispensaries 30 copies for private pharmacies/dispensaries 30 copies for private pharmacies/dispensaries 5 copies for central/district warehouses 5 copies for central/district warehouses 5 copies for central/district warehouses 900 copies for households
15 15 15 15 15 15 15 15 15 15 15 15 15 15 15 60
45 45 45 45 45 45 45 45 45 45 45 45 20 20 20 960
* Make one copy of forms 1-16 for each data collector to use during the training session and one copy of forms 1-15 and 10 copies of form 16 for each team to use during the field test.

46
Survey form 1: Public health facility pharmacy/dispensary Indicator: Availability of key medicines
% medicines expired Facility Date Province Investigator
Key medicines to treat common conditions
[A]
In stock Yes=1, No=0
[B]
Expired medicines on shelves
Yes=1, No=0 [C]
1. Sulphadoxine and Pyrimethamine
2. Amoxicillin
3. Benzyl penicillin
4. ORS
5. Compound benzoic acid (Whitfields)
6. Mebendazole
7. Ferrous sulphate
8. Cotrimoxazole
9. Metronidazole
10. Phenobarbitone
11. Tetracycline eye preparation
12. Paracetamol
13. Chlorpheniramine
14. Tetanus toxoid
15. Combined oral contraceptive (oestradiol/ progesterone)
[B1] = Sum of B = [C1] = Sum of C =
[B2] = % in stock = B1 ÷ 15 x 100 =
[C2] = % expired = C1 ÷ B1 x 100 =
Additional medicines In stock
Yes=1, No=0 Expired medicines on
shelves Yes=1, No=0
1. Rifater® or ALL three components (rifampicin/ isoniazid/ pyrazinamide)
Notes: [A] A list of 15 key medicines should be identified at the national level and pre-printed on the survey forms.
The process is described on page X of The Manual. If medicines for specific health programmes are identified for investigation, the “optional additional medicines” table may be used and analysed separately.
[B] Mark “1” if stock is available in the facility on the day of the visit if any quantity of any dosage form is available. Mark “0” if the medicine is not physically available. Add the total at the bottom [B1]. Calculate the percentage in stock [B2] by dividing the total in stock [B1] by 15 and multiplying by 100.
[C] For all medicines in stock, check if expired or not. If any of the medicine has an expiry problem, mark “1” for yes. Add the total at the bottom [C1]. Calculate the percentage expired [C2] by dividing the total expired [C1] by the total number of medicines in stock [B1] and multiplying by 100.
Public Health Facility
Pharmacy Facility #____
(1-30)

47
Survey form 2: Public health facility pharmacy/dispensary Indicator: Price of key medicines Facility Date Province Investigator
Key medicines to treat common
conditions
[A]
Preparation and unit (strength and dosage form, e.g.
for Amoxicillin: 25 mg/ml suspension in 100 ml bottle)
[B]
Lowest price paid by facility
[C]
Lowest price paid by patient
[D]
1. Sulphadoxine and Pyrimethamine tablet 500g course
2. Amoxicillin suspension 125 mg (100ml) course (>5yrs)
3. Benzyl penicillin 1MU course
4. ORS sachet course
5. Compound benzoic acid (Whitfields)
15g tube 6% course
6. Mebendazole Tablet 100mg course
7. Ferrous sulphate 200mg tablet course
8. Cotrimoxazole 240 mg suspension/5ml (60ml) course (>5yrs)
9. Metronidazole 200 mg tablet course
10. Phenobarbitone 30mg tablet course
11. Tetracycline eye preparation 1% tube 5g course
12. Paracetamol tablet 500mg course 13. Chlorpheniramine tablet 4mg course
14. Tetanus toxoid vial plus syringe/needle course
15. Combined oral contraceptive (oestradiol/ progesterone)
1 month course
Additional medicines Preparation and unit
Lowest price
paid by facility
Lowest price paid by patient
1. Rifater® or ALL three components (rifampicin/isoniazid/ pyrazinamide)
Tablet course
Notes: [A] The list of 15 key medicines and optional additional medicines identified for Survey Form 1 should also
be pre-printed on this form. [B] At the national level, identify a commonly dispensed preparation and unit for each key medicine and
preprint these on the survey form. The process is described on page X of The Manual. [C] For each available medicine, determine the lowest price in the local currency paid by the facility for the
identified preparation and unit. The lowest priced brand or generic equivalent medicine should be used. If facilities generally receive the medicine for free from the Ministry of Health, record the price paid when the medicine is purchased elsewhere. If data is not available, mark N/A.
[D] For each available medicine, determine the lowest price in the local currency paid out-of-pocket by a patient for the identified preparation and unit. The lowest priced brand or generic equivalent medicine should be used. If there are flat charges paid for each medicine given to patients, this amount should be recorded as the price of the medicine. Indicate “0” if medicines are given free.
Public Health Facility
Pharmacy Facility #____
(1-30)

48
Survey form 3: Public health facility pharmacy/dispensary Indicator: Average stockout duration Adequate record keeping Facility Date Province Investigator
Only collect data for medicines with records
covering at least 6 continuous months in past 12 months Key medicines to treat common
conditions
[A]
Records cover at least six continuous months within past twelve
months Yes=1, No=0
[B]
Number of days out of stock [C]
Number of days covered
by the review
[D]
Equivalent number of days
per year [E] = C x 365 ÷ D
[E]
1. Sulphadoxine & pyrimethamine
2. Amoxicillin 3. Benzyl penicillin 4. ORS 5. Compound benzoic acid
(Whitfields)
6. Mebendazole 7. Ferrous sulphate 8. Cotrimoxazole 9. Metronidazole 10. Phenobarbitone 11. Tetracycline eye preparation 12. Paracetamol 13. Chlorpheniramine 14. Tetanus toxoid 15. Combined oral contraceptive
(oestradiol/ progesterone)
[B1] = Sum of B = [E1] = Sum of E =
[B2] = % adequate
records = B1 ÷ 15 x 100 =
[F] = Average number of stockout days = E1 ÷ B1 =
Only collect data for medicines with records covering
at least six months Additional medicines
Records cover at least six
months Yes=1, No=0
Number of days out of
stock
Number of days covered by the review
Equivalent number of days per year
[E] = C x 365 ÷ D 1. Rifater® or ALL three components (rifampicin/ isoniazid/pyrazinamide)
Notes:
[A] The list of 15 key medicines and optional additional medicines identified for Survey Form 1 should also be pre-printed on this form.
[B] Go through the stock cards and indicate which medicines have records covering at least 6 months within the previous 12 months. Add the total at the bottom [B1]. Calculate the percentage of medicines with adequate records [B2] by dividing the number of medicines with records covering at least 6 months [B1] by 15 and multiplying by 100.
Public Health Facility
Pharmacy Facility #____
(1-30)

49
[C] The review should cover 6-12 months. Go through the stock cards covering the review period. Indicate the number of days each medicine was not available or marked “0” on the card. A medicine is considered in stock if it is available in generic or branded form.
[D] Indicate the number of days actually reviewed for each medicine. [E] Compute the equivalent number of stockout days per year for each medicine by multiplying the number of days
out of stock [C] by 365 and dividing by the number of days covered by the review [D]. Add the total number of stockout days [E1].
[F] Calculate the average number of stockout days by dividing the total number of stockout days [E1] by the total number of key medicines reviewed [B1].
Example: Only collect data for medicines with records
covering at least six months Key medicines to
treat common conditions
[A]
Records cover at least six months
Yes=1, No=0
[B]
Number of days out of
stock [C]
Number of days covered by the review
[D]
Equivalent number of days per year [E]
= C x 365 ÷ D [E]
Cotrimoxazole 1 90 180 182.5 Paracetamol 1 30 365 30 Amoxicillin 0
[B1] = Sum of B = 2 [B2] = % adequate records = B1 ÷ 3 x 100 = 66.7
[E1] = Sum of E =212.5
[F] = Average number of stockout days = E1 ÷ B1 = 106.25

50
Survey form 4: Public health facility pharmacy/dispensary Indicator: Adequate conservation conditions and handling of medicines Facility Date Province Investigator
Checklist Storeroom True=1, False=0
[A]
Dispensing Area/Room True=1, False=0
[B] 1. There is a method in place to control temperature
(such as a roof and ceiling with space between them in hot climates).
2. There are windows that can be opened or there are air vents.
3. No direct sunlight can enter the area (window panes are painted or there are curtains/blinds to protect against the sun).
4. Area is free from moisture (leaking ceiling, roof, drains, taps, etc.).
5. Drugs are not stored directly on the floor. 6. In the facility there is a cold storage with
temperature chart.
7. Drugs are stored in a systematic way (such as alphabetical, pharmacological or first expiry-first out).
8. There is no evidence of pests in the area and/or staff doesn’t report any pests.
9. Tablets/capsules are not manipulated by naked hand.
[A1] = Sum of A = [B1] = Sum of B =
[A2] = Score = A1 ÷ 8 x 100 =
[B2] = Score = B1 ÷ 8 x 100 =
Notes: [A] Indicate “1” if all parts of the statement are true for the storeroom and “0” if any part of it is false. Sum
the total number of true statements [A1]. Calculate the score for the storeroom [A2] by dividing the sum of true statements [A1] by 8 and multiplying by 100.
[B] Indicate “1” if all parts of the statement are true for the dispensing area/room and “0” if any part of it is false. Sum the total number of true statements [B1]. Calculate the score for the dispensing area [B2] by dividing the sum of true statements [B1] by 8 and multiplying by 100.
Public Health Facility
Pharmacy Facility #____
(1-30)

51
Survey form 5: Public health facility pharmacy/dispensary Indicator: Affordability of treatment for adults and children under 5 years of age Facility Date Province Investigator
Drug/INN and Preparation
[A]
Number of units needed to complete treatment
[B]
Unit price (one vial, tablet, or capsule)
[C]
Total cost of treatment
[D] = B x C
[D]
Equivalent number of days wages [G] = D ÷ E
[G]
Ratio of cost of treatment and minimum wage
[H] = D ÷ F [H]
Moderate pneumonia (without hospitalization): Adult treatment of choice: IM benzyl penicillin stat 2MU Amoxicillin 500mg 3xday for 7 days
2 x 1MU vials; 5cc syringe/21 gauge needle; 10ml water 42 x capsules 250mg
[G1] = [H1] =
Child <5 treatment of choice: IM benzyl penicillin stat 1MU stat Amoxicillin 125mg/5ml x 3 x/day for 5 days
1 x 1MU vials 2ml syringe/23 gauge needle; 10ml water 100ml syrup 125mg/5ml
[G2] = [H2] =
Malaria (without hospitalization): Adult treatment of choice: SP 500 mg 25 mg Paracetamol 500 mg
3 tablets 18 tablets
[G3] = [H3] =
Child <5 treatment of choice: SP 500 mg 25 mg Paracetamol suspension
1 tablet 60ml bottle
[G4] = [H4] =
[E] = Lowest daily government salary (divide weekly salary by 7 or monthly salary by 30) = KShs 88 [F] = Kenyan minimum daily wage = KShs 60
Notes: [A] Using standard treatment guidelines, identify at the national level and preprint on the form the treatment of choice and
the recommended preparation for moderate pneumonia and another important disease (e.g. malaria in African countries) in adults and children. Do not include symptomatic drugs, e.g. for fever or cough.
[B] The number of units of each drug needed for the duration of treatment (based on standard treatment guidelines) should be identified at the national level and pre-printed on the survey forms.
[C] Indicate the unit price or the price charged to patients for each drug at the facility in the local currency. The lowest priced brand or generic equivalent drug should be used. If there are flat charges paid for each drug given to patients, this amount should be recorded as the price of the drug. Indicate “0” if drugs are given free. Add cost of syringe to unit price, if applicable.
[D] Calculate total cost of treatment [D] by multiplying the number of units needed [B] by unit price [C]. Only one drug (antibiotic) should be used to calculate cost of treatment and not a combination of drugs.
[E] Record the lowest daily government salary. If the weekly salary is known, divide this by 7 to obtain the daily salary. If the monthly salary is known, divide this by 30 to obtain the daily salary.
[F] At the national level, a second standard, such as poverty line, food basket, or other relevant figure may be identified and pre-printed on the form.
[G] Calculate the number of days wages needed to pay for treatment by dividing the cost of treatment [D] by the lowest daily government salary [E].
[H] Calculate the ratio of cost of treatment and the optional standard of measure by dividing the cost of treatment [D] by the optional standard [F].
Public Health Facility
Pharmacy Facility #____
(1-30)

52
Example: Drug/INN and Preparation
[A]
Number of units needed to complete treatment
[B]
Unit price (one vial, tablet, or capsule)
[C]
Total cost of treatment
[D] = B x C
[D]
Equivalent number of days wages [G] = D ÷ E
[G]
Ratio of cost of treatment and
optional measure[H] = D ÷ F
[H] Moderate pneumonia (without hospitalization): Adult treatment of choice: Procaine penicillin: 1g 1 mill IU
3 injections 280 (injection plus syringe)
840 11.2 17
Child treatment of choice: Amoxicillin: 25 mg/ml suspension in 100 ml bottle
1 bottle 220 per bottle
220 2.93 4.5
[E] = Daily government salary (divide weekly salary by 7 or monthly salary by 30) = 75 [F] = Optional standard of measure: ___Poverty line (annual income of 18000) ÷ 365 = 18000 ÷ 365 = 49.3

53
Survey form 6: Public health facility pharmacy/dispensary: Patient care form Indicators: % drugs dispensed % patients know how to take drugs % drugs adequately labelled Average cost of drugs and related fees Facility Date Province Investigator
Patient sex
M/F
[A]
Number of drugs
prescribed
[B]
Number of drugs
dispensed or
administered
[C]
Number of drugs
adequately labelled
[D]
Patient knows how to take
drugs Yes=1, No=0
[E]
Amount patient paid for
purchased drugs
[F]
Amount patient
paid in all other fees
[G]
1. 2. 3. 4. 5. 6. 7. 8. 9. 10. 11. 12. 13. 14. 15. 16. 17. 18. 19. 20. 21. 22. 23. 24. 25. 26. 27. 28. 29. 30. [A1] = Sum cases =
[B1] = Sum of B =
[C1] = Sum of C =
[D1] = Sum of D =
[E1] = Sum of E =
[F1] = Sum of F =
[G1] = Sum of G =
[A2] = Sum females = [A3] = % females = A2 ÷ A1 x 100 =
[B2] = Average number of drugs = B1 ÷ A1 =
[C2] = % dispensed = C1 ÷ B1 x 100 =
[D2] = % adequately labelled = D1 ÷ C1 x 100 =
[E2] = % know how to take drugs = E1 ÷ A1 x 100 =
[H] = Average cost = (F1 + G1) ÷ A1 =
Notes: [A] Interview 30 patients leaving the dispensing area/pharmacy. Record the number of cases [A1] and the number of
females [A2]. Calculate the percentage of females by dividing the total number of females [A2] by the total number of cases [A1] and multiplying by 100.
[B] Record the number of drugs (chemical entity, INN, generic) prescribed for each patient. Combination drugs in one dosage form count as one drug. Sum the number of drugs prescribed for all patients [B1]. Calculate average number of drugs prescribed [B2] by dividing number of drugs prescribed [B1] by number of cases [A1].
Public Health Facility
Pharmacy Facility #____
(1-30)

54
[C] Record the number of drugs dispensed or administered to each patient. Sum the total number of drugs dispensed or administered to all patients [C1]. Calculate the percentage of drugs dispensed [C2] by dividing the number of drugs given to all patients [C1] by the total number of drugs prescribed [B1] and multiplying by 100.
[D] Record the number of drugs labelled with at least the patient name, name of the drug, and written instructions on how to take it. Count only drugs meeting all criteria. Total the number of adequately labelled drugs [D1]. Calculate the percentage of drugs adequately labelled [D2] by dividing the total number of adequately labelled drugs [D1] by the total number of drugs dispensed [C1] and multiplying by 100.
[E] Determine if patient knows how to take all drugs dispensed. Mark “1” only if patient can correctly state how ALL drugs should be taken and “0” otherwise. Sum the total number of patients who know how to take all drugs [E1]. Calculate the percentage of patients who know how to take all drugs [E2] by dividing the total number who know how to take all drugs [E1] by the total number interviewed [A1] and multiplying by 100.
[F] Record the amount each patient paid out-of-pocket for the drugs received at the facility. Check with a receipt if possible. Sum the amount paid for drugs [F1].
[G] Record the amount of other fees paid by the patient, such as visit, injection, lab or x-ray fees. Sum the amount paid for other fees [G1].
[H] Calculate the average amount paid for drugs and fees by adding the amounts paid for drugs [F1] and fees [G1], dividing by the total number interviewed [A1].

55
Survey form 7: Public health facility: Rational drug use - Prescribing indicator form Indicators: Average number of drugs % drugs on Essential Medicines List % patients prescribed antibiotics/injections % drugs prescribed by INN Facility Date Province Investigator
Type R/P
[A]
Patient sex M/F
[B]
Number of drugs
prescribed [C]
Antibiotic prescribed
Yes=1, No=0
[D]
Injection prescribed
Yes=1, No=0 [E]
Number of prescribed drugs on Essential Medicines
List [F]
Number of drugs prescribed by
INN
[G] 1. 2. 3. 4. 5. 6. 7. 8. 9. 10. 11. 12. 13. 14. 15. 16. 17. 18. 19. 20. 21. 22. 23. 24. 25. 26. 27. 28. 29. 30.
[B1] = Sum cases =
[C1] = Sum of C =
[D1] = Sum of D =
[E1] = Sum of E =
[F1] = Sum of F = [G1] = Sum of G =
[B2] = Sum females =
[B3] = % females = B2
÷ B1 x 100 =
[C2] = Average number of drugs = C1 ÷ B1 =
[D2] = % receiving antibiotics = D1 ÷ B1 x 100 =
[E2] = % receiving injections = E1
÷ B1 x 100 =
[F2] = % EDL = F1 ÷ C1 x 100 =
[G2] = % INN = G1 ÷ C1 x 100 =
Notes: [A] From outpatient treatment records, select 30 patients seen within the last 12 months (R = retrospective sampling). If
records are not available, select 30 patients currently being treated (P = prospective sampling). Sample can combine R and P. The process is described on page X of The Manual. Mark “R” if patient was selected retrospectively and “P” if patient was selected prospectively.
[B] Record the number of cases [B1] and the number of females [B2]. Calculate the percentage of females by dividing the total number of females [B2] by the total number of cases [B1] and multiplying by 100.
[C] Record number of drugs (chemical entity, INN, generic) prescribed. Combination drugs in one dosage form count as
Public Health Facility
Facility #____
(1-30)

56
one drug. Total the number of drugs prescribed [C1]. Calculate average number of drugs prescribed [C2] by dividing number of drugs prescribed [C1] by number of cases [B1].
[D] Record “1” if patient was prescribed any antibiotics and “0” otherwise. (See definition of antibiotics on page X of The Manual.) Total the number of cases receiving antibiotics [D1]. Calculate percentage of cases with antibiotics [D2] by dividing number of cases with antibiotics [D1] by number of cases [B1] and multiplying by 100.
[E] Record “1” if patient was prescribed any injections and “0” otherwise. (See definition of injections on page X of The Manual.) Total the number of cases receiving injections [E1]. Calculate percentage of cases receiving injections [E2] by dividing number of cases with injections [E1] by number of cases [B1] and multiplying by 100.
[F] Record number of prescribed drugs on the national Essential Drugs List (EDL). Total the number of prescribed drugs on the EDL [F1]. Calculate the percentage of prescribed drugs on the EDL [F2] by dividing the number of drugs on the EDL [F1] by the number of drugs prescribed [C1] and multiplying by 100.
[G] Record number of drugs prescribed by INN. Total the number of drugs prescribed by INN [G1]. Calculate percentage of drugs prescribed by INN [G2] by dividing number of drugs prescribed by INN [G1] by number of drugs prescribed [C1] and multiplying by 100.
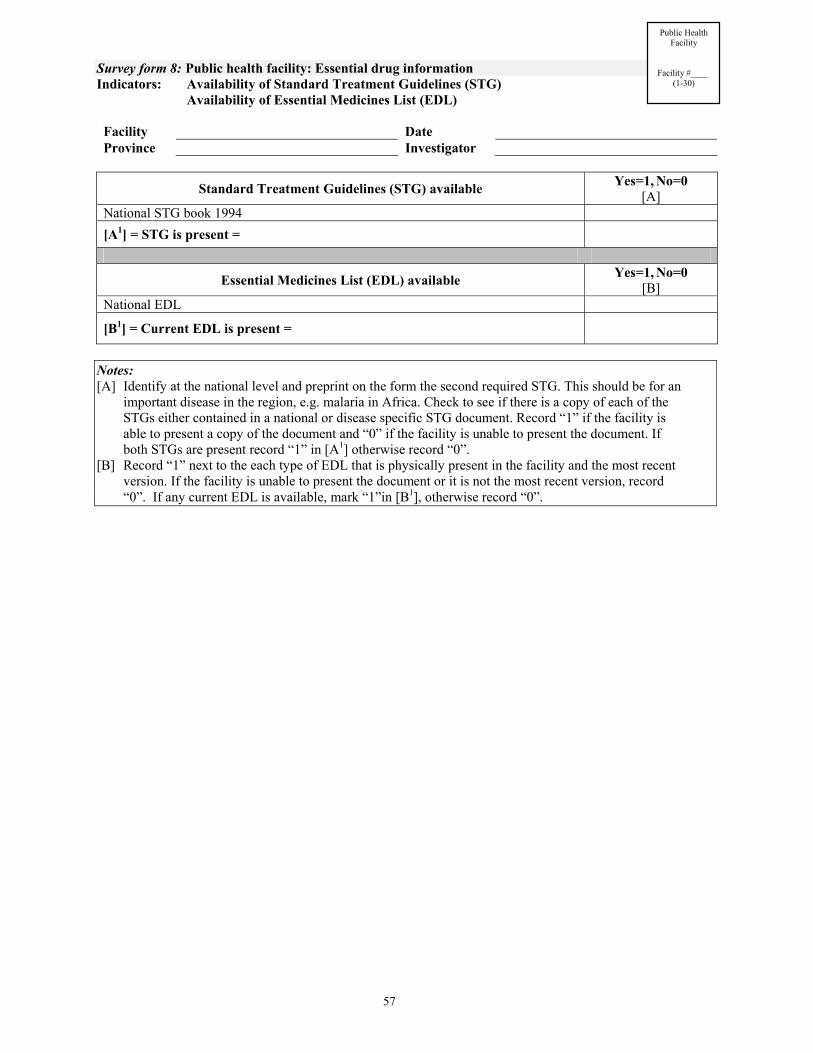
57
Survey form 8: Public health facility: Essential drug information Indicators: Availability of Standard Treatment Guidelines (STG) Availability of Essential Medicines List (EDL) Facility Date Province Investigator
Standard Treatment Guidelines (STG) available Yes=1, No=0 [A]
National STG book 1994 [A1] = STG is present =
Essential Medicines List (EDL) available Yes=1, No=0 [B]
National EDL
[B1] = Current EDL is present =
Notes: [A] Identify at the national level and preprint on the form the second required STG. This should be for an
important disease in the region, e.g. malaria in Africa. Check to see if there is a copy of each of the STGs either contained in a national or disease specific STG document. Record “1” if the facility is able to present a copy of the document and “0” if the facility is unable to present the document. If both STGs are present record “1” in [A1] otherwise record “0”.
[B] Record “1” next to the each type of EDL that is physically present in the facility and the most recent version. If the facility is unable to present the document or it is not the most recent version, record “0”. If any current EDL is available, mark “1”in [B1], otherwise record “0”.
Public Health Facility
Facility #____
(1-30)

58
Survey form 9: Public health facility Indicator: % of tracer cases treated with drugs recommended or discouraged in STGs Facility Date Province Investigator
Use of drugs by case
Yes=1, No=0 [B]
Tracer conditions and drugs prescribed
[A] 1 2 3 4 5 6 7 8 9 10
Total number of cases
[C]
Number of cases
prescribed drug
[D]
% of cases prescribed
drug [E] = D ÷ C x 100
[E] Diarrhoea in children under age 5 ORS Antibiotic Antidiarrhoeal or antispasmodic
Mild/moderate (outpatient) pneumonia in children under age 5 [A1] 1st line antibiotic(s) in national STG: Amoxicillin Any 1st line antibiotic Prescribed >1 antibiotic URTI in patients of any age Any antibiotic Malaria in patients of any age SP as 1st line Any other antimalarial More than 1 antimalarial
Notes: [A] At the national level, identify and preprint on the form the first line antibiotic(s) mentioned in the national STG for pneumonia [A1]. In addition, identify and preprint on the form optional tracer conditions [A2] and the drugs that will be used to measure recommended or non-recommended practices. The process is described on page X of The Manual. [B] From general adult or paediatric outpatient records, select 10 patient encounters with each target condition. If
possible, choose only single diagnosis encounters. Write “1” or “0” for each case selected to indicate whether or not each ta rget drug was prescribed. [C] Sum the total number of cases in each row. [D] Sum the total number of cases in each row that were prescribed the target drug. [E] For each row, calculate the percentage of patients receiving each drug [E] by dividing the total number of cases that were prescribed each drug [D] by the total number of cases [C] and multiplying by 100.
Public Health Facility
Facility #____
(1-30)

59
Survey form 10: Private pharmacy/dispensary Indicator: Affordability of treatment for adults and children under 5 years of age Facility Date Province Investigator
Drug/INN and Preparation
[A]
Number of units needed to complete treatment
[B]
Unit price (one vial, tablet, or capsule)
[C]
Total cost of treatment
[D] = B x C
[D]
Equivalent number of days wages [G] = D ÷ E
[G]
Ratio of cost of treatment and minimum wage
[H] = D ÷ F [H]
Moderate pneumonia (without hospitalization): Adult treatment of choice: IM benzyl penicillin stat 2MU Amoxicillin 500mg 3xday for 7 days
2 x 1MU vials; 5cc syringe/21 gauge needle; 10ml water 42 x capsules 250mg
[G1] = [H1] =
Child <5 treatment of choice: IM benzyl penicillin stat 1MU stat Amoxicillin 125mg/5ml x 3 x/day for 5 days
1 x 1MU vials 2ml syringe/23 gauge needle; 10ml water 100ml syrup 125mg/5ml
[G2] = [H2] =
Malaria (without hospitalization): Adult treatment of choice: SP 500 mg 25 mg Paracetamol 500 mg
3 tablets 18 tablets
[G3] = [H3] =
Child <5 treatment of choice: SP 500 mg 25 mg Paracetamol suspension
1 tablet 60ml bottle
[G4] = [H4] =
[E] = Lowest daily government salary (divide weekly salary by 7 or monthly salary by 30) = KShs 88 [F] = Kenyan minimum daily wage = KShs 60
Notes: [A] Using standard treatment guidelines, identify at the national level and preprint on the form the treatment of choice and the recommended preparation for moderate pneumonia and another important disease (e.g. malaria in African
countries) in adults and children. Do not include symptomatic drugs, e.g. for fever or cough. [B] The number of units of each drug needed for the duration of treatment (based on standard treatment guidelines) should be identified at the national level and pre-printed on the survey forms. [C] Indicate the unit price or the price charged to patients for each drug at the facility in the local currency. The lowest priced brand or generic equivalent drug should be used. If there are flat charges paid for each drug given to patients, this amount should be recorded as the price of the drug. Indicate “0” if drugs are given free. Add cost of syringe to unit price, if applicable. [D] Calculate total cost of treatment [D] by multiplying the number of units needed [B] by unit price [C]. Only one drug
(antibiotic) should be used to calculate cost of treatment and not a combination of drugs. [E] Record the lowest daily government salary. If the weekly salary is known, divide this by 7 to obtain the daily salary. If the monthly salary is known, divide this by 30 to obtain the daily salary. [F] At the national level, a second standard, such as poverty line, food basket, or other relevant figure may be identified and pre-printed on the form. [G] Calculate the number of days wages needed to pay for treatment by dividing the cost of treatment [D] by the lowest daily government salary [E]. [H] Calculate the ratio of cost of treatment and the optional standard of measure by dividing the cost of treatment [D] by the optional standard [F].
Private Pharmacy
Facility #____
(1-30)

60
Example:
Drug/INN and Preparation
[A]
Number of units needed to complete treatment
[B]
Unit price (one vial, tablet, or capsule)
[C]
Total cost of treatment
[D] = B x C
[D]
Equivalent number of days wages [G] = D ÷ E
[G]
Ratio of cost of treatment and
optional measure[H] = D ÷ F
[H] Moderate pneumonia (without hospitalization): Adult treatment of choice: Procaine penicillin: 1g 1 mill IU
3 injections 280 (injection plus syringe)
840 11.2 17
Child treatment of choice: Amoxicillin: 25 mg/ml suspension in 100 ml bottle
1 bottle 220 per bottle
220 2.93 4.5
[E] = Daily government salary (divide weekly salary by 7 or monthly salary by 30) = 75 [F] = Optional standard of measure: ___Poverty line (annual income of 18000) ÷ 365 = 18000 ÷ 365 = 49.3

61
Survey form 11: Private pharmacy/dispensary Indicator: Availability of key drugs
% drugs expired Facility Date Province Investigator
Key drugs to treat common conditions
[A]
In stock Yes=1, No=0
[B]
Expired drugs on shelves
Yes=1, No=0 [C]
1. Sulphadoxine and pyrimethamine
2. Amoxicillin
3. Benzyl penicillin
4. ORS
5. Compound benzoic acid (Whitfields)
6. Mebendazole
7. Ferrous sulphate
8. Cotrimoxazole
9. Metronidazole
10. Phenobarbitone
11. Tetracycline eye preparation
12. Paracetamol
13. Chlorpheniramine
14. Tetanus toxoid
15. Combined oral contraceptive (oestradiol/ progesterone)
[B1] = Sum of B = [C1] = Sum of C =
[B2] = % in stock = B1 ÷ 15 x 100 =
[C2] = % expired = C1 ÷ B1 x 100 =
Additional drugs In stock
Yes=1, No=0 Expired drugs on
shelves Yes=1, No=0
1. Rifater® or ALL three components (rifampicin/isoniazid/pyrazinamide)
Notes: [A] The list of 15 key drugs and optional additional drugs identified for Survey Form 1 should also be pre-printed
on this form. [B] Mark “1” if stock is available in the facility on the day of the visit if any quantity of any dosage form is
available. Mark “0” if the drug is not physically available. Add the total at the bottom [B1]. Calculate the percentage in stock [B2] by dividing the total in stock [B1] by 15 and multiplying by 100.
[C] For all drugs in stock, check if expired or not. If any of the drug has an expiry problem, mark “1” for yes. Add the total at the bottom [C1]. Calculate the percentage expired [C2] by dividing the total expired [C1] by the total number of drugs in stock [B1] and multiplying by 100.
Private Pharmacy
Facility #____
(1-30)

62
Survey form 12: Private pharmacy/dispensary Indicator: Price of key drugs Facility Date Province Investigator
Key drugs to treat common conditions
[A]
Preparation and unit (strength and dosage form, e.g.
for Amoxicillin: 25 mg/ml suspension in100 ml bottle)
[B]
Lowest price paid by
pharmacy [C]
Lowest price paid by patient
[D]
1. Sulphadoxine and pyrimethamine 1 x tablet 500g
2. Amoxicillin suspension 125 mg (100ml)
3. Benzyl penicillin 1 MU
4. ORS 1 sachet
5. Compound benzoic acid (Whitfields)
1 x 15g tube 6%
6. Mebendazole 1 x tablet 100mg
7. Ferrous sulphate 1 x200mg tablet
8. Cotrimoxazole 240 mg suspension/5ml (60ml)
9. Metronidazole 1 x 200 mg tablet
10. Phenobarbitone 1 x 30mg tablet
11. Tetracycline eye preparation 1 eye ointment 1% tube 5g
12. Paracetamol 1 x tablet 500mg
13. Chlorpheniramine 1 x tablet 4mg
14. Tetanus toxoid 1 x vial plus syringe/needle
15. Combined oral contraceptive (oestradiol/ progesterone)
1 month course
Additional drugs Preparation and unit
Lowest price
paid by pharmacy
Lowest price paid by patient
1. Rifater® or ALL three components (rifampicin/isoniazid/pyrazinamide)
Notes: [A] The list of 15 key drugs and optional additional drugs identified for Survey Form 1 should also be pre-printed
on this form. [B] At the national level, identify a commonly dispensed preparation and unit for each key drug and preprint these
on the survey form. The process is described on page X of The Manual. [C] For each available drug, determine the lowest price in the local currency paid by the pharmacy for the
identified preparation and unit. The lowest priced brand or generic equivalent drug should be used. [D] For each available drug, determine the lowest price in the local currency paid out-of-pocket by a patient for the
identified preparation and unit. The lowest priced brand or generic equivalent drug should be used. If there are flat charges paid for each drug given to patients, this amount should be recorded as the price of the drug. Indicate “0” if drugs are given free.
Private Pharmacy
Facility #____
(1-30)

63
Survey form 13: Central/district warehouse Indicator: Availability of key drugs
% drugs expired Facility Date Province Investigator
Key drugs to treat common conditions
[A]
In stock Yes=1, No=0
[B]
Expired drugs on shelves
Yes=1, No=0 [C]
1. Sulphadoxine and pyrimethamine
2. Amoxicillin
3. Benzyl penicillin
4. ORS
5. Compound benzoic acid (Whitfields)
6. Mebendazole
7. Ferrous sulphate
8. Cotrimoxazole
9. Metronidazole
10. Phenobarbitone
11. Tetracycline eye preparation
12. Paracetamol
13. Chlorpheniramine
14. Tetanus toxoid
15. Combined oral contraceptive (oestradiol/ progesterone)
[B1] = Sum of B = [C1] = Sum of C =
[B2] = % in stock = B1 ÷ 15 x 100 =
[C2] = % expired = C1 ÷ B1 x 100 =
Additional drugs In stock
Yes=1, No=0 Expired drugs on
shelves Yes=1, No=0
1. Rifater® or ALL three components (rifampicin/isoniazid/pyrazinamide)
Notes: [A] The list of 15 key drugs and optional additional drugs identified for Survey Form 1 should also be pre-printed
on this form. [B] Mark “1” if stock is available in the facility on the day of the visit if any quantity of any dosage form is
available.. Mark “0” if the drug is not physically available. Add the total at the bottom [B1]. Calculate the percentage in stock [B2] by dividing the total in stock [B1] by 15 and multiplying by 100.
[C] For all drugs in stock, check if expired or not. If any of the drug has an expiry problem, mark “1” for yes. Add the total at the bottom [C1]. Calculate the percentage expired [C2] by dividing the total expired [C1] by the total number of drugs in stock [B1] and multiplying by 100.
Central/district warehouse
Facility #____
(1-5)

64
Survey form 14: Central/district warehouse Indicator: Average stockout duration Adequate record keeping Facility Date Province Investigator
Only collect data for drugs with records
covering at least 6 continuous months in past 12 months
Key drugs to treat common conditions
[A]
Records cover at least six continuous months
within past twelve months
Yes=1, No=0
[B]
Number of days out of stock [C]
Number of days covered
by the review
[D]
Equivalent number of days
per year [E] = C x 365 ÷ D
[E] 1. Sulphadoxine &
pyrimethamine
2. Amoxicillin 3. Benzyl penicillin 4. ORS 5. Compound benzoic acid
(Whitfields)
6. Mebendazole 7. Ferrous sulphate 8. Cotrimoxazole 9. Metronidazole 10. Phenobarbitone 11. Tetracycline eye preparation 12. Paracetamol 13. Chlorpheniramine 14. Tetanus toxoid 15. Combined oral contraceptive
(oestradiol/ progesterone)
[B1] = Sum of B = [E1] = Sum of E =
[B2] = % adequate records = B1 ÷ 15 x 100 =
[F] = Average number of stockout days = E1 ÷ B1 =
Only collect data for drugs with records
covering at least six months Additional drugs
Records cover at least six months
Yes=1, No=0
Number of days out of stock
Number of days
covered by the review
Equivalent number of days per year
[E] = C x 365 ÷ D
1.Rifater® or ALL three components (rifampicin/isoniazid/pyrazinamide)
Notes: [A] The list of 15 key drugs and optional additional drugs identified for Survey Form 1 should also be pre-printed on this form. [B] Go through the stock cards and indicate which drugs have records covering at least 6 months within the
previous 12 months. Add the total at the bottom [B1]. Calculate the percentage of drugs with adequate records [B2] by dividing the number of drugs with records covering at least 6 months [B1] by 15 and
multiplying by 100.
Central/district warehouse
Facility #____
(1-5)

65
[C] The review should cover 6-12 months. Go through the stock cards covering the review period. Indicate the
number of days each drug was not available or marked “0” on the card. A drug is considered in stock if it is available in generic or branded form.
[D] Indicate the number of days actually reviewed for each drug. [E] Compute the equivalent number of stockout days per year for each drug by multiplying the number of days out of stock [C] by 365 and dividing by the number of days covered by the review [D]. Add the total number of stockout days [E1]. [F] Calculate the average number of stockout days by dividing the total number of stockout days [E1] by the total number of key drugs reviewed [B1]. Example:
Only collect data for drugs with records covering at least six months
Key drugs to treat common conditions
[A]
Records cover at least six months
Yes=1, No=0
[B]
Number of days out of stock [C]
Number of days
covered by the review
[D]
Equivalent number of days per year [E]
= C x 365 ÷ D
[E]
Cotrimoxazole 1 90 180 182.5 Paracetamol 1 30 365 30 Amoxicillin 0
[B1] = Sum of B = 2 [B2] = % adequate records = B1 ÷ 3 x 100 = 66.7
[E1] = Sum of E =212.5
[F] = Average number of stockout days = E1 ÷ B1 = 106.25

66
Survey form 15: Central/district warehouse Indicator: Adequate conservation conditions and handling of medicines Facility Date Province Investigator
Checklist Storeroom True=1, False=0
[A] 1. There is a method in place to control temperature
(such as a roof and ceiling with space between them in hot climates).
2. There are windows that can be opened or there are air vents.
3. No direct sunlight can enter the area (window panes are painted or there are curtains/blinds to protect against the sun).
4. Area is free from moisture (leaking ceiling, roof, drains, taps, etc.).
5. Drugs are not stored directly on the floor. 6. In the facility there is a cold storage with
temperature chart.
7. Drugs are stored in a systematic way (such as alphabetical, pharmacological or first expiry-first out).
8. There is no evidence of pests in the area and/or staff doesn’t report any pests.
[A1] = Sum of A = [A2] = Score = A1 ÷ 8 x 100 =
Notes: [A] Indicate “1” if all parts of the statement are true for the storeroom and “0” if any part of it is false. Sum the
total number of true statements [A1]. Calculate the score for the storeroom [A2] by dividing the sum of true statements [A1] by 8 and multiplying by 100.
Central/district warehouse
Facility #____
(1-5)

67
Survey form 16: Access and use of medicines Facility Date Province Investigator Ask if anyone in the household has been acutely ill during the last two weeks. If yes, complete form. If more than one person was ill, record the information for the youngest person who was ill. Exclude anyone admitted to hospital or taking medication for a chronic condition. If no one has been ill during the last two weeks, go to the next household. Distance of household from surveyed health facility: □ within 5km □ 5–10km □ more than 10km 1. Sex of person who was ill: □ Male □ Female 2. Age (in years) of person who was ill: □Under 5 □ 5–15 □ 16–54 □ 55 and older 3. What were the person’s symptoms? (Mark all that apply)
□ Cough/blocked or runny nose/sore throat/ear ache
□ Fever/headache □ Diarrhoea/vomiting □ Difficulty breathing
□ Thirst/sweating □ Lethargic/cannot
sleep/cannot eat
□ Don’t know □ Other __________________
4. What was done? (Mark all that apply) □ Did nothing □ Consulted traditional healer □ Consulted public health facility □ Consulted private health facility
□ Consulted mission/NGO health facility □ Consulted private pharmacy/kiosk □ Sought advice from friend/family
□ Used medicine left from another illness □ Bought medicine without consultation □ Other __________________
5. Was medication recommended or taken during the illness? □ Yes □ No (If no, skip to question 11)
6. If any medicines were recommended or taken during this illness: Where was each medicine obtained?
0. Not obtained 1. Traditional healer 2. Public health facility 3. Private health facility 4. Mission/NGO health
facility
5. Private pharmacy/ kiosk
6. Friends/family 7. Already owned 8. Other, specify
List all the medicines (including traditional medicines) that were either recommended or taken. If informant cannot remember, ask if any of the medicines are left that he/she can show you.
(List one per line)
Who advised the patient to take the medicine? 1. Self/family/ friends2. Health care provider, including traditional healer 3. Other, specify
(Write number) (Write number)
Amount spent out-of-pocket on each medicine in local currency (Write“0” if free, “DK” if don’t know)
7. What was the total amount spent on medicines during this illness? [A] = 8. How much of the medicines recommended by a health care provider were obtained? □All □Some □None 9. If not all, why not? (Mark all that apply) □ Price was too high □ Did not have enough money □ Too many medicines prescribed □ Did not think all medicines were needed □ Started to feel better □ No time to get medicines
□ Traditional healer did not have all the medicines □ Public health facility did not have all the medicines □ Private health facility did not have all the medicines □ Mission/NGO health facility did not have all the medicines □ Private pharmacy/kiosk did not have all the medicines □ Other _____________________________
10. How much of the medicines recommended by a health care provider were taken? □All □Some □None 11. What is the amount spent on medicines by this household during a week? [B] = 12. What are the household expenses during a week? [C] = 13. What is the household head’s highest level of education? □None □Primary □Secondary □Vocational □College □University □Post graduate □Other ____________ 14. Who is the main source of the household’s income? □ Head of the family □ Other ____________ [D] = Proportion of household expenses spent on medicines during this illness = A ÷ C x 100 = ___________
[E] = Proportion of household expenses spent on medicines during a week = B ÷ C x 100 = ___________
Household # ____ (1-10)
distance group__________

68
APPENDIX 5 – LIST OF 15 BASKET OF MEDICINES
Condition Medicine
1. Malaria Sulfadoxine and Pyrimethamine
2. Pneumonia Amoxicillin
3. Pneumonia Benzyl penicillin
4. Diarrhoea ORS
5. Fungal skin infection Compound benzoic acid (Whitefields)
6. Worm infestation Mebendazole
7. Parasitic infection Metronidazole
8. Anaemia Ferrous sulphate
9. HIV opportunistic infections Cotrimoxazole
10. Convulsions Phenobarbitone
11. Conjunctivitis Tetracycline eye preparation
12. Pain Paracetamol
13. Acute rhinitis Chlorpheniramine
14. Vaccine Tetanus toxoid
15. Contraceptive Combined oral contraceptive

69
APPENDIX 6 – COMPLETED LEVEL ONE QUESTIONNAIRE
Questionnaire on structures and processes of country pharmaceutical situation
Country 96Kenya (AFRO) Date (dd/mm/yyyy) 30th April 2003 Name of respondent(s) Dr. Kipkerich Koskei Position(s) Chief Pharmacist, Ministry of Health Dr. Bibiana Njue Deputy Chief Pharmacis
2003 Latest WHO
Data 1. NATIONAL MEDICINES (DRUG) POLICY (NMP) 1.1 Is there a National Medicines Policy (NMP) document?
(See glossary for a definition of NMP.) If no, skip to 1.4.
Yes/No/Don’t Know Yes
Yes
Is it an official or draft document? Official/Draft/Don’t Know Official Official What year was it last updated? Year 1994 1994
1.2 Is there an NMP implementation plan that sets activities, responsibilities, budgets, and timeline?
Yes/No/Don’t Know Yes
If yes, when was it last updated? Year 1996 1.3 Is the NMP integrated into a published/official
national health policy/plan? If yes, when was it last updated?
Yes/No/Don’t Know Yes Year 1999
1.4 Is there a national policy on traditional and complementary/ alternative medicine (TM/CAM) either as part of the medicines policy or health policy or as a separate document? (TM/CAM is defined in the glossary.)
Yes/No/Don’t Know No
If yes, when was it last updated? Year 1.5 Has a national assessment/indicator study been
conducted? If yes, what areas have been studied and when was the most recent study covering each area conducted?
Yes/No/Don’t Know No
Overall pharmaceutical situation: Yes/No/Don’t Know No Year Rational use/prescription audit: Yes/No/Don’t Know No Year
Access: Yes/No/Don’t Know No Year 2. LEGISLATION/REGULATION 2.1 Is there a medicines law? If yes, when was it last
updated? Which of the following areas are covered by medicines legislation and when was each last updated?
Yes/No/Don’t Know Yes Year 2001
Establishment of regulatory authority: Yes/No/Don’t Know Yes Year 2001 Yes Marketing authorisation of pharmaceuticals: Yes/No/Don’t Know Yes Year 1982 Yes 1983
Manufacturing of medicines: Yes/No/Don’t Know Yes Year 1992 Yes 1983 Distribution of medicines: Yes/No/Don’t Know Yes Year 1957 Yes 1983
Promotion & advertising of medicines: Yes/No/Don’t Know Yes Year 2002 Yes 1983 Importation of medicines: Yes/No/Don’t Know Yes Year 1957 Yes 1983 Exportation of medicines: Yes/No/Don’t Know Yes Year 1957
Licensing & practice of prescribers: Yes/No/Don’t Know Yes Year Yes 1983 Licensing & practice of pharmacy: Yes/No/Don’t Know Yes Year 2001 Yes 1983
Herbal medicines (See glossary for definition): Yes/No/Don’t Know No Year Empowers inspectors to enter premises and collect samples
and documentation: Yes/No/Don’t Know Yes Year 1957
Requires transparency, accountability and code of conduct in regulatory work:
Yes/No/Don’t Know No Year
2.2 System and operation of medicines registration:
a) Is marketing authorisation required for medicines to be sold? If yes, how many medicinal products have been approved to be marketed? (express as number of dosage forms & strengths)
Yes/No/Don’t Know Yes Total______8232 5000

2
2003 Latest WHO
Data Is marketing authorisation required for herbal medicines to be sold? If yes, how many herbal medicinal products have been approved to be marketed? (express as number of dosage forms & strengths) (See glossary for a definition of herbal medicines)
Yes/No/Don’t Know No Total______
b) Are there detailed written guidelines, including reference guidelines and criteria, for submitting applications for the registration of medicinal products? Are there guidelines covering the registration of herbal medicines?
Yes/No/Don’t Know Yes Yes/No/Don’t Know No
c) Is the WHO Certification Scheme certificate required as part of the marketing authorisation process?
Yes/No/Don’t Know Yes
d) Is INN used in the registration of medicines? Yes/No/Don’t Know Yes e) Is a list of all registered products publicly accessible?
(Registered product is defined in the glossary.) Yes/No/Don’t Know Yes Yes
2.3 Is there a computerised registration system that facilitates retrieval of information on registered products? (Registration system is defined in the glossary.)
Yes/No/Don’t Know Yes
Is there a medicines regulatory authority website providing publicly accessible information on any of the following: legislation, regulatory procedures, prescribing information (such as indications, counterindications, side effects, etc.), authorised companies, and/or approved medicines?
Yes/No/Don’t Know No
2.4 Is licensing a requirement? (Licensing is defined in the glossary.) If yes, is it based on site inspection of:
Yes/No/Don’t Know Yes
Manufacturers: Yes/No/Don’t Know Yes Yes Importers/wholesalers: Yes/No/Don’t Know Yes
Retail distributors/pharmacies: Yes/No/Don’t Know Yes Yes 2.5 Are there written national guidelines/codes/checklists for
the inspection of:
Manufacturers: Yes/No/Don’t Know No Importers/wholesalers: Yes/No/Don’t Know No
Retail distributors/pharmacies: Yes/No/Don’t Know No 2.6 Is prescribing by generic name obligatory in the:
Public sector: Yes/No/Don’t Know Yes Yes Private sector: Yes/No/Don’t Know No No
Is generic substitution permitted at: (Generic substitution is defined in the glossary.)
Public pharmacies: Yes/No/Don’t Know Yes Yes Private pharmacies: Yes/No/Don’t Know Yes Yes
2.7 Is promotion/advertisement of medicines regulated by: Company self-regulation: Yes/No/Don’t Know No
Government agency or medicines regulatory authority: Yes/No/Don’t Know Yes Government agency
Are civil society/non-governmental organisations involved in review, assessment, or surveillance of promotion/ advertisement of medicines?
Yes/No/Don’t Know No
Do regulations on promotion/advertisement of medicines include: (See glossary for the distinction between promotion and advertisement.)
Published ethical criteria for medicines promotion: Yes/No/Don’t Know Yes Pre-approval for promotional materials: Yes/No/Don’t Know Yes
Pre-approval for advertisement materials: Yes/No/Don’t Know Yes Explicit prohibition on advertising prescription
medicines:Yes/No/Don’t Know Yes Yes
Detailed restrictions on advertising non-prescription medicines:
Yes/No/Don’t Know No

3
2003 Latest WHO
Data 2.8 Are adverse drug reactions (ADR) monitored? If yes,
what is the total number of each of the following for the most recent year for which data is available?
Yes/No/Don’t Know No
Total number of validated ADR reports received: ____ (Year ) DK Total number of reporting physicians: ____ (Year ) DK
Total number of physicians in country: ____ (Year ) DK Are ADR of herbal medicines monitored? Yes/No/Don’t Know No
3. QUALITY CONTROL OF PHARMACEUTICALS 3.1 Testing of medicines samples collected last year for
regulatory purposes (i.e. including drug registration and post-marketing surveillance, but excluding testing done in conjunction with procurement activities):
Total number of samples
Total number of samples collected: ____350 Don’t Know Total number of samples tested: ____61 Don’t Know
Total number of samples that failed identity or assay: ____12 Don’t Know 3.2 Where have the above samples (see 3.1) been tested: Percentage of total
samples tested
Government quality control laboratory: 100% Don’t Know
Local academic institutions: 0% Don’t Know Quality control laboratory in another country: 0% Don’t Know
Private quality control laboratory: 0% Don’t Know 4. ESSENTIAL MEDICINES LIST (EML) 4.1 Are there Essential Medicines Lists (EML)? (An
Essential Medicines List is a government-approved selective list of medicines or national reimbursement list)
Total number of medicines
Year of last
update
Total no.
Meds
Year up-
dated
National EML: Yes/No/DKYes 254____ 2002 Yes
330
1993
State or provincial list: Yes/No/DKYes 254____ 2002 List for primary health care: Yes/No/DKYes 83____ 2002
4.2 Are EMLs being used in: Public sector procurement:
Yes/No/Don’t Know Yes
Public insurance reimbursement: Yes/No/Don’t Know No Private insurance reimbursement: Yes/No/Don’t Know No
4.3 Are local herbal medicines included on the national EML?
Yes/No/Don’t Know No
5. MEDICINES SUPPLY SYSTEM 5.1 Who is responsible for
public sector drug procurement and distribution? What percentage of the total cost is each responsible for? Ministry/Department of Health:
Procurement Yes/No/DKYes 30%
Distribution Yes/No/DKYes 80%
Non-governmental organisation (NGO): Yes/No/DKNo 0% Yes/No/DKNo 0% Private institution contracted by the government: Yes/No/DKYes 70% Yes/No/DKNo 0%
Individual health institutions: Yes/No/DKYes 0% Yes/No/DKYes 20% 5.2 Is government procurement limited to medicines on the
EML? Yes/No/Don’t Know Yes
Yes
If no, is a percentage of the budget set aside for non-EML items?
Yes/No/Don’t Know
What is the percentage? % 5.3 Type of tender and percentage of the total cost for each:
(Tender is the process by which competing bids are entered for a particular contract.) National competitive tender:
Yes/No/DKYes
Percentage of total cost
5 %
8%
International competitive tender: Yes/No/DKYes 95% 91% Negotiation/direct purchasing: Yes/No/DKNo 0%
5.4 Is drug registration a prerequisite for government purchases?
Yes/No/Don’t Know Yes

4
2003 Latest WHO
Data 6. MEDICINES FINANCING 6.1 What is the total public or government budget for
medicines in US$ for the most recent year for which data is available?
$ ___________ 16,000,000, Year 2002/3
6.2 Are there guidelines on medicines donations that cover the public sector, the private sector, or non-governmental organisations (NGO)?
Public Sector
Yes/No/DKYes
Private Sector Yes/No/DKNo
NGO Yes/No/DKYes
6.3 Which medicines are free at primary public health facilities:
All medicines are free of charge:
Yes/No/Don’t Know No
No
Malaria medicines are free: Yes/No/Don’t Know Yes Tuberculosis medicines are free: Yes/No/Don’t Know Yes
Sexually transmitted diseases medicines are free: Yes/No/Don’t Know Yes HIV/AIDS-related medicines are free: Yes/No/Don’t Know No
Medicines are free to those who cannot afford them: Yes/No/Don’t Know Yes Medicines are free for children under 5 years of age: Yes/No/Don’t Know Yes
Medicines are free for pregnant women: Yes/No/Don’t Know Yes Medicines are free for elderly persons: Yes/No/Don’t Know No
No medicines are free of charge: (Don’t Know ) 6.4 Which fees are charged in public health facilities:
Registration/Consultation fees: Yes/No/Don’t Know Yes
Dispensing fees: Yes/No/Don’t Know No Flat fees for medicines: Yes/No/Don’t Know Yes
Flat rate copayments: Yes/No/Don’t Know No Percentage copayments:
(Co-payments cover part of the cost of medicines, the other part being paid by an insurer or government.)
Yes/No/Don’t Know No
6.5 Is revenue from fees or drug sales used to pay the salaries of public health personnel in the same facility?
Always/Frequently/Occasionally/Never/DKNever
6.6 Health insurance: (Health insurance is any prepayment scheme for health care costs additional to but excluding subsidies funded through the Ministry of Health budget.) What percentage of the population has health insurance?
Public All/Some/None/DK
None
Private All/Some/None/DK
Don't know
Public
Private
Are medicines covered by health insurance? All/Some/None/DKNone
All/Some/None/DKSome
No Yes
Of the covered medicines, what percentage of the cost is covered:
% 100 %
6.7 Is there a pricing policy on medicines that covers the public sector, the private sector, or non-governmental organisations? If yes, does it apply to:
Public sector
Yes/No/DKNo
Private sector
Yes/No/DKNo
NGO
Yes/No/DKNo
All medicines, some or none: All/Some/None/DK
All/Some/None/DK
All/Some/NoneDK
Is maximum wholesale mark up established in laws/regulations:
Yes/No/DK
Yes/No/DK
Yes/No/DK
If yes, amount: % % % Maximum retail mark up established in laws/regulations: Yes/No/DK
Yes/No/DK Yes/No/DK
If yes, amount: % % % Duty on imported raw pharmaceutical materials: Yes/No/DK
Yes/No/DK Yes/No/DK
Duty on imported finished pharmaceutical products: Yes/No/DK
Yes/No/DK Yes/No/DK
7. ACCESS TO ESSENTIAL MEDICINES

5
2003 Latest WHO
Data 7.1 In your opinion, what percentage of the population has
regular access to essential medicines (i.e. minimum of 20 most essential medicines available and affordable at public and private facilities within a one-hour walking distance)?
30 %
35%
7.2 What percentage of:
The population is within one-hour walking distance to:
Public health facility
50%
Private health facility
70%
Public or private
retail drug outlet 80%
Facilities have essential medicines available: 60% 80% 95% The population can afford essential medicines at: 60% 30% 50%
8. PRODUCTION 8.1 What is the medicines production capability in the
country? Research and development of new active substances:
Yes/No/Don’t Know No
Production of pharmaceutical active starting materials: Yes/No/Don’t Know No Formulation from pharmaceutical starting materials: Yes/No/Don’t Know Yes
Repackaging of finished dosage forms: Yes/No/Don’t Know Yes 8.2 For each of the following types of local production,
indicate number of factories and total annual sales in US$ for the most recent year for which data is available: Starting materials:
Number of factories
None____
Sales in US$
$ ____
Year
Don’t knowDK
Finished products: 34____ $53,000,000____
2002 DK
Products containing active substances developed/marketed for the first time during the last 5 years:
____
$ ____
DK
8.3 What is the total volume and US$ value of the medicines market? Generic medicines compose what percentage of market volume and value?
Volume ____, Value $ ____ Volume ____%, Value ____%
9. RATIONAL USE OF MEDICINES 9.1 Are there standard treatment guidelines (STGs)
produced by the health ministry/department for major conditions? (STGs are recommendations about how to treat a clinical condition.)
National STG:
Yes/No/DKYes
Number of conditions/
diseases ____
Year of publicatio
n or review
2002
Year of publication or
review 1994
STG for hospital level: Yes/No/DKNo ____ STG for primary health care level: Yes/No/DKYes ____
9.2 Is there a National Medicines Formulary manual? (A formulary manual contains summary drug information.) If yes, does it cover only medicines on the Essential Medicines List?
Yes/No/Don’t Know No Yes/No/Don’t Know
What year was it last published/reviewed: Year 9.3 Are any of the following aspects of the essential
medicines concept generally part of the basic curricula in most health training institutions/universities for: (Essential medicines are those that satisfy the priority health care needs of the population. See glossary for a definition of problem-based pharmacotherapy.) Doctors:
Essential Medicines
List
Yes/No/DKYe
Standard Treatment Guidelines
Yes/No/DKYe
Problem-based
pharmaco-therapy
Yes/No/DK
Yes
Rational prescribin
g
Yes/No/DKYes
Yes
Nurses:Yes/No/DKYeYes/No/DKYeYes/No/DKYes
Yes/No/DKYes
Yes
Pharmacists:Yes/No/DKYeYes/No/DKYeYes/No/DKYes
Yes/No/DKYes
Yes
Pharmacy assistants:Yes/No/DKYeYes/No/DKYeYes/No/DKYes
Yes/No/DKYes
Yes

6
2003 Latest WHO
Data Paramedical staff: Yes/No/DKNYes/No/DKNYes/No/DK
Yes Yes/No/DK
Yes
9.4 Are there independent publicly or non-commercially funded obligatory continuing education programs which include use of medicines for: Doctors:
Yes/No/Don’t Know No
Yes
Nurses/midwives/paramedical staff: Yes/No/Don’t Know No Yes
Pharmacists: Yes/No/Don’t Know No Yes Pharmacy aides/assistants: Yes/No/Don’t Know No Yes
9.5 Is there a public or independently funded nationally accessible (e.g. by phone) medicines information centre or service co-ordinated by the Ministry of Health, academia, and/or a non-commercial non-governmental organisation that provides information on demand to: Prescribers:
Yes/No/Don’t Know No
Dispensers: Yes/No/Don’t Know No Consumers: Yes/No/Don’t Know No
9.6 Has there been any public education campaign concerning rational medicines use in the previous two years conducted by Ministry of Health/non-governmental organisation/academia on the following topics: Use of antibiotics:
Yes/No/Don’t Know No
Use of injections: Yes/No/Don’t Know No Other topics/issues: Yes/No/Don’t Know Don't know
9.7 How often do the following personnel prescribe at the primary health care level in the public sector?
Doctors:
Always/Frequently/Occasionally/Never/DKOccasionally
Nurses/midwives/paramedical staff: Always/Frequently/Occasionally/Never/DKFrequently
Pharmacists: Always/Frequently/Occasionally/Never/DKNever
Pharmacy aides/assistants: Always/Frequently/Occasionally/Never/DKNever
Personnel with less than one month formal health training: Always/Frequently/Occasionally/Never/DKNever
9.8 Is there a government department with a specific mandate to promote the rational use of medicines and co-ordinate medicines use policies?
Yes/No/Don’t Know Yes
9.9 What proportion of facilities have a drugs and therapeutics committee? (A drugs and therapeutics committee promotes the safe and effective use of medicines in the facility or area under its jurisdiction) Referral hospitals:
All/Most/Half/Few/None/Don’t Know All
General hospitals: All/Most/Half/Few/None/Don’t Know Few Regions/provinces: All/Most/Half/Few/None/Don’t Know Few
Is there a mandate for drugs and therapeutics committees in the national medicines policy?
Yes/No/Don’t Know Yes
9.10 Is there a national strategy to contain antimicrobial resistance?
Yes/No/Don’t Know Yes
Is there a national reference laboratory to coordinate epidemiological surveillance of antimicrobial resistance?
Yes/No/Don’t Know Yes
Is there a funded national intersectoral task force to coordinate the implementation of interventions to promote appropriate use of antimicrobials and prevent the spread of infection?
Yes/No/Don’t Know No
9.11 Are the following medicines sold over the counter without any prescription? Antibiotics:
Always/Frequently/Occasionally/Never/DKNever

7
2003 Latest WHO
Data Injections: Always/Frequently/Occasionally/Never/D
KNever
10. INTELLECTUAL PROPERTY RIGHTS PROTECTION AND MARKETING AUTHORIZATION (See glossary for definitions of terms used in this section.)
10.1 Is patent protection legally provided for pharmaceutical products? If yes, indicate:
Yes/No/Don’t Know Yes
Year introduced: Type: Process/Product/Both/Don’t Know Both
Duration of patent validity: 17 Years 10.2 Which intellectual property right protection
regime/activities are provided for traditional medical knowledge?
TRIPS:
Yes/No/DKNo
Year introduced
Duration of data
protection
Sui generis regimes: Yes/No/DKNo Digital library: Yes/No/DKNo
National inventory of medicinal plants: Yes/No/DKNo Others: Yes/No/DKNo
None: (DK ) 10.3 TRIPS Agreement (Agreement on Trade Related Aspects of Intellectual Property Rights):
a) Is your country a World Trade Organization Member? If no, skip to 10.4
Yes/No/Don’t Know Yes
b) Has national legislation been modified to implement the TRIPS Agreement? If yes, what year did it go into effect?
Yes/No/Don’t Know Yes Year 2001
c) Is your country availing itself of the transitional period provided by Article 65 of the TRIPS Agreement?
Yes/No/Don’t Know No
d) If your country is a least-developing country (LDC), has it availed itself of the transitional period accorded to LDCs in Article 66 of the TRIPS Agreement?
Yes/No/DK/Country not an LDC
Country not an LDC

10.4 Have parallel importing provisions on pharmaceuticals been incorporated into national legislation? If yes, have these provisions been applied?
Yes/No/DK/Currently being discussed YesYes/No/DK/Currently being discussed No
10.5 Have compulsory licensing provisions for pharmaceuticals been incorporated into national legislation? If yes, under what conditions? National emergency:
Yes/No/DK/Currently being discussed Yes Yes/No/Don’t Know Yes
Public non-commercial use: Yes/No/Don’t Know Yes Remedying anti-competitive practices: Yes/No/Don’t Know No
Other: Yes/No/Don’t Know No 10.6 Are generic pharmaceutical manufacturers allowed to
use patented inventions for the purpose of obtaining marketing approval prior to patent expiration?
Yes/No/DK/Currently being discussed No
COMMENTS ABOUT INDICATORS AND VALUES Item Number Comment
Questionnaire on structures and processes of country pharmaceutical situation Glossary of Terms: Advertisement: A set of activities undertaken to advertise medicines. It is usually targeted to the general public and it is usually limited to over-the-counter medicines. Compulsory licensing: This term is used when the judicial or administrative authority is allowed by law to grant a license, without permission from the holder, on various grounds of general interest (absence of working, public health, economic development, and national defence). “Working” of a patent is the execution of the invention in the country of registration. Co-payments: Co-payments cover part of the cost of medicines, the other part being paid by an insurer or government. Drugs and therapeutics committee: A drugs and therapeutics committee promotes the safe and effective use of medicines in the facility or area under its jurisdiction. Essential Medicines List: An Essential Medicines List is a government-approved selective list of medicines or national reimbursement list. Essential medicines: Essential medicines are those that satisfy the priority health care needs of the population. Generic substitution: The practice of substituting a product, whether marketed under a trade name or generic name, by an equivalent product, usually a cheaper one, containing the same active ingredient(s). Health insurance: Health insurance is any prepayment scheme for health care costs additional to but excluding subsidies funded through the Ministry of Health budget. The purpose of question 6.6 is to identify how much protection the population has against exposure to the cost of medicines at the time people are sick. Prepaid financing is the usual method for providing such protection. Public funding through the (prepaid) Ministry of Health budget is the most widespread form of prepayment. Question 6.5 attempts to identify

additional prepayment protection (percentage of the population covered and degree of protection against medicine costs) such as private or employer-based health insurance, community prepayments schemes, social health insurance (health care funded through social security systems), etc. Herbal Medicines: Herbal medicines are plant-derived material or preparations with therapeutic or other human health benefits, which contain either raw or processed ingredients from one or more plants. Herbal medicines include herbs, herbal materials, herbal preparations and finished herbal products, which are classified in the medicines category according to a national regulatory framework. Finished herbal products and mixture herbal products may contain excipients in addition to the active ingredients, however, finished products or mixture products to which chemically defined active substances have been added, including synthetic compounds and/or isolated constituents from herbal materials, are not considered to be herbal. In some countries, herbal medicines may also contain, by tradition, natural organic or inorganic active ingredients which are not of plant origin. Licensing: Licensing is a system that subjects all premises to evaluation against a set of requirements before a specific activity (e.g. manufacturing, storage etc.) is authorised to take place. Medicines formulary manual: A formulary manual contains summary drug information. National medicines (drug) policy (NMP): A national medicines policies is an expression of the government’s goals and priorities for the medium to long term for the pharmaceutical sector. It also identifies the main strategies for attaining them. It provides a framework within which the activities of the pharmaceutical sector can be coordinated. It covers both the public and private sectors, and involves all the main actors in the pharmaceutical field. Parallel importing: Parallel importation is importation, without the consent of the patent-holder, of a patented product marketed in another country either by the patent-holder or with the patent-holder’s consent. Parallel importation enables promotion of competition for the patented product by allowing importation of equivalent patented products marketed at lower prices in other countries. Problem-based pharmacotherapy: Problem-based pharmacotherapy is a problem-based practical approach to teaching prescribing. Promotion: A set of activities undertaken to promote prescription of prescription-only medicines. It is usually targeted to health providers only and it is usually forbidden to target the general public. Registered products: Products that have been evaluated for quality, safety and efficacy and thence authorised for marketing. Registration system: A system that subjects all products to evaluation of quality, safety and efficacy before they are authorised for marketing. Standard Treatment Guidelines (STG): STGs are recommendations about how to treat a clinical condition. Tender: Tender is the process by which competing bids are entered for a particular contract. Traditional medical knowledge: Knowledge related to traditional medicine (see definition of Traditional medicine and complementary/alternative medicine). Traditional medicine and complementary/alternative medicine (TM/CAM): Traditional medicine is the sum total of the knowledge, skills, and practices based on theories, beliefs and experiences indigenous to different cultures, whether explicable or not, used in the maintenance of health as well as in prevention, diagnosis, improvement or treatment of physical and mental illnesses. The terms “complementary medicine” and “alternative medicine” can be used interchangeably with “traditional medicine” in some countries. The term “complementary and alternative medicine” can also be used to refer to a broad set of health care practices that are not part of the country’s own tradition and are not integrated into the dominant health care system. Transitional period: TRIPS provides transitional periods during which countries are required to bring their national legislation and practices into conformity with its provisions. The latest dates for WTO Members were/are: 1996 for developed countries; 2000 for developing countries (as a general rule); 2005 for developing countries who had not introduced patents before joining the WTO; and 2006 for least-developed countries (extended to 2016 by the Doha Declaration). The TRIPS Agreement specifically recognizes the economic, financial, administrative and technological constraints of the least-developed countries. It therefore provides the possibility for further extension of the transitional period. TRIPS Agreement (Agreement on Trade Related Aspects of Intellectual Property Rights) Article 65: Transitional Arrangements 1. Subject to the provisions of paragraphs 2, 3 and 4, no Member shall be obliged to apply the provisions of this Agreement before the expiry of a general period of one year following the date✸ of entry into force of the WTO Agreement. 2. A developing country Member is entitled to delay for a further period of four years the date of application, as defined in paragraph 1, of the provisions of this Agreement other than Articles 3, 4 and 5. 3. Any other Member which is in the process of transformation from a centrally-planned into a market, free-enterprise economy and which is undertaking structural reform of its intellectual property system and facing

special problems in the preparation and implementation of intellectual property laws and regulations, may also benefit from a period of delay as foreseen in paragraph 2. 4. To the extent that a developing country Member is obliged by this Agreement to extend product patent protection to areas of technology not so protectable in its territory on the general date of application of this Agreement for that Member, as defined in paragraph 2, it may delay the application of the provisions on product patents of Section 5 of Part II to such areas of technology for an additional period of five years. 5. A Member availing itself of a transitional period under paragraphs 1, 2, 3 or 4 shall ensure that any changes in its laws, regulations and practice made during that period do not result in a lesser degree of consistency with the provisions of this Agreement. Article 66: Least-Developed Country Members 1. In view of the special needs an requirements of least-developed country Members, their economic, financial and administrative constraints, and their need for flexibility to create a viable technological base, such Members shall not be required to apply the provisions of this Agreement, other that Articles 3, 4 and 5, for a period of 10 years from the date of application as defined under paragraph 1 of Article 65. The Council for TRIPS shall, upon duly motivated request by a least-developed country Member, accord extensions of this period. 2. Developed country Members shall provide incentives to enterprises and institutions in their territories for the purpose of promoting and encouraging technology transfer to least-developed country Members in order to enable them to create a sound and viable technological base. ✸ [WIPO note] January 1, 1995