a 50-year record of nox and so2 sources in precipitation in the northern rocky mountains, usa
TRANSCRIPT
RESEARCH ARTICLE Open Access
A 50-year record of NOx and SO2 sources inprecipitation in the Northern Rocky Mountains, USADavid L Naftz1*, Paul F Schuster2, Craig A Johnson3
Abstract
Ice-core samples from Upper Fremont Glacier (UFG), Wyoming, were used as proxy records for the chemicalcomposition of atmospheric deposition. Results of analysis of the ice-core samples for stable isotopes of nitrogen(δ15N, NO−
3 ) and sulfur (δ34S, SO2−4 ), as well as NO−
3 and SO2−4 deposition rates from the late-1940s thru the
early-1990s, were used to enhance and extend existing National Atmospheric Deposition Program/National TrendsNetwork (NADP/NTN) data in western Wyoming. The most enriched δ34S value in the UFG ice-core samplescoincided with snow deposited during the 1980 eruption of Mt. St. Helens, Washington. The remaining δ34S valueswere similar to the isotopic composition of coal from southern Wyoming. The δ15N values in ice-core samplesrepresenting a similar period of snow deposition were negative, ranging from -5.9 to -3.2 ‰ and all fall within theδ15N values expected from vehicle emissions. Ice-core nitrate and sulfate deposition data reflect the sharplyincreasing U.S. emissions data from 1950 to the mid-1970s.
IntroductionThe chemical quality of snowfall deposited in high-eleva-tion areas in the Rocky Mountain region can be affectedby energy generation and associated population growth[1,2]. High elevation areas in the Wind River Range(WRR) of Wyoming (figure 1) exceed 4 km above sealevel and are adjacent to areas of accelerating energydevelopment [3]. For example, over 3,000 natural gaswells are being installed in the Green River Basin, directlywest of the WRR. Full development of the Jonah gas fieldcould result in the production of 1,480 metric tons/yr ofNOx and 25.7 metric tons/yr of SO2 [3].Thin soils and dilute surface-water systems in high-
elevation areas have limited capacities to bufferincreased acidity associated with the airborne contami-nants of NOx and SO2. Trends in precipitation chemis-try at NADP/NTN sites in the western United Stateshave indicated an increase in total N deposition and a
decrease in SO2−4 deposition from 1981-1998 [4]. In
addition to monitoring trends in N and S deposition,the isotopic composition of snow, firn, and ice has beenused to differentiate natural and anthropogenic solute
sources. Stable isotope ratios of sulfur in SO2−4 ,
expressed as δ34S, were monitored in bulk snowpacksamples collected from a network of 52 high-elevationsites in the Rocky Mountains from 1993 to 1999 [5].The δ34S values indicated that snowpack S in high-ele-vation areas is primarily derived from anthropogenicsources [5].Changes in δ34S values in firn and ice-core samples
have been used to reconstruct changes in sulfate sourcesto central Asia, Greenland, and Antarctica. The variationin δ34S values in a firn core from central Asia allowedfor the identification of S derived from marine evapor-ites (+15 ‰) during high dust deposition events andanthropogenic emissions (+5.4 ‰) [6]. Preindustrial δ34Ssignatures in Greenland ice cores were comprised ofmarine biogenic emissions, continental dust sources,background volcanism, and continental biota [7]. Begin-ning in 1870 A.D., δ34S signatures in the ice-core sam-ples indicated anthropogenic S sources.In Antarctica, shallow firn cores collected from the
South Pole contained δ34S values that were used to con-firm and contrast the different S isotopic signals betweenthe low-latitude Agunge volcanic eruption in 1963 andbackground marine biogenic sulfate [8]. Composited ice-core samples representing coastal and plateau regions onthe Antarctic ice sheet were found to have similar δ34Svalues over the past 1,100 years, indicative of no temporalchange in influencing sources of S [9]. Values of δ34S in
* Correspondence: [email protected]. Geological Survey, 2329 W. Orton Circle, Salt Lake City, UT 84119, USAFull list of author information is available at the end of the article
Naftz et al. Geochemical Transactions 2011, 12:4http://www.geochemicaltransactions.com/content/12/1/4
© 2011 Naftz et al; licensee Chemistry Central Ltd. This is an Open Access article distributed under the terms of the Creative CommonsAttribution License (http://creativecommons.org/licenses/by/2.0), which permits unrestricted use, distribution, and reproduction inany medium, provided the original work is properly cited
two ice cores from east Antarctica over the complete gla-cial/interglacial cycle were significantly lighter than pre-vious measurements of δ34S from the South Pole [10]. Alikely mechanism for the observed isotopic difference wasRayleigh-type fractionation as S species are oxidized andtransported toward the East Antarctic Plateau [10]. Mea-surements of δ34S values in an ice core collected fromwest Antarctica were found to be a mixture of marineand volcanic S sources during the time period from1935-1976. [11].Stable isotopes have also been used to gain a better
understanding of N sources in atmospheric deposition.Historical records of the isotopic composition of N2O intrapped gases (ice cores) from Greenland and interstitialair (snowpack) from the South Pole have been used todifferentiate between natural and anthropogenic sources[12]. The δ15N value of atmospheric N2O has droppedby 1.7 ‰ during the 20th century, likely due to increas-ing agricultural activities [12]. In support of these mea-surements, simulations of N2O(g) have indicated a -1.8‰ shift in δ15N over the last two centuries, primarilydue to anthropogenic influences [13]. The δ15N of NO−
3in wet deposition from 33 sites in the northeastern Uni-ted States was strongly correlated with the location ofcoal-fired powerplants [14]. Ice-core samples fromGreenland indicated decreasing δ15N (NO−
3 ) valueswith increasing NO−
3 concentrations; however, more
information is needed to confirm this trend and differ-entiate source area vs. post-depositional processes dur-ing the firn-to-ice transition [15]. A more recent ice-core record from Greenland, spanning deposition from1718 to 2006, revealed a clear trend of decreasing δ15N(NO−
3 ) values from 11 ‰ (pre-industrial) to -1 ‰(~1996-2006) [16].Although previous studies have shown that δ15N
(NO−3 ) values of snow and ice samples have excellent
potential for providing information on NO−3 sources,
post-depositional changes in the concentration and iso-
topic composition of NO−3 needs to be considered
[17,18]. Year-round measurement of δ15N (NO−3 ) values
in snow pits from Dome C, Antarctica, indicated strongenrichment relative to atmospheric NO−
3 and loss of
NO−3 mass from the snow surface due to UV-photolysis
[17]. In contrast to the Antarctica results, a similarstudy in Greenland [18] indicated minimal influence of
photolysis on the isotopic composition of δ15N (NO−3 )
in firn and ice. One possible reason for the differentresearch results between the two studies may be thehigher snow accumulation rates at the Greenland studysite [18]. Higher rates of snow accumulation were foundto mitigate the magnitude of post-depositional proces-sing and loss of NO−
3 in the snowpack [19].
Wyoming
WY98
WY06DH-98-4
DH-91-1
WindRiverRange
109O37’30”43O08’15”
43O07’30”Base from U.S. Geological Survey Fremont Peak North, 1:24,000 1993
CONTOUR INTERVAL 12.2 METERS NATIONAL GEODETIC VERTICAL DATUM OF 1929
Upper Fremont Glacier
Wind River Range
0 0.2 KM
109O36’15”
Explanation
DH-91-1 Ice-coring site
WY06 National Atmospheric Deposition Program (NADP) Monitoring site
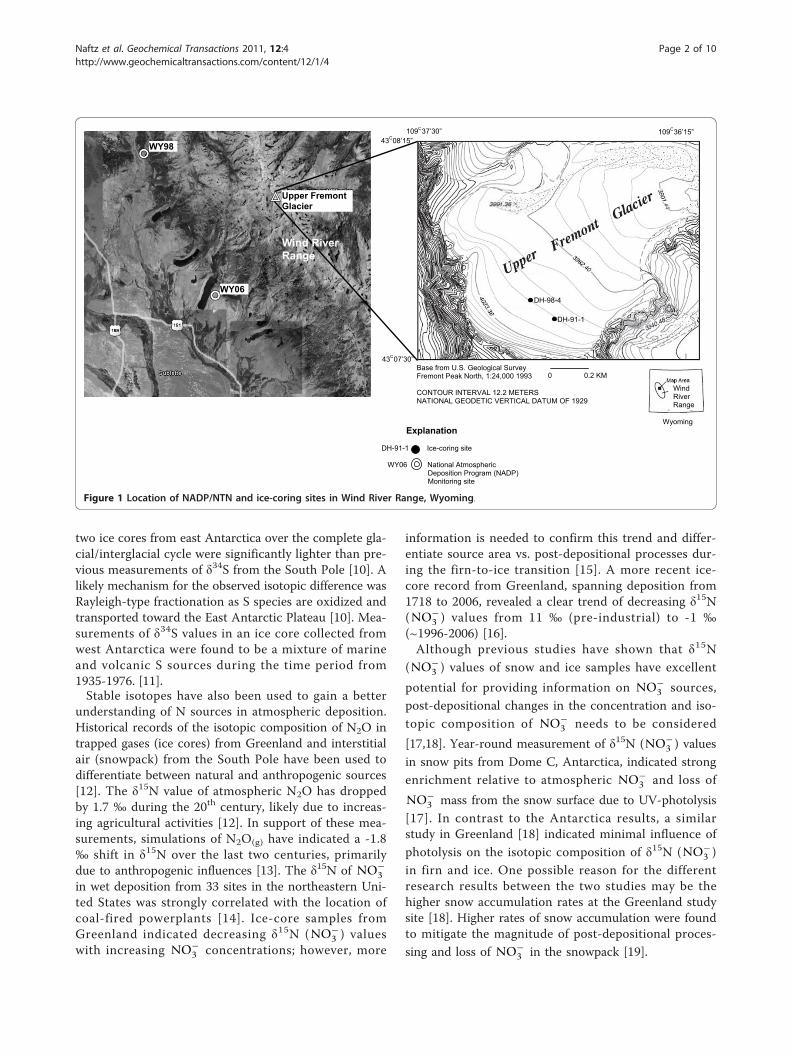
Figure 1 Location of NADP/NTN and ice-coring sites in Wind River Range, Wyoming.
Naftz et al. Geochemical Transactions 2011, 12:4http://www.geochemicaltransactions.com/content/12/1/4
Page 2 of 10
Glaciers present in the high elevation regions of theWRR, Wyoming, present a unique opportunity to coupleshort-term (1980 to present) NADP/NTN data (sitesWY06 and WY98) trends in the chemistry of atmo-spheric deposition with similar and longer term datapreserved in glacial ice from the nearby UFG (figure 1).The UFG is the only glacier within the continental U.S.where ice cores have been documented to containpaleoenvironmental and paleoclimatological records[20-27]. Characteristics present at UFG conducive topreserving paleonvironmental signals include: (1) ice-coring site altitudes that exceed 4 km above sea level(ASL) to minimize meltwater modification of the snowand ice chemistry and (2) large ice thicknesses (rangingfrom 60 to 172 m in the upper half of the glacier) toprovide long-term paleoenvironmental records.Ice cores exceeding 160 m in length were recovered
from UFG in 1991 and 1998 [23,24]. The 1991 ice corewas estimated to contain 250 years of record as deter-mined from carbon-14 dating of an insect leg recoveredfrom near the bottom of the core [23]. This length ofrecord was subsequently confirmed by a higher-resolu-tion chronology established with continuous electricalconductivity measurements [26]. On the basis of thesedata, ice at the bottom of UFG in proximity to the 1991and 1998 drilling sites was likely deposited as snowprior to 1710 AD.The overall objective of this paper is to demonstrate
the effectiveness of using the isotopic composition and
concentration of NO−3 and SO2−
4 in ice-core samples
collected from the UFG to supplement and extend exist-ing NADP/NTN records. Specific objectives are to: (1)determine atmospheric deposition sources since the late
1940s by determining the isotopic values of δ34S (SO2−4 )
and δ15N (NO−3 ) in ice-core samples; (2) reconstruct
changes in SO2−4 and NO−
3 wet deposition rates from
ice-core samples representative of snow deposited fromthe early-1950s to early-1990s; and (3) couple the resultsfrom objectives 1 and 2 with existing NADP/NTNdeposition records and NOX/SO2 emission records toidentify processes controlling long-term trends in theloading of S and N at high-elevation sites.
MethodsFieldIce cores were collected from UFG in 1991 and 1998using a thermal drill as described in [23]. The ice coreswere collected in 1- and 2-m segments. On-site proces-sing of the cores included visual inspection, logging, anddensity determinations by personnel wearing Tyvek suitsand powder-free Latex gloves. The cores were sealed inpolyethylene bags, placed in plastic core tubes, and
stored in snow vaults until removal from the site to afreezer truck via a 10-minute helicopter flight. The UFGice cores are currently archived at the National Ice CoreLaboratory (NICL) in Lakewood, Colorado.
LaboratoryIce-core samples were melted according to strict protocols[21] to minimize sample contamination. Ice cores weresubsampled using a bandsaw frequently cleaned with etha-nol in cold room laboratories at NICL. Multiple core sec-tions from each interval were composited in order toobtain sufficient S and N mass for isotopic analyses. Thesurface ice from each subsample was scraped away with astainless steel microtome. Each ice sample was thoroughlyrinsed with ultrapure (18.0 megaohm) deionized waterand placed in a prerinsed and covered plastic container.Each sample was allowed to melt at room temperature forone hour (or until approximately 15 mL of meltwater hadaccumulated). After this initial melt period the sample wasrinsed in the accumulated meltwater, and the melt wasdiscarded. The remaining sample was allowed to melt inthe covered plastic container at room temperature.For S isotopic analysis, meltwater volumes corre-
sponding to 90-100 micrograms of sulfate (0.5-6 L) wereevaporated to dryness within covered canisters flushedby dry nitrogen. The samples were transferred from 4-LPyrex beakers to smaller Savillex beakers when they hadbeen reduced to about 100 mL. Drydown salts wereredissolved in a few mL of deionized water which waspipetted into tin capsules and evaporated a few hundredmicroliters at a time. One to 2 mg of powdered V2O5
was added and the capsules were pinched closed.Filled capsules were combusted in an elemental analy-
zer to produce SO2 for analysis by isotope ratio monitor-ing using a Micromass Optima [28]. The elementalanalyzer-mass spectrometer system was standardizedusing reference materials previously calibrated againstIAEA-SO-5 and NBS 127 assuming δ34S values for themof -34.05 and 21.1 ‰, respectively [29]. To evaluate accu-racy, synthetic Ca2+-Na+-K+ solutions were preparedwith reagents of known isotopic composition and thendried and analyzed. Sodium-dominated solutions gaveδ34S values indistinguishable from the reagents used toprepare them; however, solutions with Na+:Ca2+ ratiosequivalent to the UFG samples were about 1 ‰ low. Thecause of this inaccuracy is uncertain. No attempt wasmade to correct the UFG measurements for a possiblesimilar inaccuracy. The S isotopic compositions arereported in δ-notation relative to Vienna Canon Diablotroilite. Reproducibility for triplicate analysis of sampleISO-1 was ±0.4 ‰ (one standard deviation).For N isotopic analysis, meltwater volumes correspond-
ing to 1.2 micrograms of nitrate (6-80 mL) were
Naftz et al. Geochemical Transactions 2011, 12:4http://www.geochemicaltransactions.com/content/12/1/4
Page 3 of 10
evaporated to <5 mL by the same method used for sulfur.Nitrous oxide (N2O) was produced by the denitrifiermethod using the Pseudomonas chlororaphis bacterium(ATCC 43928) [30,31], and the isotope ratios were mea-sured using a ThermoFinnigan Delta Plus XL equippedwith an autosampler and gas bench device. To calibratethe measurements and correct for media blanks, aliquotsof the reference materials USGS32 KNO3 (δ
15N = 180 ‰),USGS34 KNO3 (δ15N = -1.8 ‰), and USGS35 NaNO3
(δ15N = 2.7 ‰) were analyzed along with the unknowns.Because the NO−
3 in UFG samples is atmospheric in
origin, it is likely to contain excess 17O (commonlyexpressed as values of Δ17O greater than zero) [32]. Forsingle bacterium experiments like those carried out in thisstudy, excess 17O leads to δ15N results that are erroneouslyhigh by 1 ‰ per 18.8 ‰ increase in Δ17O [33]. Our δ15Ndeterminations for USGS35, which has a Δ17O value of21.1 ‰, showed an error corresponding to 1 ‰ per 18.3‰ increase in Δ17O. The highest Δ17O values that havebeen observed to date in modern and ancient atmosphericnitrate are 39 and 20 ‰, respectively [34-36], and theresults of a global model for the modern atmosphere sug-gest that Δ17O of atmospheric nitrate is unlikely to exceedabout 30 ‰ in the western United States [37]. If the NO−
3
in UFG samples has Δ17O values of 30 ‰ or lower, theerror in our δ15N results is no more than 1.6 ‰. The Nisotopic compositions are reported in δ-notation relativeto atmospheric N2(g). Reproducibility for triplicate analysisof USGS34 was ±0.27‰ (one standard deviation).After filtration with 0.45 μm disposable polysulfone fil-
ters, a modified ion chromatography procedure for lowionic strength samples was used for the analysis of NO−
3
and SO2−4 [38]. A Dionex DX-120 was configured with a
250 μL loop to increase instrument sensitivity. Ten per-cent of each sample batch consisted of quality controlstandards. Seven-point calibration curves covering therange of solutes being measured were run daily. Eachbatch contained sets of blanks (18.2 megaohm deionizedwater) and a series of USGS standard water referencesamples (SRWS) at intervals of approximately every 10ice-core samples. SRWS and blanks were monitored dur-ing sample runs. If the SRWS were not within 10% ofexpected values or the blanks were above detection lim-its, the sample run results were rejected and repeated.All chemical data from the ice-core analyses can be
found in additional file 1.
Results and DiscussionIce-core chronologyTritium, chloride-36, and carbon-14 age-dating methods[23,39] were combined with the timing of major volca-nic eruption signals that were evident in the core [26] to
establish an ice-core chronology. The polynomial fit forthe age-depth profile in the ice core [26] was deter-mined to be
Age (in years) = 0.00739(D)2 + 0.5558(D) (1)
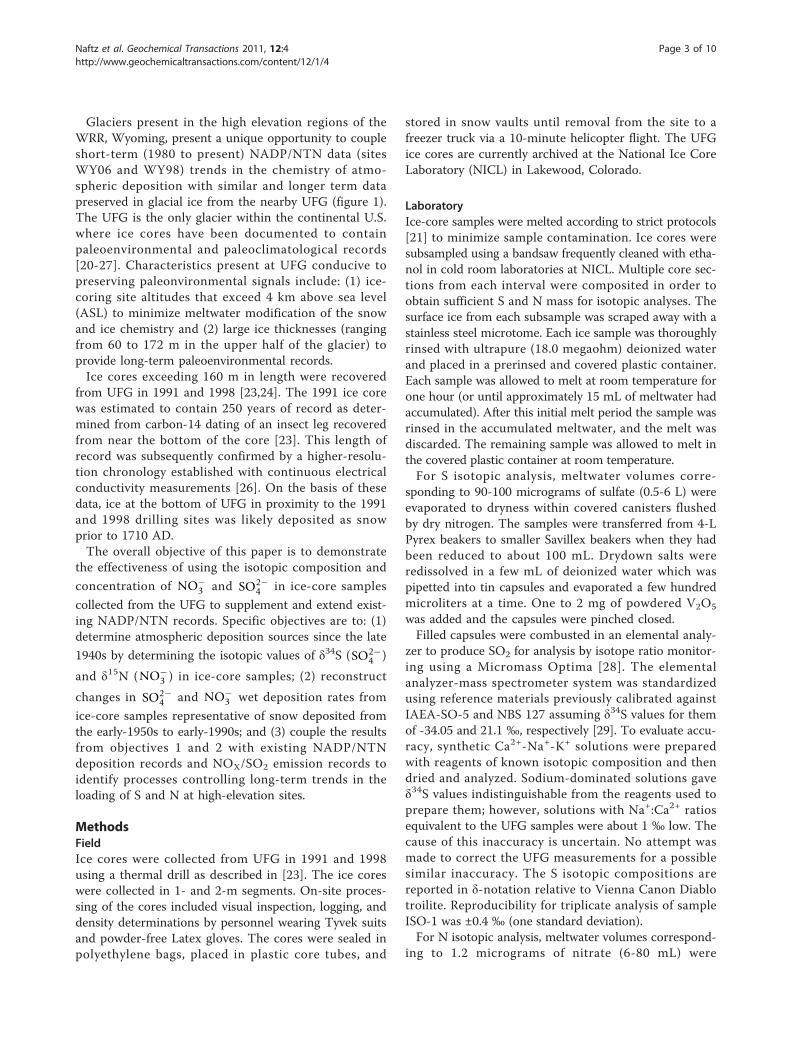
where D is depth below glacier surface, in m. Thisage-depth profile is in excellent agreement with knowntime horizons in the ice core that include (1) 1963 tri-tium and 1958 chloride-36 peaks from above-groundnuclear testing; (2) 1883 Krakatau volcanic eruption; (3)1815 Tambora volcanic eruption; and (4) 1729 (± 95years) carbon-14 age date of an insect leg entrapped inthe ice (figure 2).
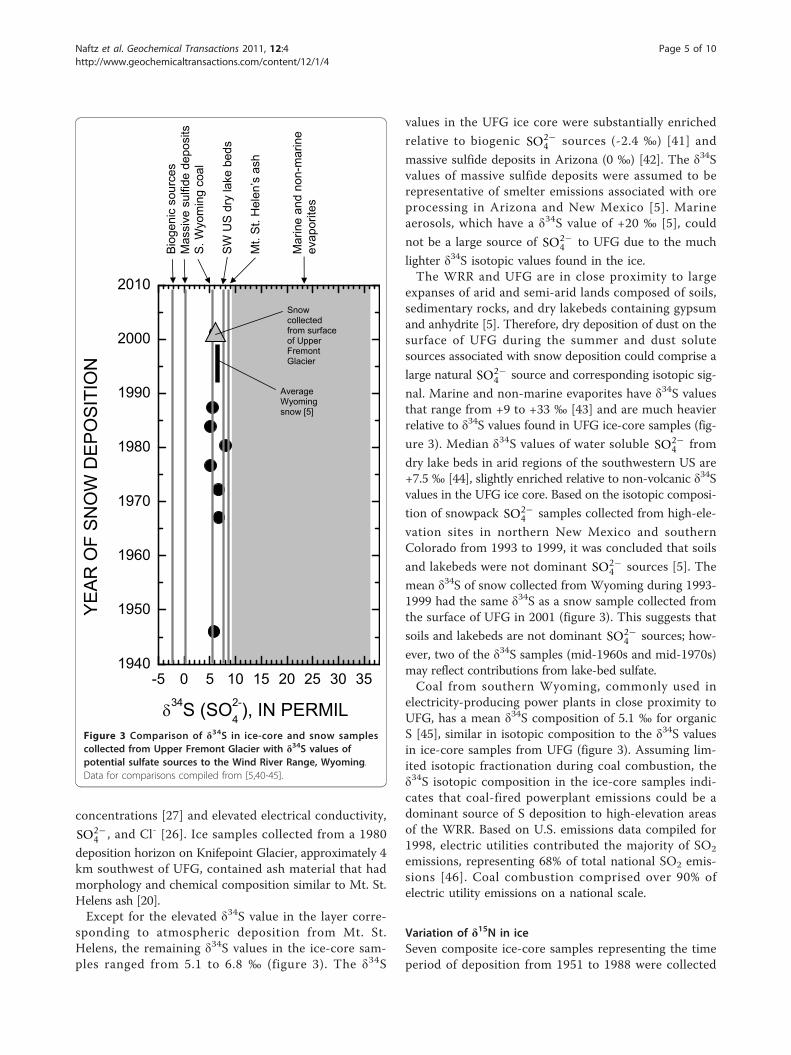
Variation of δ34S in iceSeven composite ice-core samples and one snow samplecollected from UFG were analyzed for δ34S (figure 3). Theice-core samples represent a time period from approxi-mately 1946 to 1988 and δ34S values in the ice rangedfrom 5.1 to 8.1 ‰. Sulfate in snow and corresponding gla-cier ice can be derived from a variety of natural andanthropogenic sources such as sea-salt aerosols, biogenicemissions, entrained dust particles, fossil fuel combustion,and metal smelting. Volcanic eruptions can also provide
an intermittent short-term source of atmospheric SO2−4 .
The highest δ34S value in the UFG ice-core samples wasassociated with snow deposited primarily during 1980,coinciding with the eruption of Mt. St. Helens, Washing-ton, during May 1980. Comparison of the δ34S value inthe ice core (8.1 ‰) with a mean δ34S value of volcanicash from the 1980 eruption of Mt. St. Helens (8.3 ‰) [40]indicates a similar isotopic composition. Correspondinggeochemical signatures of the 1980 Mt. St. Helens volcaniceruption in the UFG ice-core samples include elevated Hg
Figure 2 Plot of reported volcanic events and isotopic agedates used to generate a polynomial fit for an age-depthprofile of the Upper Fremont Glacier ice core collected in 1991[26], Wind River Range, Wyoming. A slightly modified age-depthprofile was developed for the 1998 ice core (DH-98-4) to accountfor the additional snow deposited between 1991 and 1998.
Naftz et al. Geochemical Transactions 2011, 12:4http://www.geochemicaltransactions.com/content/12/1/4
Page 4 of 10
concentrations [27] and elevated electrical conductivity,
SO2−4 , and Cl- [26]. Ice samples collected from a 1980
deposition horizon on Knifepoint Glacier, approximately 4km southwest of UFG, contained ash material that hadmorphology and chemical composition similar to Mt. St.Helens ash [20].Except for the elevated δ34S value in the layer corre-
sponding to atmospheric deposition from Mt. St.Helens, the remaining δ34S values in the ice-core sam-ples ranged from 5.1 to 6.8 ‰ (figure 3). The δ34S
values in the UFG ice core were substantially enriched
relative to biogenic SO2−4 sources (-2.4 ‰) [41] and
massive sulfide deposits in Arizona (0 ‰) [42]. The δ34Svalues of massive sulfide deposits were assumed to berepresentative of smelter emissions associated with oreprocessing in Arizona and New Mexico [5]. Marineaerosols, which have a δ34S value of +20 ‰ [5], could
not be a large source of SO2−4 to UFG due to the much
lighter δ34S isotopic values found in the ice.The WRR and UFG are in close proximity to large
expanses of arid and semi-arid lands composed of soils,sedimentary rocks, and dry lakebeds containing gypsumand anhydrite [5]. Therefore, dry deposition of dust on thesurface of UFG during the summer and dust solutesources associated with snow deposition could comprise a
large natural SO2−4 source and corresponding isotopic sig-
nal. Marine and non-marine evaporites have δ34S valuesthat range from +9 to +33 ‰ [43] and are much heavierrelative to δ34S values found in UFG ice-core samples (fig-
ure 3). Median δ34S values of water soluble SO2−4 from
dry lake beds in arid regions of the southwestern US are+7.5 ‰ [44], slightly enriched relative to non-volcanic δ34Svalues in the UFG ice core. Based on the isotopic composi-
tion of snowpack SO2−4 samples collected from high-ele-
vation sites in northern New Mexico and southernColorado from 1993 to 1999, it was concluded that soils
and lakebeds were not dominant SO2−4 sources [5]. The
mean δ34S of snow collected from Wyoming during 1993-1999 had the same δ34S as a snow sample collected fromthe surface of UFG in 2001 (figure 3). This suggests that
soils and lakebeds are not dominant SO2−4 sources; how-
ever, two of the δ34S samples (mid-1960s and mid-1970s)may reflect contributions from lake-bed sulfate.Coal from southern Wyoming, commonly used in
electricity-producing power plants in close proximity toUFG, has a mean δ34S composition of 5.1 ‰ for organicS [45], similar in isotopic composition to the δ34S valuesin ice-core samples from UFG (figure 3). Assuming lim-ited isotopic fractionation during coal combustion, theδ34S isotopic composition in the ice-core samples indi-cates that coal-fired powerplant emissions could be adominant source of S deposition to high-elevation areasof the WRR. Based on U.S. emissions data compiled for1998, electric utilities contributed the majority of SO2
emissions, representing 68% of total national SO2 emis-sions [46]. Coal combustion comprised over 90% ofelectric utility emissions on a national scale.
Variation of δ15N in iceSeven composite ice-core samples representing the timeperiod of deposition from 1951 to 1988 were collected
1940
1950
1960
1970
1980
1990
2000
2010
-5 0 5 10 15 20 25 30 3534S (SO2-
4 ), IN PERMIL
YEAR
OF
SNO
W D
EPO
SITI
ON
Snow collected from surface of Upper Fremont Glacier
Average Wyoming snow [5]
Bio
geni
c so
urce
s M
assi
ve s
ulfid
e de
posi
tsS
. Wyo
min
g co
al
SW
US
dry
lake
bed
s
Mt.
St.
Hel
en’s
ash
Mar
ine
and
non-
mar
ine
evap
orite
s
Figure 3 Comparison of δ34S in ice-core and snow samplescollected from Upper Fremont Glacier with δ34S values ofpotential sulfate sources to the Wind River Range, Wyoming.Data for comparisons compiled from [5,40-45].
Naftz et al. Geochemical Transactions 2011, 12:4http://www.geochemicaltransactions.com/content/12/1/4
Page 5 of 10
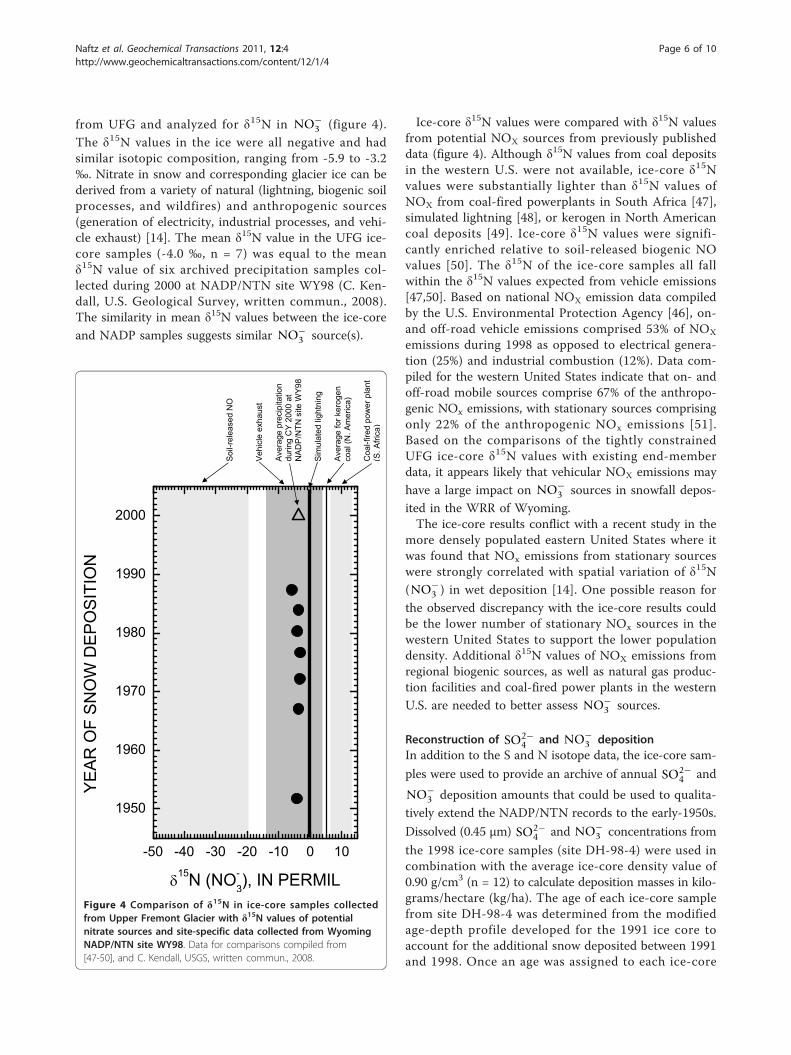
from UFG and analyzed for δ15N in NO−3 (figure 4).
The δ15N values in the ice were all negative and hadsimilar isotopic composition, ranging from -5.9 to -3.2‰. Nitrate in snow and corresponding glacier ice can bederived from a variety of natural (lightning, biogenic soilprocesses, and wildfires) and anthropogenic sources(generation of electricity, industrial processes, and vehi-cle exhaust) [14]. The mean δ15N value in the UFG ice-core samples (-4.0 ‰, n = 7) was equal to the meanδ15N value of six archived precipitation samples col-lected during 2000 at NADP/NTN site WY98 (C. Ken-dall, U.S. Geological Survey, written commun., 2008).The similarity in mean δ15N values between the ice-coreand NADP samples suggests similar NO−
3 source(s).
Ice-core δ15N values were compared with δ15N valuesfrom potential NOX sources from previously publisheddata (figure 4). Although δ15N values from coal depositsin the western U.S. were not available, ice-core δ15Nvalues were substantially lighter than δ15N values ofNOX from coal-fired powerplants in South Africa [47],simulated lightning [48], or kerogen in North Americancoal deposits [49]. Ice-core δ15N values were signifi-cantly enriched relative to soil-released biogenic NOvalues [50]. The δ15N of the ice-core samples all fallwithin the δ15N values expected from vehicle emissions[47,50]. Based on national NOX emission data compiledby the U.S. Environmental Protection Agency [46], on-and off-road vehicle emissions comprised 53% of NOX
emissions during 1998 as opposed to electrical genera-tion (25%) and industrial combustion (12%). Data com-piled for the western United States indicate that on- andoff-road mobile sources comprise 67% of the anthropo-genic NOx emissions, with stationary sources comprisingonly 22% of the anthropogenic NOx emissions [51].Based on the comparisons of the tightly constrainedUFG ice-core δ15N values with existing end-memberdata, it appears likely that vehicular NOX emissions may
have a large impact on NO−3 sources in snowfall depos-
ited in the WRR of Wyoming.The ice-core results conflict with a recent study in the
more densely populated eastern United States where itwas found that NOx emissions from stationary sourceswere strongly correlated with spatial variation of δ15N(NO−
3 ) in wet deposition [14]. One possible reason for
the observed discrepancy with the ice-core results couldbe the lower number of stationary NOx sources in thewestern United States to support the lower populationdensity. Additional δ15N values of NOX emissions fromregional biogenic sources, as well as natural gas produc-tion facilities and coal-fired power plants in the westernU.S. are needed to better assess NO−
3 sources.
Reconstruction of SO2−4 and NO−
3 depositionIn addition to the S and N isotope data, the ice-core sam-
ples were used to provide an archive of annual SO2−4 and
NO−3 deposition amounts that could be used to qualita-
tively extend the NADP/NTN records to the early-1950s.
Dissolved (0.45 μm) SO2−4 and NO−
3 concentrations from
the 1998 ice-core samples (site DH-98-4) were used incombination with the average ice-core density value of0.90 g/cm3 (n = 12) to calculate deposition masses in kilo-grams/hectare (kg/ha). The age of each ice-core samplefrom site DH-98-4 was determined from the modifiedage-depth profile developed for the 1991 ice core toaccount for the additional snow deposited between 1991and 1998. Once an age was assigned to each ice-core
Soi
l-rel
ease
d N
O
Veh
icle
exh
aust
Ave
rage
pre
cipi
tatio
n du
ring
CY
200
0 at
N
AD
P/N
TN s
ite W
Y98
Sim
ulat
ed li
ghtn
ing
Ave
rage
for k
erog
en
coal
(N. A
mer
ica)
Coa
l-fire
d po
wer
pla
nt
(S. A
frica
)
1950
1960
1970
1980
1990
2000
-50 -40 -30 -20 -10 0 1015N (NO-
3), IN PERMIL
YEAR
OF
SNO
W D
EPO
SITI
ON
Figure 4 Comparison of δ15N in ice-core samples collectedfrom Upper Fremont Glacier with δ15N values of potentialnitrate sources and site-specific data collected from WyomingNADP/NTN site WY98. Data for comparisons compiled from[47-50], and C. Kendall, USGS, written commun., 2008.
Naftz et al. Geochemical Transactions 2011, 12:4http://www.geochemicaltransactions.com/content/12/1/4
Page 6 of 10
sample, the SO2−4 and NO−
3 masses from the same year
were summed to represent an annual deposition mass thatcould be directly compared to the NADP/NTN deposition
data from sites WY06 and WY98 [52]. Annual SO2−4 and
NO−3 masses in kg/ha were calculated for snow deposited
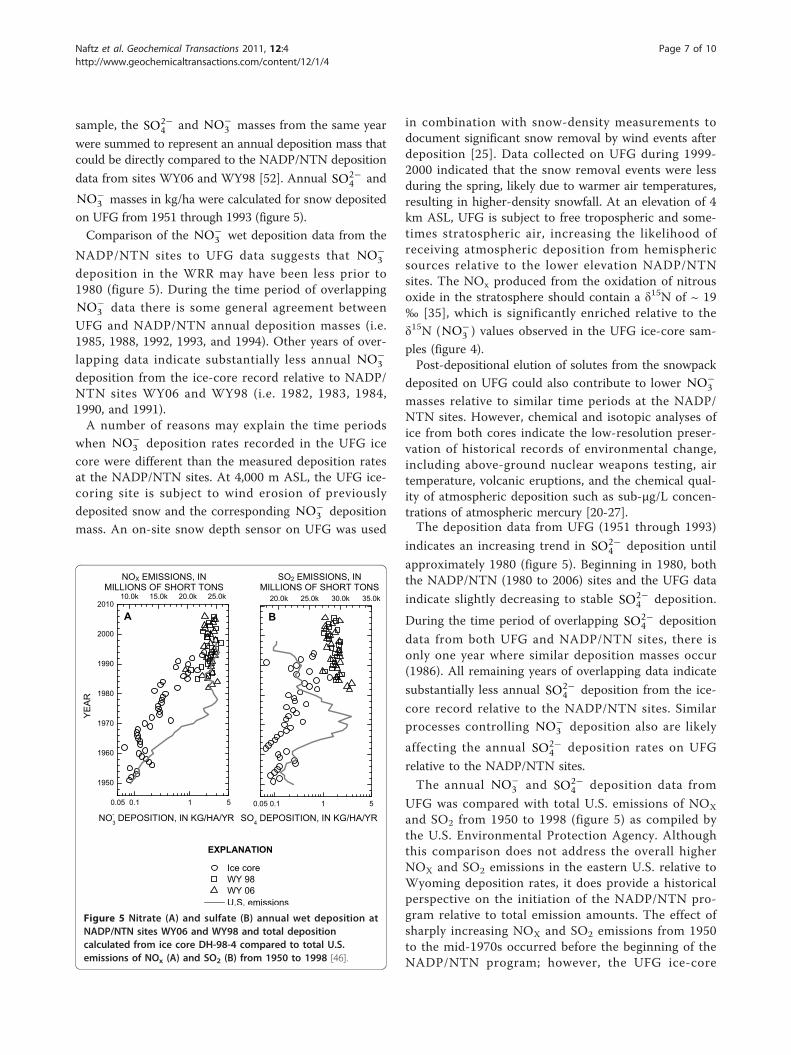
on UFG from 1951 through 1993 (figure 5).Comparison of the NO−
3 wet deposition data from the
NADP/NTN sites to UFG data suggests that NO−3
deposition in the WRR may have been less prior to1980 (figure 5). During the time period of overlappingNO−
3 data there is some general agreement betweenUFG and NADP/NTN annual deposition masses (i.e.1985, 1988, 1992, 1993, and 1994). Other years of over-
lapping data indicate substantially less annual NO−3
deposition from the ice-core record relative to NADP/NTN sites WY06 and WY98 (i.e. 1982, 1983, 1984,1990, and 1991).A number of reasons may explain the time periods
when NO−3 deposition rates recorded in the UFG ice
core were different than the measured deposition ratesat the NADP/NTN sites. At 4,000 m ASL, the UFG ice-coring site is subject to wind erosion of previously
deposited snow and the corresponding NO−3 deposition
mass. An on-site snow depth sensor on UFG was used
in combination with snow-density measurements todocument significant snow removal by wind events afterdeposition [25]. Data collected on UFG during 1999-2000 indicated that the snow removal events were lessduring the spring, likely due to warmer air temperatures,resulting in higher-density snowfall. At an elevation of 4km ASL, UFG is subject to free tropospheric and some-times stratospheric air, increasing the likelihood ofreceiving atmospheric deposition from hemisphericsources relative to the lower elevation NADP/NTNsites. The NOx produced from the oxidation of nitrousoxide in the stratosphere should contain a δ15N of ~ 19‰ [35], which is significantly enriched relative to theδ15N (NO−
3 ) values observed in the UFG ice-core sam-
ples (figure 4).Post-depositional elution of solutes from the snowpack
deposited on UFG could also contribute to lower NO−3
masses relative to similar time periods at the NADP/NTN sites. However, chemical and isotopic analyses ofice from both cores indicate the low-resolution preser-vation of historical records of environmental change,including above-ground nuclear weapons testing, airtemperature, volcanic eruptions, and the chemical qual-ity of atmospheric deposition such as sub-μg/L concen-trations of atmospheric mercury [20-27].The deposition data from UFG (1951 through 1993)
indicates an increasing trend in SO2−4 deposition until
approximately 1980 (figure 5). Beginning in 1980, boththe NADP/NTN (1980 to 2006) sites and the UFG data
indicate slightly decreasing to stable SO2−4 deposition.
During the time period of overlapping SO2−4 deposition
data from both UFG and NADP/NTN sites, there isonly one year where similar deposition masses occur(1986). All remaining years of overlapping data indicate
substantially less annual SO2−4 deposition from the ice-
core record relative to the NADP/NTN sites. Similarprocesses controlling NO−
3 deposition also are likely
affecting the annual SO2−4 deposition rates on UFG
relative to the NADP/NTN sites.
The annual NO−3 and SO2−
4 deposition data from
UFG was compared with total U.S. emissions of NOX
and SO2 from 1950 to 1998 (figure 5) as compiled bythe U.S. Environmental Protection Agency. Althoughthis comparison does not address the overall higherNOX and SO2 emissions in the eastern U.S. relative toWyoming deposition rates, it does provide a historicalperspective on the initiation of the NADP/NTN pro-gram relative to total emission amounts. The effect ofsharply increasing NOX and SO2 emissions from 1950to the mid-1970s occurred before the beginning of theNADP/NTN program; however, the UFG ice-core
0.05 0.1 1 5
20.0k 25.0k 30.0k 35.0k
SO4 DEPOSITION, IN KG/HA/YR
0.05 0.1 1 5
1950
1960
1970
1980
1990
2000
201010.0k 15.0k 20.0k 25.0k
YEAR
NO-3 DEPOSITION, IN KG/HA/YR
Ice core WY 98 WY 06 U.S. emissions
MILLIONS OF SHORT TONS NOX EMISSIONS, IN SO2 EMISSIONS, IN
MILLIONS OF SHORT TONS
EXPLANATION
A B
Figure 5 Nitrate (A) and sulfate (B) annual wet deposition atNADP/NTN sites WY06 and WY98 and total depositioncalculated from ice core DH-98-4 compared to total U.S.emissions of NOx (A) and SO2 (B) from 1950 to 1998 [46].
Naftz et al. Geochemical Transactions 2011, 12:4http://www.geochemicaltransactions.com/content/12/1/4
Page 7 of 10
samples provide a record of the NO−3 and SO2−
4
deposition effects during this time of increasing emis-sions (figure 5). Although post-depositional elution pro-
cesses may have decreased the total NO−3 and SO2−
4
masses, the trends in deposition from 1950 to the mid-1970s appear to reflect the sharply increasing U.S. emis-sions data during this same time period. The NADP/NTN program sites in Wyoming were initiated after thepeak national SO2 emissions in 1973 and substantiallysmaller annual NOX emissions after 1978. The decreasein U.S. SO2 emissions after the early-1970s is notreflected by the UFG ice-core data (figure 5).
Given the observed increase in SO2−4 and NO−
3 deposi-
tion in the UFG ice-core samples since the mid-1940s, it isunclear why no distinctive temporal trend in the isotopiccomposition is observed during the same time period.
This may suggest that most of the SO2−4 and NO−
3
deposition to the WRR since the mid-1940s has beendominated by anthropogenic inputs from a commonsource and any increases in deposition amounts containsimilar isotopic signatures. Additional reasons for the lackof an isotopic trend could include: (1) limited period ofrecord starting after the existence of anthropogenic inputs;(2) large sample composites for isotope samples coveringmultiple years of deposition that mask finer scale trends
evident in the SO2−4 and NO−
3 deposition data; (3) vary-
ing deposition amounts from local, regional, and globalsources; and (4) isotopic fractionation from postdeposi-tional processes in the firn and ice. Additional studies areneeded to assess the impact of postdepostional processes
on the preservation of δ34S (SO2−4 ) and δ15N (NO−
3 )
values at the UFG coring site. Recent work at the Summitsite, Greenland, found a potentially minimal influence of
photolysis on the isotopic composition of NO−3 in firn
and ice, in part due to high accumulation rates [18].Isotopic analyses from other sections of the UFG ice
core (including pre-industrial) would provide additionalinsight into the existence of isotopic trends. Unfortunately,
the low concentration of NO−3 and SO2−
4 combined with
an insufficient amount of ice-core samples representingatmospheric deposition prior to ~ 1945 does not allow forsufficient sample mass to support S and N isotopic ana-lyses. Despite this short-coming, results from these ice-core data provide insight to the long-term wet deposition
of NO−3 and SO2−
4 in pristine areas of the western United
States that were previously not available.
SummaryGlaciers in the WRR present a unique opportunity tocouple short-term (1980 to present) NADP/NTN data
trends in the chemistry of atmospheric deposition withlonger-term data, including stable isotope data, pre-served in glacial ice. The δ34S values in seven ice-coresamples representing snowfall deposited from approxi-mately 1946 to 1988 were similar, ranging from 5.1 to8.1 ‰. The highest δ34S value in the UFG ice-core sam-ples was associated with snow deposited primarily dur-ing 1980 and coincident with the eruption of Mt. St.Helens, Washington, during May 1980. The measuredδ34S value of 8.1 ‰ in the ice core was in close agree-ment with the mean δ34S value of 8.3 ‰ of volcanic ashfrom the 1980 eruption. The remaining δ34S values fromice-core samples were substantially enriched relative to
biogenic SO2−4 sources and slightly depleted relative to
δ34S values of water-soluble SO2−4 from dry lake beds in
arid regions of the southwestern United States. Coalused in power plants in close proximity to UFG wassimilar in δ34S isotopic composition suggesting thatpower plant emissions may be a dominant source of Sdeposition to the WRR.The mean δ15N value in the UFG ice-core samples
(-4.0 ‰, n = 7) was equal to the mean δ15N value of sixarchived precipitation samples collected during 2000 atNADP/NTN site WY98, suggesting similar NO−
3 source
(s). Ice-core δ15N values were substantially depletedrelative to δ15N values of NOX from coal-fired power-plants, North American kerogen deposits, or simulatedlightning and were substantially enriched relative tosoil-released N. The ice-core samples were similar inisotopic composition to δ15N values measured fromvehicle emissions. This similarity in isotopic composi-tion is consistent with NOX emission data compiled forthe U.S. during 1998 that indicates vehicle emissions asthe dominant source of NOX.
Comparison of NO−3 and SO2−
4 wet deposition data
from the NADP/NTN sites to UFG data suggests anincreasing trend in annual deposition from 1950 to theinstallation of the NADP/NTN sites in western Wyom-ing during the early-1980s. Post-depositional elution
processes may have decreased the total NO−3 and SO2−
4
masses preserved in UFG ice-core samples; however, theice-core deposition data reflect the sharply increasing U.S. emissions from 1950 to the mid-1970s. Integration ofthe UFG ice-core data with the existing NADP/NTNdata provides a longer-term, yet more qualitative, histor-ical perspective on atmospheric deposition in the WRR.
Additional material
Additional file 1: Supporting data. Isotopic and anion data used in thestudy
Naftz et al. Geochemical Transactions 2011, 12:4http://www.geochemicaltransactions.com/content/12/1/4
Page 8 of 10
AcknowledgementsUse of brand names in this article is for identification purposes only and doesnot constitute endorsement by the USGS. Funding for this study was providedby the USGS and National Atmospheric Deposition/National Trends Network.Analytical assistance by Craig A. Stricker and Cayce A. Gulbransen during theisotopic analyses is greatly appreciated. The sharing of isotopic data derivedfrom monitoring sites in Wyoming by Carol Kendall is gratefully acknowledged.The manuscript was improved substantially from technical reviews by PhilipGardner and Anthony Ranalli (U.S. Geological Survey), Tyler Cruickshank (UtahDepartment of Environmental Quality), and two anonymous reviewers.
Author details1U.S. Geological Survey, 2329 W. Orton Circle, Salt Lake City, UT 84119, USA.2U.S. Geological Survey, 3215 Marine Street, Suite E-127, Boulder, CO 80303,USA. 3U.S. Geological Survey, Denver Federal Center, MS 963, Denver, CO80225, USA.
Authors’ contributionsDN conceived the study, designed and coordinated study execution,assisted with sample processing, and drafted the manuscript. PS assisted inthe design and execution of the study, assisted with sample processing,carried out the anion analyses, and assisted with the interpretation of thedata. CJ carried out the isotopic analyses and provided assistance in draftingthe manuscript. All authors read and approved the final manuscript.
Competing interestsThe authors declare that they have no competing interests.
Received: 8 January 2010 Accepted: 7 March 2011Published: 7 March 2011
References1. Fenn M, Haeuber R, Tonnesen G, Baron J, Grossman-Clarke S, Hope D,
Jaffe D, Copeland S, Geiser L, Rueth H, Sickman J: Nitrogen emissions,deposition, and monitoring in the western United States. BioScience2003, 53:391-403.
2. Ingersoll G, Mast M, Nanus L, Handran H, Manthorne D, Hultstrand D: RockyMountain snowpack chemistry at selected sites. US Geological SurveyOpen-File Report 2007-1045 2007, 15.
3. Bureau of Land Management: Jonah infill drilling project, finalEnvironmental Impact Statement. [http://www.blm.gov/wy/st/en/info/NEPA/documents/pfo/jonah.html], accessed February 2011.
4. Nilles M, Conley B: Changes in the chemistry of precipitation in theUnited States, 1981-1998. Water Air Soil Pollut 2001, 130:409-414.
5. Mast M, Turk J, Ingersoll G, Clow D, Kester C: Use of stable isotopes toidentify sources of sulfate in Rocky Mountain snowpacks. Atmos Environ2001, 35:3303-3313.
6. Kruetz K, Sholkovitz E: Major element, rare earth element, and sulfurisotopic composition of a high elevation firn core: Sources and transportof mineral dust in central Asia. Geochem Geophys Geosyst 1 2000, Papernumber 2000GC000082.
7. Patris N, Delmas R, Legrand M, Angelis M, Ferron F, Stievenard M, Jouzel J:First sulfur isotope measurements in central Greenland ice cores alongthe preindustrial and industrial periods. J Geophys Res 2002,107:4115-4120.
8. Patris D, Delmas R, Jouzel J: Isotopic signatures of sulfur in shallowAntarctic ice cores. J Geophys Res 2002, 105:7071-7078.
9. Jonsell U, Hansson M, Morth C, Torssander P: Sulfur isotopic signals in twoshallow ice cores from Dronning Maud Land, Antarctica. Tellus 2005,57B:341-350.
10. Alexander B, Thiemens M, Farquhar J, Kaufman A, Savarino J, Delmas R: EastAntarctic ice core sulfur isotope measurements over a complete glacial-interglacial cycle. J Geophys Res 2003, 108:4786-4793.
11. Pruett L, Kruetz K, Wadleigh M, Mayewski P, Kurbatov A: Sulfur isotopicmeasurements from a West Antarctic ice core: Implications for sulfatesource and transport. Ann Glac 2004, 39:161-168.
12. Sowers T, Rodebaugh A, Yoshida N, Toyoda S: Extending records of theisotopic composition of the atmospheric N2O back to 1800 A.D. from airtrapped in snow at the South Pole and the Greenland Ice Sheet ProjectII ice core. Global Biogeochem Cycles 2002, 16:1129-1138.
13. Rahn T, Wahlen M: A reassessment of the global isotopic budget ofatmospheric nitrous oxide. Global Biogeochem Cycles 2000, 14:537-543.
14. Elliott E, Kendall C, Wankel S, Burns D, Boyer E, Harlin K, Bain D, Butler T:Nitrogen isotopes as indicators of NOx source contributions toatmospheric nitrate deposition across the midwestern and northeasternUnited States. Environ Sci Technol 2007, 41:7661-7667.
15. Freyer H, Kobel K, Delmas R, Kley D, Legrand M: First results of 15N/14Nratios in nitrate from alpine and polar cores. Tellus Ser B 1996, 48B:93-105.
16. Hastings M, Jarvis J, Steig E: Anthropogenic impacts on nitrogen isotopesof ice-core nitrate. Science 2009, 324:1288.
17. Frey M, Savarino J, Morin S, Erbland J, Martins J: Photolysis imprint in thenitrate stable isotope signal in snow and atmosphere of East Antarcticaand implications for reactive nitrogen cycling. Atmos Chem 2009,9:8681-8696.
18. Jarvis J, Hastings M, Steig E, Kunasek S: Isotopic ratios in gas-phase HNO3
at Summit, Greenland. J Geophys Res 2009, 114:17301-17314.19. Rothlisberger R, Hutterli M, Wolff E, Mulvaney R, Fischer H, Bigler M, Goto-
Azuma K, Hansson M, Ruth U, Siggaard-Andersen M, Steffensen J: Nitrate inGreenland and Antarctica ice cores: a detailed description ofpostdepositional processes. Ann Glaciol 2002, 35:209-216.
20. Naftz D, Rice J, Ranville J: Glacial-ice composition–A potential long-termrecord of the chemistry of atmospheric deposition, Wind River Range,Wyoming. Water Resour Res 1991, 27:1231-1238.
21. Naftz D: Ice-core records of the chemical quality of atmosphericdeposition and climate from mid-latitude glaciers, Wind River Range,Wyoming. Colorado School of Mines Golden, Colorado; 1993, Ph.D. thesis.
22. Naftz D, Schuster P, Reddy M: Assessment of spatial variability of major-ion concentrations and δ18O values in surface snow, Upper FremontGlacier, Wyoming, U.S.A. Nordic Hydrology 1994, 25:371-388.
23. Naftz D, Klusman R, Michel R, Schuster P, Reddy M, Taylor H, Yanosky T,McConnaughey E: Little Ice Age evidence from a south-central NorthAmerican ice core, U.S.A. Arct Alp Res 1996, 28:35-41.
24. Naftz D, Susong D, Schuster P, Cecil L, Dettinger M, Michel R, Kendall C: Ice-core evidence of rapid air temperature increases since 1960 in alpineareas of the Wind River Range, Wyoming, United States. J Geophys Res2002, 107:4171-4186.
25. Naftz D, Susong D, Cecil L, Schuster P: Variations between δ18O inrecently deposited snow and onsite air temperature, Upper FremontGlacier, Wyoming. In Earth Paleoenvironments: Records Preserved in Mid- andLow-Latitude Glaciers. Volume 9. Edited by: Cecil L, Green J, Thompson L.Kluwer Academic Publishers, New York; 2004:217-234.
26. Schuster P, White D, Naftz D, Cecil L: Chronological refinement of an icecore record at upper Fremont Glacier in south central North America. JGeophys Res 2000, 105:4657-4666.
27. Schuster P, Krabbenhoft D, Naftz D, Cecil L, Olson M, Dewild J, Susong D,Green J: Atmospheric mercury deposition during the last 270 years: Aglacial ice core of natural and anthropogenic sources. Environ Sci Technol2002, 36:2303-2310.
28. Giesemann A, Jager H, Norman A, Krouse H, Brand W: On-line sulfurisotope determination using an elemental analyzer coupled to a massspectrometer. Anal Chem 1994, 66:2816-2819.
29. Coplen T, Hopple J, Bohlke J, Peiser H, Rieder S, Krouse H, Rosman K,Ding T, Vocke R, Revesz K, Lamberty A, Taylor P, De Bievre P: Compilationof minimum and maximum isotope ratios of selected elements innaturally occurring terrestrial materials and reagents. 2002, 98, U.S.Geological Survey Water-Resources Investigations Report 01-4222.
30. Sigman D, Casciotti K, Andreani M, Barford C, Galanter M, Bohlke J: Abacterial method for the nitrogen isotopic analysis of nitrate in seawaterand freshwater. Anal Chem 2001, 73:4145-4153.
31. Casciotti K, Sigman D, Hastings M, Bohlke J, Hikert A: Measurement of theoxygen isotopic composition of nitrate in seawater and freshwater usingthe denitrifier method. Anal Chem 2002, 74:4905-4912.
32. Michalski G, Scott Z, Kabiling M, Thiemens M: First measurements andmodeling of δ17O in atmospheric nitrate. Geophys Res Lett 2003,30:1870-1873.
33. Coplen T, Bohlke J, Casciotti K: Using dual-bacterial denitrification toimprove δ15N determinations of nitrates containing mass-independent17O. Rapid Commun Mass Spectrom 2004, 18:245-250.
34. Michalski G, Bohlke J, Thiemens M: Long term atmospheric deposition asthe source of nitrate and other salts in the Atacama Desert, Chile: New
Naftz et al. Geochemical Transactions 2011, 12:4http://www.geochemicaltransactions.com/content/12/1/4
Page 9 of 10
evidence from mass-independent oxygen isotopic compositions.Geochim Cosmochim Acta 2004, 68:4023-4038.
35. Savarino J, Kaiser J, Morin S, Sigman D, Thiemens T: Nitrogen and oxygenisotopic constraints on the origin of atmospheric nitrate in coastalAntarctica. Atmos Chem Phys 2007, 7:1925-1945.
36. Morin S, Savarino J, Frey M, Yan N, Bekki S, Bottenheim J, Martins J: Tracingthe origin and fate of NOx in the Arctic atmosphere using stableisotopes in nitrate. Science 2008, 322:730-732.
37. Alexander B, Hastings M, Allman D, Dachs J, Thornton J, Kunasek S:Quantifying atmospheric nitrate formation pathways based on a globalmodel of the oxygen isotopic composition (Δ17O) of atmosphericnitrate. Atmos Chem Phys 2007, 9:5043-56.
38. Fishman M, Friedman L: Methods for determination of inorganicsubstances in water and fluvial sediments.545, U.S. GeologicalSurvey Techniques of Water-Resources Investigations 1989, Book 5,Chap. A1.
39. Cecil L, Vogt S: Identification of bomb-produced chlorine-36 in mid-latitude glacial ice of North America. Nucl Instrum Methods Phys Res, Sect B1997, 123:287-289.
40. Bindeman I, Eiler J, Wing B, Farquhar J: Rare sulfur and triple oxygenisotope geochemistry of volcanogenic sulfate aerosols. GeochimCosmochim Acta 2007, 71:2326-2343.
41. Nriagu J, Holdway D, Coker R: Biogenic sulfur and the acidity of rainfall inremote areas of Canada. Science 1987, 237:1189-1192.
42. Eastoe C, Bustin M, Hurlbut D, Orr R: Sulfur isotopes in Early Proterozoicvolcanogenic massive sulfide deposits - new data from Arizona andimplications for ocean chemistry. Precambrian Res 1990, 46:353-364.
43. Claypool G, Holser W, Kaplan I, Sakai H, Zak I: The age curves of sulfur andoxygen isotopes in marine sulfate and their mutual interpretation. ChemGeol 1980, 28:199-260.
44. Schlesinger W, Peterjohn W: Ion and sulfate-isotope ratios in arid soilssubject to wind erosion in the southwestern USA. Soil Sci Soc Am J 1988,52:54-58.
45. Hackley C, Anderson T: Sulfur isotopic variations in low-sulfur coals fromthe Rocky Mountain region. Geochim Cosmochim Acta 1986, 50:1703-1713.
46. U.S Environmental Protection Agency: National air pollutant emissiontrends, 1900 - 1998. Research Triangle Park, NC; 2000, EPA-454/R-00-002,.
47. Heaton T: 15N/14N ratios of NOx from vehicle engines and coal-firedpower stations. Tellus Ser B 1990, 42B:304-307.
48. Hoering T: The isotopic composition of ammonia and nitrate ion in rain.Geochim Cosmochim Acta 1957, 12:7-102.
49. Boudou J, Schimmelmann A, Ader M, Mastalerz M, Sebilo M, Léon G:Organic nitrogen chemistry during low-grade metamorphism. GeochimCosmochim Acta 2008, 72:1199-1221.
50. Li D, Wang X: Nitrogen isotopic signature of soil-released nitric oxide(NO) after fertilizer application. Atmos Envrion 2008, 42:4747-4754.
51. Fenn M, Haeuber R, Tonnesen G, Baron J, Grossman-Clarke S, Hope D,Jaffe D, Copeland S, Geiser L, Rueth H, Sickman J: Nitrogen emissions,deposition, and monitoring in the western United States. BioScience2003, 53:391-403.
52. National Atmospheric Deposition Program: NADP/NTN wet depositiondata for Wyoming. [http://nadp.sws.uiuc.edu/Default.aspx], accessedFebruary 2011.
doi:10.1186/1467-4866-12-4Cite this article as: Naftz et al.: A 50-year record of NOx and SO2 sourcesin precipitation in the Northern Rocky Mountains, USA. GeochemicalTransactions 2011 12:4.
Submit your next manuscript to BioMed Centraland take full advantage of:
• Convenient online submission
• Thorough peer review
• No space constraints or color figure charges
• Immediate publication on acceptance
• Inclusion in PubMed, CAS, Scopus and Google Scholar
• Research which is freely available for redistribution
Submit your manuscript at www.biomedcentral.com/submit
Naftz et al. Geochemical Transactions 2011, 12:4http://www.geochemicaltransactions.com/content/12/1/4
Page 10 of 10