9.8% of young people said that they were often lonely. · millennials: myths & realities | may...
TRANSCRIPT
26/03/2019
1
IN ASSOCIATION WITH
SUPPORTED BY
Only the lonely
T H E S E C R E T L I F E O F S T U D E N T S
9.8% of young people said that they were often lonely.
“
ONS 2018
1
2
26/03/2019
2
Only the lonely
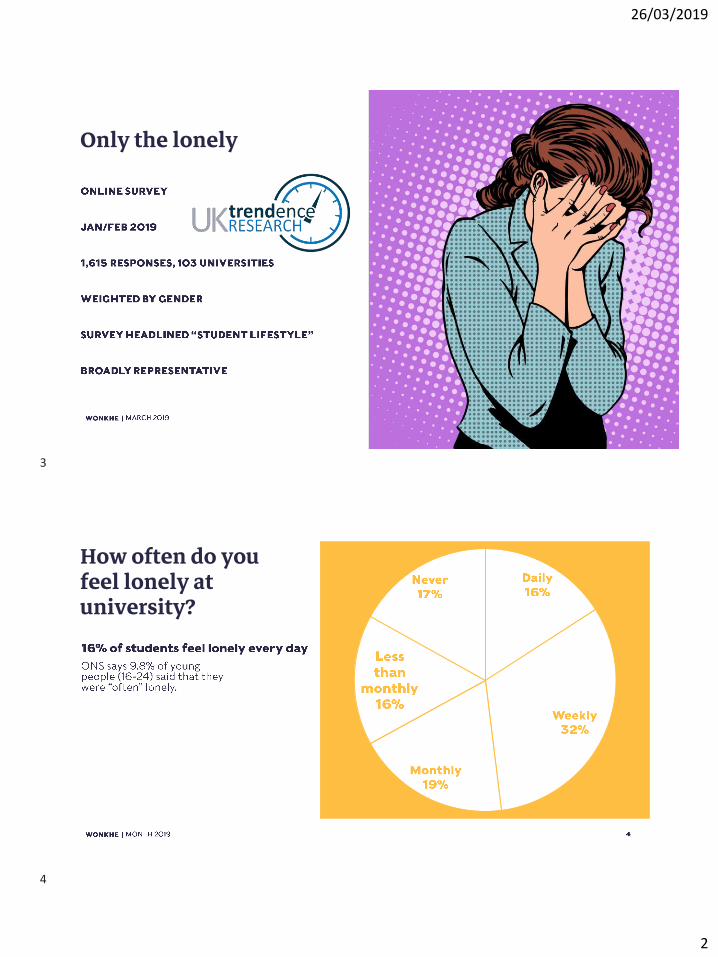
How often do you feel lonely at university?
3
4
26/03/2019
3
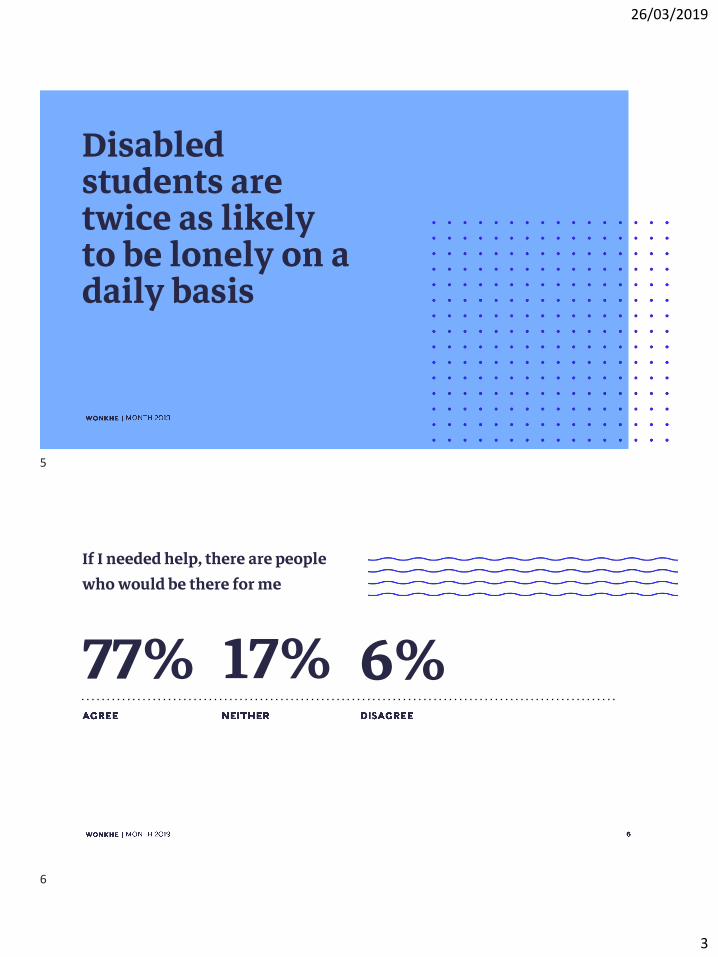
Disabled students are twice as likely to be lonely on a daily basis
If I needed help, there are people who would be there for me
77% 17% 6%
5
6
26/03/2019
4
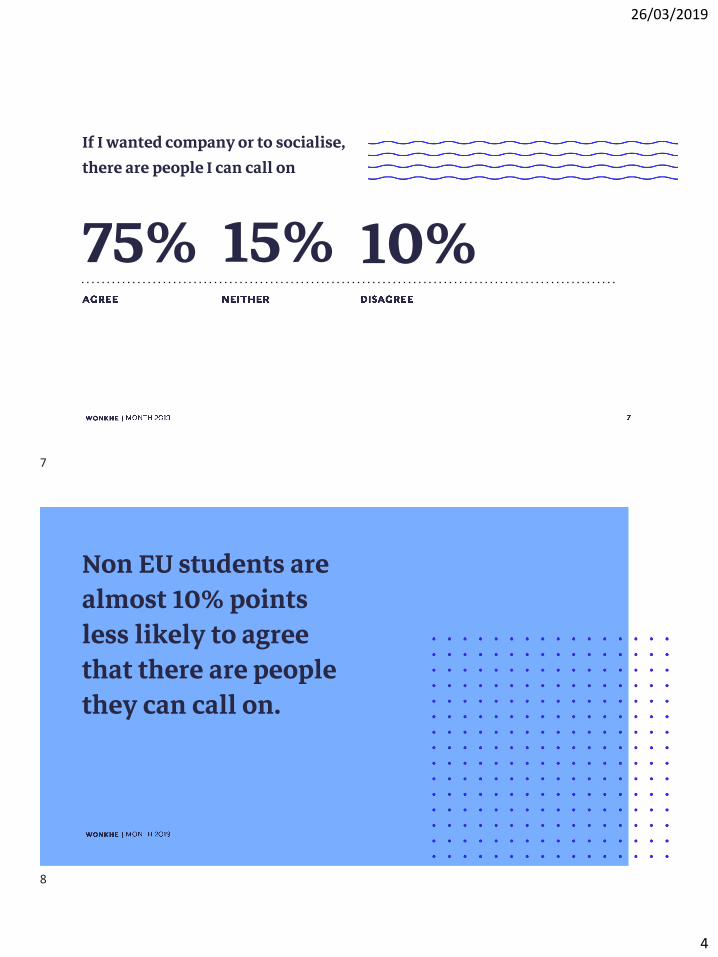
If I wanted company or to socialise, there are people I can call on
75% 15% 10%
Non EU students are almost 10% points less likely to agree that there are people they can call on.
7
8
26/03/2019
5
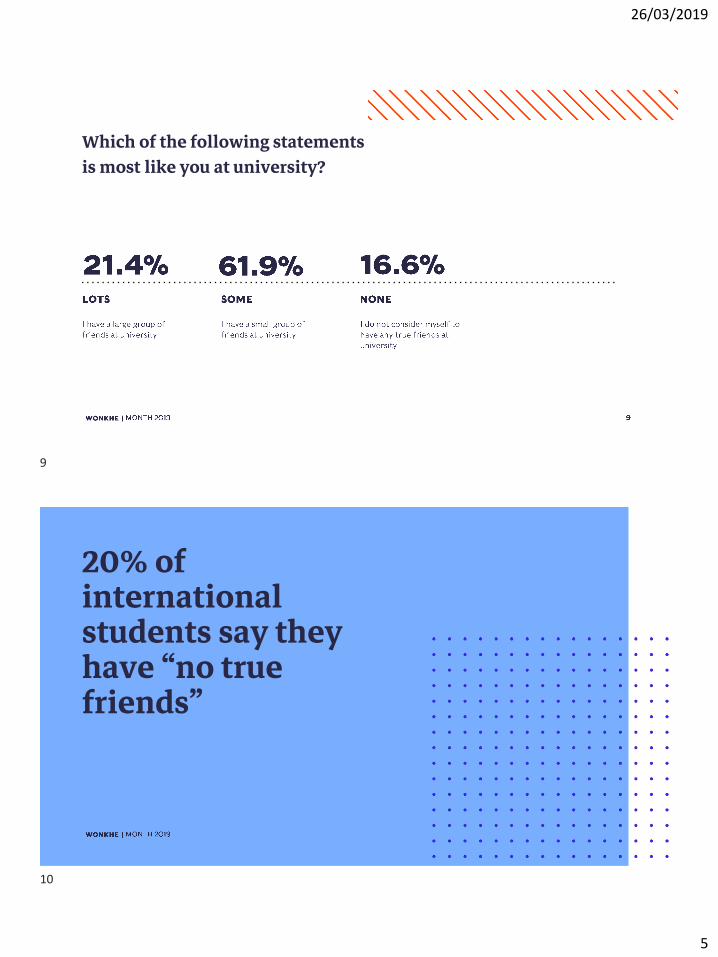
Which of the following statements is most like you at university?
20% of international students say they have “no true friends”
9
10
26/03/2019
6
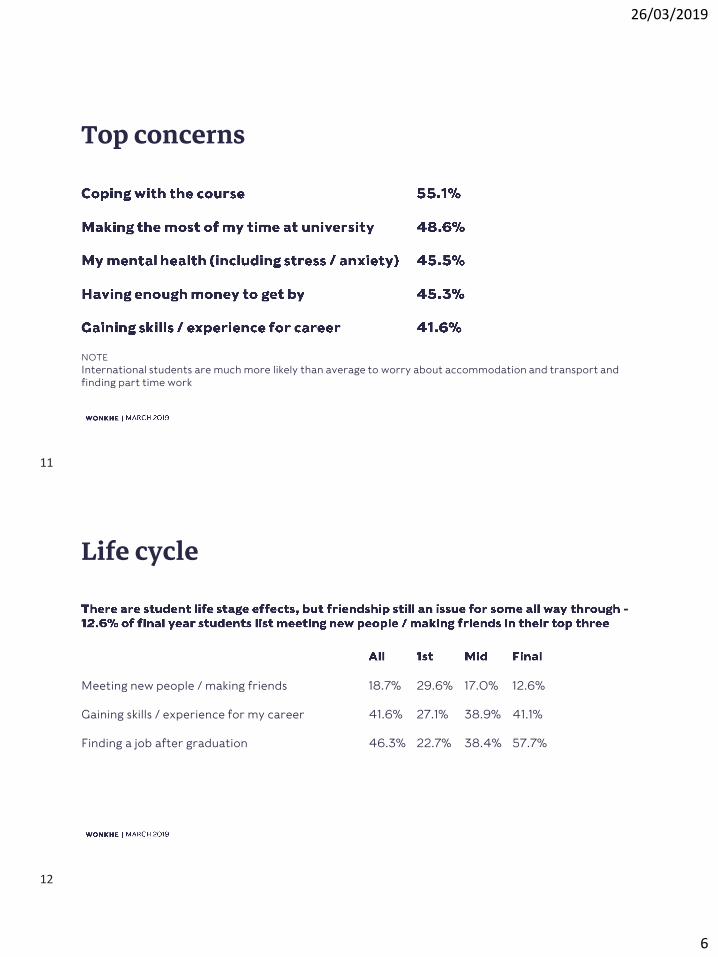
Top concerns
NOTE
International students are much more likely than average to worry about accommodation and transport and finding part time work
Life cycle
Meeting new people / making friends 18.7% 29.6% 17.0% 12.6%
Gaining skills / experience for my career 41.6% 27.1% 38.9% 41.1%
Finding a job after graduation 46.3% 22.7% 38.4% 57.7%
11
12
26/03/2019
7
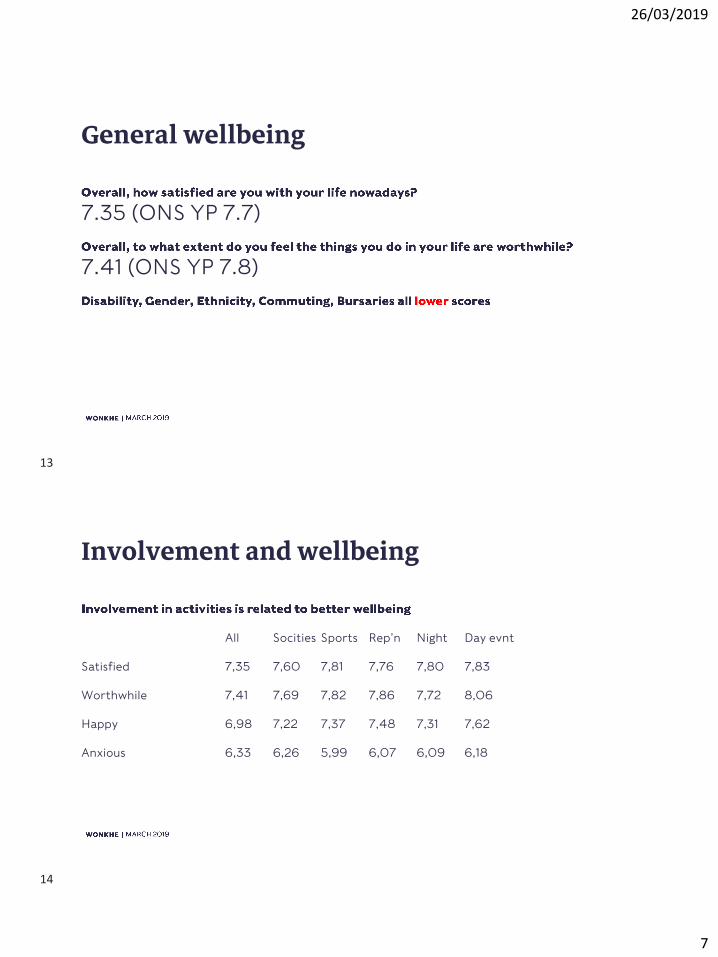
General wellbeing
7.35 (ONS YP 7.7)
7.41 (ONS YP 7.8)
Involvement and wellbeing
All Socities Sports Rep’n Night Day evnt
Satisfied 7,35 7,60 7,81 7,76 7,80 7,83
Worthwhile 7,41 7,69 7,82 7,86 7,72 8,06
Happy 6,98 7,22 7,37 7,48 7,31 7,62
Anxious 6,33 6,26 5,99 6,07 6,09 6,18
13
14

26/03/2019
8
Friendship and involvement
I have a large group of friends 21.4% 29.6% 31.8% 33.2% 34.6% 34.0%
I have a small group of friends 61.9% 62.4% 59.7% 55.8% 60.7% 60.8%
No true friends 16.6% 8.0% 8.5% 11.0% 4.7% 5.2%
Loneliness and mental health
15
16
26/03/2019
9
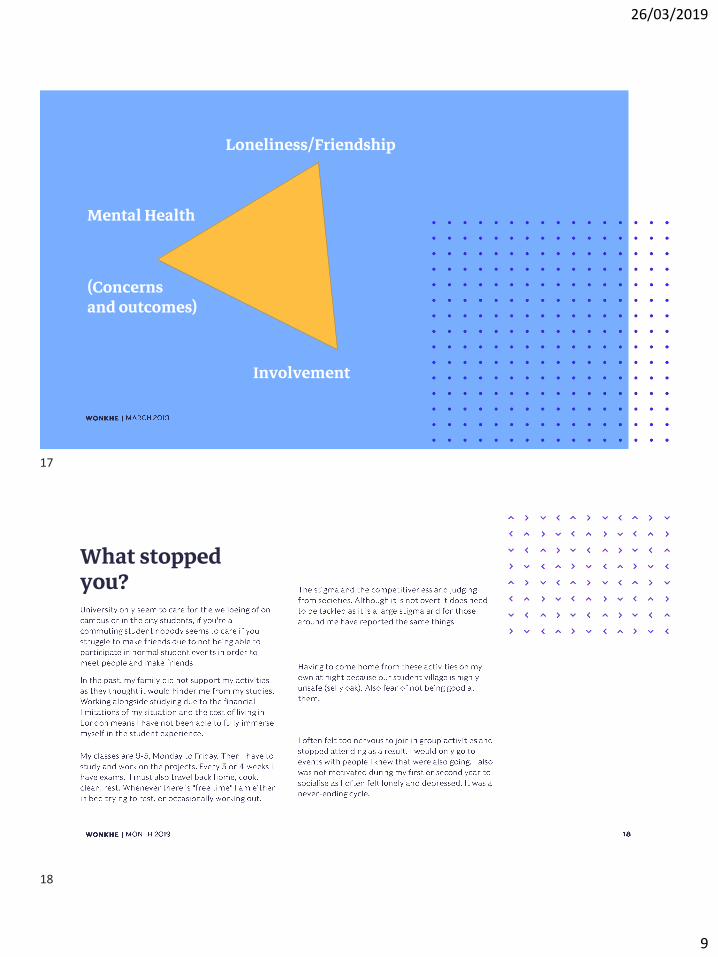
Loneliness/Friendship
Involvement
Mental Health
(Concerns and outcomes)
What stopped you?
17
18
26/03/2019
10
What stopped you?
IN ASSOCIATION WITH
SUPPORTED BY
Generation Z goes to uni
T H E S E C R E T L I F E O F S T U D E N T S
19
20
26/03/2019
11
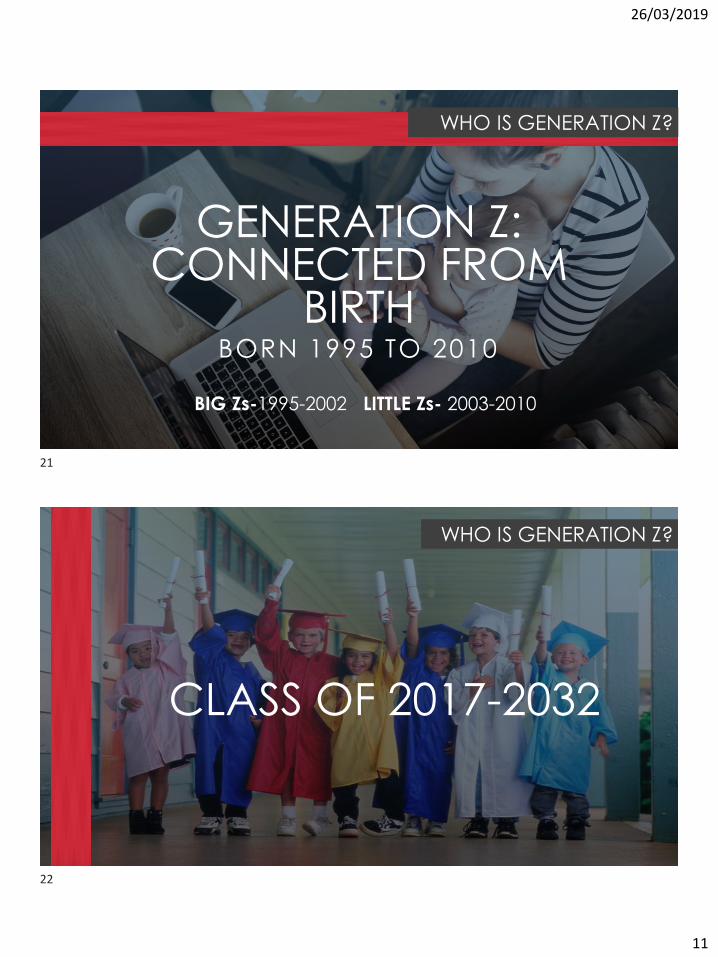
GENERATION Z: CONNECTED FROM
BIRTHBORN 1995 TO 2010
WHO IS GENERATION Z?
BIG Zs-1995-2002 LITTLE Zs- 2003-2010
CLASS OF 2017-2032
WHO IS GENERATION Z?
21
22
26/03/2019
12
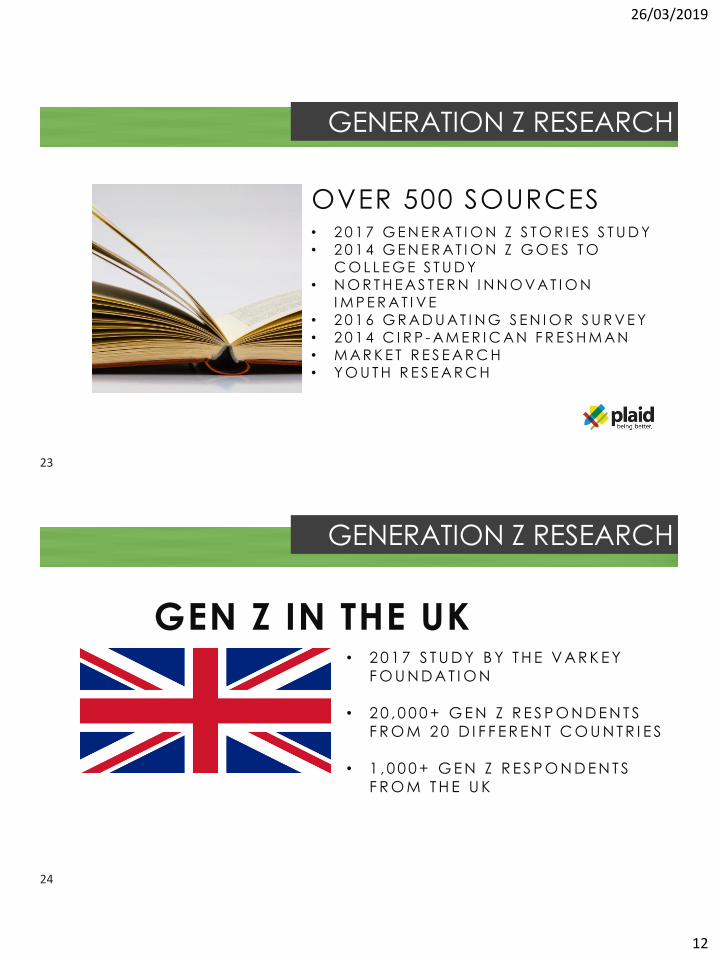
GENERATION Z RESEARCH
OVER 500 SOURCES• 2 0 1 7 G E N E R A T I O N Z S T O R I E S S T U D Y• 2 0 1 4 G E N E R A T I O N Z G O E S T O
C O L L E G E S T U D Y• N O R T H E A S T E R N I N N O V A T I O N
I M P E R A T I V E• 2 0 1 6 G R A D U A T I N G S E N I O R S U R V E Y• 2 0 1 4 C I R P - A M E R I C A N F R E S H M A N• M A R K E T R E S E A R C H• Y O U T H R E S E AR C H
GENERATION Z RESEARCH
GEN Z IN THE UK• 2 0 1 7 S T U D Y B Y T H E V A R K E Y
F O U N D A T I O N
• 2 0 , 0 0 0 + G E N Z R E S P O N D E N T S
F R O M 2 0 D I F F E R E N T C O U N T R I E S
• 1 , 0 0 0 + G E N Z R E S P O N D E N T S
F R O M T H E U K
23
24
26/03/2019
13
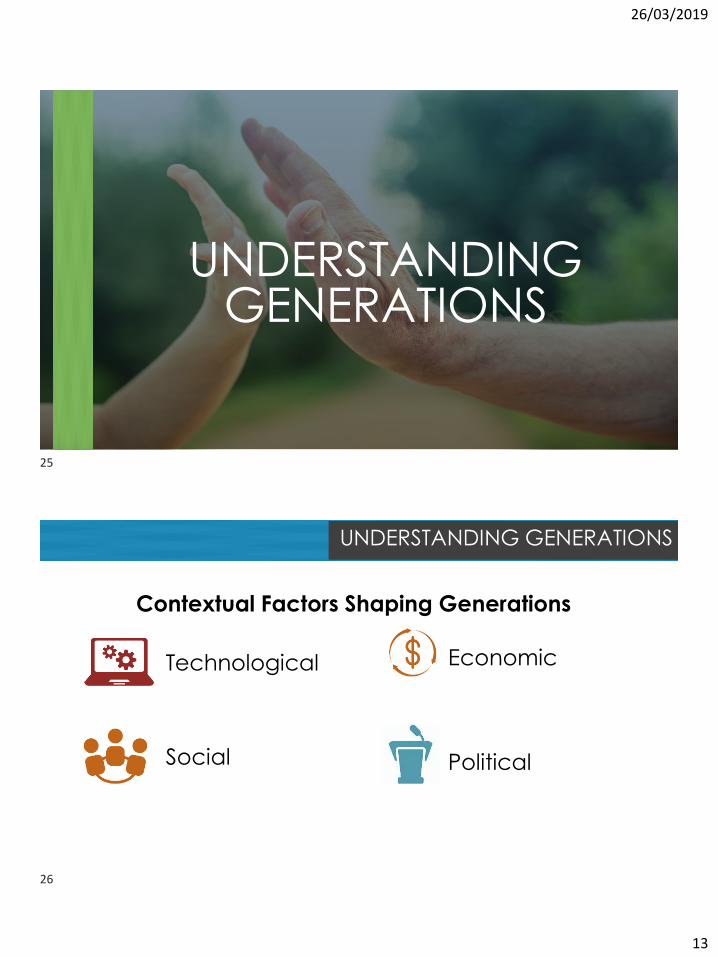
UNDERSTANDING GENERATIONS
UNDERSTANDING GENERATIONS
Technological
Social Political
Economic
Contextual Factors Shaping Generations
25
26
26/03/2019
14
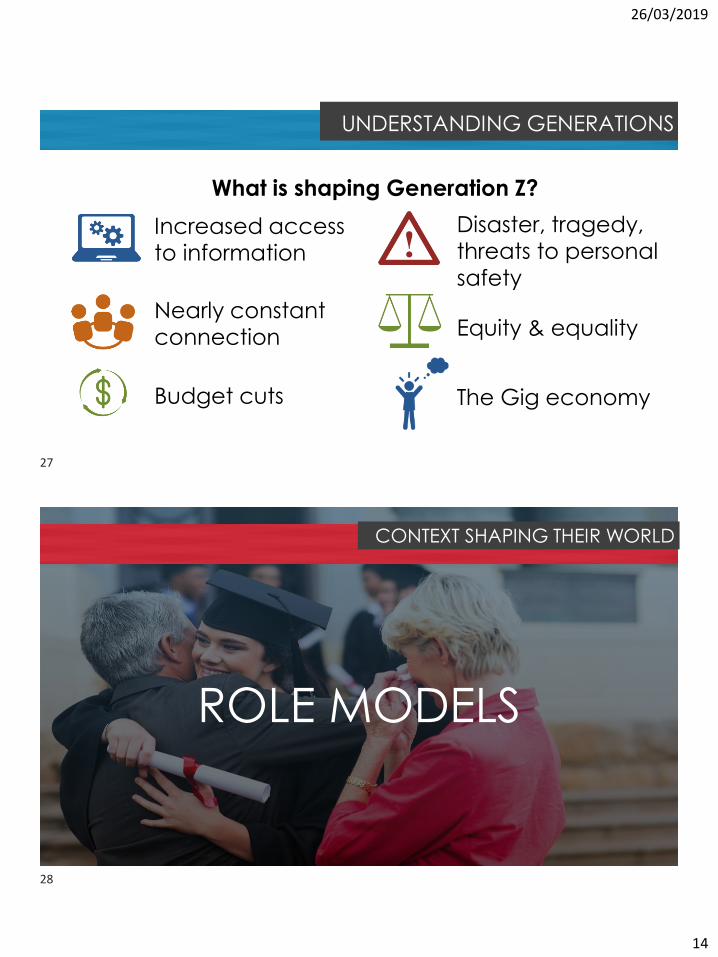
UNDERSTANDING GENERATIONS
Increased access to information
Nearly constant connection Equity & equality
Disaster, tragedy, threats to personal
safety
What is shaping Generation Z?
Budget cuts The Gig economy
CONTEXT SHAPING THEIR WORLD
ROLE MODELS
27
28
26/03/2019
15
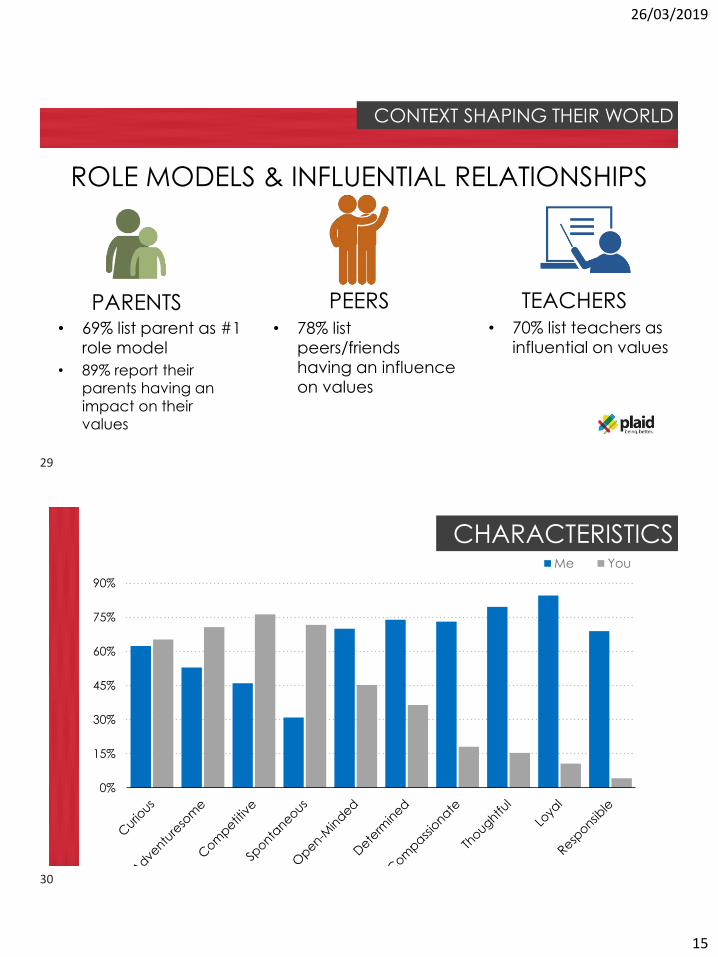
CONTEXT SHAPING THEIR WORLD
ROLE MODELS & INFLUENTIAL RELATIONSHIPS
PARENTS TEACHERSPEERS• 69% list parent as #1
role model
• 89% report their parents having an
impact on their
values
• 78% list peers/friends having an influence on values
• 70% list teachers as influential on values
CHARACTERISTICS
0%
15%
30%
45%
60%
75%
90%
Me You
29
30
26/03/2019
16
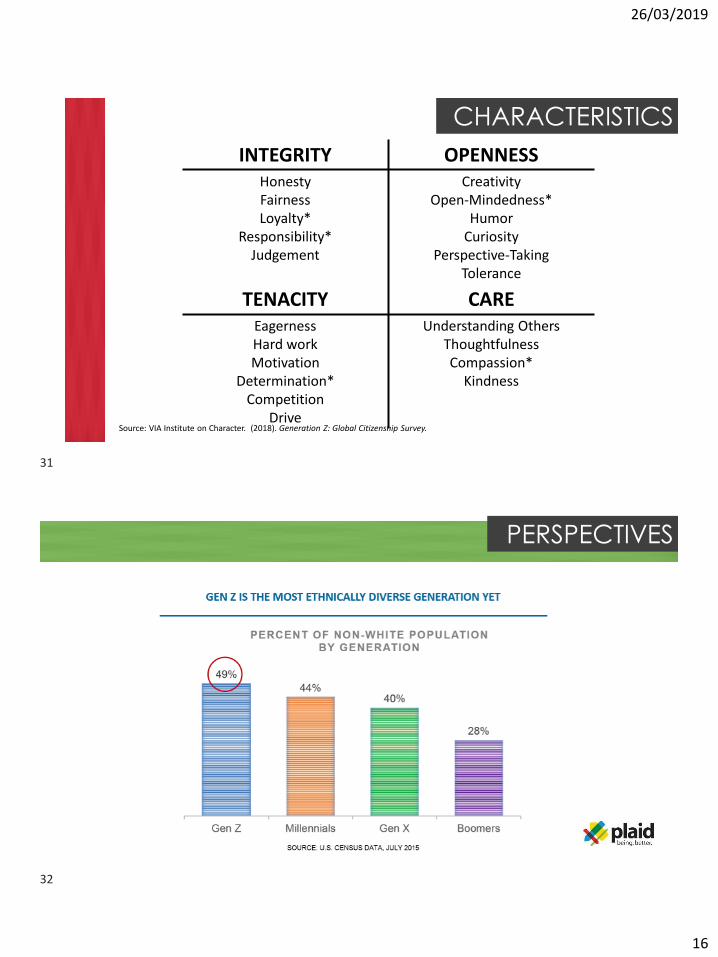
CHARACTERISTICS
INTEGRITY OPENNESS
Honesty
Fairness
Loyalty*
Responsibility*
Judgement
Creativity
Open-Mindedness*
Humor
Curiosity
Perspective-Taking
Tolerance
TENACITY CARE
Eagerness
Hard work
Motivation
Determination*
Competition
Drive
Understanding Others
Thoughtfulness
Compassion*
Kindness
Source: VIA Institute on Character. (2018). Generation Z: Global Citizenship Survey.
PERSPECTIVES
31
32
26/03/2019
17
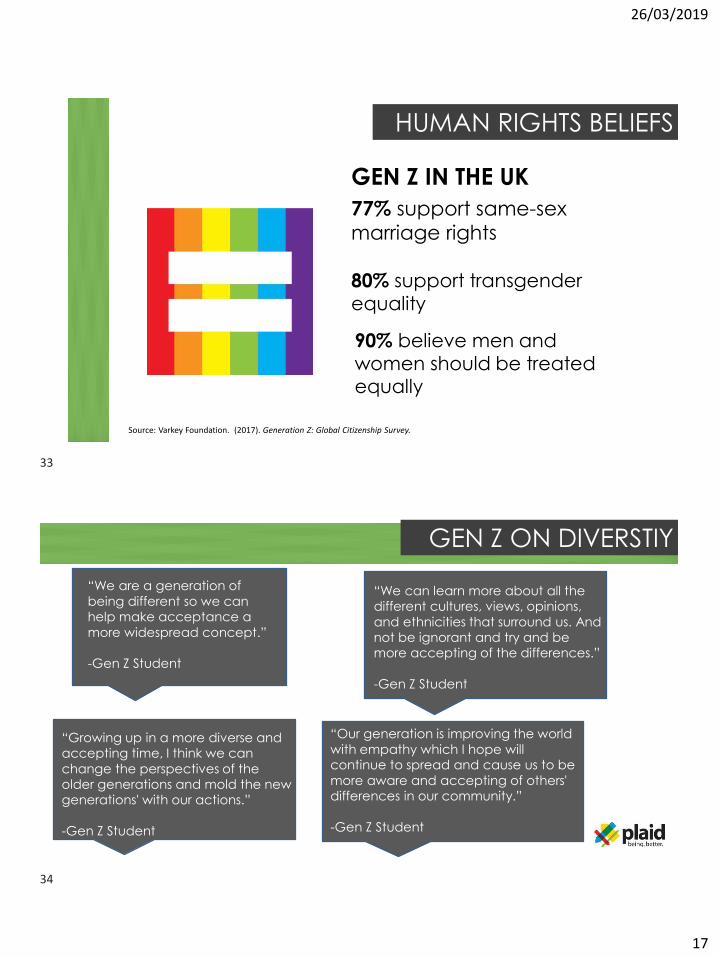
HUMAN RIGHTS BELIEFS
80% support transgender
equality
77% support same-sex marriage rights
GEN Z IN THE UK
Source: Varkey Foundation. (2017). Generation Z: Global Citizenship Survey.
90% believe men and
women should be treated equally
GEN Z ON DIVERSTIY
“We are a generation of being different so we can help make acceptance a
more widespread concept.”
-Gen Z Student
“Our generation is improving the world with empathy which I hope will continue to spread and cause us to be
more aware and accepting of others' differences in our community.”
-Gen Z Student
“Growing up in a more diverse and accepting time, I think we can
change the perspectives of the
older generations and mold the new generations' with our actions.”
-Gen Z Student
“We can learn more about all the different cultures, views, opinions,
and ethnicities that surround us. And not be ignorant and try and be more accepting of the differences.”
-Gen Z Student
33
34

26/03/2019
18
MOTIVATORS
RELATION PASSION ACHIEVEMENT
MOTIVATORS
RELATION
75% of study respondents are motivated by:• Not wanting to let others down.• Wanting to make a difference
for someone.
35
36
26/03/2019
19
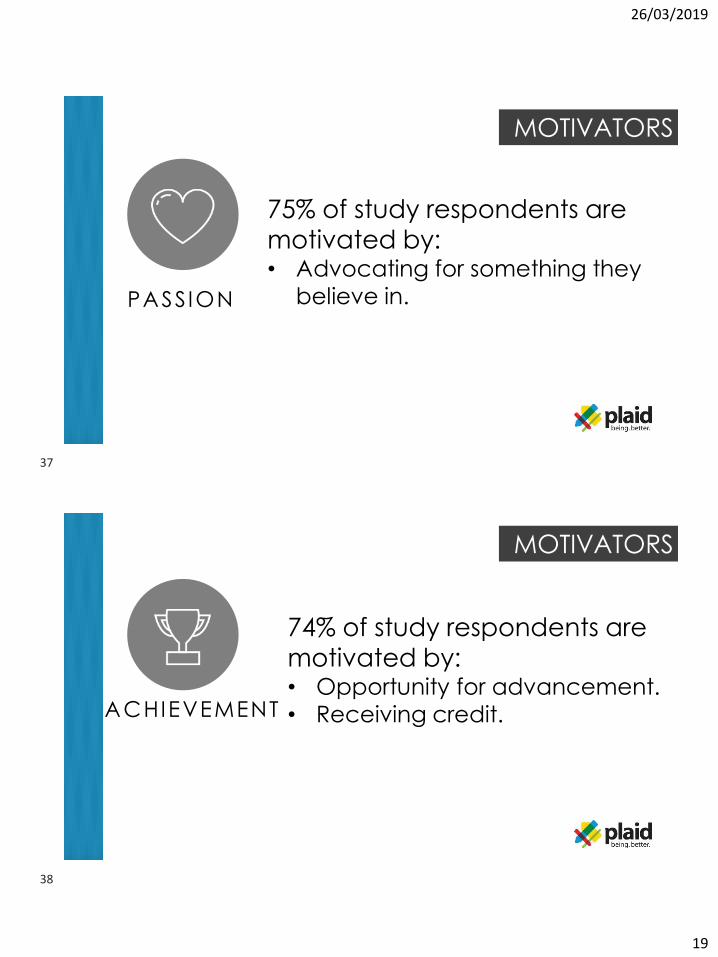
MOTIVATORS
PASSION
75% of study respondents are motivated by: • Advocating for something they
believe in.
MOTIVATORS
ACHIEVEMENT
74% of study respondents are motivated by: • Opportunity for advancement.
• Receiving credit.
37
38
26/03/2019
20
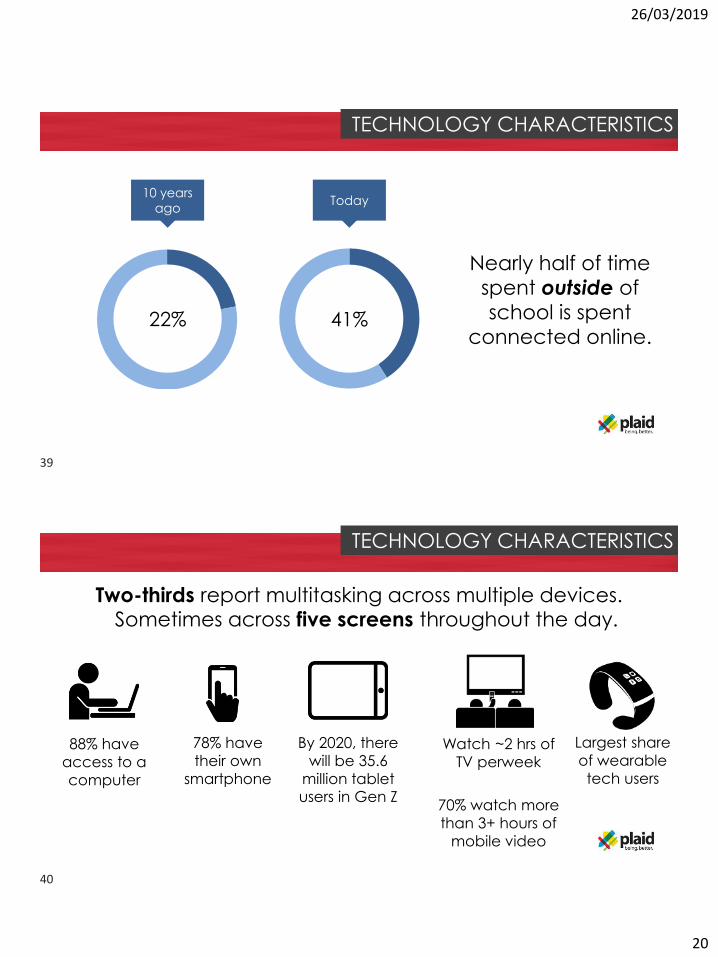
TECHNOLOGY CHARACTERISTICS
22% 41%
10 years
agoToday
Nearly half of time
spent outside of
school is spent
connected online.
TECHNOLOGY CHARACTERISTICS
Two-thirds report multitasking across multiple devices. Sometimes across five screens throughout the day.
88% have
access to a
computer
78% have
their own
smartphone
By 2020, there
will be 35.6
million tablet users in Gen Z
Watch ~2 hrs of
TV perweek
70% watch more
than 3+ hours of
mobile video
Largest share
of wearable
tech users
39
40
26/03/2019
21
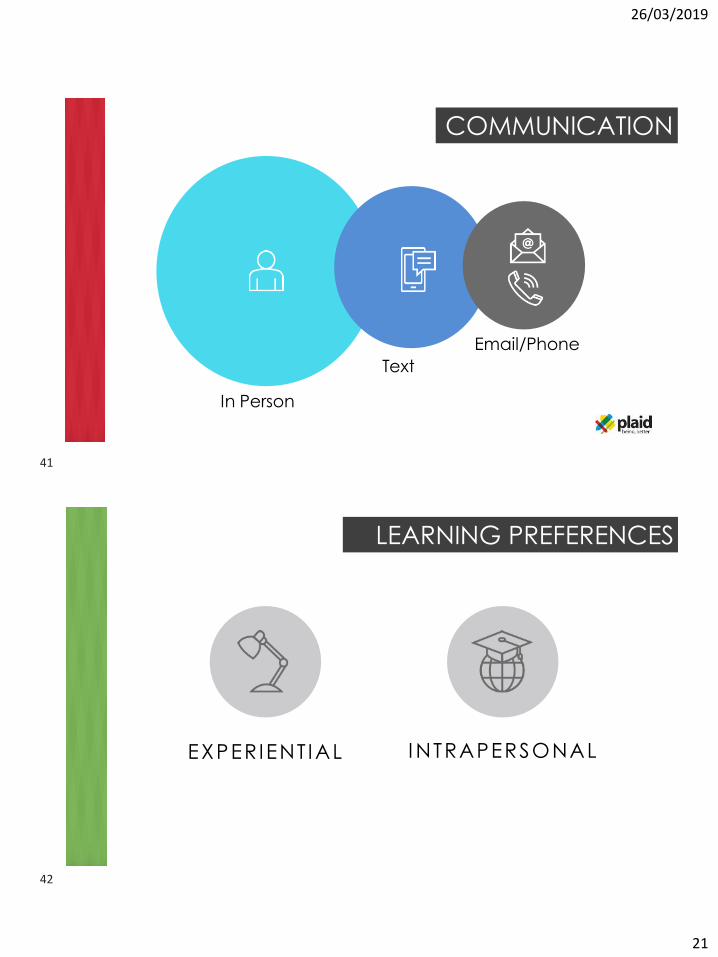
COMMUNICATION
In Person
Text
Email/Phone
LEARNING PREFERENCES
I NTRAPERSONALEXPERIENT IAL
41
42
26/03/2019
22
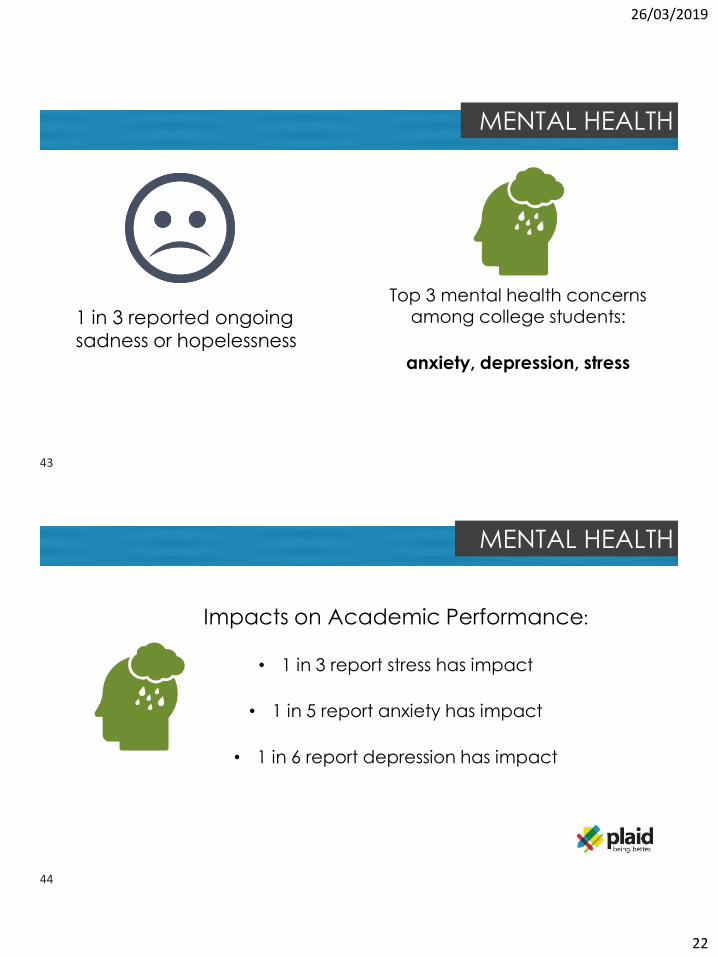
MENTAL HEALTH
1 in 3 reported ongoing
sadness or hopelessness
Top 3 mental health concerns among college students:
anxiety, depression, stress
MENTAL HEALTH
Impacts on Academic Performance:
• 1 in 3 report stress has impact
• 1 in 5 report anxiety has impact
• 1 in 6 report depression has impact
43
44
26/03/2019
23
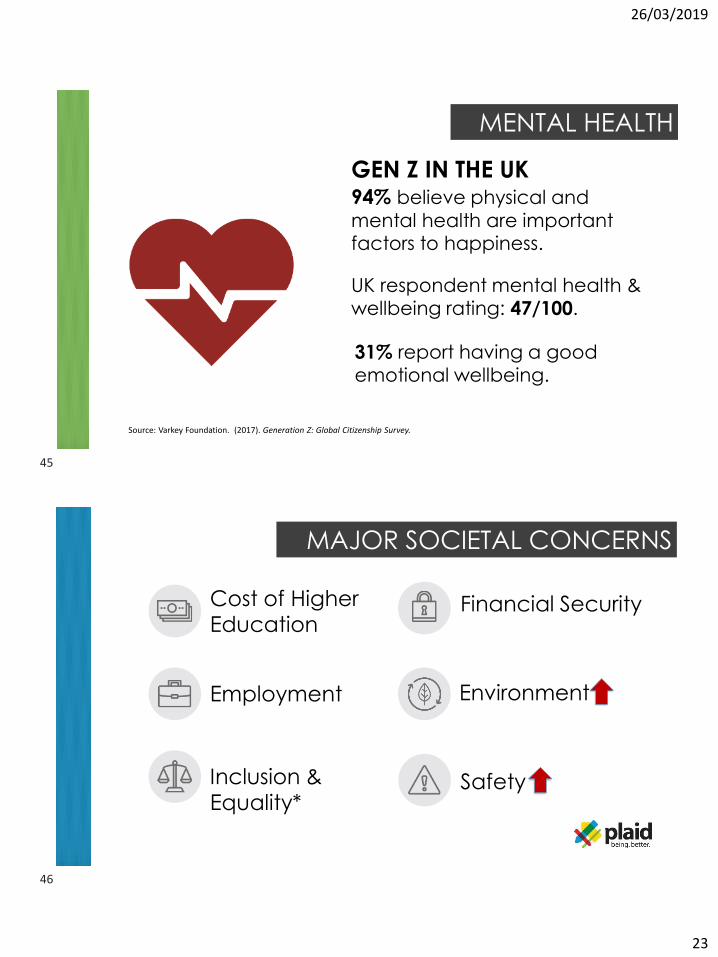
MENTAL HEALTH
UK respondent mental health &
wellbeing rating: 47/100.
94% believe physical and
mental health are important factors to happiness.
GEN Z IN THE UK
Source: Varkey Foundation. (2017). Generation Z: Global Citizenship Survey.
31% report having a good
emotional wellbeing.
MAJOR SOCIETAL CONCERNS
Cost of Higher Education
Employment
Inclusion & Equality*
Financial Security
Environment
Safety
45
46
26/03/2019
24
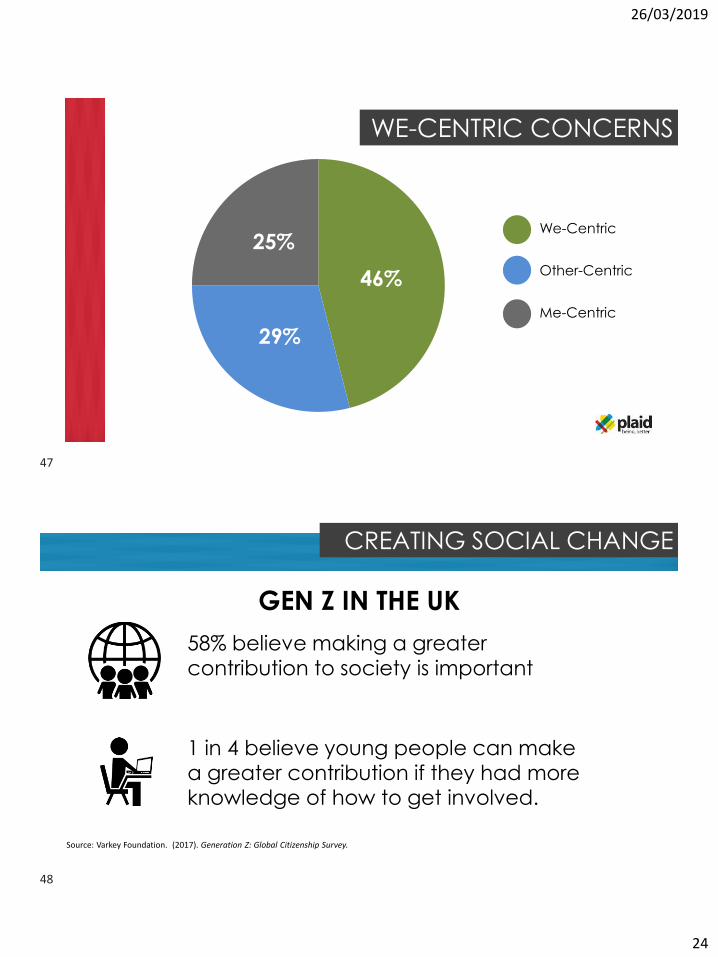
WE-CENTRIC CONCERNS
46%
29%
25%We-Centric
Other-Centric
Me-Centric
CREATING SOCIAL CHANGE
1 in 4 believe young people can make
a greater contribution if they had more knowledge of how to get involved.
GEN Z IN THE UK
58% believe making a greater
contribution to society is important
Source: Varkey Foundation. (2017). Generation Z: Global Citizenship Survey.
47
48
26/03/2019
25
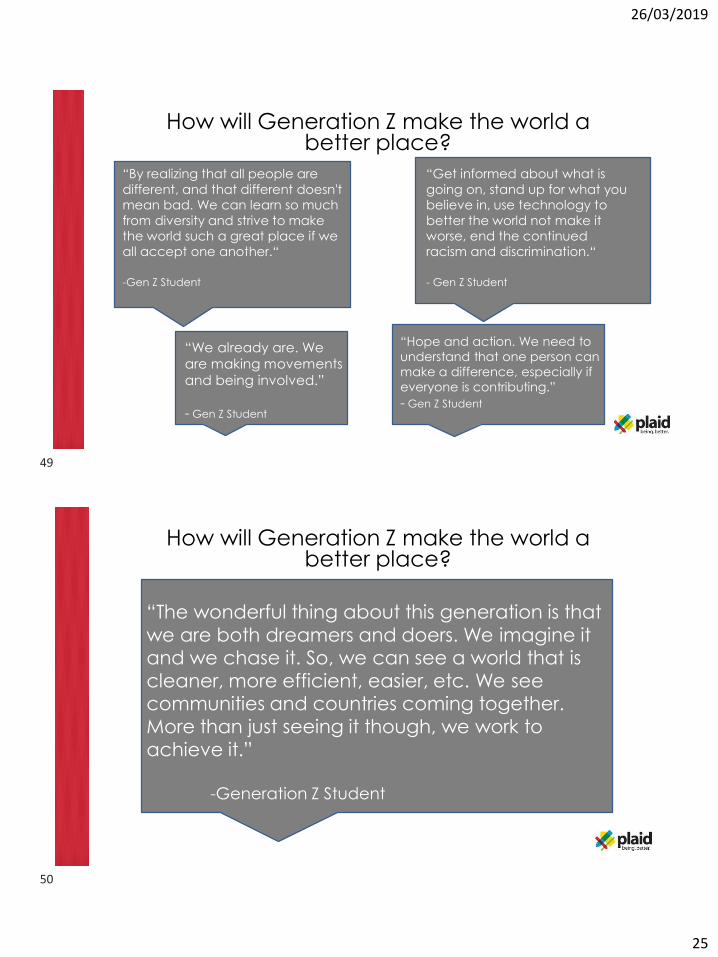
“By realizing that all people are different, and that different doesn't mean bad. We can learn so much
from diversity and strive to make the world such a great place if we all accept one another.“
-Gen Z Student
How will Generation Z make the world a better place?
“We already are. We are making movements
and being involved.”
- Gen Z Student
“Get informed about what is going on, stand up for what you believe in, use technology to
better the world not make it worse, end the continued racism and discrimination.“
- Gen Z Student
“Hope and action. We need to understand that one person can
make a difference, especially if
everyone is contributing.”- Gen Z Student
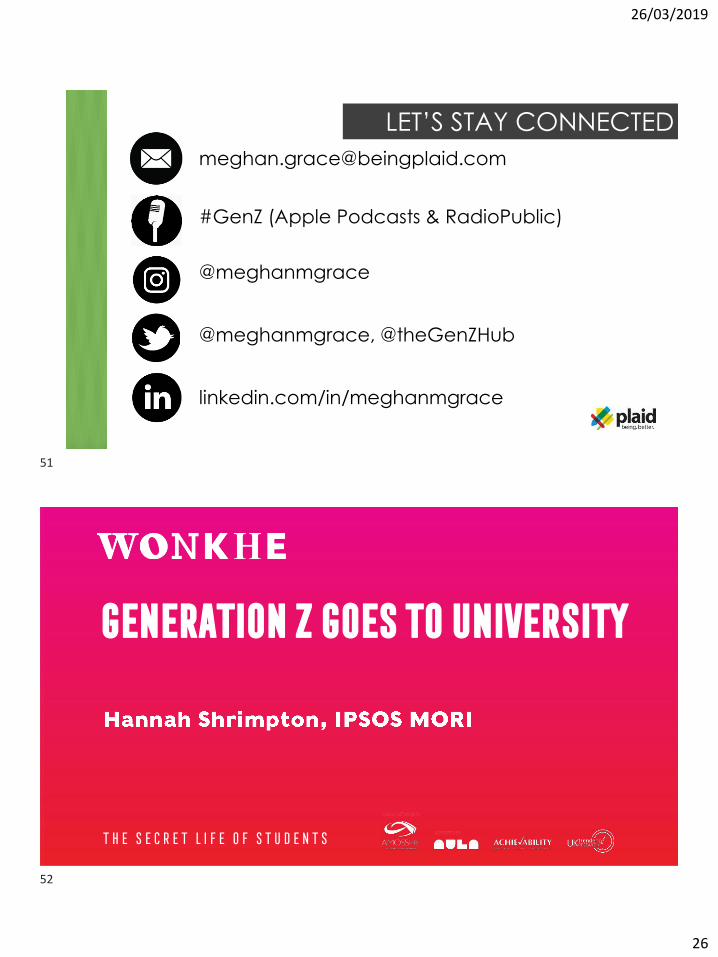
“The wonderful thing about this generation is that we are both dreamers and doers. We imagine it and we chase it. So, we can see a world that is
cleaner, more efficient, easier, etc. We see communities and countries coming together.
More than just seeing it though, we work to
achieve it.”
-Generation Z Student
How will Generation Z make the world a better place?
49
50
26/03/2019
26
LET’S STAY [email protected]
@meghanmgrace, @theGenZHub
#GenZ (Apple Podcasts & RadioPublic)
linkedin.com/in/meghanmgrace
@meghanmgrace
IN ASSOCIATION WITH
SUPPORTED BY
Generation Z goes to university
T H E S E C R E T L I F E O F S T U D E N T S
51
52
26/03/2019
27
Millennials: Myths & Realities | May 2017 | Public
© 2016 Ipsos. All rights reserved. Contains Ipsos' Confidential and Proprietary information and
may not be disclosed or reproduced without the prior written consent of Ipsos.
53
IPSOS THINKS
@h_shrimpton
GEN Z
HANNAH SHRIMPTON
54Generation Z: Beyond Binary | July 2018 | Public
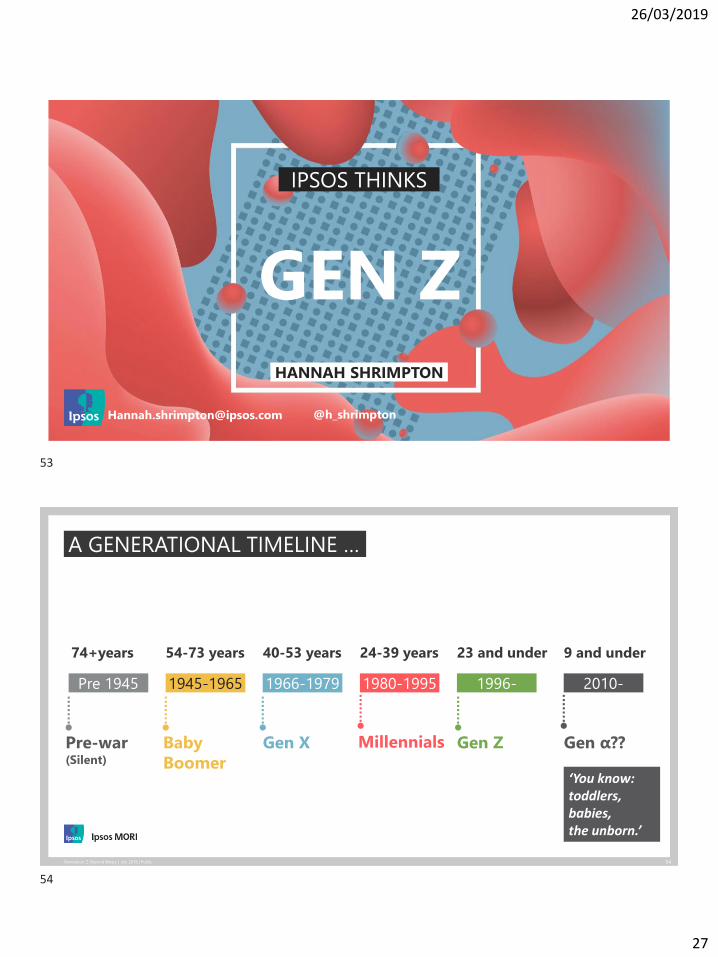
A GENERATIONAL TIMELINE …
Pre 1945
74+years
Pre-war (Silent)
1945-1965
54-73 years
Baby Boomer
1966-1979
40-53 years
Gen X
1980-1995
24-39 years
Millennials
23 and under
1996-
Gen Z
9 and under
2010-
Gen α??‘You know: toddlers,
babies,
the unborn.’
53
54
26/03/2019
28
55Millennials: Myths & Realities | May 2017 | Public
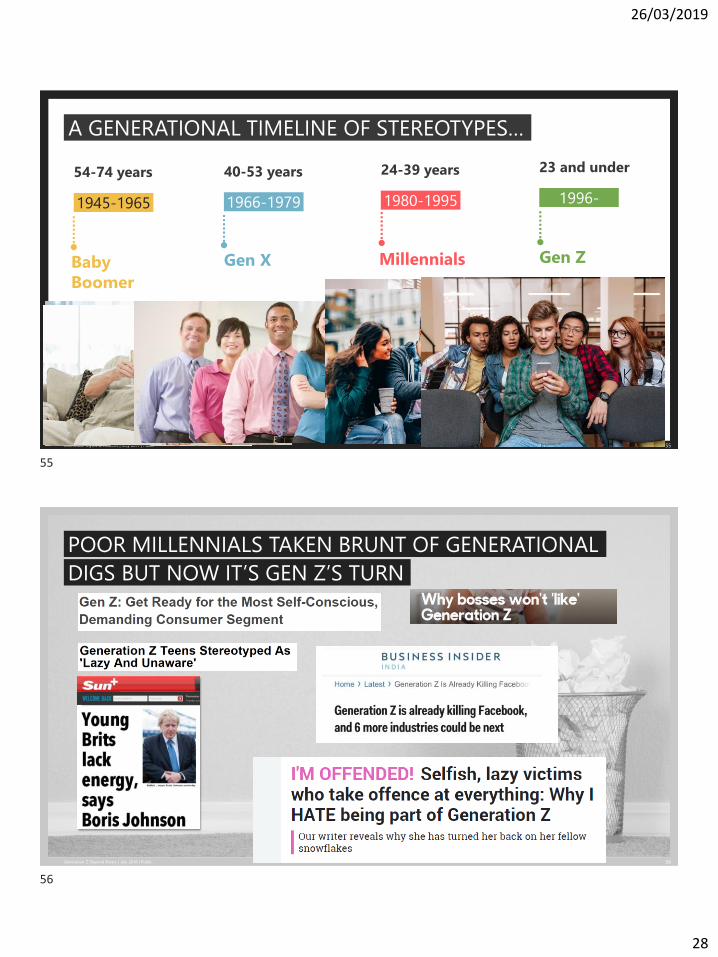
A GENERATIONAL TIMELINE OF STEREOTYPES…
1945-1965
54-74 years
Baby Boomer
1966-1979
40-53 years
Gen X
1980-1995
24-39 years
Millennials
23 and under
1996-
Gen Z
56Generation Z: Beyond Binary | July 2018 | Public
POOR MILLENNIALS TAKEN BRUNT OF GENERATIONAL
DIGS BUT NOW IT’S GEN Z’S TURN
55
56
26/03/2019
29
57Millennials: Myths & Realities | May 2017 | Public
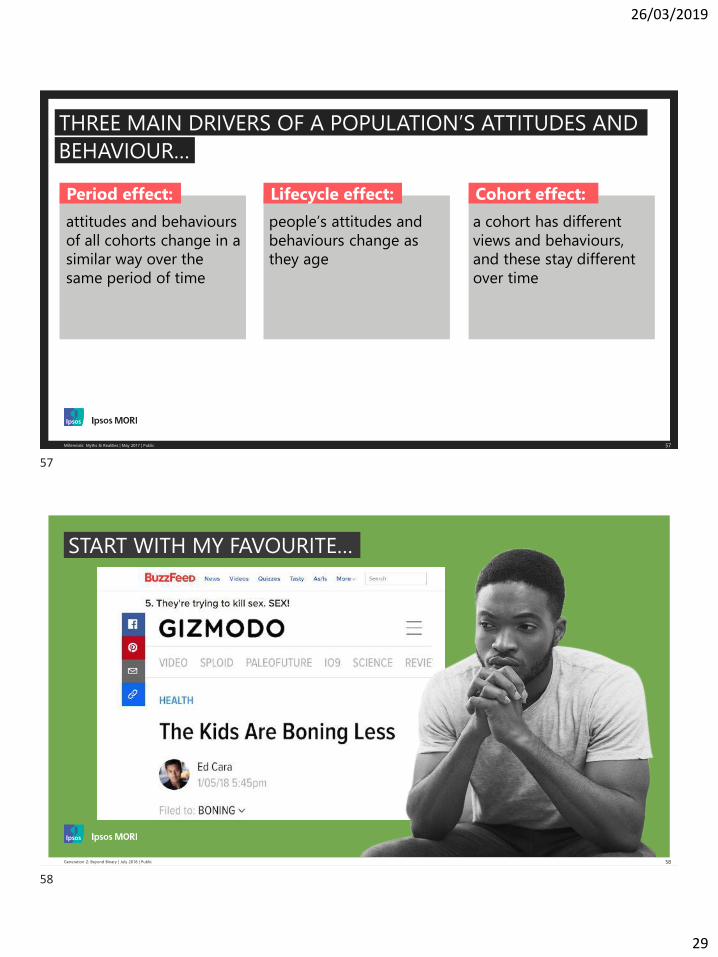
Lifecycle effect:
people’s attitudes and behaviours change as they age
Period effect:
attitudes and behaviours of all cohorts change in a similar way over the same period of time
THREE MAIN DRIVERS OF A POPULATION’S ATTITUDES ANDBEHAVIOUR…
Cohort effect:
a cohort has different views and behaviours, and these stay different over time
Generation Z: Beyond Binary | July 2018 | Public 58
START WITH MY FAVOURITE…
57
58

26/03/2019
30
59Generation Z: Beyond Binary | July 2018 | Public
BUT THERE IS TRUTH IN THIS … MORE MILD THAN WILDJust 36% of
13-15 year olds
tried alcohol in
2016, down
from 76% in
2000!!!
Drug use less
uniform change
– but marijuana
down 12 percentage points in US
Criminal behaviour
falling:
• Detained young
people down 48% across
Europe
2008-15
• In UK 260,000 offences
by Millennials 10-17
years olds, down to
73,000 for Gen Z
36% of Millennial high schoolers
said were sexually active, down to
30% for Gen Z (though
unprotected sex same proportion of
sexually active)
60Generation Z: Beyond Binary | July 2018 | Public
Source: Young People’s Omnibus 2018/Nestle Family Monitor Survey of Young People’s Attitudes 2004
NOT ABOUT
PERCEPTION
CHANGES IN RISK
– EXCEPT
ALCOHOL …
85%
77%
72%
70%
70%
64%
57%
28%
90%
83%
84%
56%
76%
76%
67%
Taking cocaine
Taking dance drugs e.g. ecstasy, speed
Smoking cannabis
Binge drinking
Smoking cigarettes
Sniffing solvents/glues
Walking alone at night in an area strange to you
Having an alcoholic drink
How risky do you see following activities…? % VERY risky
2018
2004
59
60
26/03/2019
31
Generation Z: Beyond Binary | July 2018 | Public 61
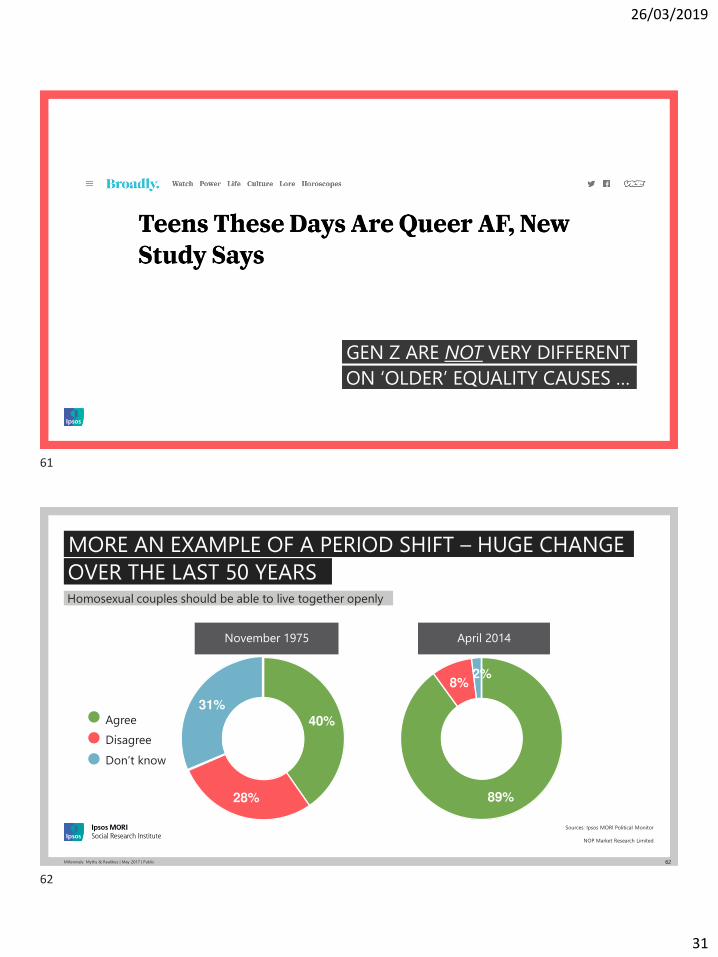
GEN Z ARE NOT VERY DIFFERENT
ON ‘OLDER’ EQUALITY CAUSES …
62Millennials: Myths & Realities | May 2017 | Public
Homosexual couples should be able to live together openly
MORE AN EXAMPLE OF A PERIOD SHIFT – HUGE CHANGE
Sources: Ipsos MORI Political Monitor
NOP Market Research Limited
OVER THE LAST 50 YEARS
November 1975
40%
28%
31%Agree
Disagree
Don’t know
April 2014
89%
8%2%
61
62
26/03/2019
32
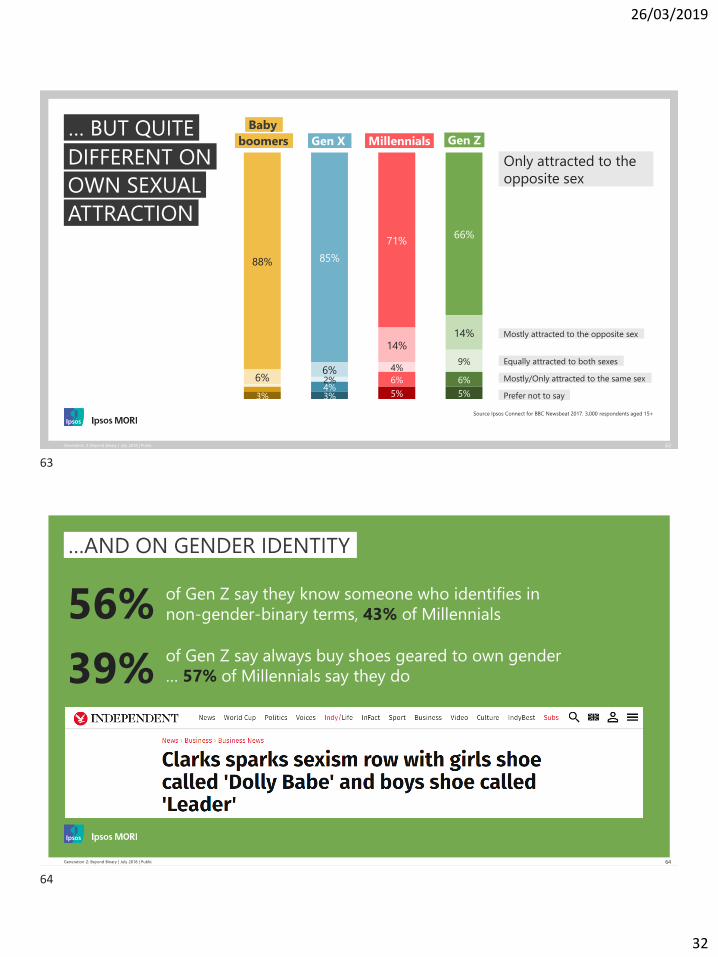
63Generation Z: Beyond Binary | July 2018 | Public
Source Ipsos Connect for BBC Newsbeat 2017. 3,000 respondents aged 15+
… BUT QUITE
66%71%
85%88%
14%14%
6%6%
9%4%
2% 6%6%4%
5%5%3%3%
Only attracted to the opposite sex
Mostly attracted to the opposite sex
Equally attracted to both sexes
Mostly/Only attracted to the same sex
Prefer not to say
DIFFERENT ON
ATTRACTION
OWN SEXUAL
Baby
Gen X Millennials Gen Zboomers
Generation Z: Beyond Binary | July 2018 | Public 64
…AND ON GENDER IDENTITY
of Gen Z say always buy shoes geared to own gender … 57% of Millennials say they do
of Gen Z say they know someone who identifies in non-gender-binary terms, 43% of Millennials56%
39%
63
64
26/03/2019
33
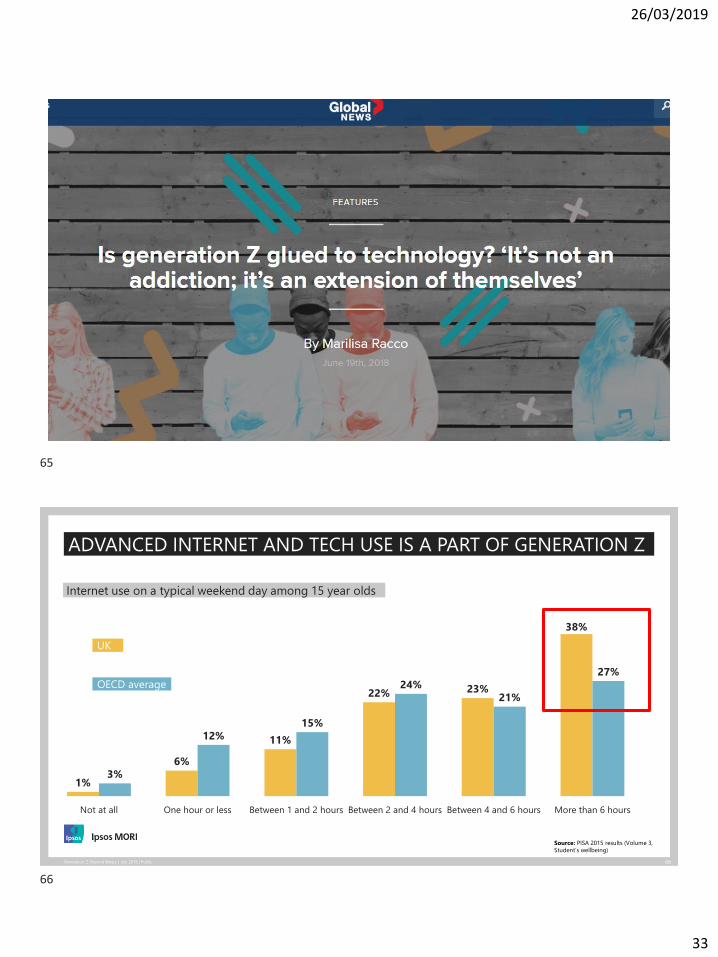
65Generation Z: Beyond Binary | July 2018 | Public
66Generation Z: Beyond Binary | July 2018 | Public
1%
6%
11%
22% 23%
38%
3%
12%15%
24%21%
27%
Not at all One hour or less Between 1 and 2 hours Between 2 and 4 hours Between 4 and 6 hours More than 6 hours
ADVANCED INTERNET AND TECH USE IS A PART OF GENERATION Z
UK
OECD average
Source: PISA 2015 results (Volume 3, Student’s wellbeing)
Internet use on a typical weekend day among 15 year olds
65
66
26/03/2019
34
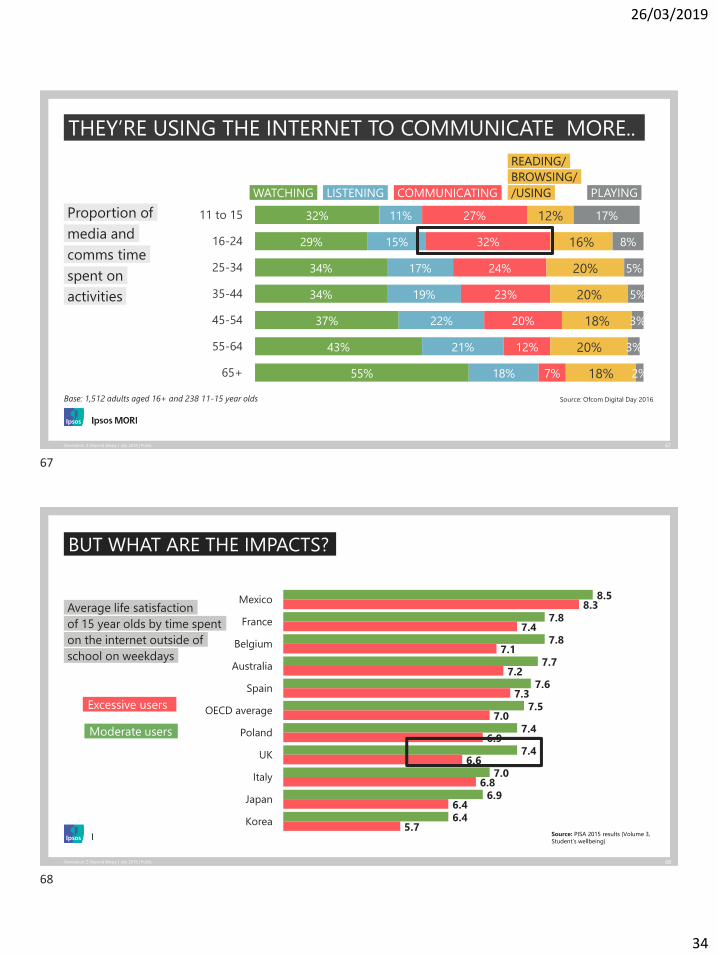
67Generation Z: Beyond Binary | July 2018 | Public
32%
29%
34%
34%
37%
43%
55%
11%
15%
17%
19%
22%
21%
18%
27%
32%
24%
23%
20%
12%
7%
12%
16%
20%
20%
18%
20%
18%
17%
8%
5%
5%
3%
3%
2%
11 to 15
16-24
25-34
35-44
45-54
55-64
65+
Proportion of
Source: Ofcom Digital Day 2016Base: 1,512 adults aged 16+ and 238 11-15 year olds
THEY’RE USING THE INTERNET TO COMMUNICATE MORE..
WATCHING LISTENING COMMUNICATING PLAYING
READING/
BROWSING/
/USING
media and
comms time
spent on
activities
68Generation Z: Beyond Binary | July 2018 | Public
BUT WHAT ARE THE IMPACTS?
8.5
7.8
7.8
7.7
7.6
7.5
7.4
7.4
7.0
6.9
6.4
8.3
7.4
7.1
7.2
7.3
7.0
6.9
6.6
6.8
6.4
5.7
Mexico
France
Belgium
Australia
Spain
OECD average
Poland
UK
Italy
Japan
Korea
Average life satisfaction
Excessive users
Moderate users
of 15 year olds by time spent
on the internet outside of
school on weekdays
Source: PISA 2015 results (Volume 3, Student’s wellbeing)
67
68

26/03/2019
35
Generation Z: Beyond Binary | July 2018 | Public 69
BUILDING EVIDENCE OF CORRELATION AND POSSIBLY
CAUSAL IMPACT BUT JURY IS STILL OUT
70Generation Z: Beyond Binary | July 2018 | Public
BUT LET’S PLEASE KILL THE GOLDFISH MYTH!!!
69
70
26/03/2019
36
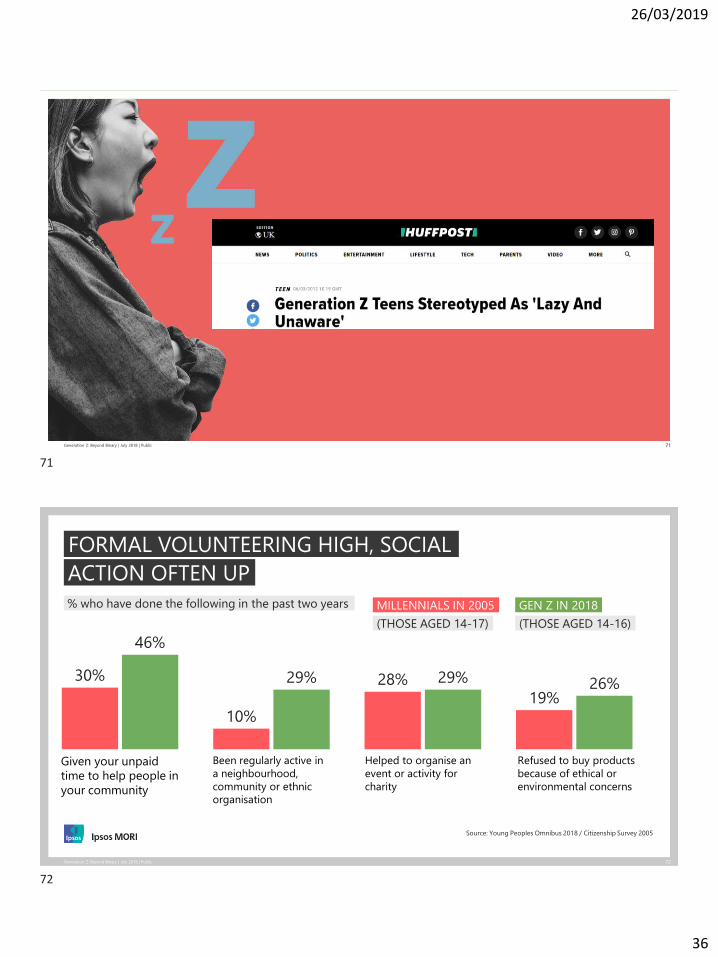
Generation Z: Beyond Binary | July 2018 | Public 71
72Generation Z: Beyond Binary | July 2018 | Public
% who have done the following in the past two years
Source: Young Peoples Omnibus 2018 / Citizenship Survey 2005
FORMAL VOLUNTEERING HIGH, SOCIAL
30%
10%
28%19%
46%
29% 29% 26%
Given your unpaid time to help people in your community
Been regularly active in a neighbourhood, community or ethnic organisation
Helped to organise an event or activity for charity
Refused to buy products because of ethical or environmental concerns
ACTION OFTEN UP
MILLENNIALS IN 2005
(THOSE AGED 14-17)
GEN Z IN 2018
(THOSE AGED 14-16)
71
72
26/03/2019
37
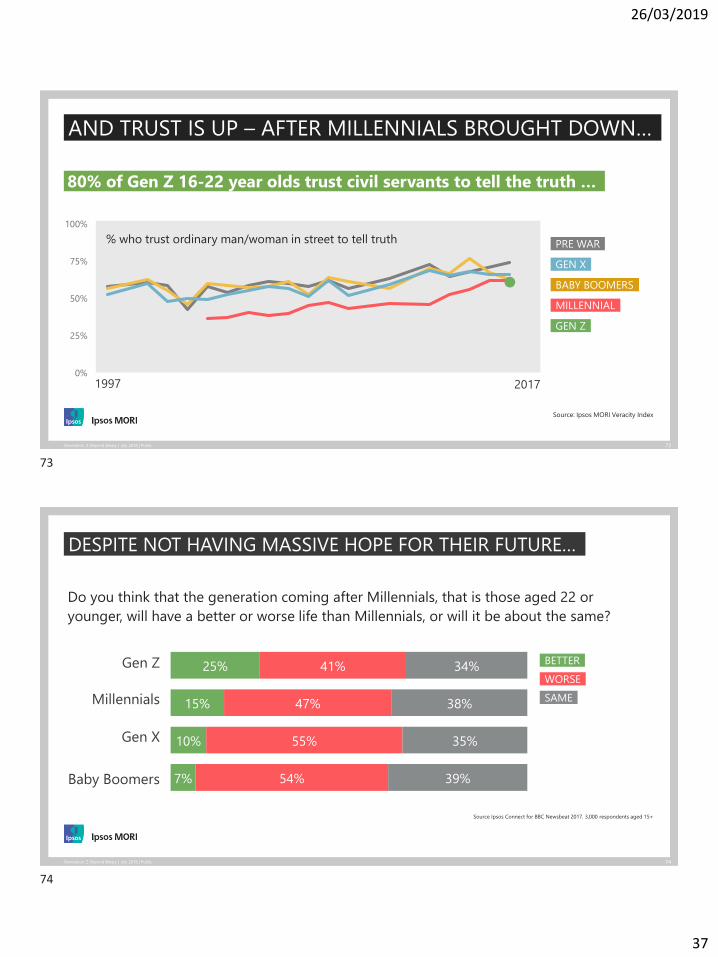
73Generation Z: Beyond Binary | July 2018 | Public
Source: Ipsos MORI Veracity Index
AND TRUST IS UP – AFTER MILLENNIALS BROUGHT DOWN…
0%
25%
50%
75%
100%
80% of Gen Z 16-22 year olds trust civil servants to tell the truth …
PRE WAR
BABY BOOMERS
GEN X
MILLENNIAL
GEN Z
1997 2017
% who trust ordinary man/woman in street to tell truth
74Generation Z: Beyond Binary | July 2018 | Public
Baby Boomers
Gen Z
Millennials
Gen X
DESPITE NOT HAVING MASSIVE HOPE FOR THEIR FUTURE…
25%
15%
10%
7%
41%
47%
55%
54%
34%
38%
35%
39%
Do you think that the generation coming after Millennials, that is those aged 22 or
younger, will have a better or worse life than Millennials, or will it be about the same?
SAME
WORSE
BETTER
Source Ipsos Connect for BBC Newsbeat 2017. 3,000 respondents aged 15+
73
74
26/03/2019
38
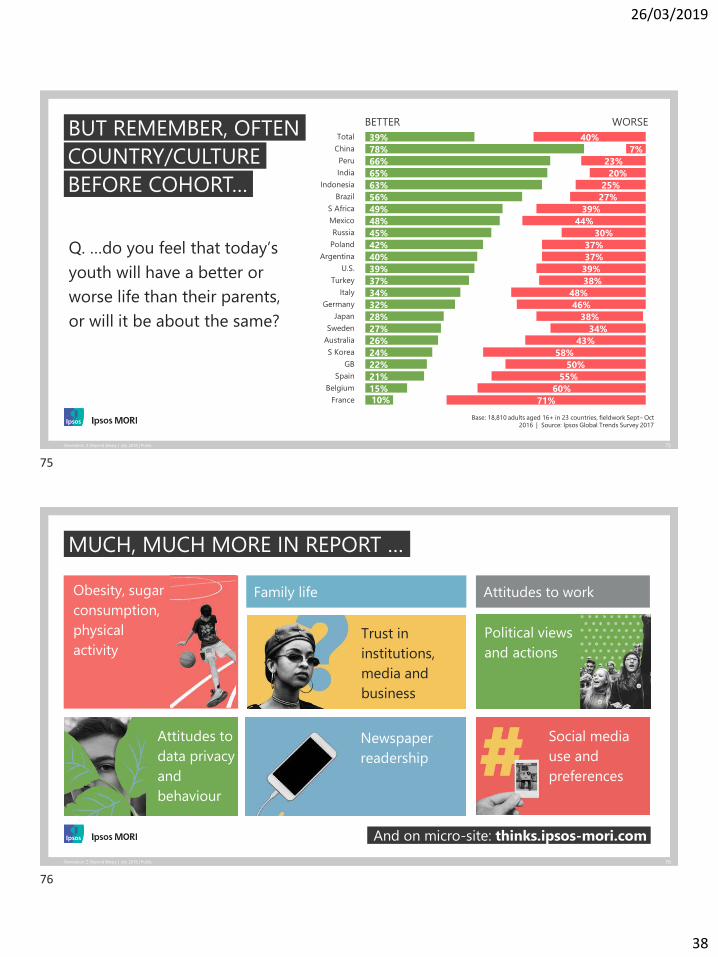
75Generation Z: Beyond Binary | July 2018 | Public
39%
78%
66%
65%
63%
56%
49%
48%
45%
42%
40%
39%
37%
34%
32%
28%
27%
26%
24%
22%
21%
15%10%
40%
7%
23%
20%
25%
27%
39%
44%
30%
37%
37%
39%
38%
48%
46%
38%
34%
43%
58%
50%
55%
60%
71%
Total
China
Peru
India
Indonesia
Brazil
S Africa
Mexico
Russia
Poland
Argentina
U.S.
Turkey
Italy
Germany
Japan
Sweden
Australia
S Korea
GB
Spain
Belgium
France
Base: 18,810 adults aged 16+ in 23 countries, fieldwork Sept– Oct 2016 | Source: Ipsos Global Trends Survey 2017
BUT REMEMBER, OFTEN
Q. …do you feel that today’s youth will have a better or
worse life than their parents,
or will it be about the same?
COUNTRY/CULTURE
BEFORE COHORT…
BETTER WORSE
76Generation Z: Beyond Binary | July 2018 | Public
MUCH, MUCH MORE IN REPORT …Family life Attitudes to workObesity, sugar
consumption,
physical
activity
Attitudes to
data privacy
and
behaviour
Trust in
institutions,
media and
business
Newspaper
readership
Social media
use and
preferences
Political views
and actions
And on micro-site: thinks.ipsos-mori.com
75
76
26/03/2019
39
IN ASSOCIATION WITH
SUPPORTED BY
Great expectations••••
T H E S E C R E T L I F E O F S T U D E N T S
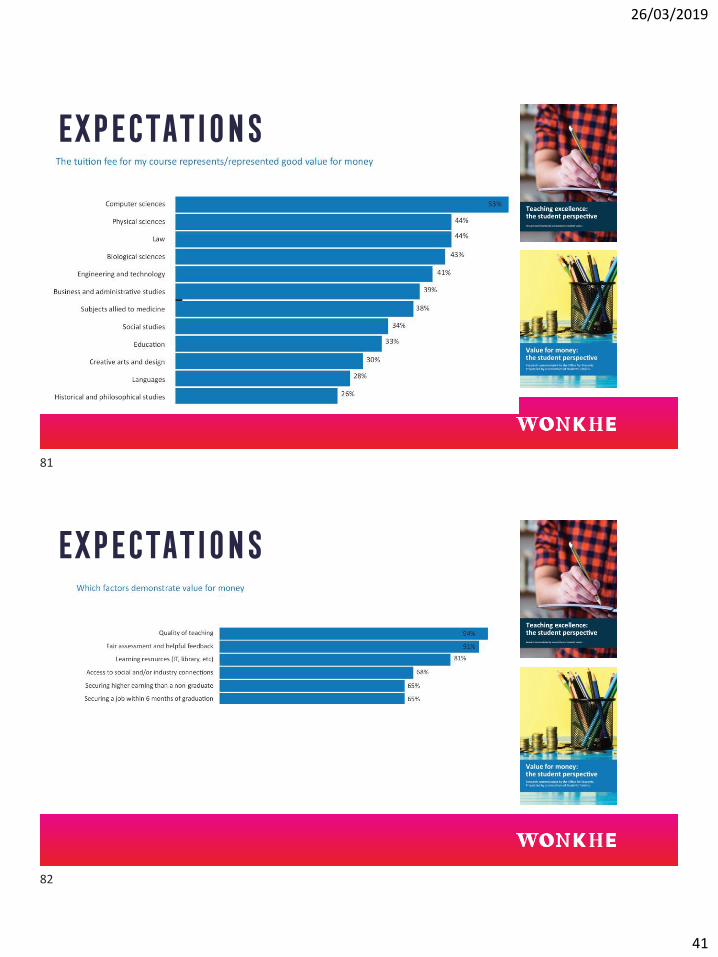
EXPECTATIONS
77
78
26/03/2019
40
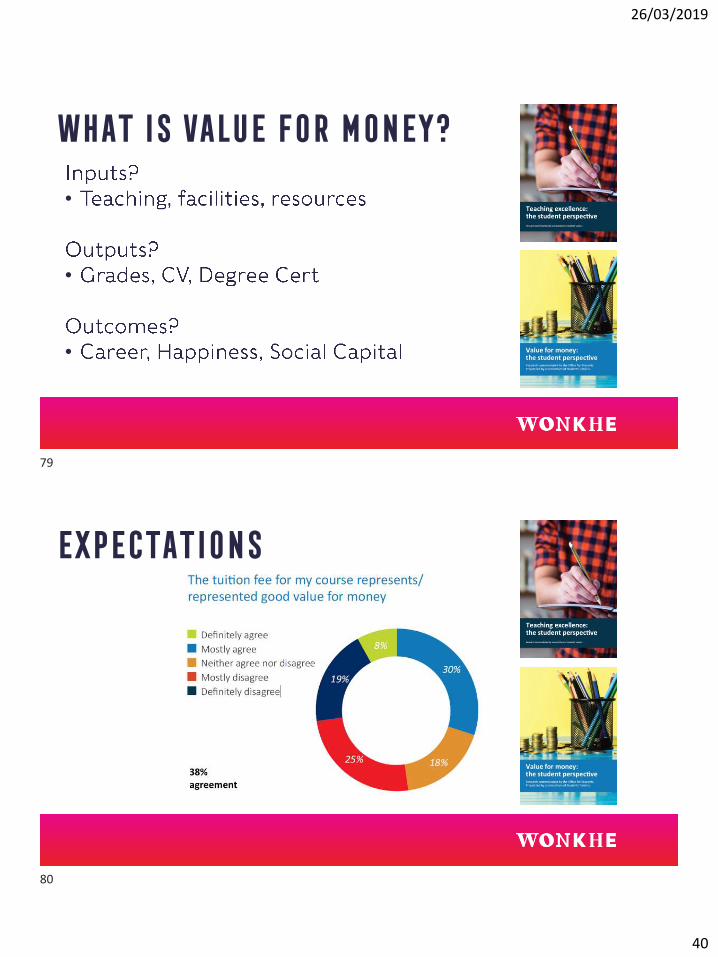
WHAT IS VALUE FOR MONEY?
•
•
•
EXPECTATIONS
79
80
26/03/2019
41
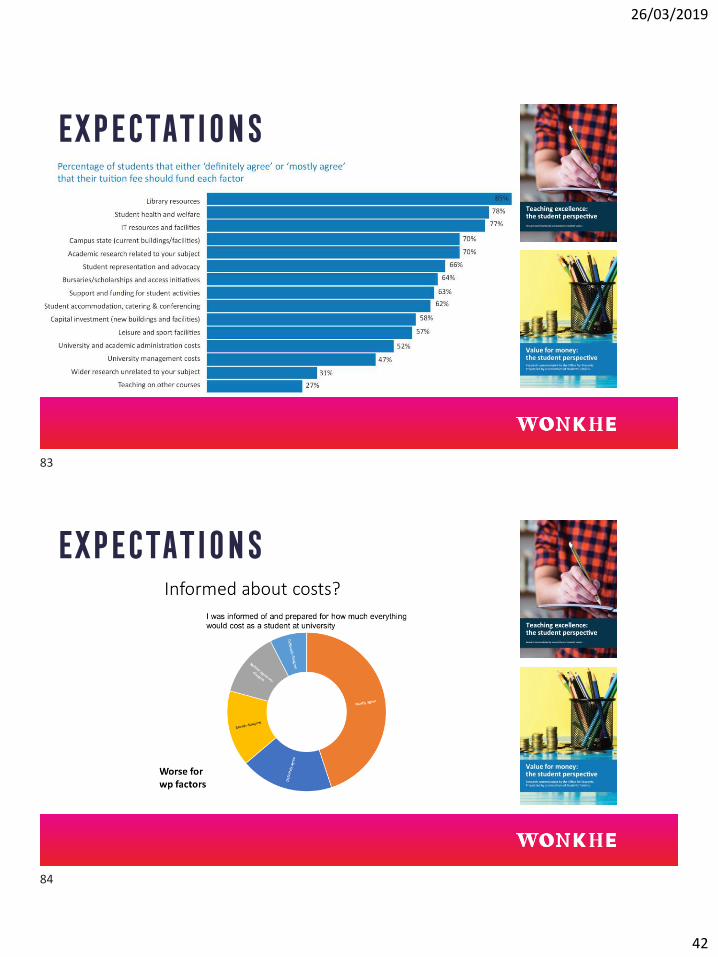
EXPECTATIONS
EXPECTATIONS
81
82
26/03/2019
42
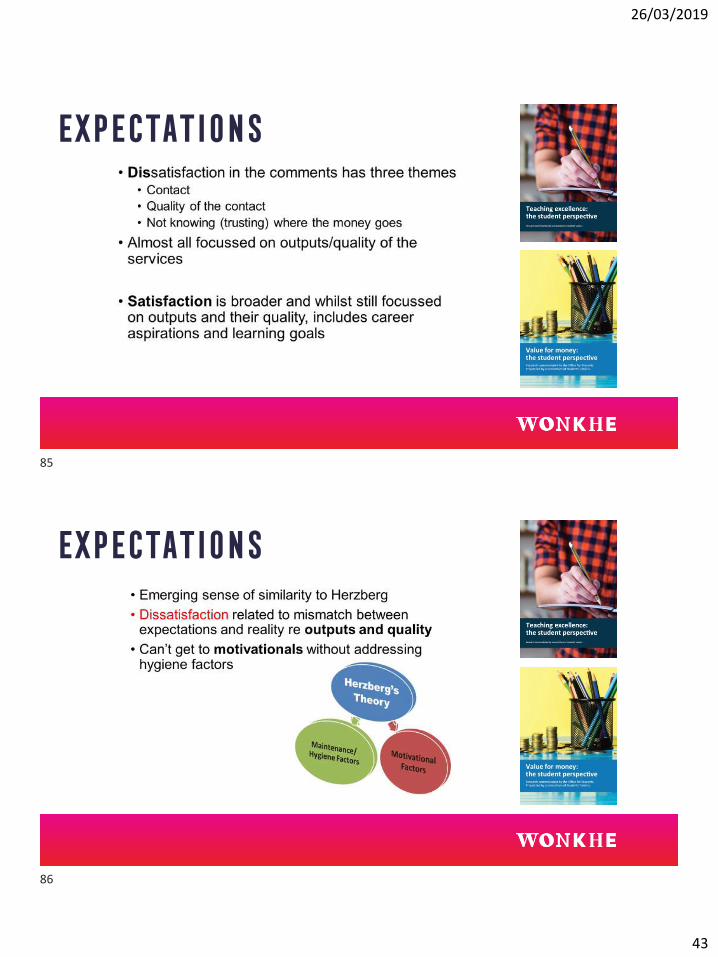
EXPECTATIONS
EXPECTATIONS
83
84
26/03/2019
43
EXPECTATIONS
EXPECTATIONS
85
86
26/03/2019
44
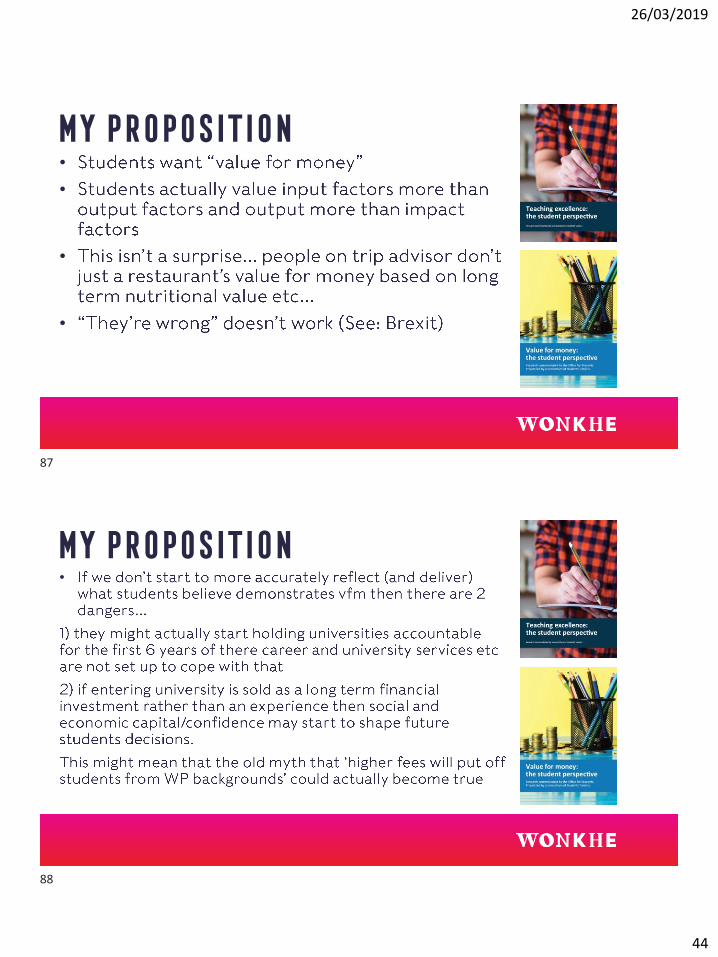
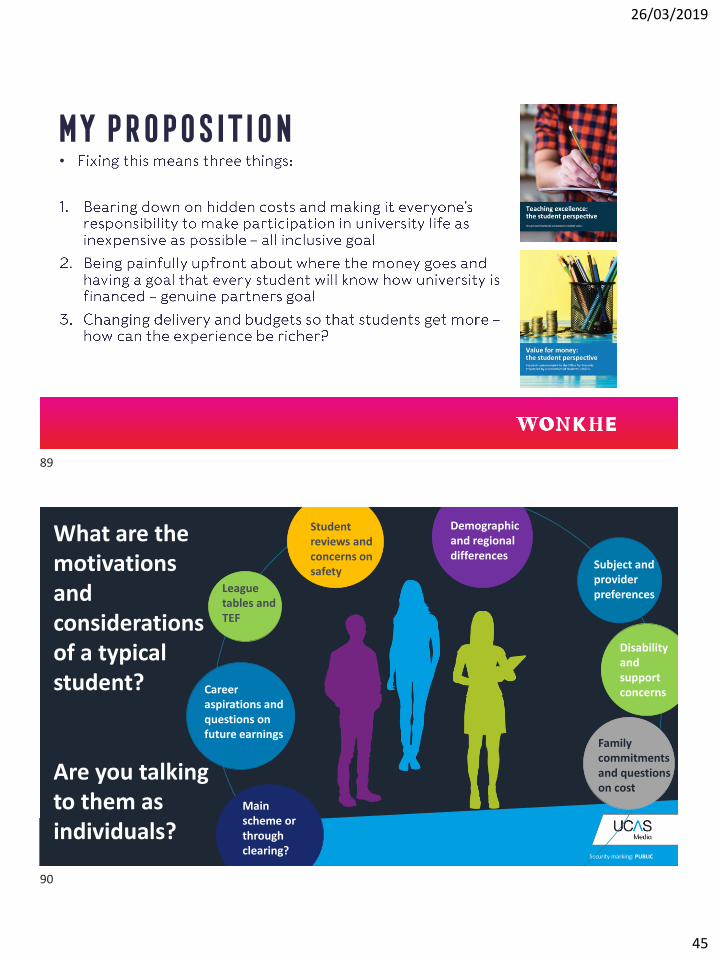
MY PROPOSITION••
•
•
MY PROPOSITION•
87
88
26/03/2019
45
MY PROPOSITION•
Security marking: PUBLIC
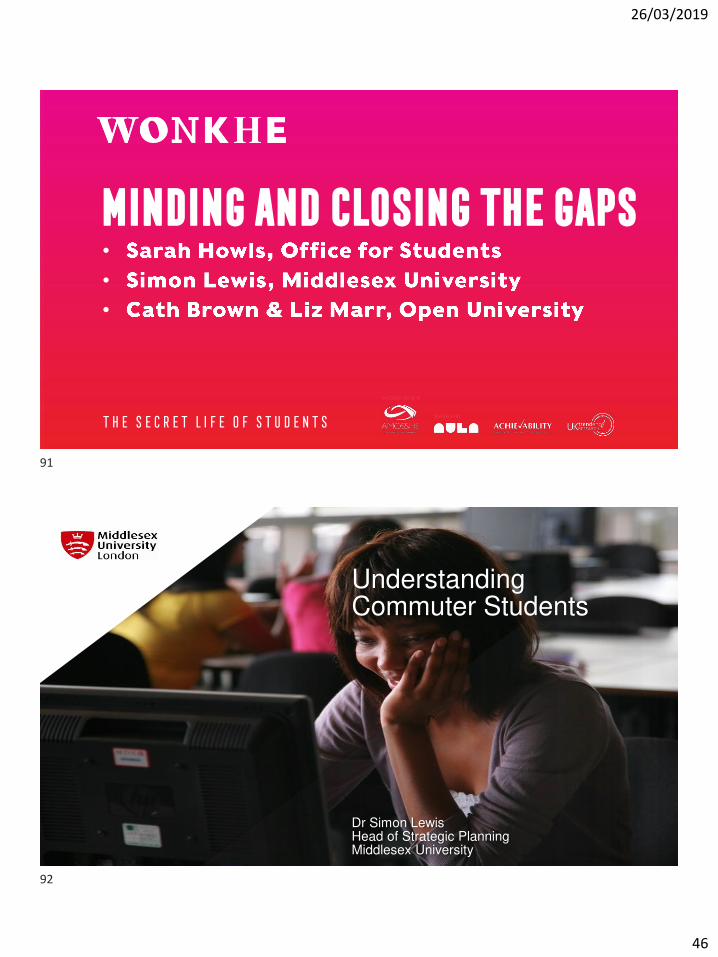
What are the
motivations
and
considerations
of a typical
student?
Are you talking
to them as
individuals?
Subject and
provider
preferences
Family
commitments
and questions
on cost
League
tables and
TEF
Demographic
and regional
differences
Career
aspirations and
questions on
future earnings
Disability
and
support
concerns
Main
scheme or
through
clearing?
Student
reviews and
concerns on
safety
89
90
26/03/2019
46
IN ASSOCIATION WITH
SUPPORTED BY
Minding and closing the gaps•••
T H E S E C R E T L I F E O F S T U D E N T S
Understanding Commuter Students
Dr Simon LewisHead of Strategic PlanningMiddlesex University
91
92
26/03/2019
47
© Middlesex University
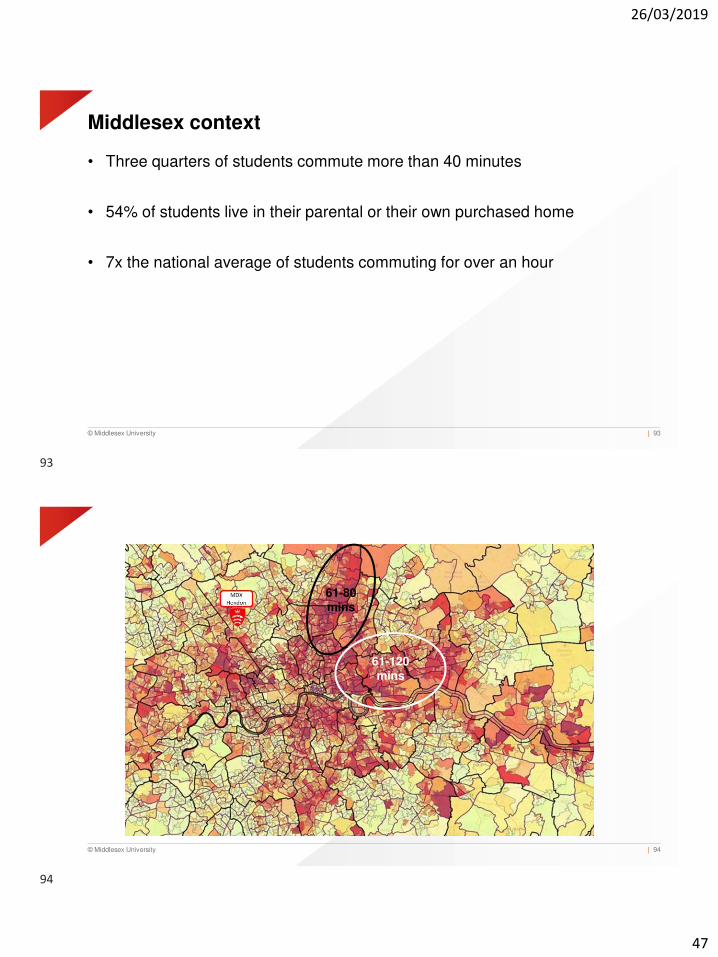
Middlesex context
• Three quarters of students commute more than 40 minutes
• 54% of students live in their parental or their own purchased home
• 7x the national average of students commuting for over an hour
| 93
© Middlesex University | 94
61-80 mins
61-120 mins
93
94
26/03/2019
48
© Middlesex University Presentation title | 95
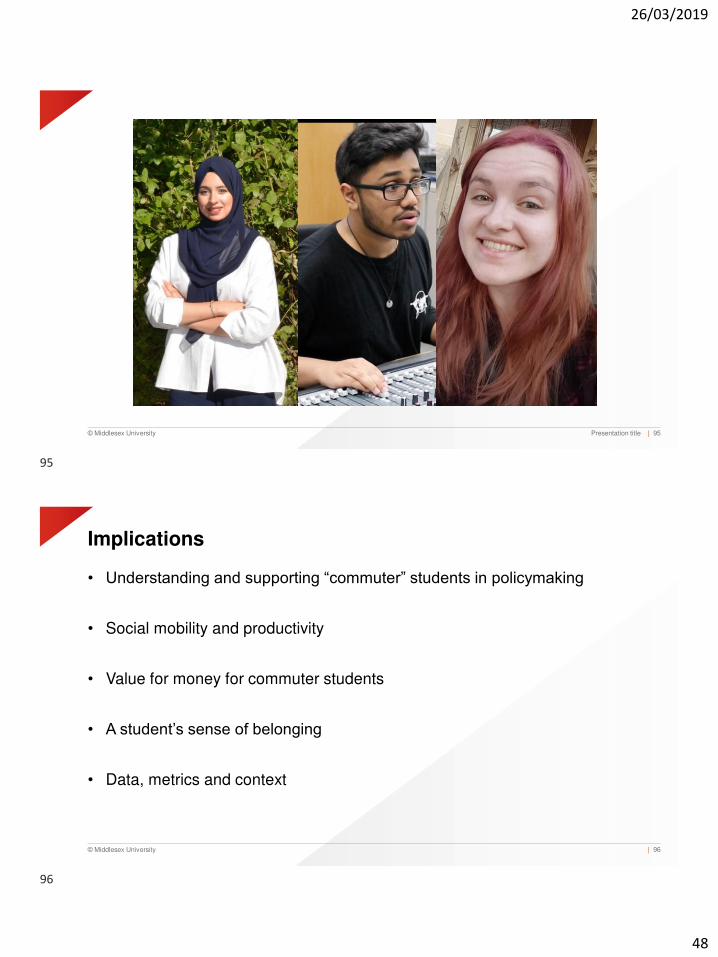
© Middlesex University
Implications
• Understanding and supporting “commuter” students in policymaking
• Social mobility and productivity
• Value for money for commuter students
• A student’s sense of belonging
• Data, metrics and context
| 96
95
96

26/03/2019
49
IN ASSOCIATION WITH
SUPPORTED BY
Minding and closing the gaps
T H E S E C R E T L I F E O F S T U D E N T S
IN ASSOCIATION WITH
SUPPORTED BY
The student environment•••
T H E S E C R E T L I F E O F S T U D E N T S
97
98
26/03/2019
50
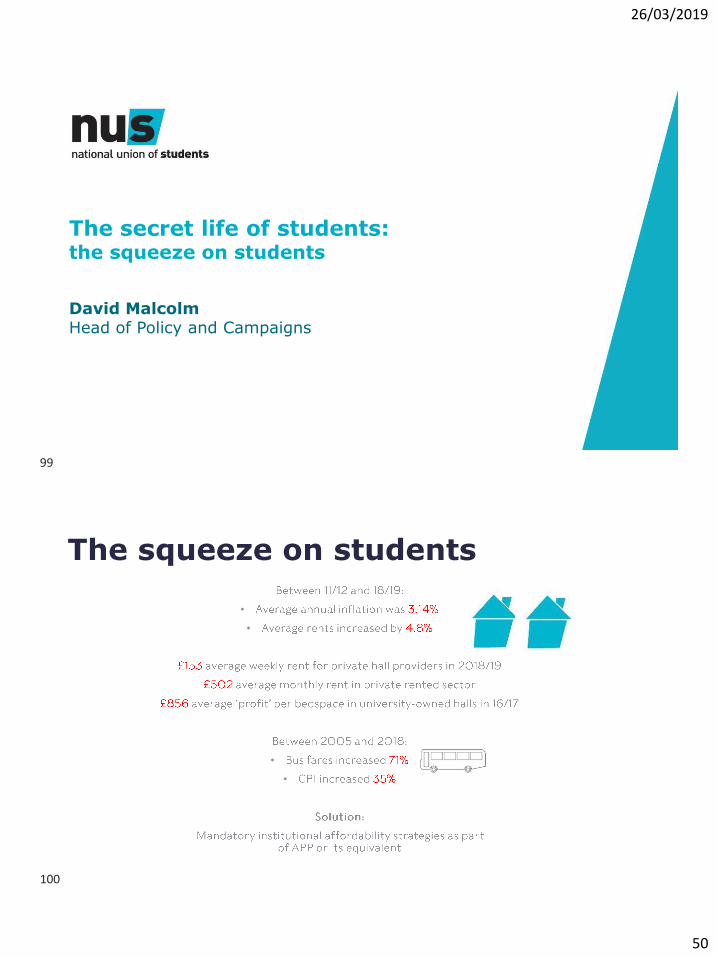
The secret life of students:the squeeze on students
David MalcolmHead of Policy and Campaigns
The squeeze on students
••
••
99
100
26/03/2019
51
101
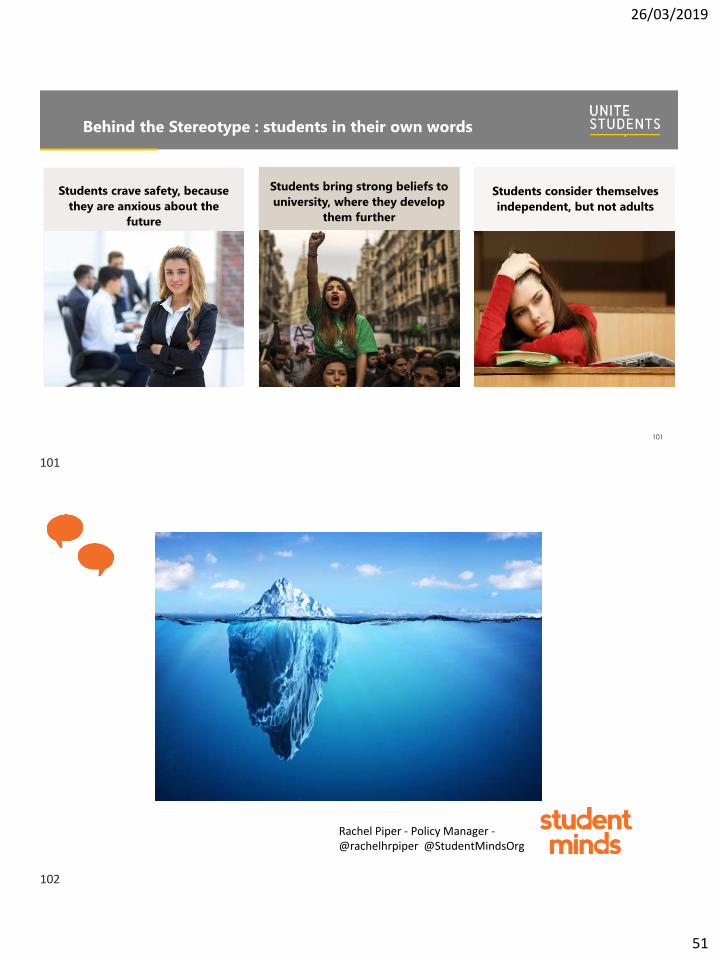
Behind the Stereotype : students in their own words
The Careerist The Activist The SnowflakeStudents crave safety, because
they are anxious about the
future
Students bring strong beliefs to
university, where they develop
them further
Students consider themselves
independent, but not adults
Rachel Piper - Policy Manager -
@rachelhrpiper @StudentMindsOrg
101
102

26/03/2019
52
Rachel Piper - Policy Manager -
@rachelhrpiper @StudentMindsOrg
IN ASSOCIATION WITH
SUPPORTED BY
Researching students for impact
•••
T H E S E C R E T L I F E O F S T U D E N T S
103
104
26/03/2019
53
•
•
•
•
•
•
•
•
•
•
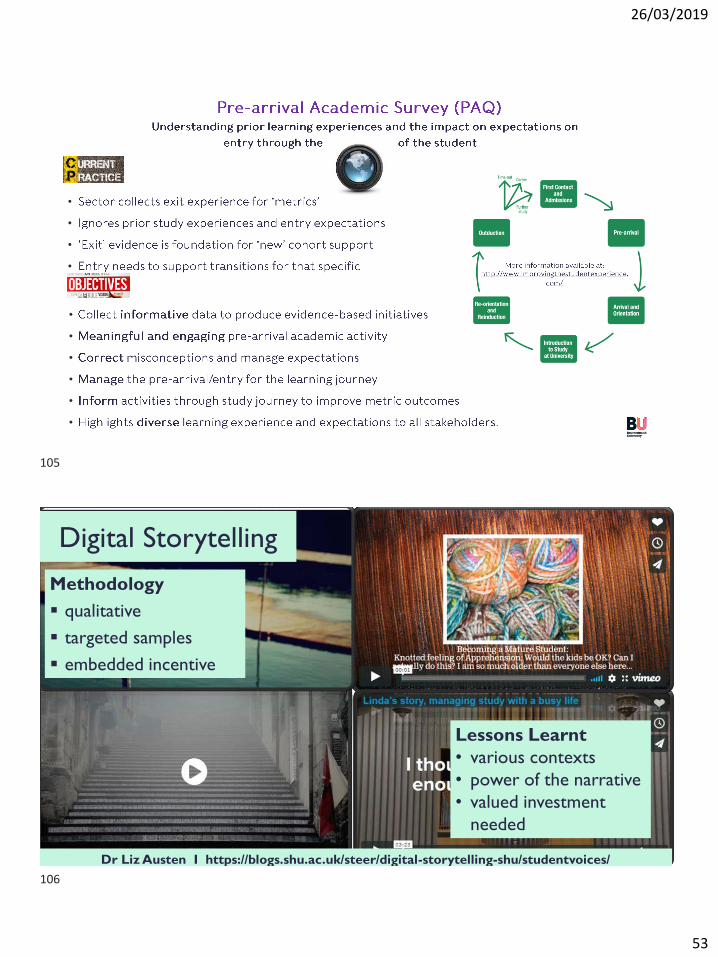
Digital Storytelling
Methodology
▪ qualitative
▪ targeted samples
▪ embedded incentive
Lessons Learnt• various contexts• power of the narrative• valued investment
needed
Dr Liz Austen I https://blogs.shu.ac.uk/steer/digital-storytelling-shu/studentvoices/
105
106
26/03/2019
54
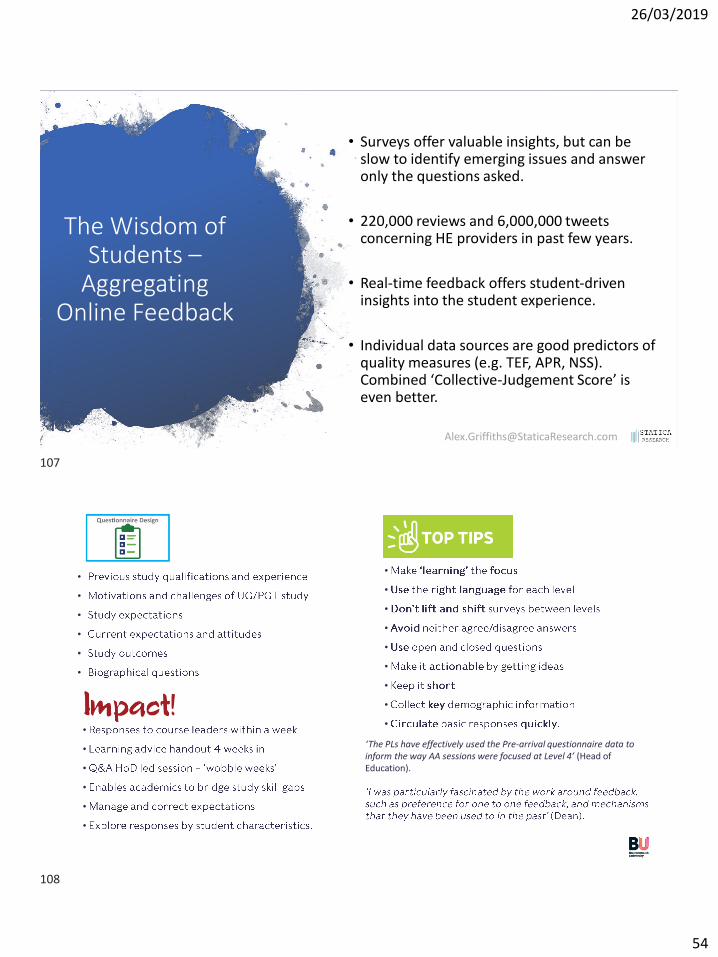
The Wisdom of
Students –Aggregating
Online Feedback
• Surveys offer valuable insights, but can be slow to identify emerging issues and answer only the questions asked.
• 220,000 reviews and 6,000,000 tweets concerning HE providers in past few years.
• Real-time feedback offers student-driven insights into the student experience.
• Individual data sources are good predictors of quality measures (e.g. TEF, APR, NSS). Combined ‘Collective-Judgement Score’ is even better.
•
•
•
•
•
•
•
•
•
•
•
•
•
•
•
•
•
•
•
•
•
‘The PLs have effectively used the Pre-arrival questionnaire data to
inform the way AA sessions were focused at Level 4’ (Head of
Education).
107
108

26/03/2019
55
Insight & Recommendations
• Different sources favour different types of feedback.
• WiFi, transport and environmental policy of real
importance to students.
• Higher education is complex, wide-ranging and unique; consistent
identification of concerns is challenging and ‘off the shelf’ tools will struggle.
• Timely identification of concerns can save
significant ill will, time, money, and reputational
damage.
Key Messages
▪ data privilege and methodological biases exists in policy-making and practice
▪ creative and innovative approaches must challenge the dominance of quantitative data
▪ creative and innovative approaches must acknowledge and seek out hidden voices
voices and experiences▪ triangulation is necessary - move away from reaction to a single data source
Dr Liz Austen I Sheffield Hallam University I @lizaustenbooth
109
110
26/03/2019
56
IN ASSOCIATION WITH
SUPPORTED BY
The rest of their lives•••
T H E S E C R E T L I F E O F S T U D E N T S
The
employability
conundrumMike Grey
Head of University Partnerships
@mikegradconsult
111
112
26/03/2019
57
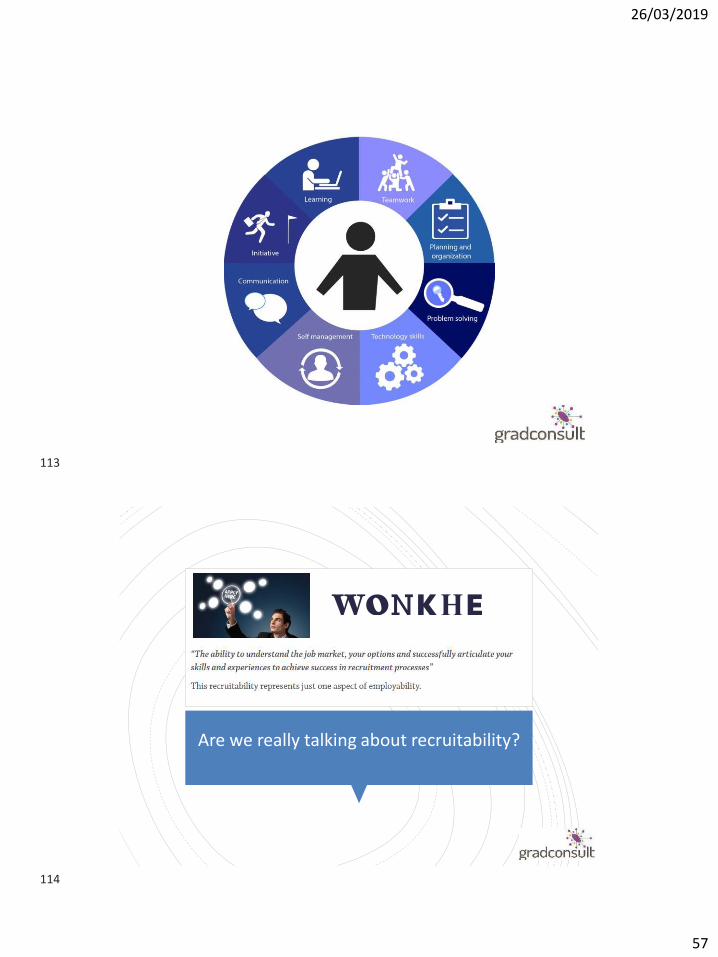
Are we really talking about recruitability?
113
114
26/03/2019
58
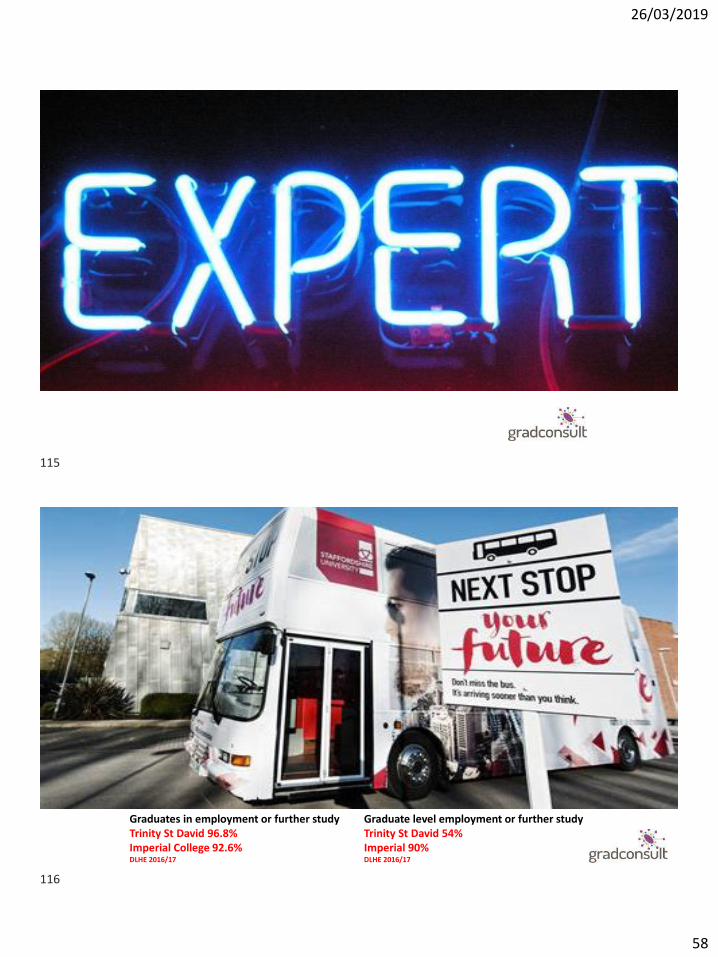
Graduates in employment or further study
Trinity St David 96.8%
Imperial College 92.6% DLHE 2016/17
Graduate level employment or further study
Trinity St David 54%
Imperial 90% DLHE 2016/17
115
116
26/03/2019
59
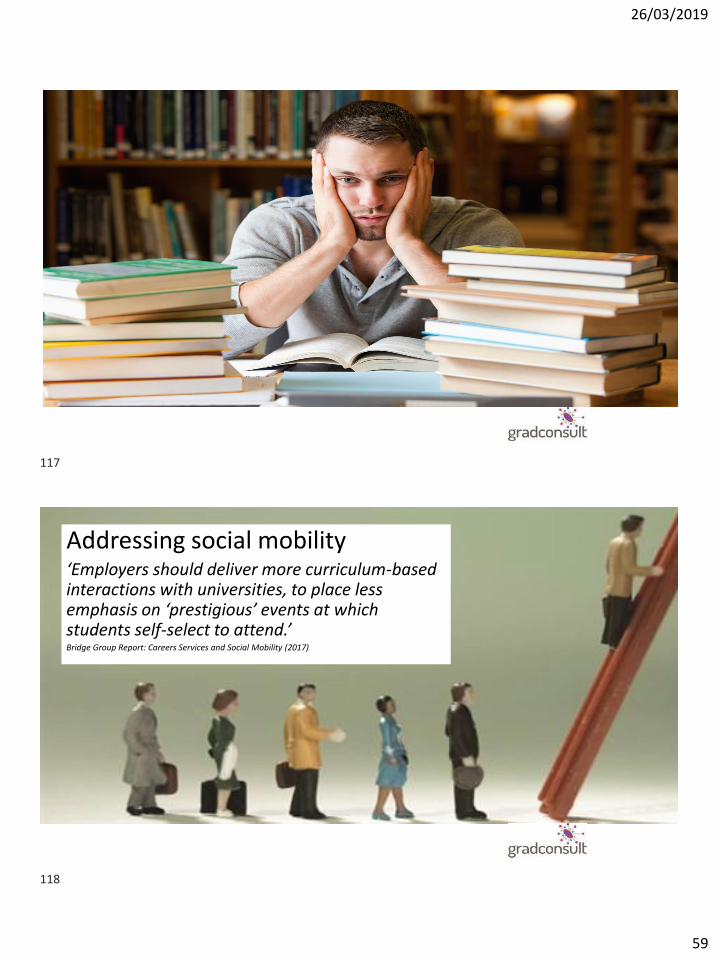
Addressing social mobility‘Employers should deliver more curriculum-based interactions with universities, to place less emphasis on ‘prestigious’ events at which students self-select to attend.’ Bridge Group Report: Careers Services and Social Mobility (2017)
117
118
26/03/2019
60
48% of undergraduate finalists are still in the “decide” stage of their career thinking(HEFCE Learning Gain Project: Careers Registration)
119
120
26/03/2019
61
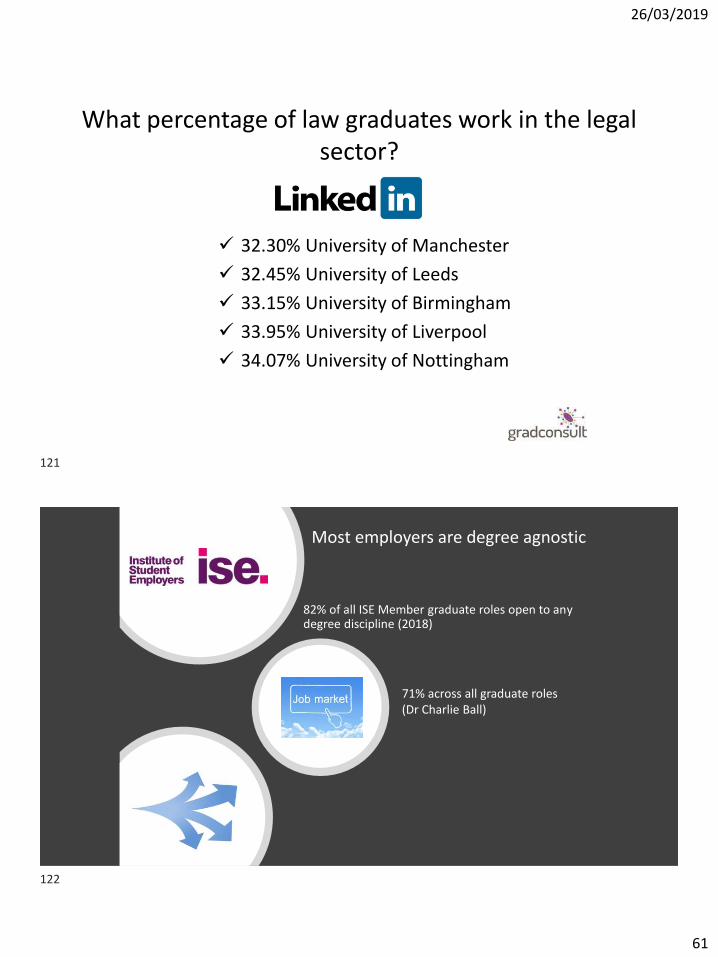
What percentage of law graduates work in the legal
sector?
✓ 32.30% University of Manchester
✓ 32.45% University of Leeds
✓ 33.15% University of Birmingham
✓ 33.95% University of Liverpool
✓ 34.07% University of Nottingham
Most employers are degree agnostic
82% of all ISE Member graduate roles open to anydegree discipline (2018)
71% across all graduate roles
(Dr Charlie Ball)
121
122
26/03/2019
62
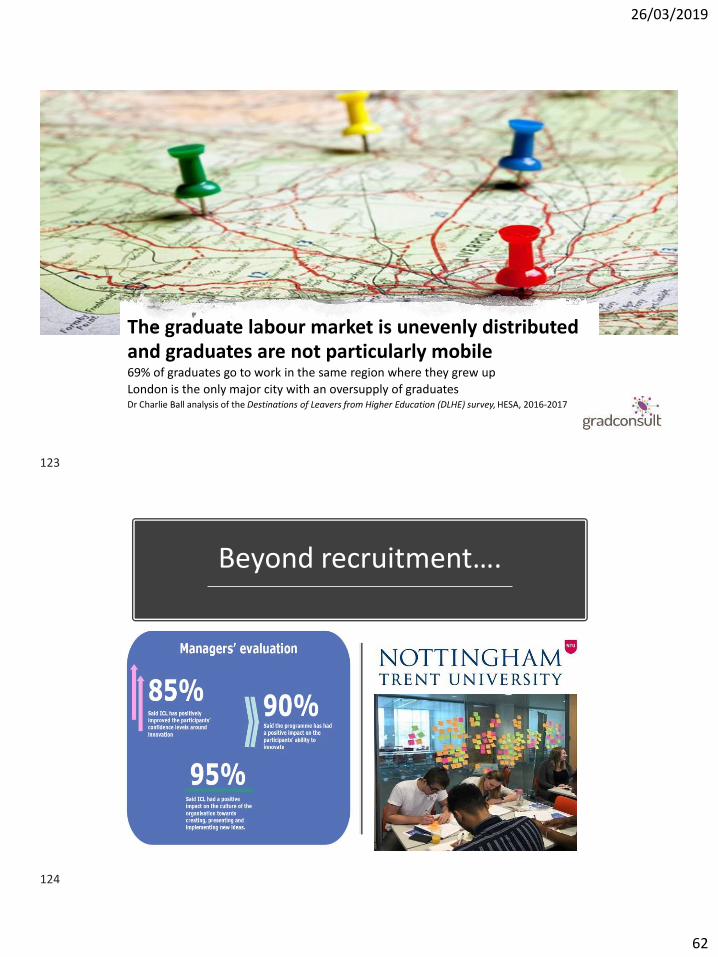
The graduate labour market is unevenly distributed
and graduates are not particularly mobile69% of graduates go to work in the same region where they grew up
London is the only major city with an oversupply of graduatesDr Charlie Ball analysis of the Destinations of Leavers from Higher Education (DLHE) survey, HESA, 2016-2017
Beyond recruitment….
123
124
26/03/2019
63
125
126
26/03/2019
64
Enrolments on sandwich placement courses increased by 59% between
2009-10 and 2017-18
180,705 enrolled in 2017-18(HESA)
127
128
26/03/2019
65
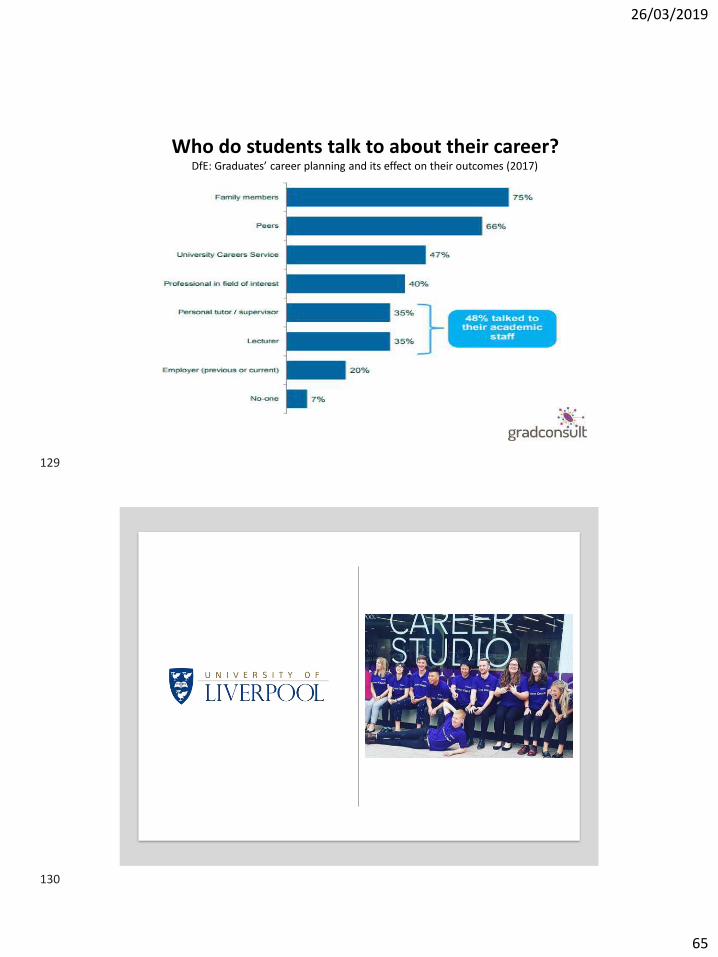
Who do students talk to about their career?DfE: Graduates’ career planning and its effect on their outcomes (2017)
129
130
26/03/2019
66
Value for money?87.5% of leavers said they were satisfied with their career to date
(HESA Longitudinal DLHE of 107,340 in 2016/17)
Mike Grey, Head of University Partnerships
T: +44 (0)7402 029932
@mikegradconsult
131
132
26/03/2019
67
Heads of Service Conference 2018#AGCASHOS18
©AGCAS 2018
What do careers look like
for today’s students?
Elaine Boyes
AGCAS Executive Director
Heads of Service Conference 2018#AGCASHOS18
©AGCAS 2018
Who are AGCAS?
The Association of Graduate Career Advisory Services (AGCAS) represents 82% of careers services within the UK HE sector
133
134
26/03/2019
68
Heads of Service Conference 2018#AGCASHOS18
©AGCAS 2018
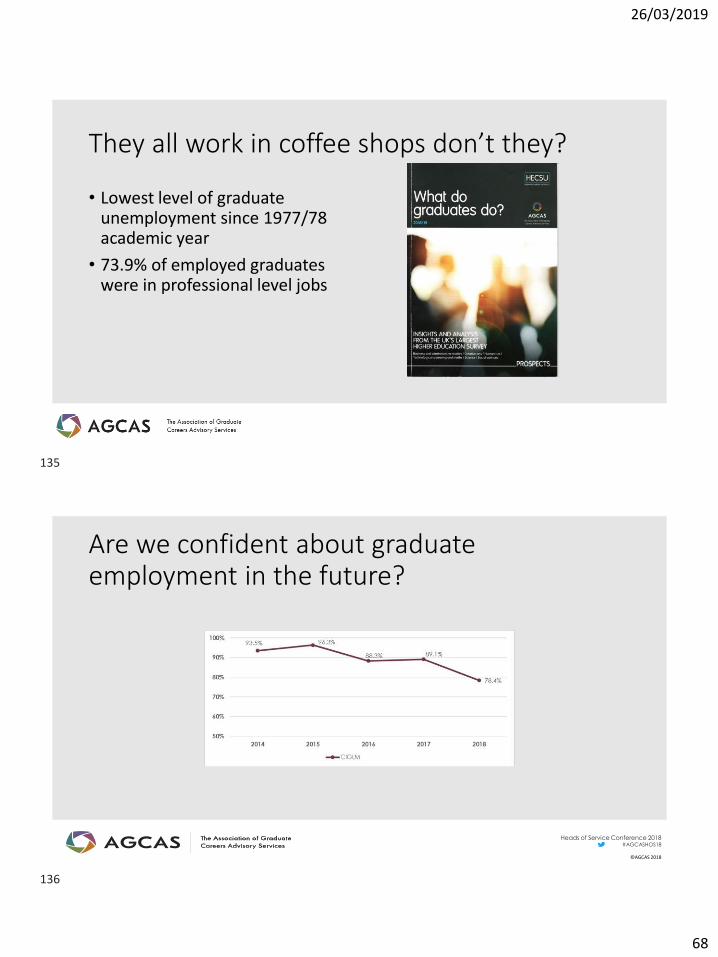
They all work in coffee shops don’t they?
• Lowest level of graduate unemployment since 1977/78 academic year
• 73.9% of employed graduates were in professional level jobs
Heads of Service Conference 2018#AGCASHOS18
©AGCAS 2018
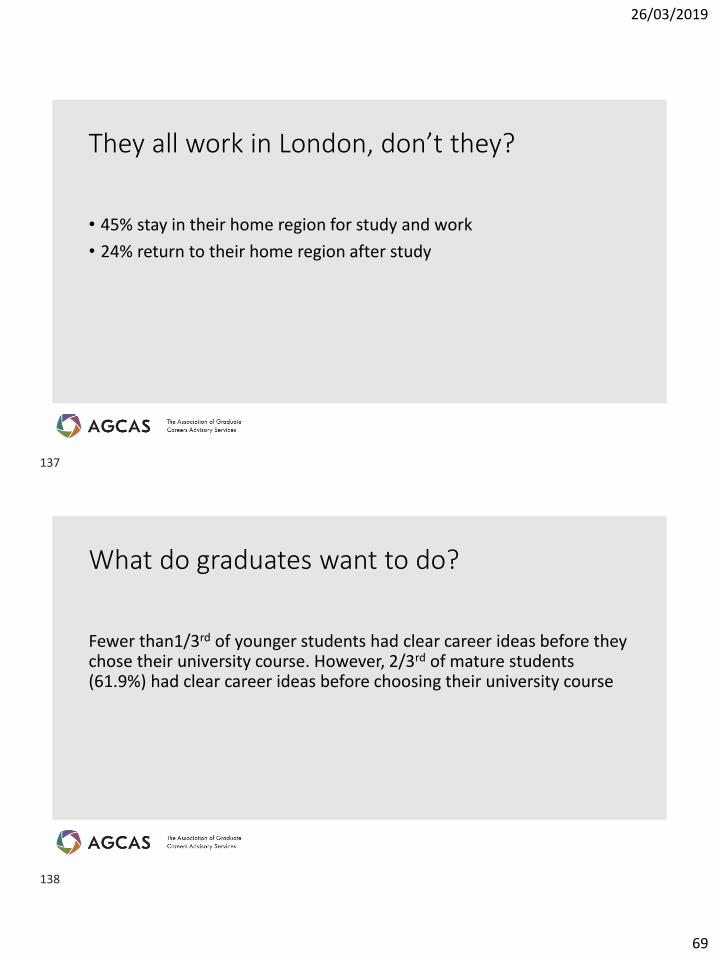
Are we confident about graduate
employment in the future?
135
136
26/03/2019
69
Heads of Service Conference 2018#AGCASHOS18
©AGCAS 2018
They all work in London, don’t they?
• 45% stay in their home region for study and work
• 24% return to their home region after study
Heads of Service Conference 2018#AGCASHOS18
©AGCAS 2018
What do graduates want to do?
Fewer than1/3rd of younger students had clear career ideas before they chose their university course. However, 2/3rd of mature students (61.9%) had clear career ideas before choosing their university course
137
138

26/03/2019
70
Heads of Service Conference 2018#AGCASHOS18
©AGCAS 2018
Heads of Service Conference 2018#AGCASHOS18
©AGCAS 2018
Employability – it’s essential
139
140
26/03/2019
71
Heads of Service Conference 2018#AGCASHOS18
©AGCAS 2018
In conclusion
• Graduates are likely to be in graduate level employment
• They probably work in a city outside London in their home region
• Most students start university not knowing what they want to do
• AGCAS members are fairly confident about the labour market
• Employability matters
Heads of Service Conference 2018#AGCASHOS18
©AGCAS 2018
AGCAS Reports
• What do Graduates do?
(https://luminate.prospects.ac.uk/what-do-graduates-do)
• AGCAS First Year Career Readiness Survey 2017/18
• AGCAS HE Careers Service Survey Report 2018
(https://www.agcas.org.uk/AGCAS-Research)
141
142
26/03/2019
72
Heads of Service Conference 2018#AGCASHOS18
©AGCAS 2018
Other References
• ISE Pulse Report 2019
(https://luminate.prospects.ac.uk/graduate-employers-optimistic-for-2019-recruitment)
• Early Career Survey 2018 (https://luminate.prospects.ac.uk/early-careers-survey)
• OfS Clallenge Competition: Industrial strategy and skills – support for local students and graduates (https://www.officeforstudents.org.uk/publications/ofs-challenge-competition-industrial-strategy-and-skills-support-for-local-students-and-graduates/)
• The reality of graduate migration (https://luminate.prospects.ac.uk/the-reality-of-graduate-migration)
Heads of Service Conference 2018#AGCASHOS18
©AGCAS 2018
Email:
[email protected]: @AGCAS
143
144
26/03/2019
73
Is being good, good business?Dasha Karzunina
Head of Research, Trendence UK
The Ethics Survey
• 1,523 respondents
• 96 universities
• All year groups
• Do undergraduates care about ethics?
• Should employers be concerned?
• What can universities do?
145
146
26/03/2019
74
Point 1: Students
Care
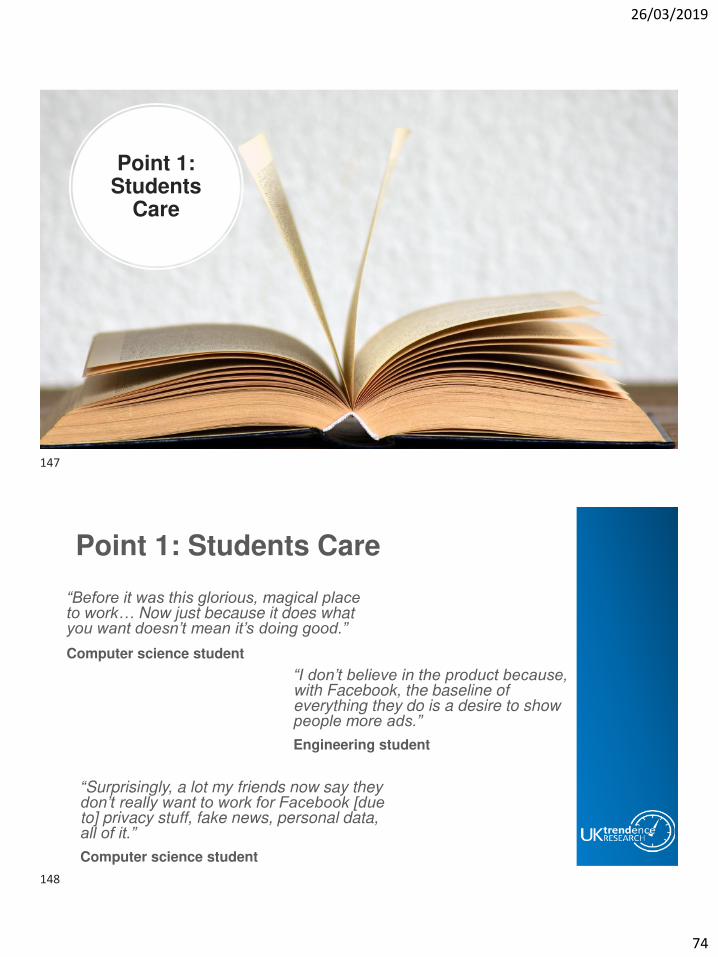
Point 1: Students Care
“Before it was this glorious, magical place to work… Now just because it does what you want doesn’t mean it’s doing good.”Computer science student
“Surprisingly, a lot my friends now say they don’t really want to work for Facebook [due to] privacy stuff, fake news, personal data, all of it.”Computer science student
“I don’t believe in the product because, with Facebook, the baseline of everything they do is a desire to show people more ads.”Engineering student
147
148
26/03/2019
75
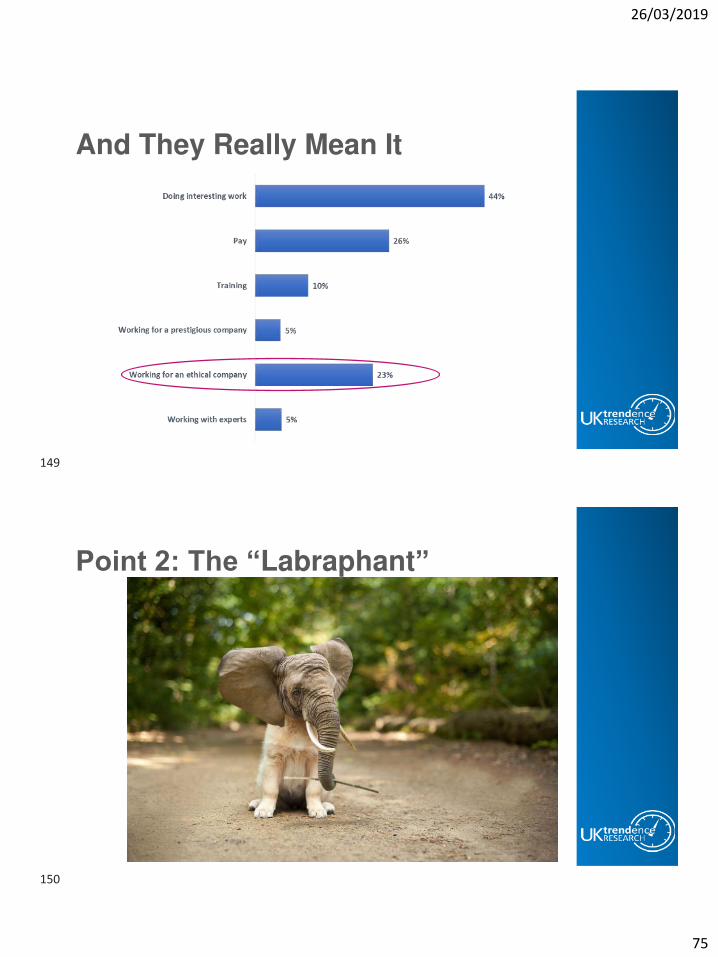
And They Really Mean It
Point 2: The “Labraphant”
149
150
26/03/2019
76
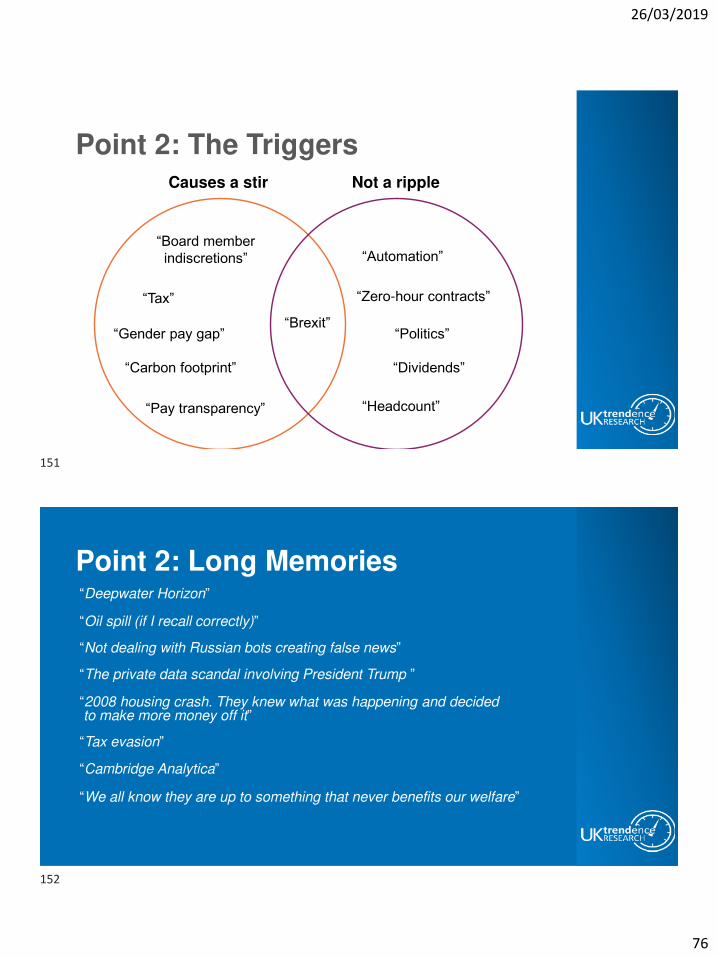
Point 2: The Triggers
“Tax”
“Carbon footprint”
“Gender pay gap”
“Automation”
“Zero-hour contracts”
“Pay transparency”
“Politics”
“Board member indiscretions”
Causes a stir Not a ripple
“Dividends”
“Headcount”
“Brexit”
Point 2: Long Memories“Deepwater Horizon”
“Oil spill (if I recall correctly)”
“Not dealing with Russian bots creating false news”
“We all know they are up to something that never benefits our welfare”
“The private data scandal involving President Trump ”
“Cambridge Analytica”
“Tax evasion”
“2008 housing crash. They knew what was happening and decidedto make more money off it”
151
152
26/03/2019
77
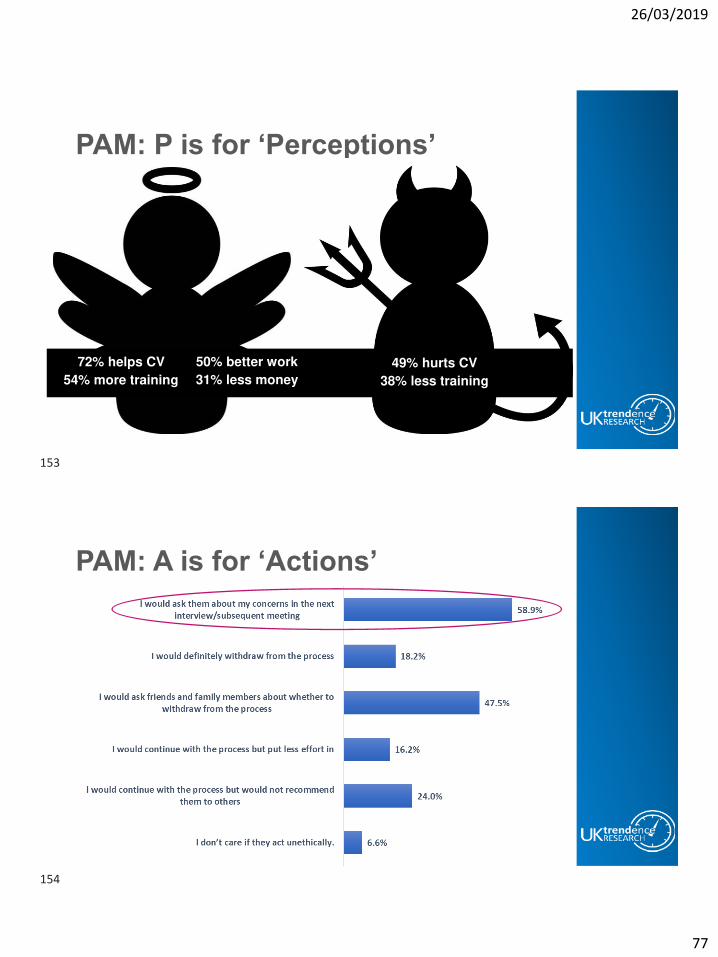
PAM: P is for ‘Perceptions’
49% hurts CV
38% less training
50% better work
31% less money
72% helps CV
54% more training
PAM: A is for ‘Actions’
153
154

26/03/2019
78
PAM: M is for ‘Morality premium’ aka Money!
• 41% people expect more money
• Meaning £5,650 extra per person
• £500,000 extra salary costs per 100
graduate hires
Point 4: Reputation Not a Campaign
155
156

26/03/2019
79
Point 5: Ethics need to be a key part of the story
Authenticity Point of
difference Culture
Key Takeaways
• Make people aware that ethics are important
• Do your research
• Be prepared (have an answer for students when they ask)
• Support students in aligning future careers with their own values → more ethical labourmarket for all
157
158