90. ~* ~. (v51; - dtic*cavitation, / rectified diffusion.< biological ,,f fectsj bubbles...
TRANSCRIPT
"rrrrrrr r r 'r' - r 'r a- -- r - 1
:4•' lw
4090. ~* ~.
4 rtor4
(V51;
-j rc
Lne
lowC
NO 'Y Ax'' r*
t 4.
-HEUNWIOLOGIO MIS
PH USI RVITI TO
N-51c AND
0$A
V, Yf4{~s 4r~ ~4Fit
Approved for Public Release: Distribution Unlimited
Technical Report for* Office of Naval Research
Contract N00014-84-C-0193
O BIOLOGICAL EFFECTS
OF
ACOUSTIC CAVITATION
by
Lawrence A. Crum --
Physical Acoustics Research LaboratoryDepartment of Physics and Astronomy ' CTE
The Univers try otf Missf ss ippi..
University, MS .3807//JU? 998
i Rcp. rodur L L in whPole I ,r 1i part iS [,trmf t Lcd I. or sn y p urJt) .( b v
1~1i~ IHUT~ON TATLML)I'
A; p oved eor pn o ic relc, ee 0i D )IS lIX.b u) (- 1 Un U lim i!( "
UnclassifiedSECURITY CL OSSIFICA rioN OF Te.!- PAGE (Wen Dn Vata E ,ed)
REPORT DOCUMENTATO0N PAGE READ INSTRUCTIONS___3EFORE COMPLETING FORM
RFWORT NUMBER 12 GVT A-CEIO 3. REC!PIENTiS CAT.LOG NuMBFfl
3-85__ ___ _
TS TYPE OF REPORT & PERIOD COVERED
- Biological Effects of Acoustic Cavitation Technical
6. PERFORMING ORG. REPORT NUMBER
"7. AUTHOR(a) 6. CONTRACT OR GRANT NUMBER(&)
*Lawrence A. Crum N00014-84-C-0193
V. PERFORMING ORGANIZATION NAME AND ADDRESS 10. PPOGRAM ELEMENT. PROJECT, TASKAREA & WORK UNIT NUMBERS
Physical Acoustics Research LaboratoryDepartment of Physics and Astron~omyThe University of MS., University$. M,$__8677_
11. CONTROL!LING OFFICE NAMr AND ADDRESS 12. REPORT DATE
June 15, 198513. NUMSER OF PAGES
9414. MONITORING AGENCY NAME & AODRESS(iV different from ControIllng Office) IS. SECURITY CLASS. (of this report)
Unclassifiedro fi.5. DECLASSIFICATION/DOWKGRADING
SCHEDULE
16. DISTRIBUTION STATEMENT (of this Relport)
Approved for Public Release: Distribution Unlimited
IT. DISTRIBUTION STATEMEWT (of th. ebtreci entered In Block 20, II different from Report)
I8. SUPPLEMENTARY NOTES
19. KEx.*5xAW1 (Continue on reoe...e aide If neca.eewy end Identifiy by blockR ri- bar)
*Cavitation, / Rectified Diffusion.<Biological ,,f fectsjBubblesNucleation2Nonlinear Osci.llation.
n APS1 RACT (Coriinuo wi r,.eree aide ift n..c.. ry mid Id tlftiy bý t'l- k n•.ber)
-L)['hJs report. conta ins the lectiure notes of the "iuut'ior for a s•hort cturse
entitled 6B1ioulogical Effects of Acoustic( C>vitation" presented -it the Jni.ver-
iyo Rochester, MNa.y 1.3-16, 1985.L .& "t 4 k-
e•oTh- I•7 •',ro, o• I NOV U 0.• os~OLLTE
DD )No7 4 3 1 1 1 F ) 4 66 1c I as s Ltf iý e-- w IdV6 80117EA
SECURITY NPAG( (W 1). e. X,, l t->F ).. . .
-------------'
BIOLOGICAL EFFECTSOF
ACOUSTIC CAVITATION
Lecture 2
.Nucleation, rectified diffusion, stable cavitationand experimental measurementso • 0 •-
__".. r311/
Accession For
NTIS GRA&IDTTC TABlJ: im'ouneed E
by Ju tification _•-
Bv--
Di r"ibotion/Lawrence A. Crum
Avzilahi Jty Codssaind/or
Physical Acoustics R.Ž3earch Group
Departmerit of Physics and Astronomy"The University of Mississippi
Un ivers ity, MS 38677
LECTURE NO. 2
LAWRENCE A. CRUM
* TABLE OF CONTENTS
I. Stabilization and Nucleation of Cavitation Nuclei>.
Various Physical models . .......................................... I
A. Free bubbles .............................................. 3
B. Ionic charges ............................................ . 4
C. Organic skins ............................................. 4
D. Crevice model ............................................. 11
i. gas-filled cavity ..................................... 14
ii. vapor-filled cavity ................................... 16
E. Nu eationin ..................................... 22
Ii. Rectified Diffusion,
A. Introduction .............................................. 28
B. The Governing equations ..... ............. ............... 31
C. Simplified equations ...................................... 38
D. Experimental technique for examining rectified diffusion .. 39
E. Some experimental results .................................. 41
F. Observations and comments ................................. 54
lII.'Stable Cavitacion'
A. Introduction .............................................. 57
"B. Some governing equations .................................. 57
C. Nonlinear behavior of the bubbles ........................... 60
D. Harmonics, subharmonics and noise ......................... 63
E. Bubble chaos .............................................. i)5
IL i-'. Sonoluminescence rrom stable c Vi t i T ................... 9
G. Conclud nin( remarks ........................................ 74
Pr s , - .... . . .
IV. 'Experimental Measurements of Cavitation Produced by Short Acoustic
Pulses, . ",
*A. Introduction................................................. 77
B. Experimental procedure .................... ........... .. 77
C. Results ............................... ......... 82
D. Some final concluding comments ............................ 87
V. List of References . .............................................. 89
- -
40
. •, - • • • - - . • . ,, /. .,.,• • ° • • " "- • '- .. " + " • • • • - • .. . ." -. • + - • + • -+ • ,,, m•g,,. . •,+ :+,•:"- "N:,
I. Stabilization and Nucleation of Cavitation Nuclei
It is rather well known that liquids possess a tensile strength sever-
al orders of magnitude less than predicted due to the presence of inhomoge-
neities suspended in the bulk of the liquid. These preferential sites for
*Q liquid rupture are commonly called nuclei and are presumed to be small
pockets of undissolved gas. The fact that experiments [1] involving small
samples cf liquids that do not possess nuclei gives values of the tensile
- strength close to the value predicted by theory indicates rather con-
clusively that these nuclei do exist and essentially determine the experi-
mental tensile strength of liquids.
CO Before we consider the various models that have been suggested as
possible candidates for cavitation nuclei, it is important to keep fresh in
our minds a rather remarkable fact concerning transient cavitation - no
matter where one makes the measurement (in a geographical sense), one finds
that there exists a rather sharply defined threshold acoustic pressure
below which cavitation rarely occurs. (A similar threshold exists for
many aspects of stable cavitation, although it is not so sharply observed).
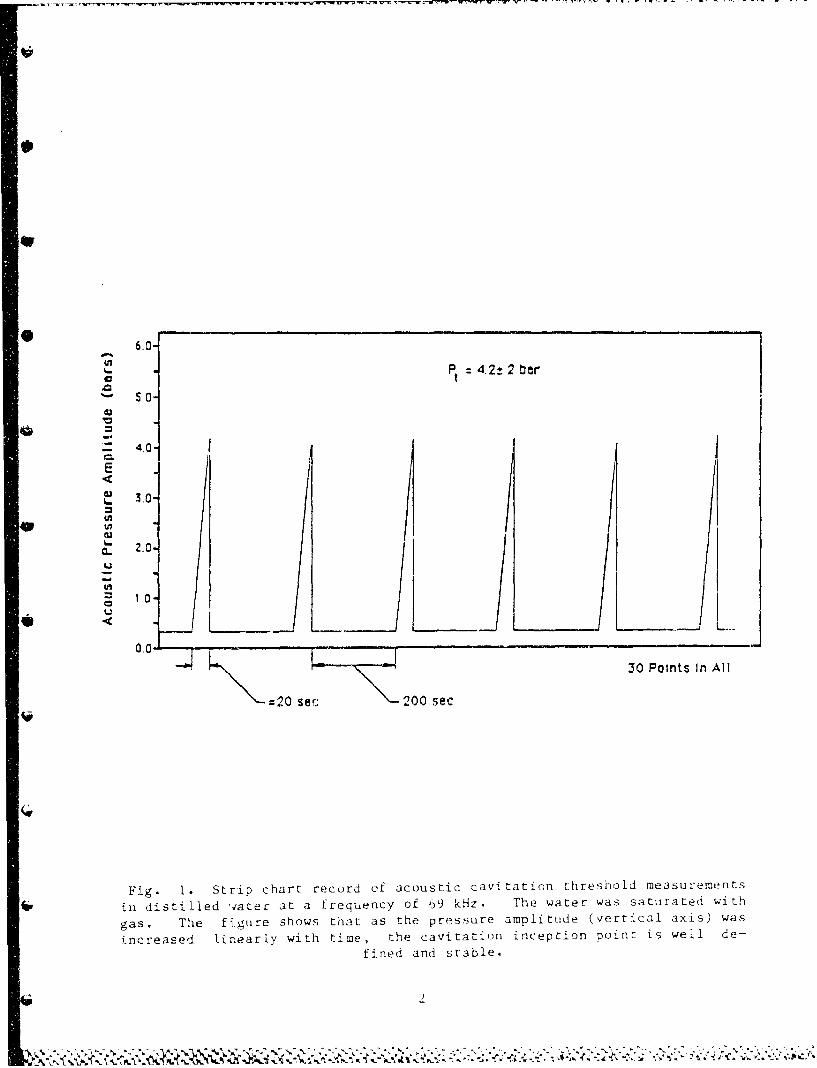
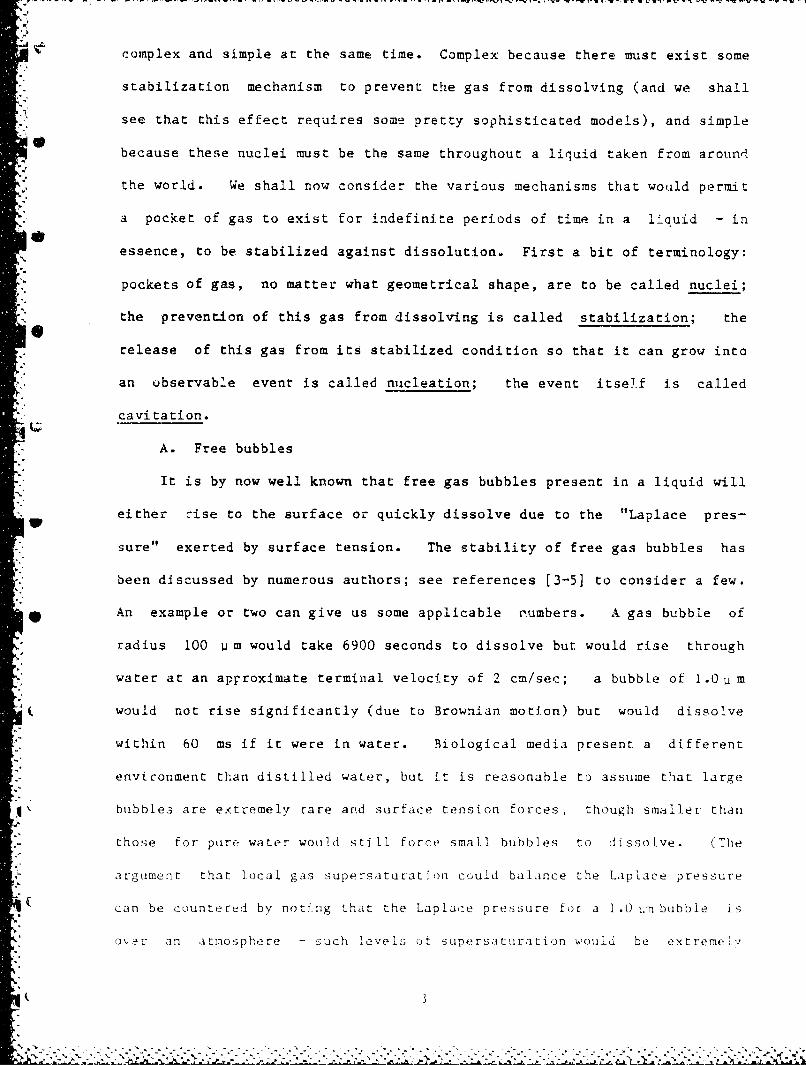
For example, consider Fig. 1 which shows some raw data [21 taken from a
measurement of the acoustic cavitation threshold of water. Using an objec-
tive detection criterion, i.e., the detection of a sonoluminescence pulse
• of a predete.mined minimum height, all 30 measurements taken over a period
of 2 hours gave peak acoustic threshold pressures within a range of a db or
so. We shall have to conclude that the "im ',geneiries are rather homoge-
neous".
Having accepted the experimental fact that nuclei exist, and are
essentially pockets of gas, we can quickly discover that they must be both
•AK
6.0-
Pt 4.2i2 barC
•-. 5.0
-. 4.0
E
3 3.0
0C 2.0
U
_-- L - -
0.0 A30 Points In All
=20 sec 200 sec
Fig. I. Strip chart record of acoustic cavi tation threshold measur1ements
in distilled vater at a frequency of 69 kHz. The water was saturated with
gas. The figure shows that as the pressure amplitude (vertical axis) was
increased linearly with time, the cavitation inception point is well de-
fined and stable.
I%..
* complex and simple at the same time. Complex because there must exist some
*- stabilization mechanism to prevent the gas from dissolving (and we shall
see that this effect requires some pretty sophisticated models), and simple
because these nuclei must be the same throughout a liquid taken from around
• the world. We shall now consider the various mechanisms that would permit
a pocket of gas to exist for indefinite periods of time in a liquid - in
essence, to be stabilized against dissolution. First a bit of terminology:
pockets of gas, no matter what geometrical shape, are to be called nuclei;
the prevention of this gas from dissolving is called stabilization; the
release of this gas from its stabilized condition so that it can grow into
an observable event is called nucleation; the event itself is called
"cavitation.
A. Free bubbles
It is by now well known that free gas bubbles present in a liquid will
either rise to the surface or quickly dissolve due to the "Laplace pres-
sure" exerted by surface tension. The stability of free gas bubbles has
- been discussed by numerous authors; see references [3-5] to consider a few.
"* An example or two can give us some applicable numbers. A gas bubble of
radius 100 U m would take 6900 seconds to dissolve but would rise through
water at an approximate terminal velocity of 2 cm/sec; a bubble of 1.0 • m
-• would not rise significantly (due to Brownian motion) but would dissolve
within 60 ms if it were in water. Biological media present a different
environment than distilled water, but it is reasonable to assume that large
bubbles are extremely rare and surtace tension forces, though smaller than
those for pure water would still force small bubbles to dissolve. (The
argument that local gas supersaturation could balance the Laplace pressure
can be countered by noting that the Laplace pressure tor a 1 .0 urm bubble is
o 1er an atmosphere - such levels of s3upersaturation would be extremelv
4.
rare.)
B. Ionic charges
Akulichev (6] has suggested that free ions present in a liquid could
stabilize a pocket of gas by Coulomb repulsion. He has presented support-
ing evidence that indicates that the concentration of certain hydrophobic
ions can significantly affect the cavitation threshold of aqueous solu-
tions. We have examined this model also and can verify that the acoustic
cavitation threshold is significantly affected by the dissolved ion concen-
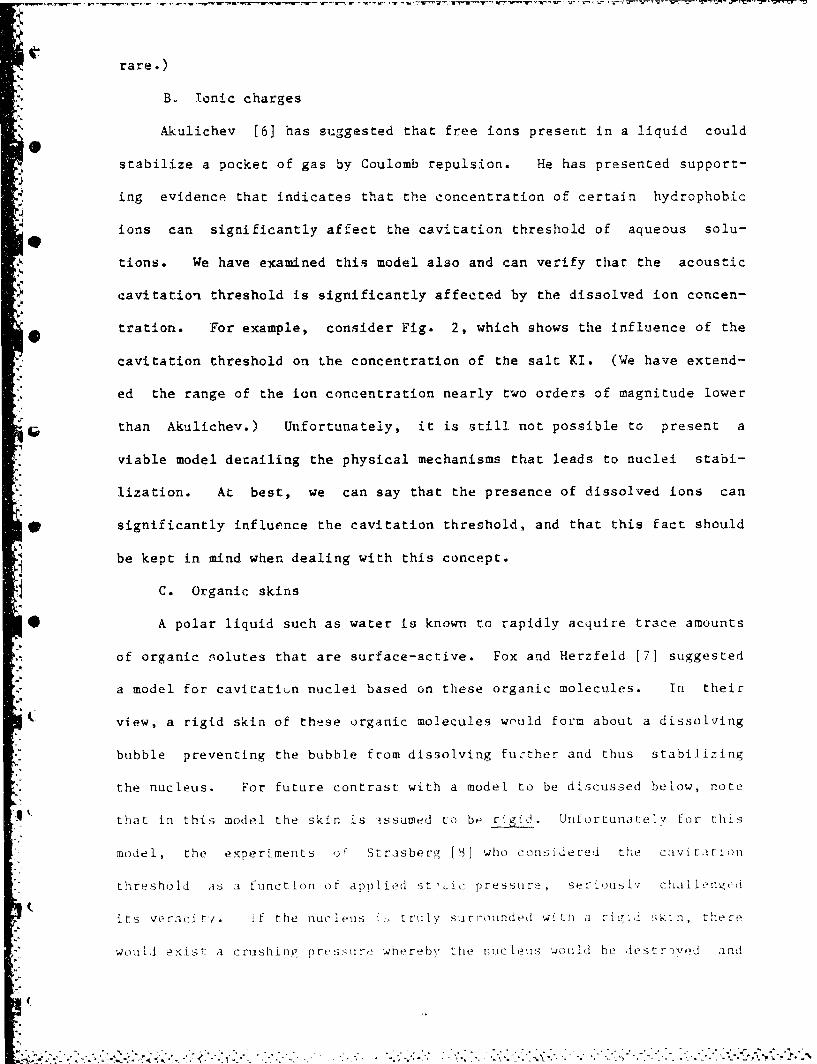
tration. For example, consider Fig. 2, which shows the influence of the
cavitation threshold on the concentration of the salt KI. (We have extend-
*. ed the range of the ion concentration nearly two orders of magnitude lower
than Akulichev.) Unfortunately, it is still not possible to present a
viable model detailing the physical mechanisms that leads to nuclei stabi-
lization. At best, we can say that the presence of dissolved ions can
* significantly influence the cavitation threshold, and that this fact should
be kept in mind when dealing with this concept.
C. Organic skins
-- A polar liquid such as water is known to rapidly acquire trace amounts
of organic solutes that are surface-active. Fox and Herzfeld [7) suggested
a model for cavitation nuclei based on these organic molecules. In their
view, a rigid skin of these organic molecules would form about a dissolving
*" bubble preventing the bubble from dissolving further and thus stabilizing
the nucleus. For future contrast with a model to be discussed below, note
that in this model the skin is aissumed to be ri6g d. Unfortunateiv for this
model, the experiments o Strrasbe rg [81] who conside red the cavi. ltrion
threshold as a function or apolied st, i," presstiro, seriously challen•,gtd
sit. ver acI t'-. if the uclleus i ... truly surrournded wi th a r-i•'d skin, there
wo Ild exist-. a c riis hi ng pres sre whereby the nuc Leus w4ould be iestrroved and
2..
151
In
In
Ln
-2 -101
LOG ION CONC.. (mMOL/L)
VVirlitaotio or Ithe acou1!ýtic co'Vir, tit0(l throýShc d Ot di"I4. (;I edwu:with concentr.-3tioni of Kb. rhe f requenc'J Was r~Q klfz :nd t.rie di ,s s o 1,e d ;A S"ohiceflt ra ri oil was3h o s ;r-11r-oI L) 11 .n - he Jaoohtd l ine Lh~ he pry '~voln;
re ot \c i iclihe v tn thit were ma~de. aL lower ocnrn:tio
the threshold would approach the theoretical limit. Strasberg's measure-
ments which indicated a monotonic increase in threshold with applied static
9 pressure, rather than a sharp discontinuity, prompted even Herzfeld to
subsequently reject the model [9].
"A modified Herzfeld-Fox model was then introduced by Sirotyuk [10] who
gave few details but argued that surface active molecules could stabilize a
gas bubble from dissolution. The experimental evidence given by Sirotyuk
in support of the model is, in the view of the author, considerably flawed.
However, there is probably considerable merit in the model, as properly
.- modified by Yount.
Yount [11-151 has developed the surface active agent concept into a
detailed and sophisticated model that explains a considerable volume of
data obtained from studies of bubble formation in super-saturated gelatine,
SSince this model appears to have experimental support, and since 't seems
t- to have a specific applicability to situations involving organic solutions,
it is appropriate to consider this model in more detail when considering
nucleation in biological systems. (An excellent and detailed review of
this model has been accomplished by Atchley [161 ; much of the following
discussion is taken from this dissertation.)
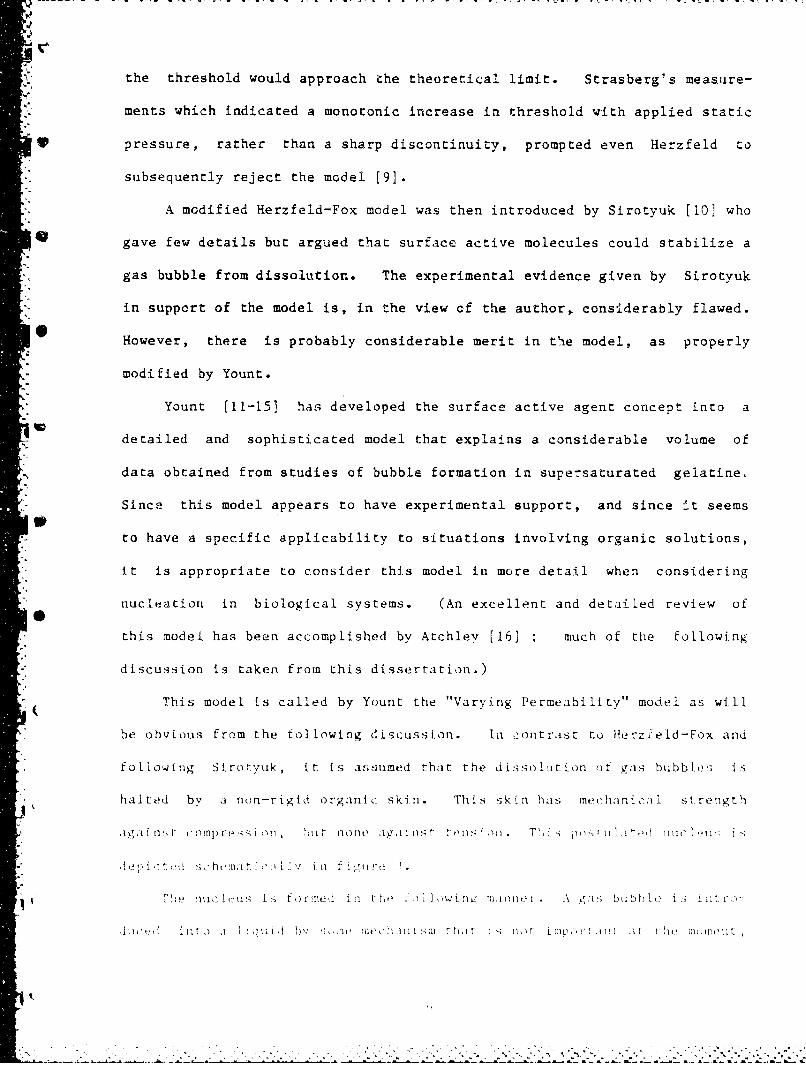
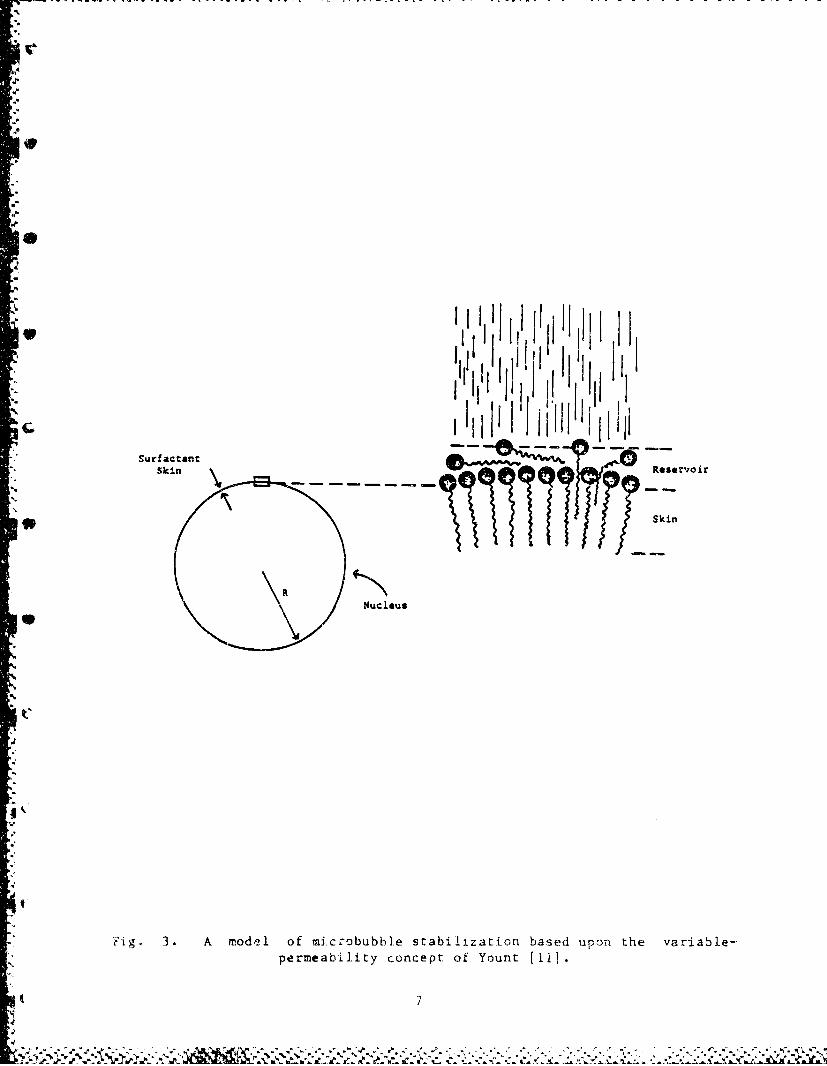
This model is called by Yount the "Varying Permeability" model as will
be obvious from the following discussion. In oontrast to Herz-eld-Fox and
f fo iowing Sirotyuk, it is assumed that the dissoLtation ot gas bubbles; iS
h halted by a non-rigid organic skin. This skin has nechanio:ail st rength
d aL nnrt! : cilt ,L1. ion r, t; nIne Oclnios ;l . i ; Inl Tio s _, i '.
Ni -. 1, 11 . J 5 dl o* 11t" -1 I. I*I! .It*i l , I L !i 1L
-p
.41
•-i~ll j~i[jII1,
SurfactancSkinW Reservoir
Skin
Nucleus
S
_-5
'Fig. 3. A model of microbubble stabilization based upon the variable-permeability concept of Yount [1i}.
7
.4
and begins to dissolve. While the dissolution takes place, surface active
molecules accummulate on the surface. Eventually, within minutes or se-
conds, the density of these surfactants is such that they resist the
collapse of the bubble. This is presumably a Coulomb interaction. These
molecules are polar (or perhaps even carry a net charge) and align them-
selves such that their polar "heads" face outward (toward the water) and
their tails (typically hydrocarbons) stick inward. Thus, as the density
increases, the separation of the heads becomes small enough for dipole
fields to become important. Of course, one would expect that if the sur-
factants were charged, the density at which stabilization occurs would be
-2 -3lower because monopolar fields vary as r rather than r
Once the critical density is reached, the radius of the nucleus may
vary through changes in the number of molecules on the skin. The equili-
brium condition for this aucleus is that the electrochemical potentials of
*g the skin and the reservoir must be equal. The reservoir is a thin (perhaps
monomolecular) layer of non-aligned surfactants which surrounds the skin of
aligned molecules. This equilibrium condition can be satisfied by the
*'- accretion or deletion of molecules from the skin (or reservoir), resulting
in a "large-scale" change in radius. Having adjusted the radius in this
mariner, subsequent "small-scale" changes in radius occur. These changes
involve only the adjustment of the separation of adjacent skin molecules,
not a change in the number of molecules. At equilibrium, the nucleus can
be thought of as two concentric shells of negligible thickness--the outer
one, the reservoir, is in contact with the liquid and the inner one, the
skin, is in contact with the gas. So far, this model has only been used to
make predictions about compression/decompression processes during which gas
diffusion can play a majo, role and which is basically a quasistatic pro-
cess. However, Yount [ 14] has calculated characteristic times in which a
H,
skin molecule can be accreted or deleted, due to an inequality of electro-
chemical potentials, and found them r.o range from 10-3 to 10 seconds.
The shortest times approach the period of acoustic signals used in ultraso-
nic studies. This woijld imply that large-scale changes in radius may be
able to keep up with Zhe variations in applied pressure associated with
acoustic cavitation.
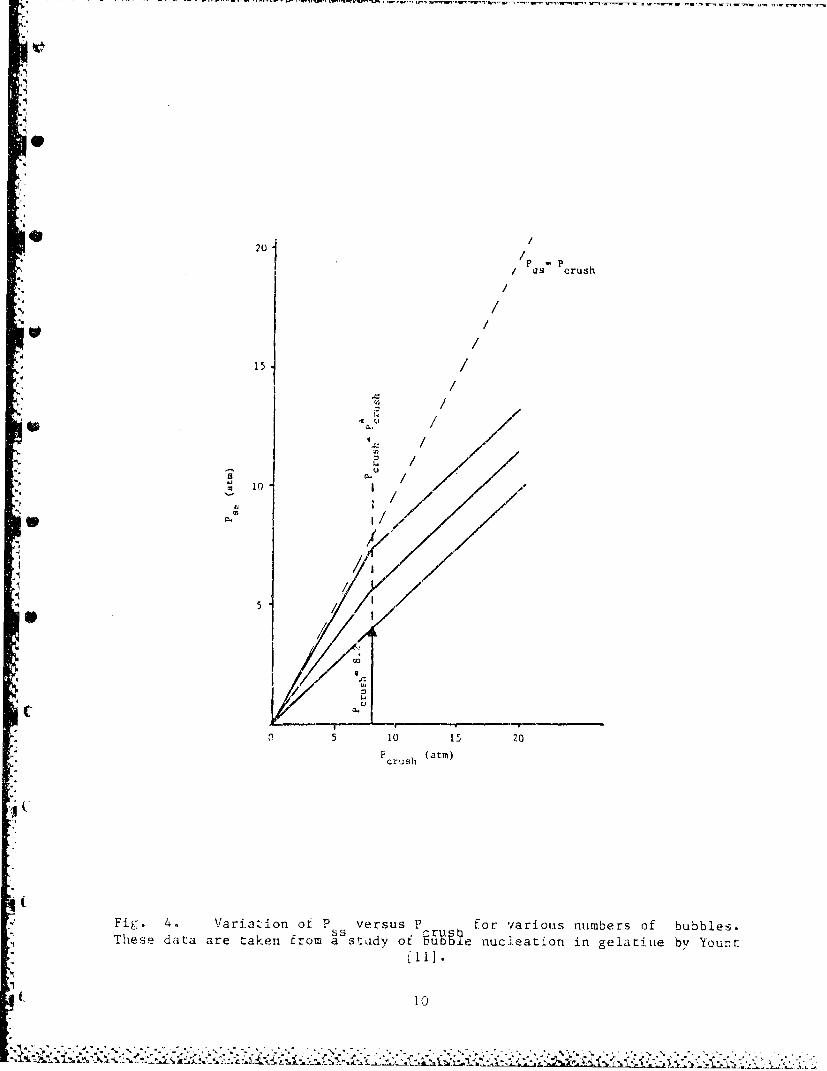
As mentioned above, Yount has performed only long time-scale experi-
ments. A typical experiment will now be described. During the experiment,
gelatin samples (surface tension around 50-55 dyn/cm) are subjected to a
pressure schedule which involves a compression, a resting time for equilib-
Vh rium to occur, and a subsequent rapid decompression. The sample, about 0.4
ml in volume, initially at a pressure P., is rapidly compressed to a
pressure P ." "Rapidly" means that no gas diffuses out of the nucleus
* during the compression. The sample is held at P long enough for the
dissolved gas pressure in the sample to come to equilibrium at Pm; i.e.,
it becomes saturated. The holding time is typically 5.25 hours. The
ambient pressure is then reduced rapidly to Pf resulting in ;he growth of
some of the nuclei. This growth occurs through gas diffusion from the now
supersaturated liquid into the nuclei. Several minutes are allowed for the
nuclei to grow to visible size. Then the total number of visible bubbles
are counted and correlated with Iihe pressure schedule. Yount defines the
crushing pressure, Pcrush' as Pm-Po; and the supersaturation pressure,
Pss' as Pm-Pf. One manner of data presentation is a graph of Pss vs.
Pcrush for lines of constant number of bubbles. Such a graph is reproduced
in figure 4.
The isopleths (lines of constant number of bubbles) in figure 4 show a
gradual decrease in slope at P crush=F -P o The segments of the lines on
9
20 /I?
,,/ •i Pcrush
//
• /
S15 /
U /
S10 I /
W/
5/ I0 52
P (•' sh(tm)
Fig. 4. Variazion of P versus P for v~arious numbers of bubbles.These data are taken from a stxidy of •r~he nuc~leation in gelatiue by 'Youngt
t 10
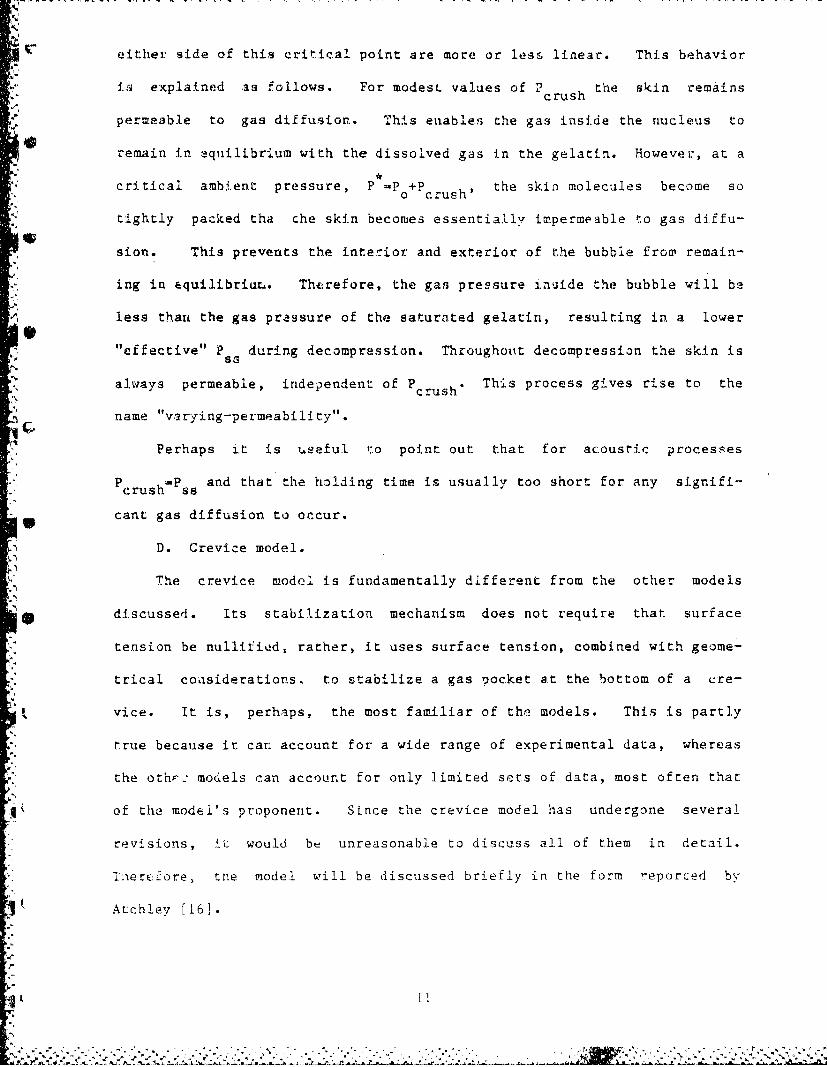
either side of this critical point are more or less linear. This behavior
L3.i explained as follows. For modesL values of Puh the skin remains
permeable to gas diffusion. This enables the gas inside the nucleus to
remain in equilibrium with the dissolved gas in the gelatin. However, at a
critical ambient pressure, P =Po+P crush' the skin molecules become so
tightly packed tha the skin becomes essentially impermeable to gas diffu-
sion. This prevents the interior and exterior of the bubble from remain-
- ing in equilibriuL. Therefore, the gas pressure inuide the bubble will be
less than the gas pressure of the saturated gelatin, resulting in a lower
"effective" P during decompression. Throughot~t decompression the skin is8S
always permeable, independent of Pc rush' This process gives rise to the
name "v•arying-permeability".
Perhaps it is useful 1-o point out that for acoustic processes
PcrushPss and that the holding time is usually too short for any signifi-
cant gas diffusion to occur.
D. Crevice model.
The crevice model is fundamentally different from the other models
* discussed. Its stabilization mechanism does not require that surface
tension be nullified, rather, it uses surface tension, combined with geome-
trical coasiderations, to stabilize a gas pocket at the bottom of a cre-
vice. It is, perhaps, the most familiar of the models. This is partly
"* true because it can account for a wide range of experimental data, whereas
the othr: models can account for only limited sets of data, most often that
of the model's proponent. Since the crevice model has undergone several
revisions, !u would bt unreasonable to discuss all of them in detail.
li~erEfore, tne model will be discussed briefly in the form reporced by
ALchley [16].
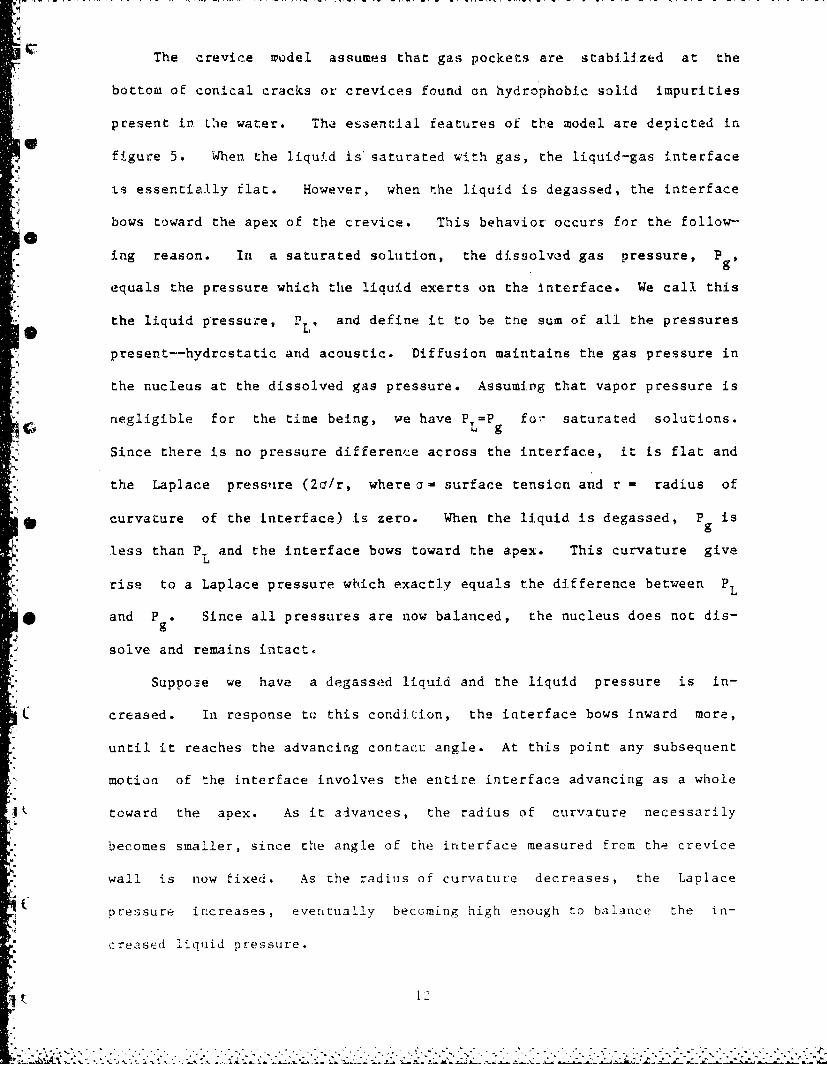
The crevice wodel assumes that gas pockets are stabilized at the
*! bottom of conical cracks or crevices found on hydrophobic solid impurities
present in Lhe water. The essential features of the model are depicted in
figure 5. When the liquid is' saturated with gas, the liquid-gas interface
is essentially flat. However, when the liquid is degassed, the interface
bows toward the apex of the crevice. This behavior occurs for the follow-
ing reason. In a saturated solution, the dissolved gas pressure, P g
equals the pressure which the liquid exerts on the interface. We call this
the liquid p-ressure, P , and define it to be tne sum of all the pressures
present--hydrcstatic and acoustic. Diffusion maintains the gas pressure in
the nucleus at the dissolved gas pressure. Assuming that vapor pressure is
negligible for the time being, we have P,=P fo- saturated solutions.
Since there is no pressure difference across the interface, it is flat and
the Laplace pressure (2a/r, where a- surface tension and r - radius of
* curvature of the interface) is zero. When the liquid is degassed, P is
less than P and the interface bows toward the apex. This curvature give
rise to a Laplace pressure which exactly equals the difference between PL
* and P . Since all pressures are now balanced, the nucleus does not dis-
solve and remains intact.
Suppose we have a degassed liquid and the liquid pressure is in-
creased. In response to this condition, the interface bows inward more,
until it reaches the advancing contact: angle. At this point any subsequent
motion of the interface involves the entire interface advancing as a whole
toward the apex. As it aivances, the radius of curvature necessarily
becomes smaller, since the angle of the interface measured from the crevice
* wall is now fixed. As the radius of curvature decreases, the Laplace
pressure increases, eventually becoming high enough to balance the in-
creased liquid pressure.
:12
( ) A,
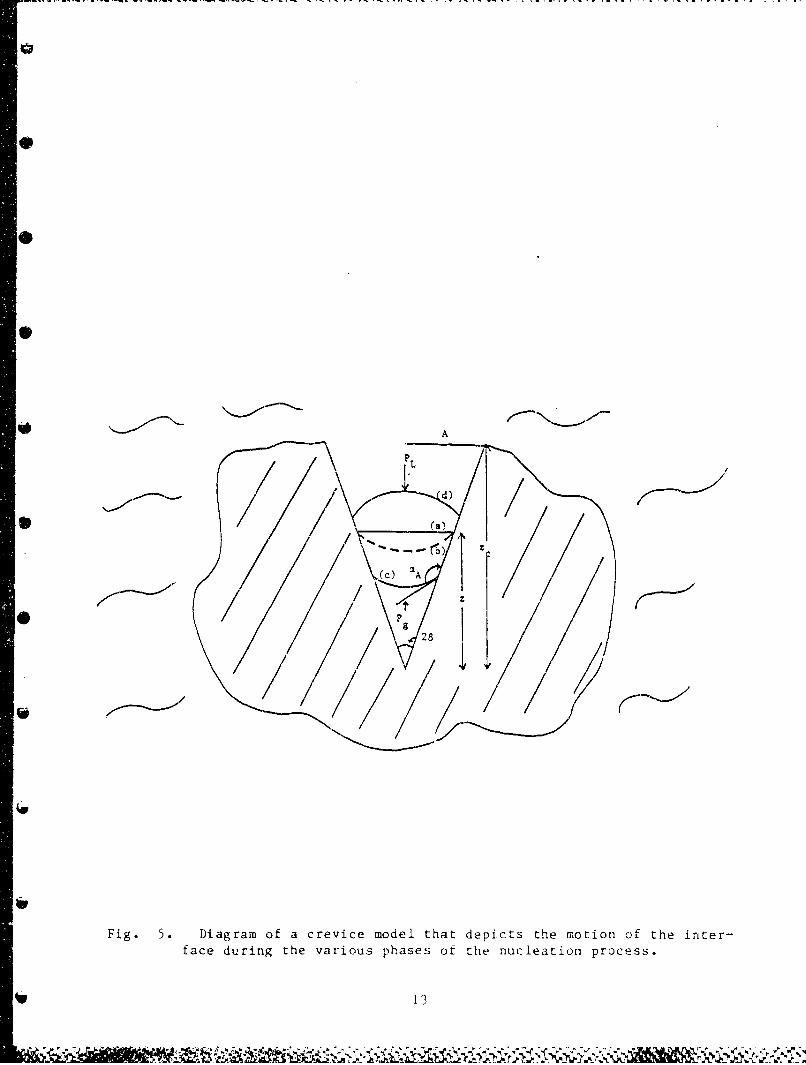
Fig. 5. Diagram of a crevice model that depicts the motion of the inter-face during the various phases of the nucleation process.
13
If the liquid pressure is now suddenly decreased to become negative,
as during that portion of an acoustic cycle, the interface bows outward and
* may reach the receding contact angle. If the receding contact angle is
reached, any subsequent motion of the interface involves the entire inter-
face receding away from the apex. This recession results in a decrease in
the Laplace pressure, since the radius of curvature increases. With the
Laplace pressure decreased the gas pressure inside the nucleus is retarded
even less. It has been previously assumed [17-20] that the criterion for
nucleation from a crevice was that the interface must reach the receding
contact angle. It was argued that once the interface had reached the
receding contact angle, any subsequent interfacial motion would increase
I• the radius of curvature, resulting in less Laplace pressure (which was now
opposing the growth of the nucleus) and so the growth would be unbounded.
It was shown by Atchley and Prosperetti [21] that this criterion needs to
be modified in the following manner. Reaching the receding contact angle
is only a necessary condition for nucleation. It may not however, be
- sufficient. The receding interface may not grow without bound unless the
•- interface has reached the "critical radius". We consider now the meaning
-" of this term.
The concept of a critical radius was probably first discussed by
N Harvey [17] though not in a quantitative manner; Blake [22], however, first
applied it to cavitation inception while Prosperetti [23] first examined it
for the case of a vapor-filled cavity. A derivation is now given for the
critical radius of a gas-filled cavity; the corresponding equation for the
vapor case will also be obtained.
i . gas-filled cavity
Consider a gas filled bubble ot radius R surrounded by a liquid which
V t14
N.
exerts a pressure P L on the bubble. The liquid-gas surface tension is T
The gas pressure inside the bubble is P ; the vapor pressure, P , is
assumed negligible. Assume the bubble is in equilibrium so that the pres-
sure inside, Pg, equals the ]iquid pressure plus the Laplace pressure due
to the surface tension, i.e.
P g PL + 2 T/R" (R)Sg L R
Simultaneously, the system must be in diffusion equilibrium. This requires
-0CL - a ci, (2)
where cL and ci refer to the concentrations of gas dissolved in the liquid
_I and present inside the bubble, respectively; a is the solubility coeffi-
cient of the gas in the liquid. If the gas is ideal then (2) becomes
P " BTCL/a, (3)
where B is the universal gas constant and T is the absolute temperature.
Equation (3) is a form of Henry's Law. At equilibrium P may he replacedg
* with r V called the gas tension, which is a measure of the partial
pressure of the gas dissolved in the liquid. At equilibrium
"Pg P1 + 2G/R- T (4)
or
T P L - 2a/R. (5)
The critical (equilibrium) radius is, therefore,
R = 2/(P -P )6)cg g L
-("'he subscript "cg" refers to the critical radius for a bubble to grow by
gaseous diffusion. Notice that the radius of curvature is positive only in
S( 15
supersaturated solutions. Since a negative radius is meaningless for free
bubbles, stability can occur only in supersaturated solutions.
ii. (mostly) vapor-filled cavity
This discussion is similar to the previous one, except now the
efffect of vapor pressure is included. Again, at equilibrium the following
condition holds
-P + P P L + 2(3/R. (7)_• v g
The condition given by equation (3) is dropped and the amount of gas inside
the bubble is fixed. In other words, no diffusion of gas takes place.
However, the amount of vapor is not fixed. If the gas is ideal then
rearranging (7) gives
PL + 2a/R - 3nBT/(4rR3) + Pv (8)
where n is the number of moles of the gas inside the bubble. To examine
its stability consider the effect of a small increase in R. For the bubble
not to grow spontaneously, the effective external pressure, which is given
by the left-hand side of equation (8), must increase more than the internal
pressure, given by the right-hand side of equation (8). This will always
be true if PL >-Pv, because the gas pressure decreases more with an in-
crease in R than does the Laplace pressure. If, however, PL < Pv then the
situation is different.
The stability criterion can be expressed, in general, as
R(PL + 2j/R) > -L (3nBT/(47rR 3) + P (9)
Performing the differentiation and solving for R gives
R < 4a/[3(P -P L] (10)
In other words, when Pv > PL' the bubble will be stable against spontaneous
16
growth only if R < R wherecv
R 4a/[3(P-Pt)] . (n)cv v L
That is to say, a bubble will grow in a spontaneous unhounded manner when
the liquid pressure is less than the vapor pressure only if R > Rv. A- cv
bubble that grows in this way will be mostly vapor-filled. Therefore, the
subscript "cv" refers to the critical radius for a vapor babble to grow
from a gas--filled nucleus. The reader is referred to Propseretti [23] for
more details.
In the preceding section, the conditions for the nucleation of both
gaseous and vaporous bubbles were developed. Using them, expressions will
now be given for the applied pressures required for nucleation from gas-
:filled crevices. These are referred to as cavitation threshoids. It
should be noted that the applied pressure, PA' is equal to the liquid
- pressure minus the ambient static pressure; i.e., PA PL Po
experimentally is the applied acoustic pressure amplitude.) The expres-
sions given below will be for two distinct cases: one for PL < Pv and the
- ocher for PL >- Pv" This division is a natural one; the difference in the
-estrictions on PL is in a sense the difference between acoustic cavitation
n:d diffusion cavitation. Acoustic cavitation Is produced by negative
applied pressures and its nucleation usually involves the growth of vapor-
i•illed bubbles, although not alway5. On the other hand, diffusion cavita-
4,- tion is usually produced by ambient pressures greater than the vapor pres-
sore and gas diffusion is the predominant mechanism in its nucleation.
Diffusion cavitation should not be confused with gaseous (stable) aco•istic
cavitation; the two occur ia different regions of ambient pressures.
Acoustic cavitation is considered first.
Assume that a deep crevice, partially filled with gas, exists ii ia
17
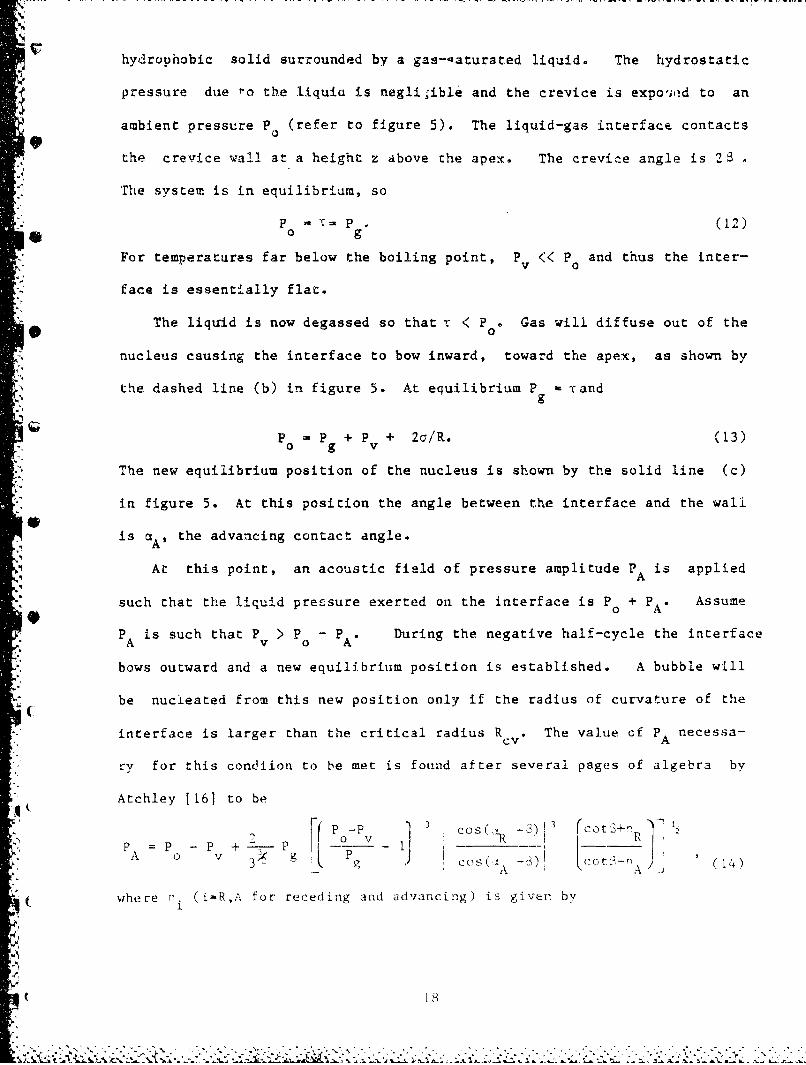
hydrophobic solid surrounded by a gas--aturated liquid. The hydrostatic
pressure due 'o the liquia is negli;ible and the crevice is expo'J,•d to an
ambient pressure P (refer to figure 5). The liquid-gas interface contacts
the crevice wall at a height z above the apex. The crevice angle is 27
The system is in equilibrium, so
yp . t=,p (12)*i o g
For temperatures far below the boiling point, P « P and thus the inter-V 0
face is essentially flat.
The liquid is now degassed so that T < P Gas will diffuse out of the•~0•
nucleus causing the interface to bow inward, toward the apex, as shown by
the dashed line (b) in figure 5. At equilibrium P Tandg
P - P + P + 2a/R. (13)
-•- 0 g V
The new equilibrium position of the nucleus is shown by the solid line (c)
in figure 5. At this position the angle between the interface and the wall
is aA' the advancing contact angle.
At this point, an acoustic field of pressure amplitude PA is applied
such that the liquid pressure exerted on the interface is P + PA* Assume9 0
PA is such that Pv > P - P A During the negative half-cycle the interface
bows outward and a new equilibrium position is established. A bubble will
be nucieated from this new position only if the radius of curvature of the
interface is larger than the critical radius R . The value of PA necessa-evA
ry for this condiion to be met is found atter several pages of algebra by
Atchley [16] to be
P ~~P -P FC a0 P s1 (a 3c% (Cot'3+nRl1-__ = _- +I_-
- +37 Cos t ot'fc•" A.o v 3• Pg*P (14)
A A J
where nri (i-R,A for receding and advancing) is given by
4I-
(L
11 226i 3- 1+ , (15)
Si.
and 6i - !cos(ai-a)f. The ni's are geometrical terms associated with
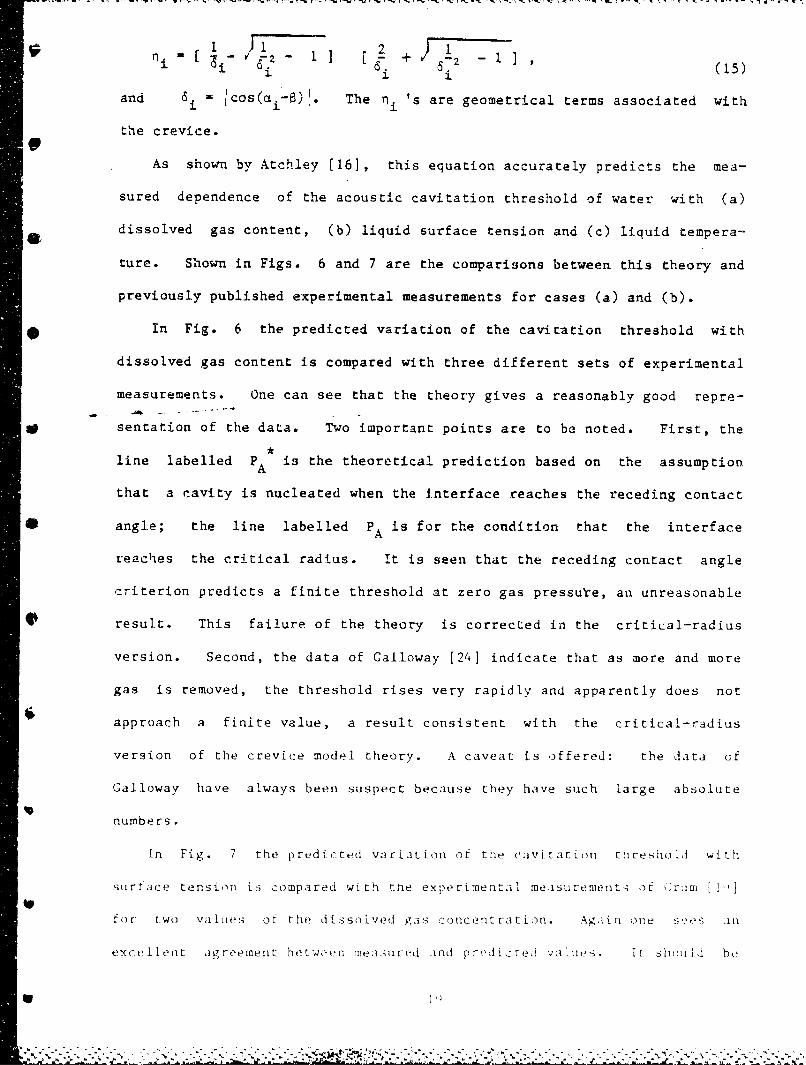
the crevice.UAs shown by Atchley (161, this equation accurately predicts the mea-
sured dependence of the acoustic cavitation threshold of water with (a)
dissolved gas content, (b) liquid surface tension and (c) liquid tempera-
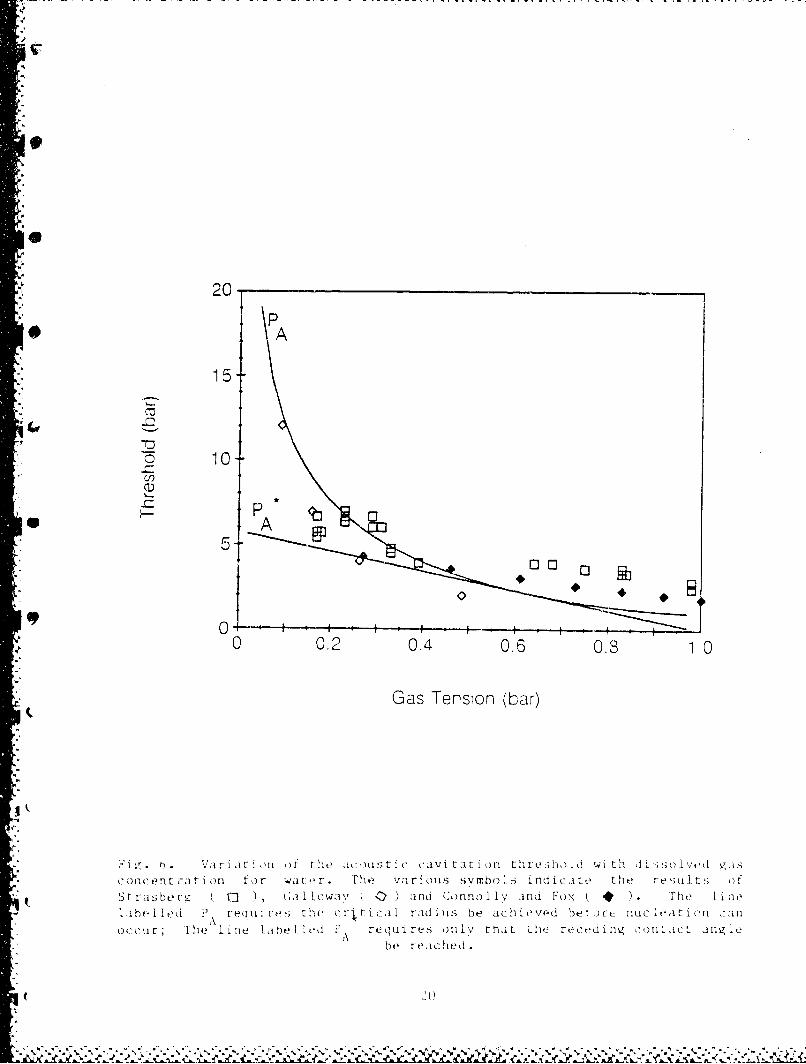
ture. Shown in Figs. 6 and 7 are the comparisons between this theory and
previously published experimental measurements for cases (a) and (b).
* In Fig. 6 the predicted variation of the cavitation threshold with
dissolved gas content is compared with three different sets of experimental
measurements. One can see that the theory gives a reasonably good repre-
_ sentation of the data. Two important points are to be noted. First, the
line labelled PA is the theoretical prediction based on the assumption
that a cavity is nucleated when the interface reaches the receding contact
* angle; the line labelled PA is for the condition that the interface
reaches the critical radius. It is seen that the receding contact angle
criterion predicts a finite threshold at zero gas pressure, an unreasonable
result. This failure of the theory is corrected in the critical-radius
version. Second, the data of Calloway [24] indicate that as more and more
gas is removed, the threshold rises very rapidly and apparently does not
approach a finite value, a result consistent with the critical-radius
version of the crevice model theory. A caveat is offered: the data of
Galloway have always been suspect because they have such large absolute
numbers.
In Fig. 7 the predicted variation of the cavitation threshold with
surface tension is compared wi. th rte experimentia1 measurement,; rtf Crum 1,)
or- two vaIL1es of the dissolved gas concenrtration. Agiin aone S'.! e aIn
excellent agreement betw(-en niPleai;ti1rtd .an1d predie red vales. It- shu1 1.a be
97
20-
p0 A
15
100 0.2 0.4 0. 0
Aa eso Lr
Fi .VI a o .- ,'- c v ta iul tlr ý,lo d W t l -;o vtd5,.
1i.1 be I ld ri at i im sr the ac)Ui. t :cm rad iu teat eo %thr-h~d we thor i It-I ts i~e gon-I
oc cuir; FhlitIine lahbe I !ed P U&±gui res oniv trimt L-ho receding, cmitact aug betbe rpeached.
25-t=0.19 bar
* 20
-~ t=0.47 bar
CM,
SUrface Tension (dyn/:rn)
(Fi g. 7. Variation of the acoust~ic cavi tatiori threshold of wa te r witrh
surface tension. The sym~bols are the dat~a of Crum and the Solid lines are,
calculated f rom equati on (14) us in ii .5 arnd cH - Lý .15 f g
4.2 fr P ~0.19 bar.
noted that there is some '"fitting" here in that in the theory there are
three unknown constants: the equilibrium contact angle a E (which is set
9 equal to the advancing contact angle •a), the hysteresis angle aH (which
is the difference between the advancing and receding contact angles), and
the crevice angle (2 $ ). In Atchley's analysis, the equilibrium contact
angle is set to a value appropriate for water on nonpolar solids such as
paraffin and beeswax, the hysteresis angle and crevice angle may be varied
with the constraints that the hysteresis angle lie within the published
angle of values for water on nonpolar solids (14°.. 350) and the crevice
angle be small (less than 150).
Finally, comparison of the predicted and measured variation of the
cavitation threshold with temperature also show excellent agreement, when
the temperature dependence of the surface tension, dissolved gas pressure
and vapor pressure are introduced into the theory. For brevity, these
results are not included in this report.
In summary, it is seen that the critical-radius version of the crevice
model can acurately explain the measured variations of the cavitation
threshold of water with most of its physical parameters. (The anomaly with
the dissolved ion concentration being one exception.) Accordingly, it is
reasonable to assume that the most acceptable model for cavitation nuclei
in water at this cime is the crevice model.
E. Nucleation in tissue
It seems in erder at this point to move from experiments in the rela-
tivly simple medium of water and consider the implications of cavitation
nucleation in biological systems. At this stage of research, very little can
be said conclusively in a scientific sense. However, there are several
observations t~hat will now be tabulated that address this issue.
(4.22
1. Nuclei exist in tissue and can be activated acoustically.
A large number of experiments have been performed to determine
the nature of in vivo cavitation nuclei and probably the most that can be
said is that all of these experiments indicate that these nuclei do indeed
exist. To single out a few of the many experiments [25-32] that demon-
strate this fact, let me call attention to four important ones:
Ter Haar et.al. (25-26] have irradiated live guinea pig legs with
therapeutic ultrasound while examining the irradiated area with a
diagnostic scanner. They observed the development of echo centers that
were attributed to gas bubbles (the echos went away when a static pressure
was applied) within the tissue. Several sites developed within the
radiated areas at modest acoustic intensities. There is good reason to
-- believe that these bubbles of microscopic size (greater than 20 p m in
diameter) grow from preexisting nuclei within the guinea pig by a process
_ called rectified diffusion [27], a phenomenon which shall be described
later in this article.
Carstensen et.al. (28-29] have irradiated Drosophilla eggs and larvae
* at various stages in their development with pulsed ultrasound. They have
determined that when gas-containing trachea developed in the organisms,
they were extremely suceptable to the ultrasound and large fractions could
- be killedý
Hemmingsen et.al. [30-311 have observed bubble formation in crustaceans
following decompression from hyperbaric gas exposures. Photographs are
_ presented showing the presence of there bubbles within these livirg orga-
nisms.
Frizzell et.al. [321 have observed hind limb paralysis in mouse
neonates upon irrad-iarion with high intensity CW ultrasound. Furthermore,
the effect was surpressed by the application ot a statC pressure. They
23
• . • • • '•• i • . • • • b . r k • '' - r-• Jrr ".,r-w -wr • -• ,- '" r'r... . -- r, r- r..- rr. , r, r,- '; r -r -r i, r • . .. . •-'r , -•, --
4;" concluded that cavitation was the damage mechanism, which implies that
there must have been nuclei present within the neonate before radiation.
S2. The stabilization mechanism is unknown.SBecause tze cavihtation nucleus is o small compared to the micro-
scopically visible bubble that is eventually observed, there is essentially
no memory of tne initial state. Thus, although it is widely believed that
AD visible cavitation bubbles arise from stabilized nuclei, there is little
evidence concerning the actual stabilization mechanism. Some observations
from the li-terature may be helpful, however. Although it doesn't seem
unreasonable that biological fluids could contain small microscopic solids
on the order of a few microns in size (crevices that can stabilize gas
pockets are probably on the order of tenths of microns), the multiple set
of filtcrs (e.g. lungs, liver) that the body possesses that would tend to
remove these objects makes this stabilization model appear less likely than
others. However, Fraser et.al. [331 have examined bubbles produced in
the inner ears of squirrel monkeys and have found indications that the
origins of these bubbles are sharp crevices in the bony tissues. Microsco-
pic studies of the damage sites tend to lend support to this view. Several
earlier studies [34-35f have examined the details of the nucleation
process.
( At first thought, the variety of salts present in most biological
"fluids would support a stabilization model similar to that proposed by
"Aculichev [ 6], in which microscopic gas bubbles are surrounded with hydro-
phobic ions that prevent bubble dissolution by Coulomb repulsion. There
appears to be a serious problem with the origin (f the nuclei however. In
" Aculichev's model, the ions are presumed to migrate to the surface of
preexisting dissolving gts bubbles arid eventually prevent these bubbles
from fu'rther dissolution. However, there doesn't appear to be a mechanism
i.
F
for introducing the initial pocket of gas into the biological system
without first having it stabilized.
This chicken-and-the-egg problem-is faced in a similiar fashion with
Yount's [ll'-lS5 >urface-active agent model. Again there is a requirement that
preexisting di3solving gas bubbles are stabilized by the organic skin.
Yount does have Pvidence that very small [< 0.1 ýim] apparently stabilized
* spherical gas bubbles are present in water; whether these objects could
pass directly into the blood stream for distribution thrcughout the body is
still, in que-stion.
A solution to the "seeding" problem of nuclei within biological systems
is avoided by a model for nucleation favored by Hemmingsen (30,36]. He
suggests that the relative movement of cne tissue over the other developes
sufficient negative pressures to introduce pockets of free gas by a tech-
nique known as tribonucleation. The process is fairly well known and has
* been suggasted earlier as a nucleation mechanism. The strength of
SHemmingsen's case is made on the basis of his studies of decompression in
various tranparent crustaceans. When the limbs of these animals are re-
_ stricted from movement, the decompression pressures required to induce
bubble formation is greatly raised. When the limbs are free to move,
however, bubble formation occurs at much lower decompeession pressures.
4, Furthermore, tme observable bubbles tend to be concentrated near the joints
* where considerable relative tissue movement occurs. The fact that bubble
formotion in divers occurs more frequently and at an earlier stage in
I ~ elbows and knees tends to lend corroborating evidence to this suggestion
"[371. Furthermore, exercise iumueaiately after decompression increases the
- incidence of svinptoms in divers [83J] and decreases the altitiide threshc id
-fo aviators [391 Showers of bubbles have been detec: ,ed in The c i .C.uI.••-
tory systemi• of divers immediately after arm movements [4011
-i,
On the other hand, the phenomenon of tribonucleation is still not well-
defined (31] and has not yet been applied successfully to experimental data
9 as the crevice model [16] and the organic skin model [15].
3. The acoustic activation can be potentially damaging.
Whenever a pocket of gas is caused to pulsate by the action of a
-* relatively intense acoustic field, it has three possible behaviors: (i) it
can remain unchanged in time-average volume, but pulsate violently, (ii) it
can grow explosively in one or two cycles (transient cavitaiton), or (iii)
it can grow slowly by rectified diffusion to a point where (a) it breaks up
due to surface wave formation, or (b) it grows explosively as in (ii).
For all of these cases, if the spatial peak temporal peak acoustic
pressure amplitude is above a value of a few atmospheres, there is a
significant potential for damage to biological tissue. The damage may
occur due to three different mechanisms associated with this violent pulsa-
tion: (1) When a bubble pulsates violently for several cycles it causes
. severe shear streses in the vicinity of the bubble, which can cause "Lgni-
ficant biological effects [41-45]; (2) when a bubble grows explosively ar.d0
collapses, it can develop shock waves and imploding Jets that have caused
severe damage to surrounding boundaries [46-48]; (3) if the bubble grows
by rectified diffusion to radii that are submultiples of its resonance
size, it can pulsate violently enough to cause sonoluminescence. This
light emission is probably an indication of the production of highly reac-
tive free radicals [49-52] that are tnc same damage mechanism as ionizing
radiation.
We can conclude this section with the following observations:
A. Microscopic pockets; of gas can be stabilized against disso1ution
by a variety of physical mechanisms.
26
B. These gas pockets can be activated acoustically.
C. The acoustically activated bubbles can have harmful bioeffects.
2?27
9•
-t.
II. Rectified Diffusion
* A. Introduction
A concept that can be of general interest in the area of ultrasonic
bioeffects is the mechanism wisely labelled as "rectified diffusion". This
process involves the relatively slow growth of a pulsating gas bubble due
to an average flow of mass (gas) into the bubble over an acoustic cycle.
This "rectification of mass" is a direct consequence of the applied sound
field and can be of importance wherever the applied acoustic pressure
- amplitude exceeds the threshold for rectified diffusion (on the order of a
few tenths of an atmosphere for typical values of the acoustic frequency
. and bubble radius.) For liquids that are not supersaturated with gas, a
definable threshold exists due to the Laplace pressure exerted on the gas
contained within a bubble by the force of surface tension. The value of
this pressure is given by Pi M 2a/Rn, where Pi is the internal pressure,
a a is the surface tension of the liquid, and R is the equilibrium radius of
the bubble.
For relatively large gas bubbles, on the order of 1 cm in diameter,
say, this pressure is quite small (<0.001 bar). However, for bubbles on
the order of 1 pm in diameter, this pressure can be quite significant (>1.0
bar). Thus, when one considers the stability of a free gas bubble in a
liquid with a surface tension similar to that for water, they must be
Sstabilized in some manner as described earlier, or they will dissole
"rapidly.
With the application of an applied sound field, however, a bubble can
be made to oscillate about an equilibrium radius and caused to grow in size
because of the following effects.
The first effect is an "area" effect. When the bubble contracts, the
-iconcentrarioo• of gas (moles -1. ) in che interior- of the bubble increases,
( 28
and gas diffuses from the bubble. Similarly, when the bubble exrands, the
concentration of gas decreases, and gas diffuses into the bubble. Since
p the diffusion rate is proportional to the area, more gas will enter during
expansion than will leave during the contraction of the bubble; therefore,
over a complete cycle, there will be a net increase in the amount of gas in
*. the bubble.
The second effect is the "shell" effect. The diffusion rate of gas in
a liquid is proportional to the gradient of the conccntration of dissolved
gas. Consider a spherical shell of liquid surrounding the bubble. When
the bubble contracts, this shell expands, and the concentration of gas near
the bubble wall is reduced. Thus, the rate of diffusion of gas away from
the bubble is, greater than when the bubble is at its equilibrium radius.
Conversely, when the bubble expands, the shell contracts, the concentration
of gas near the bubble is increased, and the rate of gas diffusion toward
the bubble is greater than average. The net effect of this convection is
to enhance the rectified diffusion. It has been shown that both the area
and the shell effects are necessary for an adequate description of the
phenomenon.
Apparently, rectified diffusion was first recognized by Harvey [171,
who considered the biological implications of the effect as early as 1944.
Blake [221 was probably the first to attempt a theoretical explanation and
his predictions were nearly an order of magnitude too small, because he
considered only the area effect. An adequate theory was first presented by
Hsieh and Plesset [ 53 ] who were the first to include the effect of
convection. Strasberg [ 54 ] , who had made some experimenta 1 measurements,
w(. showed that the theory of Hsieh and Plesset [5I] generally agreed with his
measurements. Eller and Flynn [D5] extended the analysis to inc lude
i %
nonlinear or large amiplitude effects by treating the boundary condition of
the moving wall in a slightly different way. Safar (56] showed that the
Hsieh-Plesset results were essentially equivalent to those of Eller and9
Flynn [ 55] when inertial effee'ts were added to the Hsieh-Plesset approach.
The few measurements obtained by Strasberg were extended by Eller [57]
to include both the threshold and the growth rate. He found that the
theory was adequate in predicting the thresholds for growth by rectified
diffusion but was unable to account for some large growth rates that he
observed. He suggested that acoustic streaming may be the cause of the
larger-than-predicted rates of growth. Gould [58] was able to directly
observe gas bubble growth by rectified diffusion through a microscope and
discovered that growth rates could be greatly enhanced by the onset of
surface oscillations of the bubble, which in turn seemed to induce
significant acoustic microstreaming. Attempts by Goula [58] to apply the
* acoustic streaming theories of Davidson [59] and of Kapustina and Statnikov
60 ] to explain his results were not successful. Extended theoretical
treatments were presented by Skinner [61] and Eller [621 to account for
_ growth through resonance.
Additional measurement of the growth of gas bubbles by rectified
diffusion were later obtained by Crum [63] who made both threshold and
C growth rate measurements for a variety of conditions. He extended the
theory to include effects associated with the thermodynamic behavior of
"the bubble interior and found excellent agreement between theory and
experiment for both the rectified diffusion threshold and the growth rat'e
for air bubbles in pure water. Anomalous results were obtained, however,
when a small amount of surfactant wasadded to the water. The rate of
growth of bubbles by rectified diffusion increased by a ft-ct:or of about
five when the surface tension was lowered by a factor of about two, with 1o
S[ 30_•G
discernible surface wave activity. Although some increase is predicted,
the observed growth rates were much higher. A slight reduction In the
threshold with reduced surface tension was also observed. Some
explanations offered by Crum [63] for this anomalous 'ehavior were that
there was some rectification of mass due to the surfactant on the surface
of the bubble and/or there was microstreaming occurring even in the absence
of surface oscillations.
To bring our limited review of the literature up to date, it is noted
that there have been recent applications of the equations of rectified
diffusion to studies of the threshold for growth of microbubbles in
biological media [43],the threshold for cavitation inception [ 64 1, and as
a possible explanation for the appearance of gas bubbles in insonified
guinea pigs ( 65 1. Finally, a comprehensive paper on rectified diffusion
was recently published by Crum [66] and can be referred to for details.
B. The Governing Equations
A brief outline of the theory is now given, complete with the detailed
equations to be used to make calculations of the threshold and the growth
rate of bubbles by rectified diffusion. A complete mathematical
description of the growth of a gas bubble by rectified diffusion would
require an equation of motion for the bubble, diffusion equations for the
liquid and the interior of the bubble, and heat conduction equations for
both the liquid and the bubble. Ccntinuity relations at the bubble wall
would be required, and the situation is further complicated by the fact
that these equations are coupled. S nce this general approach presents a
very formidable mathematical problem, various simplificat..ons are requirTed
to obtain a solation.
The approach used by Hsieh and PIesset [>31 and by- Elier and Flynn
3 1
."0_ -
(55] is to separate the general problem into an equation for the motion of
the bubble wall, and a diffusion equation for the concentration of gas
-- dissolved in the liquid alone. We will use as the equation of motion for
* the gas bubble the well-known Rayleigh-Plesset [67] equation, given here by
"�RR" + 2 + P [1-(Ro/R)
*2 R 0 0
(16)-PA cos wt + pRo 0 0 bR} - 0,
where R and R are the instantaneous and equilibrium values of the bubbleo
radius respectively, p is the liquid density, n the polytropic exponent ofthe gas contained within the bubble, PA the acoustic pressure amplitude,
w the angular frequency, w 0 the small-amplitude resonance frequency and b
"is a damping termapplied to the bubble pulsations. It is assumed that the
damping is only important near bubble resonance and thus the expressions
for the specific damping terms are only applicable near resonance.
Further, P - P + 2a/R where P is the ambient pressure and q is the
surface tension of the liquid. The small amplitude (linear) resonance
* frequency of the bubble, wo' is given by
"* 2 2W 0 (1/p R ) (3rnP° - 2a/R ) (17)
The diffusion equation for the gas in the liquid is Fick's law of
. mass transfer and is given by
dc/dt - DC/)t +v- V C - DV2 C, (18)
where C is the concentration of gas in the liquid, V is the velocity of the
liquid at a point, and D is the diffusion con., tant. The ioupl ing betweeu
(16) and (18) is through tihe convect:ve term v. " and re,)Cesepts a major
difficulty in the solution. This term was nieglcteetd by Plake .2 and
32
s- .... nw 'w :•"-u., ...rw .n -- ,• . .u- • n w • i' iwr n• vrw• -ra •wy ~r'r r w r~~ r wP qnr ~
resulted in a prediction for the threshold that was an order of magnitude
too small. The problem with the moving boundary has been solved in two
* slightly different ways by Hsieh and Plesset [531 and by Eller and Flynn
(55]. The details of their solutions can be found in their respective
works; the solution of the latter will be used here.
*_ It is shown by Eller and Flynn (55] that the time rate of change in
the number of moles n of gas in a bubble is given by
dn/dt - 41rDR C0 0
x <R/R>4R <(R/Ro) 7 H, (19)
o 0 •TDt:
where C is the 'equilibrium' or 'saturation' concentration of the gas in
the liquid in moles (unit volume)-, the pointed brackets imply time
* average, t is the time, and H is defined by
H - C /C - <(R/R )4 (P / )>/<(R/R ) 4>. (20)i o O g o
Here C is the concentration of dissolved gas in the liquid far from the
bubble and P , the instantaneous pressure of the gas in the bubble, is__ g
given by
SP - P (Ra/R)3h. (21)
g 0
As seen by the above equation, a polytropic exponent assumption is
made for the pressure of the gas in the interior of the bubble. This
assumption is commonly made and is probably reasonably accurate for small-
amp Ii tude pulsations. There is evidence that it nced,; to he ••odified for
moderate to Large amplittude osciilations, however.
The values o t KR, to be used in the eq ua tion.s above are obta ined
IL
by an expansion solution of (16) in the form
R/R / 1 +c(P /P ) cos (wt + 6) (22)
2 2
+ a 2 K(P /P 2 +A +
where it has been determined that
- 2 2 2)2 2a~ (pR 0 [)(m2 W + (ww b)2 (23)0 0 0
(3n + 1 - a2)/4 + (a/4RoP)(6n + 2- 4/3n)K =1(24)
1 + (2o/R P.)(l - i/3T1)
. d"'tan- 1 [wwb/(w 2 - 0 2 (25)
o o
and
2 2 2 (6P,' R2 0• /3nPC• (26)
- It is necessary to know the damping of the bubble pulsations when the
bubble is driven near resonance. This damping has been calculated by Eller
[68] using the expressions of Devin [69];a similar but not identical value
for the damping term has also been obtained by Prosperetti [ 67 1.
Because the pressure in the interior of the bubble is assumed to be
given through the polytropic exponent approach, an accurate expression for
the thermal damping can not be given. Prosperetti [67] has shown that an
"estimate of this damping can be expressed through an "effective viscosity".
"' Since the damping is only impcrtant near resonance (or at harmonics and
subharmonics of the resonance frequency), arid since the rectified diffusion
equations are probably not a.ccurate near resonance anyway, this nonrigorous
approach will be followed for the present time.
The total damping constant, b, is assumed to be h ble to be written
as a sum or contribi..ttions due to the three common damping Mechanisms, vi z ,
thermril, visc ous and rad-Ia•arý.:I.on:
b - b + b + b ,7et v r
J,1,
. -.. . ... * . . \ .-
** .7... - 7i* . .t**.~i >
where
bhere X(sinh X + sin X) -2(cosh X - cos X) 1bt {3((-1) X'7(cosh X - cos X) + 3(y.-I)X (sinh X - sin 6)
with X = R (2,w/D )½, (27)
and b - 4wP/3nPO, (28)
"br PR 3W /3 nP c, (29)
V!4, t h
2-Il 3(y-1) sinh X-sinX (30)n=y( + bt) + osh X -cos X
In chese equations y is the ratio of specifiz heaLs and D, - KI/ 1 Cpl,
where K is the thermal conductivity of the gas in the bubble, p, is the
density of gas, Cp1 is the specific heat at constant pressure for the gas,
and ui is the viscosity and c is the speed of sound, both in the liquid. To
obtain a usable expression for the growth-rate equation, the time avPrages
<R/Ro >, </R 0) 4>, and <(R/Ro)4 (P iP.)> are requifed. it is found thbt.a K=2aPg
2 2 ('<R/R > - I + Ka(2/P) (31)
<(R!R 04> - 1 - (3 + 4K) a2 (PA/P)2 (32)
and
<(R/R (P /P )> + CIiI)_ (3 n-4) 2 (.A0 g 4 4P
k4' '43r)Kc)RP
By assuming an ideal gas behavior, we can relate the equiibriuw radius to
the number of noles of gas by the equarion
S3S- 3nk T/(4iR ) (34)
wher~e k is the uni ye rs.i ga• cons cant and TI is r-he absoluce .;emper'a murt,
This equation should be a good approximation for small acoustic pressure
amplitudes, so that the density fluctuations do not become excessive, and
for low host-liquid temperatures, so that the ratio of vapor/gas within
the bubble remains low. Such conditions would be met for normal
experimental situations.
By combining (19), (20) and (34), an expression is obtained for the
rate of change of the equilibrium bubble radius with time:
t I 3P•oj ----- <(R!Ro),.> 3
7@7
0 dC 0 g r
where d -k TC /p=..
In (35), the time averages <R/Ro0>, <(R/R) 4 > and <(R/Ro0)4 (Pg9/P.)>
are given by (31), (32) and (33), respectively. The tbreshold acoustic
pressure for growth of a gas bubble is obtained by setting dR 0 /dt - 0, and
results in the equation
(pR 0 2w ) [(I(_2/ o2)2 + b 2 (W2 /IW0 2)] (1 + 2iRoP• - Ci/Co)PA (3+4K)(CiCo) - {[3(r-1)(3n--4 )/ 4 ] + (4-3n)KI(l + 2a/R P-) (36)
These expressions in (35) and (36) are the governing equations for
rectified diffusion and enable one to obtain the threshold for inception of
growth and the rate of this growth. The growth rate equation (35), also
applies below the threshold, and with PA = 0, describes the case for
diffusion Ln the absence of an applied sound field. Although thiese
e-quations are rather complex, some simple concepts can be obtained by a
2'ý ~ ~ ~ I.It.
cursory examination of their form.
First of all, note in (35) that the rate of growth is directly
proporticr.al to the diifusion constant and other physical constants
associated with the liquid. Thus, compared with air, helium, which has a
higher diffusivity can cause more rapid growth. Also, carbon dioxide,
which-has a higher solubility in water, can cause more rapid growth.
Note also, in (36) that the minus signs in the numerator of the
threshold expression give important indications of gross behavior. For
_* example, O1e last term in parentheses indicates the reason for a
"threshold". Unless the dissolved gas concentration ratio, Ci/Co, is
*- greater than the non-dimensional surface tension term, 2a /RP, a positive
acoustic pressure amplitude is required. Thus, it is the effect of surface
tenzion that demands that a threshold exists. If Ci /CC is greater than
2a/R P., then the system is supersaturated to the point that bubbles will
grow spontaneously, without the requirement of an externally-applied
acoustic field - as is the case for carbonated beverages. High values of
3,,persaturat3.on probably do not occur within biological tissue, though
- localized regions within a cell, for example, where respiration may occur
and diffusion is restricted may be cornsiderably different from equilibrium
,:onditions within the bulk of a liquid. Ward et.al. [70] have examined
C(i sach conditions where bubbles are unstable to growtn due to localized
supersaturation. The caveat here is that the extension of these equations
S_-hat were developed for simplified conditions within a bulk liquid may not
•I be applied directly to the physiological situation.
A. second observation that can be made when examining these equations
is zhar if the but)ble is driven near its resonance frequency, the threshold
C* is lowered considerably and is determined essentially by th•e damping.
rc -e the bubble is a dynamic system, tending to grow toward resonance, a
3 7
- V NNI'NV• .
gas bubble should be expected to undergo very large amplitude pulsations
when driven by CW acoustic fields of even moderate intensity.
C. Simplified Equations
"The equations for the growth rate, (35) and the threshold, (36). for
"rectified diffusion are rather complicated mathematical expressions th-t do
not lend themselves very easily to inspection in order to determine the
effect of a particular parameter. Further, there are ranges of interest
in which the equations can be simplified greatly anJ still present accurý,e
predictions. Since the threshold for rectified diffusion is normally the
desirable quantity, attention will be restricted to that equation alone.
The two principal regions of interest in the study of reztified
diffusion are: (i) an area applicable to underwater and physical acoustics
-' where the acoustic frequencies are of Zhe order of a kilohertz and the
bubble radii are of the order of tens of Pm; (ii) an area applicable to
bioacoustics where the frequencies are of the order of a megahertz and the
radii on the order of 1 lim.
Since our concern here is primarily with region (ii), the simplified
expression for the threshold expresion for this region is now given. In
this region, say w - 1'r(I MHz) and R - 2w w, the bubbles will pulsate0
* isothermally, due to their small size, and n _ 1.0. Further, the principal
contribution to the damping at this frequency is the viscosity term, so
that b >> (bt, b ) and hence b - b . Finally, for small bubbles, thev r v
surface tension term can be quite large and cannot be neglected. With
these restricti ons, the rectified diffusion threshold applicable to region
(ii) is given by(,0,%. •[. -- '• I ) .-. b I + -2cr/i, P C
P( 0 o o . (37)A (3 + + ,( C KI + R/ P )
L 0
w ere ( ...- ) t ,/ , R I) ,
1 + * s 3> !t "
K~.N- - * §v.
a2 M ) wZR 0/3P. (39)
b -4tjP/3P, (40)
and
2 0 2 I/pR0 ) (3P( + 4a/R ). (41)
D. Experimental Te,_-hnique for Examining Rectified Diffusion
In this section is presented a brief description of the principal
experimental technique used to make measurements of growth of bubbles by
rectified diffusion. This technique was first utilized by Strasberg [ 8
with some modifications by Eller [57] and Gould [ 58].
The main feature of the technique is the isolation of a single gas
bubble in an acoustic statioiiary wave, with the ability tc determine the
bubble radius accurately and quickly. The specific description of the
technique used by Crum [63] is now given. Refer to Fig. 8 for a diagram of
the experimental apparatus.
The stationary wave system was constructed by cementing a hollow glass
cylinder between two matched hollow cylindrical transducers, fitted with a
flexible pressure release diaphragm on one end and kpen au the other. The
composite system was approximately 7.5 cra in diameter by 10 cm in height,
with the width of the glass in the middle about 2.5 cm. This system was
driven at its (r, 8, z) - (2, 0, 2) mode at a frequency of 22.1 kHz.
When a standing wave exists in the liquid, an acoustic radiation
pressure force, commonly called the primary Bjerknes force [711 is exerted
on air bubbles that draws thei toward a pressure antino~e if they are less
than resonance size and forces them toward the nodes if they are larger
than resonance s ze. Because of gravity, there is also a constant
(essentially) force of buoyancy on a gas bubble in a liquid, and this force
is alw3ays ?.rected unward. Since the prima-y Bjerknes force [ 72 ] is
proportional to the acoustic pressure, which varies wi th position, there
.31
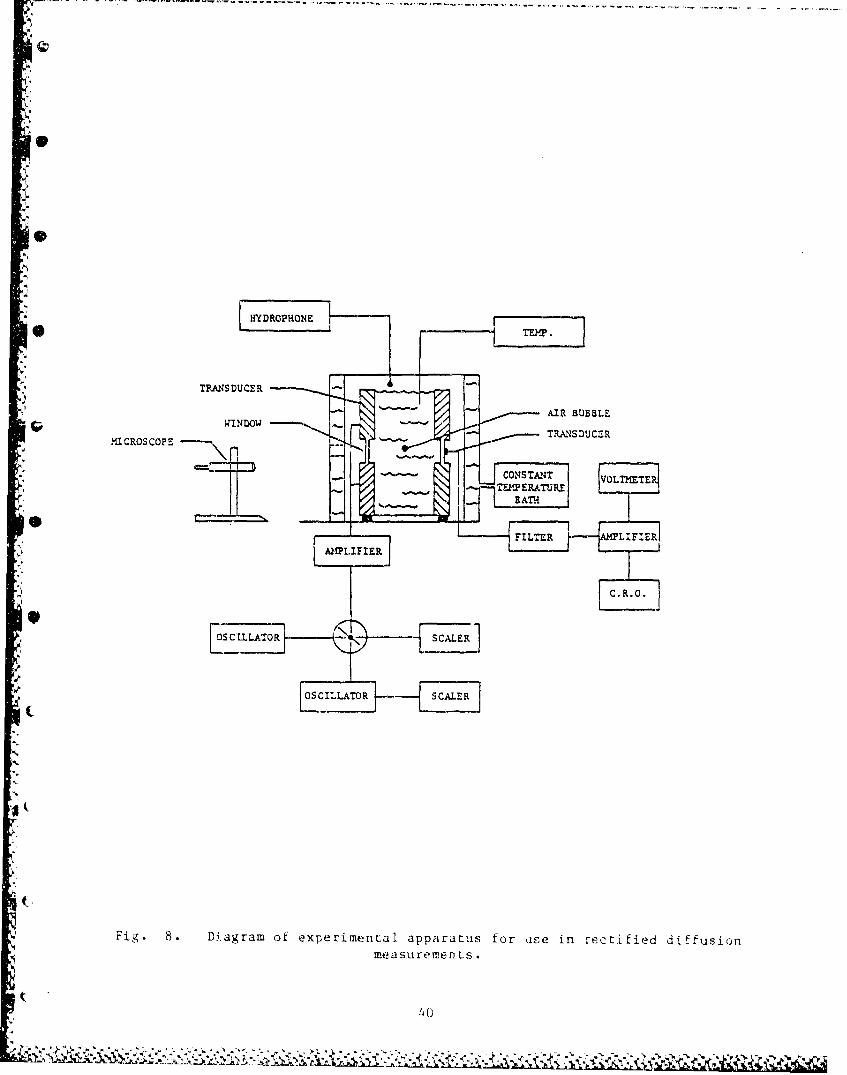
HY'IDROPHONE 1 ] [
WIDW--- AIR BUBBLE
MICROSCOPE - TRANSDUCLR
FILM R LIFIER
9 OCOSCILLATOR SCALER1
Fig. 8. Diagram of experimental apparatus for ase in rectified diffusionintasurements.
L40
rL2
exists positions of stable equilibrium for the bubble in the "levitation
chamber" somewhat above the position of the pressure antinode. With a
little practice, one can easily position a bubble within the field and
monitor this position with a cathetometer.
The normal approac.h is then to establish a fixed acoustic pressure
amplitude within the chamber, which essentially fixes the position of the
bubble (the position L3 inde- endent of the radius if the bubble is
sufficiently smaller than resonance size). The radius is then measured
with some technique (such as permitting the bubble to rise at its terminal
velocity, measuring this velocity and then determining the radius from an
applicable drag law) as a function of time. For threshold measurements,
the acoustic pressure amplitude is constantly adjusted to ascertain the
value for which a bubble of measured size neither grows nor dissoives.
With this technique it vipears that threshold measurements can be made
""to within an accuracy of approximately 5%. The radii measurements depend
upon the applicability of the drag law, and its specific accuracy, but are
probably good to within a few percent also.
- E. Some Experimental Results
In this section is presented a graphical representation of the
equations as a function cf the various physical parameters that are
applicable. Some measurements of thresholds and bubble growth rates are
also given for comparison. In these figures, unless specific mention is
*" made otherwise, it is assumed that we are considering an air bubble in
1" water with the following set of experimental conditions: P = 1.01 X 10⁵
-"-2 -1. -3 2 -I1_dyn cm , u - 68 dyn cm , 0 = 1.0 g cm , DI 0.20 cm s , u 1.0 X 10
S-1 -1. 6 -1 -5 2g cm s , c - 1.48 X 10 cm s , y - 1.4, T - 293 K, D 2.4 X 10 cm
41
...... _k L
- ' ¶-W • -i -2~T )
-s and d - 2.0 x 10 2 .
It is seen from (36) that the numerator of threshold equation can be
made to equal zero if the gas concentration ratio C i/C M 1 + 20/R P".i 0
0 That is, if the liquid is oversaturated by an amount greater than the
surface tension term, gas bubles will grow with no acoustic field applied.
This important fact will be discussed in some detail later.
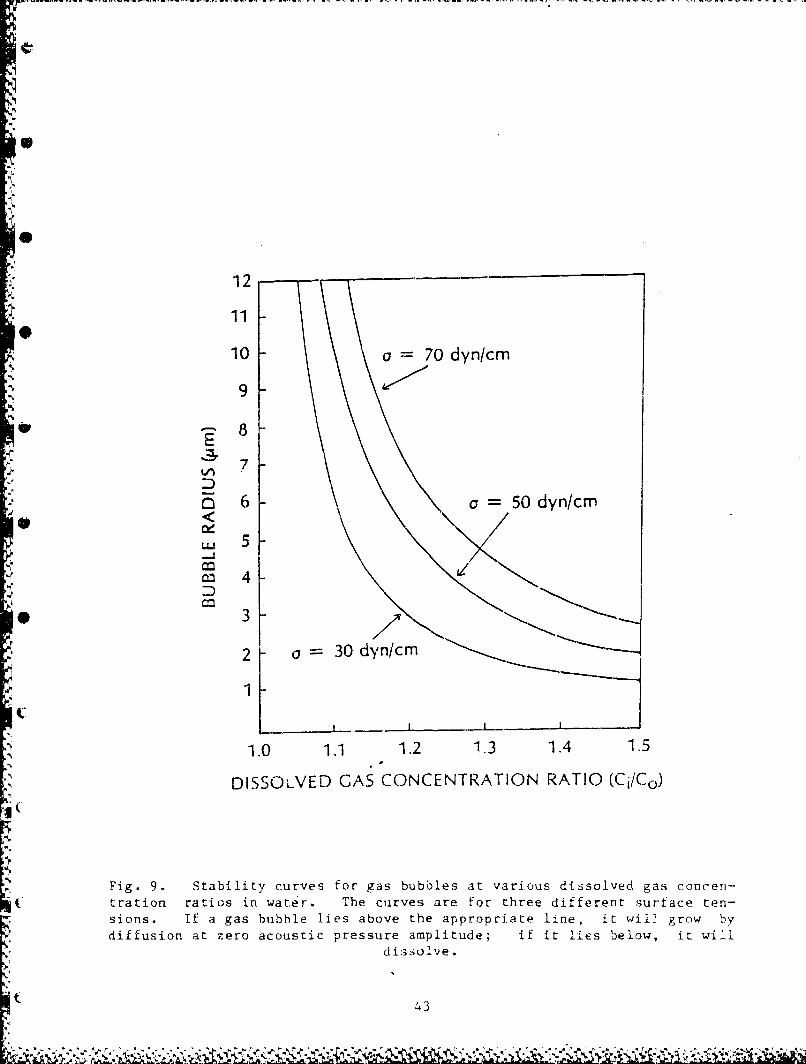
Consider Fig. 9, which shows a plot of bubble radius against the
dissolved gas concentration ratio (Ci/Co) for various surface tensions such
that the 'critical saturation' condition is met, that is, C i/C° I +
2aIR PC. This figure is presented to show the importance of the dissolved
gas concentration on gas bubble stability.
*, Central to the study of rectified diffusion are measurements of the
acoustic pressure amplitude required for bubble growth and the agreement
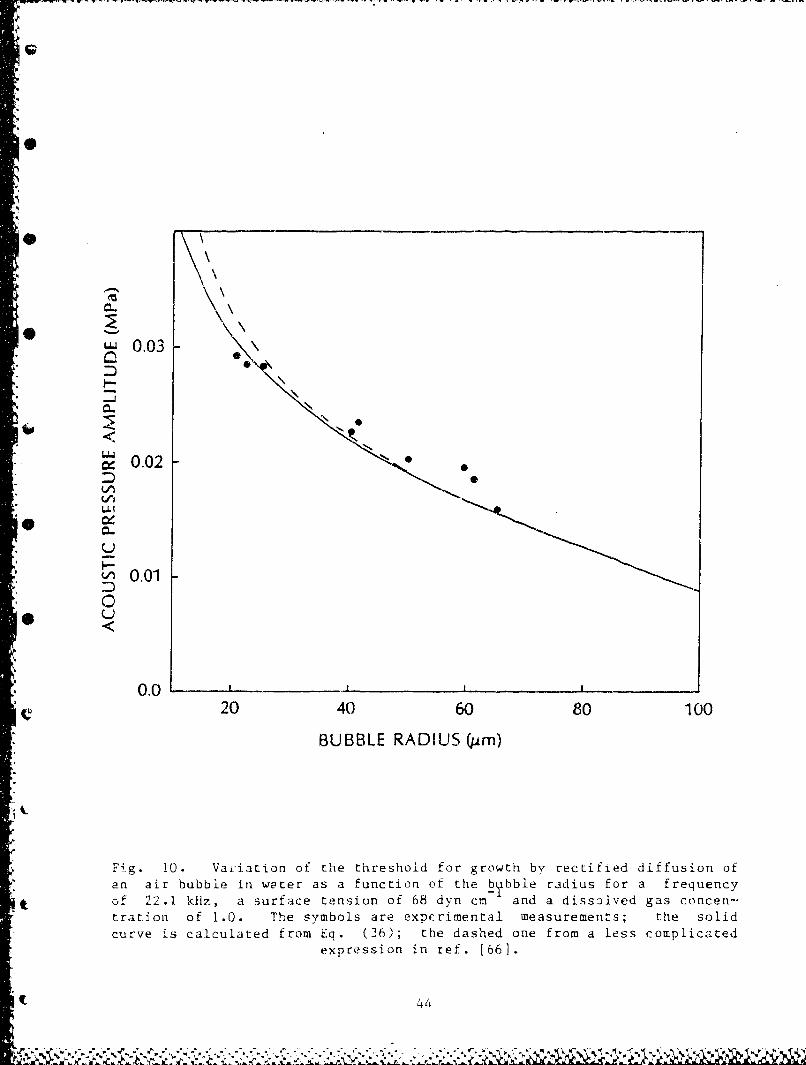
between these measurements and the applicable theory. Shown in Fig.10 are
measurements of the threshold for a region (i) case (frequency 22.1 kHz,
bubble radii ranging from 20 vm to 70 Lim) along with the theoretical
calculations. The solid curve is the prediction of (36); the dashed line
is a simplified version of the threshold applicable to this region of
consideration [ 73 ]. It is seen that the two equations give similar
predictions until the bubble radius becomes so small that the term 2G/R P
becomes significant with respect to unity.
The agreement between theory and experiment (for this limited range of
bubble radii) is seen to be rather good and within the range of
experimental error. This bubble range is particularly important ac this
frequency because it partially bridges the gap between isothermal behavior
(for R = 20 Am, r) - 1.01) and adiabatic behavior (for R = 80 , um,
1.23) of the bubble pulsations. The gradual reduction in the threshold as
the bubble radius increases is mostly due to the fact that as the bubble
042
0
"12
11
10 a = 70 dyn/cm
"9
" 6 a= 50 dyn/cm
LU 5
W~ 4-
* 3
2 a 30 dyn/cm
1
1.0 1.1 1.2 1.3 1.4 1.5
DISSOLVED GAS CONCENTRATION RATIO (Ci/Co)
Fig. 9. Stability curves for gas bubbles at various dissolved gas concen-
tration ratios in water. The curves are for three different surface ten-
sions. If a gas bubble lies above the appropriate line, it wil2 grow by
diffusion at zero acoustic pressure amplitude; if it lies below, it will
dissolve.
43
" .- , ,'--- -A, . r .- , --%
0.03
IF
0.02
00
S0.02
.LU
1--Li 0.01ZD0
"20 40 60 80 100
BUBBLE RADIUS (um)
Fig. 10. Variation of the threshold for growth by rectified diffusion ofan air bubble in water as a function of the bybble radius for a frequency
a. of 22.1 kHz, a surface tension of 68 dyn cm and a dissolved gas concen--tration of 1.0. The symbols are experimental measurements; the solidcurve is calculated from Eq. (36); the dashed one from a less complicated
expression in ref. [66].
"a. 44
grows toward resonance size its pulsation amplitude increases, which
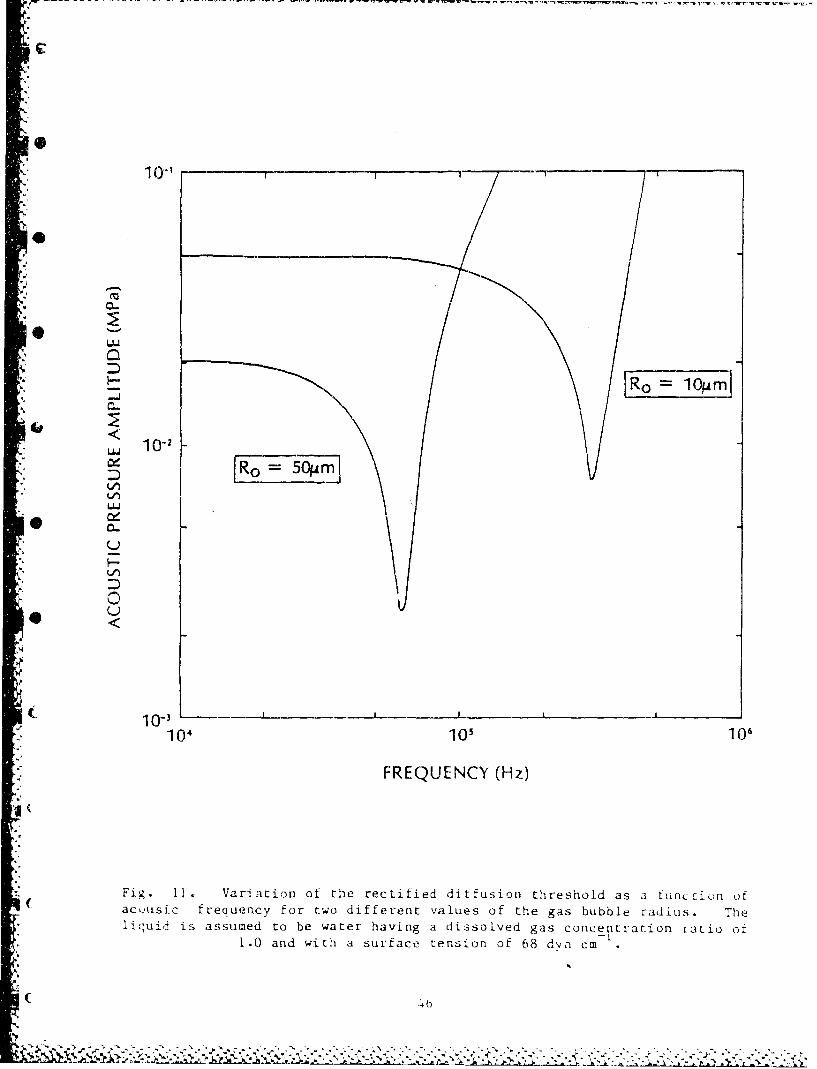
results in more rectified mass tranfer per cycle. Shown in Fig.11 is the
variation in the rectified diffusion threshold as a function of frequency
for two different values of the bubble radius.
A gas bubble present in a liquid containing a sinusoidally varying
pressure field behaves very much like a damped driven harmonic oscillator.
It has a linear resonance frequency given by (41). For a system in which
the frequency is fixed, and the radius varies, as is typical of studies
involving rectified diffusion, one can speak of a 'resonance radius' given
by a solution of (41) for R when w is replaced by the driving frequency.
In Fig. 12 the driving frequency is 1.0 MHz, the surface tension 68.0 dyn
cm , and the ambient pressure 0.1 MPa, thus giving a resonance radius of
3.15 Pm. It is seen that the threshold becomes very low near resonance due
"to the large pulsation amplitude of the bubble there. Near resonance, the
amplitude of the bubble's pulsations are determined mostly by the damping,
which is relatively small, and consequently the bubble oscillates rather
violently. It is not expected that the equations for bubble growth and for
the threshold will be very accurate in this region, however.
So far, our analysis in this section has been limited to the rectified
diffusion threshold. It is in order also to examine the rate of growth by
rectified diffusion when the acoustic pressure amplitude exceeds the
threshold. An examination cf the growth (or decay) of a bubble is shown in
1C Fig. 13. The symbols are experimental measurements; the curves were
obtained by numerical integration of (35). It was observed by Eller [57]
that his measurements of the growth rate were considerably larger than
predicted by theory. Gould [58] later confirmed the excessive growth rates
but also noticed that surface oscillations, with their associated acoustic
45
=%
L&
L 10-12-T"
"Li,
Li
__,1 0" 10, -10-
10-~ 3
104'• 10 1
FREQUENCY (Hz)
Fig. 11. Variation of the rectified diffusion threshold as a funcRion ofacousic frequency for two different values of the gas bubble radius. The.
* liquidi is assumed to be water having a dissolved gas conceytration ratio of1.0 and With d sur1face tension of 68 &4a cm
( -4 0*
1.0 I
\ /"0.5 Ci/Co =0.6
Ci/Co =1.0\/\ /
0.2
=) Ci/Co 1.5 I
L- 0.05
0
0.02
0.01 , , _ __ I0.1 0.2 0.5 1.0 2.0 5.0 10.0
BUBBLE RADIUS (Mm)
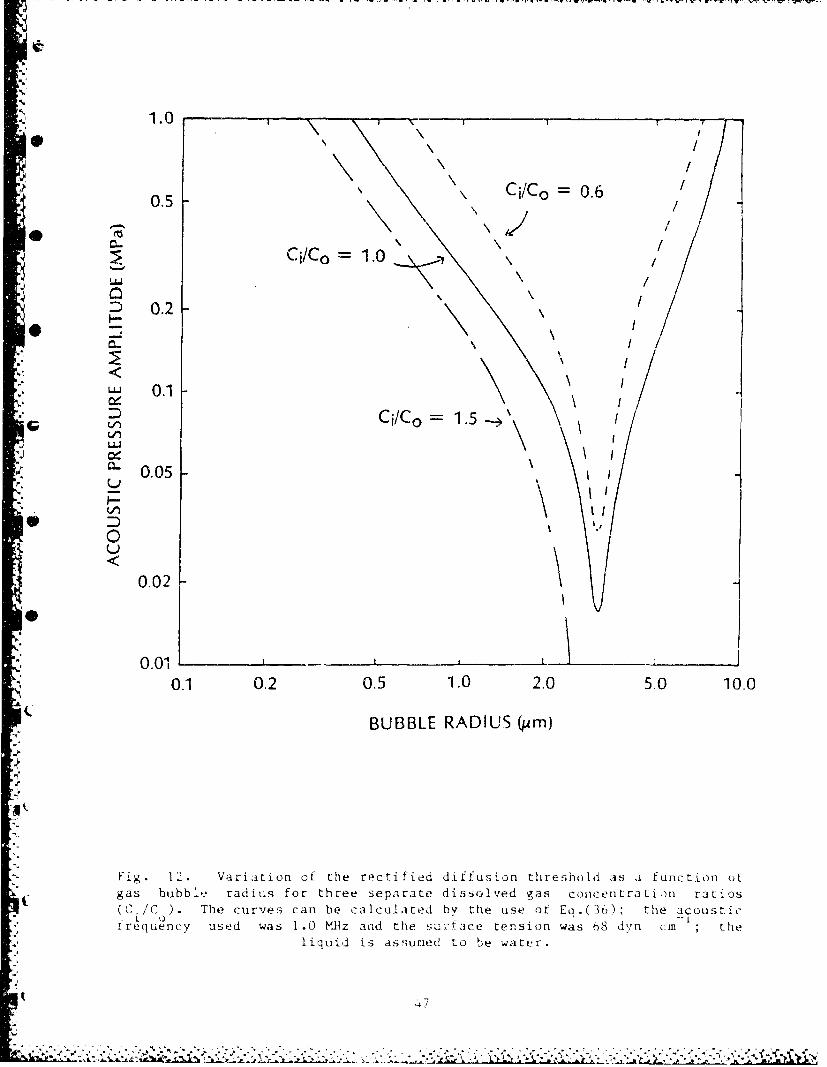
"Fig. I2. Variation of the recti fied di ffusion threshold as i function ofgas bubble radius for three separate dissolved gas concentraLion ratios
C,/( ) . The curves can be calculated by the use of E .( 3 ) the a 1ousticrrequency used was 1.0 MHz and the surface tension was 68 dyn cm ; the
liquid is assuried to be water.
;47
70
60-
50
-40-
(n
30d
-O-an 20-
0 100 200 300 400 500
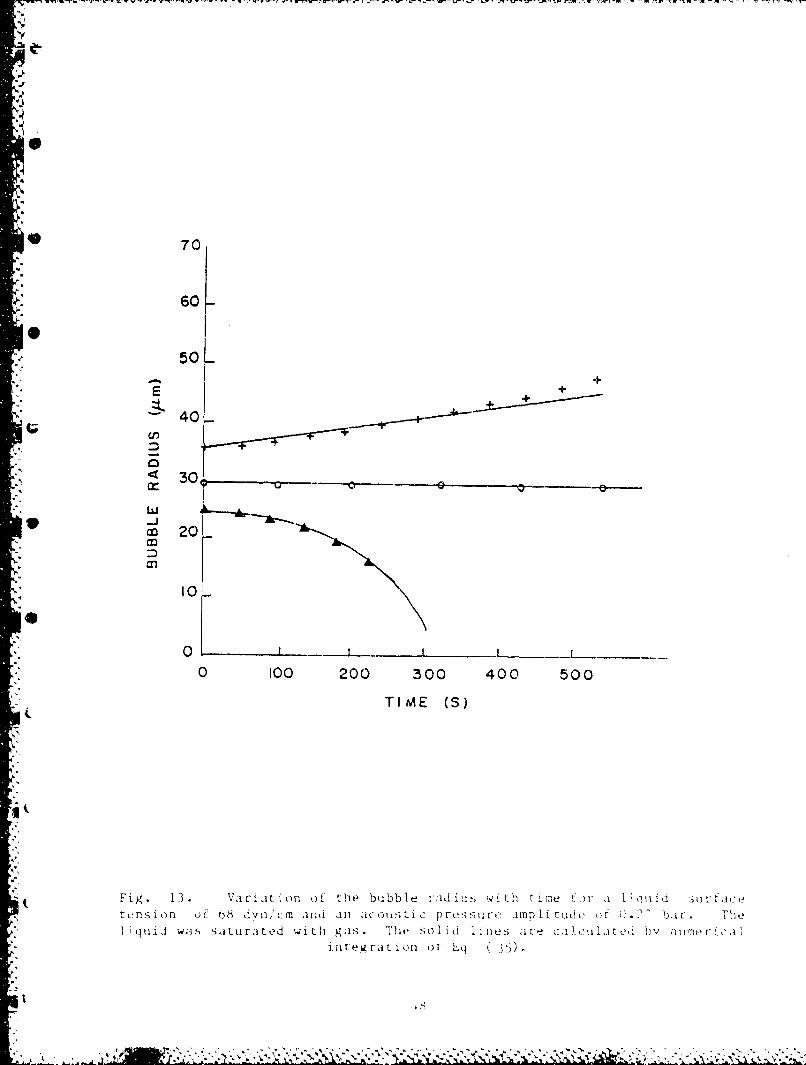
TIME (S)
p
SFig. 13. Variajt on of the bubble radius with time t r ,i iý.ouid siirfaco, ttfnsion ol; . )8 dvn,'cm ann an aicoustic pre-;stIre imp ii iudo of i).f b tr. The
-, liqui was saturated with gas. The solid lines are ca.)culited bv iluerical
intev ration or Eq 3 y;)
- I•
streaming, were probably the explanation for the increased gro'uth rates
that he observed.
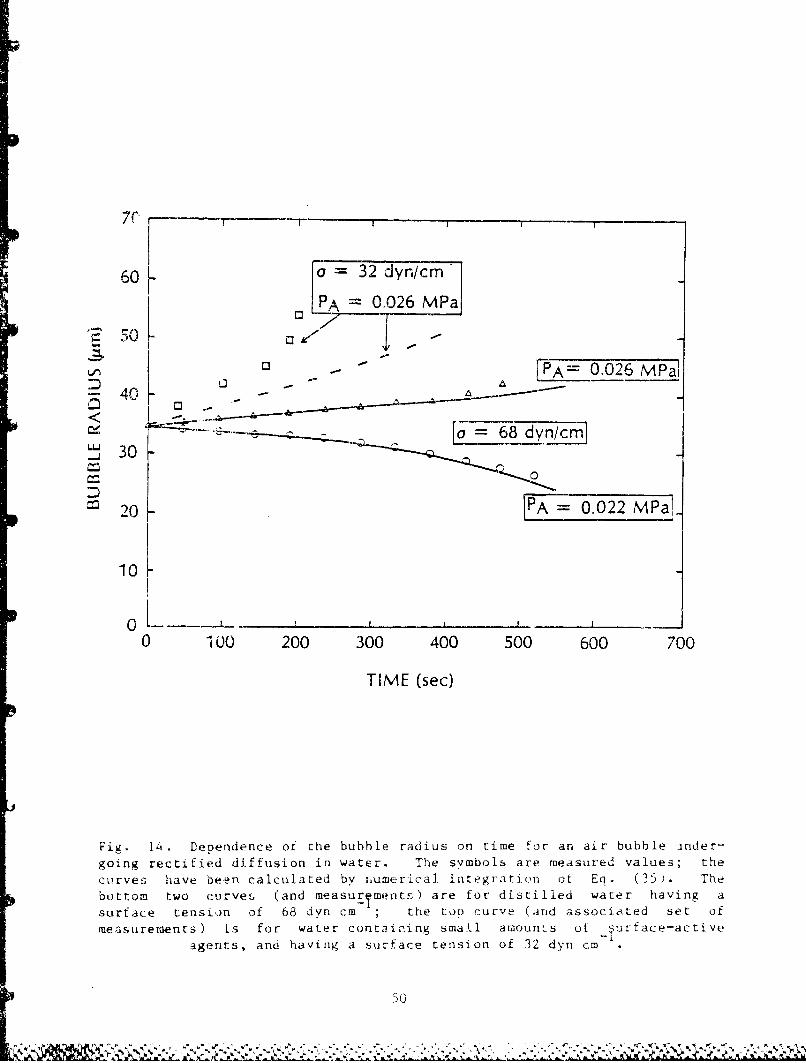
Shown in Fig.14 are some observations of gý'owth rates made by Crum
[63]. He observed an agreement between the measured and predicted rates
provided surface oscillations were avoided, and provided that the water was
* relatively p're and fcee of surface-active contaminants. When surface-
active agents were added to thc water, growth rates much higher tb.n
predicted were observed. Among the explanations offered tor this effect
_ were that (a) the surface active agents werE behaving as a reetifying
agent, permitting more diffusion In thAn ouL, and (b) acoustic streaming
was occurring in LhP absence of surface oscillations, induced someiLuw by
the surface contamination. This interesting anomaly has not yet bcei
explained.
Our attention is now turned to cases that are more applicable to
biological systems. As a specific experiment to consider, it waj
demonstrated by ter Haar et.al. [25-26] that echo ctenters probably
representing gas bubbles were observed in live guinea pig legs when exposed
to therapeutic ultrasound. It was suggested by Crum and Hanson [65] that
these bubbles of observable size were the result of cavitation nuclei that
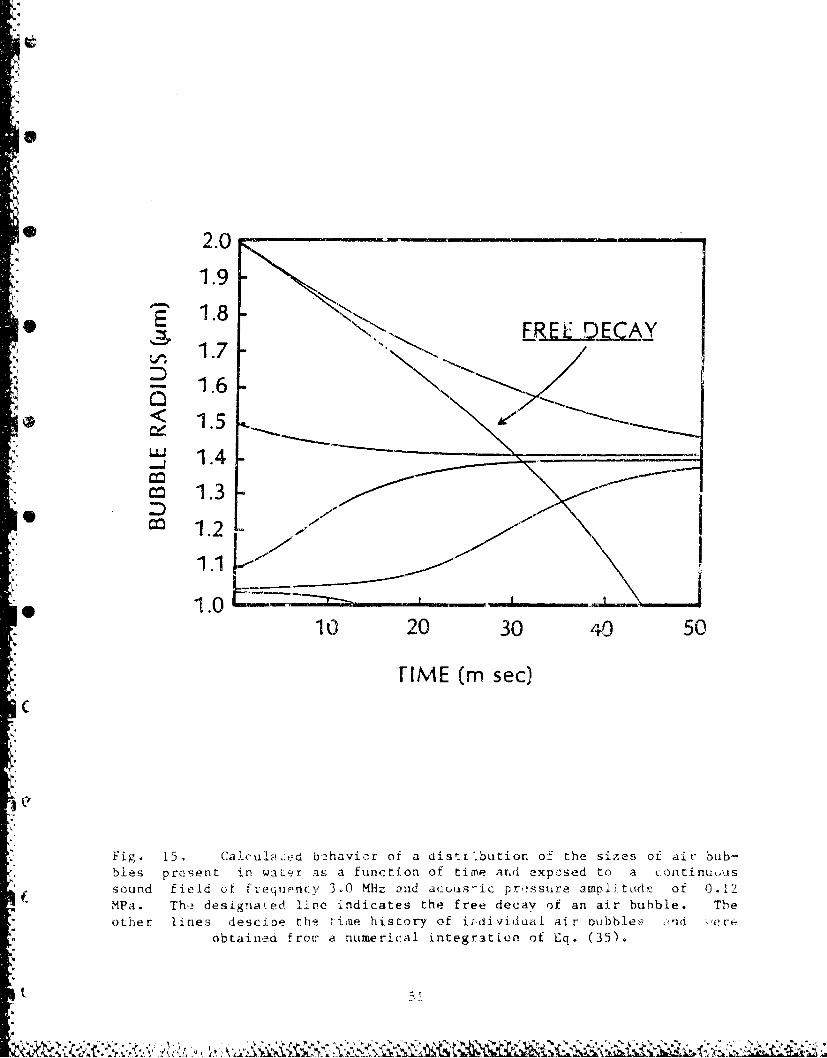
were made to grow by rectified diffusion. Consider Fig. 15 which
demonstrates what would happen to a population of free air bubbles (that
* are unstabila ed) with radii varying from lIm to 2 =m present in water when
exposed to continuous wave ultrasound of frequency 3 MHz and acoustic
"pressure amplitude of 0.12 MPa. This figure may be applicable to the
growth of microbubbles in tissue by therapeutic ultrasound. Note that if
this population of 'free air bubbles' were suddenly created, those bubbles
"with radii less than 1.03 urm would slowly dissolve regardless of the
l trasound. Those bubbles in the raiige of 1.03 Lim to 1.4 !jm would grow to
49
27"11
60 pao = 32 dyrn/cm
-P.- 0026 MPa
-n -6 I~ . MPal:D40 F A 3
S300
D _ _ _' 20 = 0.022 MPa,
10
0 100 200 300 400 500 600 700
TIME (sec)
Fig. 14i. Dependence of the bubble radius on time for an air bubble arnder-
going rectified diffusion in water. The symbols are measured values; the
curves have been calculated by uumerical integration of Eq. (35J. The
bottom two curve•, (and measurements) are for distilled water having a
surface tension of 68 dyn cm , the top curve (arid associated set of
mea sureent s) is for water containing small amourns of u urface-active
agents, and having a surface tension of 32 dyn cm
50
*e 2.0
1.9
, 1.8 FREE DECA
1.7F_
A g 1.6
-< 1.5
, • 1.4
S1.3
1.2
-e ~~~1.0 --,•_.__,
10 20 30 p0 50
TIME (m sec)'C
6,'
Fig. 15. Ca.IculI cted b-havior of a dist:.butior. of the sizes of air bub-
, bles present in waLer as a function of time arAd exposed to a continuous
sound field ot frequency 3.0 MHz and acuuasic pr•.•ssure ampl:ýtude of 0.12
MPa. ThŽ designa,.ed line indicates the free decay of an air buhble. The
other lines descioe the r-ime history of iidividual air oubbles <nd eereobtaineo froc" a numerical integr3tion of Lq. (35).
,, 'C-.&: NIh.
an asymptotic litait of about 1.42 i'm. Bubbles larger than 1.4 pm would
"decay to the asymptotic limit.
The reason for this limit is that due to the Laplace pressure, th.ere
is always a tendency to force gas out of the bubble (note the free decay
zurve on the figure). If the bubble radius is less than resonance size,
Santd greater than a Lhreshold size, the bubble will grow through resonance
to a size sufficiently above resonance where its pulsation amplitude will
result in an inward mass transfer due to pulsation that just matches the
* outward mass -ran~fer due to the Laplace pressure. If the bubble is larger
Phan the asymototic limit, it will not be able to overcome the outward
d iffusion due to the Laplace pres•vure and will Oxssýolve slowly until its
pulsation amp li tudc is large eaough to s"on further dissolution.
Consequently, there is a tendency to force microbubbles present in a liquid
to a uniform size that is dcpend&nt on the intrinsic and extrinsic physical
parameters.
The discovery by ter Haar et. al. that bubbles could be made to grow
in vivo by the a,:tion of CW ultrasound is extremely important in our study
cZ the bioeffects of ultrasound. Since it was seen in Fig. 15 above that
"gas bubbles would be forced to grow toward an asymptotic limit, it is
"pussible to us3e this concept to explain the presence of the bubbles that
* they observed.
The results of the experiment performed by ter haar eL.al. is depicted
"graphically in Fig. 16. In that, experiment they irradiated an anesthesized
guinea pig wit, therapeuitic ultrasound while monitoring the irradiated area
with a diagnos;tic scanner that could detect cbjects such as bubbles down to
a minimum si2e of 10 iim in diameter. Figý 16 shows char the cumuiat-ive
number of event-s observed as a function of irradiations. tiime for four values
'72 .,.-
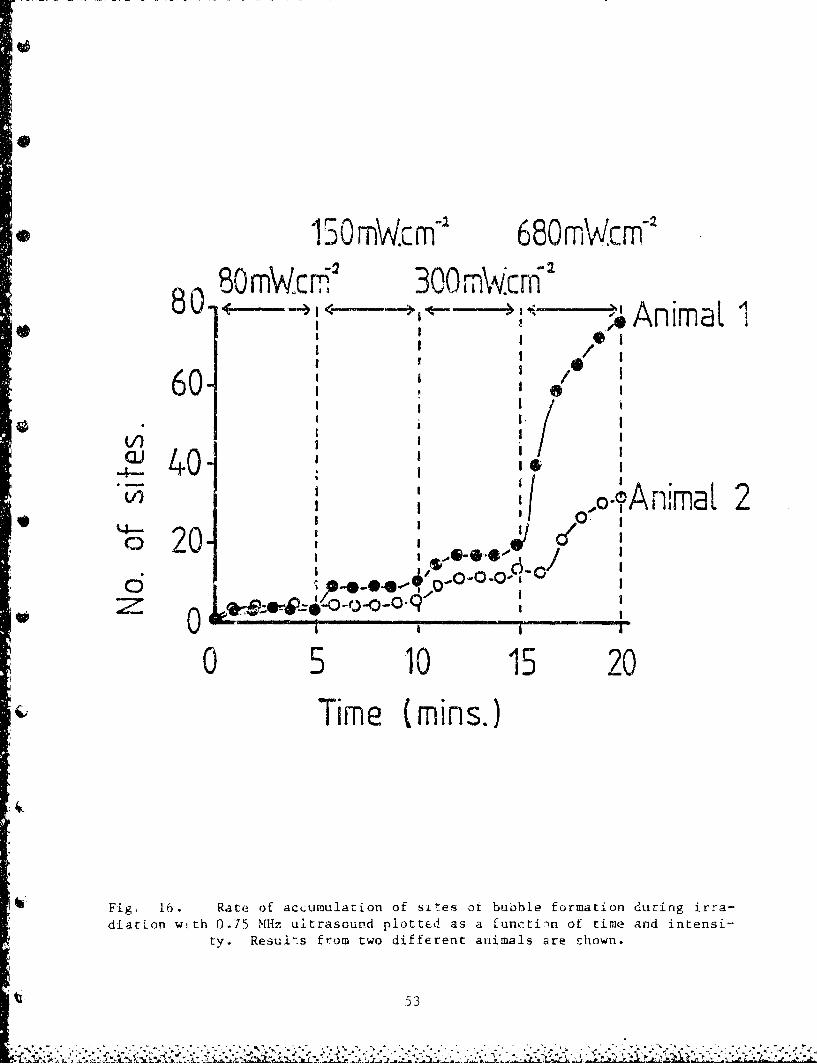
*5 0 rmW.c m1 680mWcm-
,OmW.cMr.4 300mW.c M'n80 - - -. ,1Animal 1-I---"I I
I I t @
5 e/*60 ''':I I ! , I
- 40 I Ii
o"?A, mo- a [l 220- , I/ I
0 5 10 15 20Time (mins.)
Fig, 16. Rate of acLumulation of sites of bubble formation during irra-diation with 0.75 MHz ultrasound plotted as a function of time and intensi-
ty. Resul.s from two different animals are shown.
153- ., I
of the spatial average intensity. The bubbles were assumed to have
-r* diameters larger than 10 ýira as that value was the approximate limit of
their resolution.
These aata were analyzed, by Crum and Hansen [65 1 and an explanation
given in terms of growth of cavitation nuclei by rectified diffusion. Fig.
17 shows the results of their calculation of the growth of nuclei (assumed
to be free bubbles) to sizes greater than the resolution limit for the
various intensities used in the ter Haar study (note that temporal peak
intensities were used in the calculation because the bubbles respond to the
peak acoustic pressure rather than the spatial average pressure - they are
. very small compared to the diameter of the irradiating transducer). It is
seen that only a few nuclei grow to visible size for the lowest
intensities; in agreement with the observation oi ter Haar et.al. The fact
that bubbles were seen that were larger than the theoretical asymptotic
limit is explained as due to bubble coalescence by Bjerknes forces [65 1.
F. Observations and Coraments
The observations about rectified diffusion that appear applicable to a
"- biological interests are as follows:
(i) pulsating bubbles are dynamic systems: A gas bubble present in a
CW sound field will gruw in size if driven with a pressure amplitude th.,•.t
is iarger than the threshold for rectified diffusion. As the bubble grows
- it will pass through harmonic regions [74] where its pulsation amplitude
can become very large inducira in turn severe shear stresses [42] in the
vicinity of the bubble. These shear stresses have been calculated by
Bjorno and Lewin to be sufficient to cause biological damage [41].
(ii) rectified diffusion thresholds can be exceeded by theraDeutic
ultrasound devices: The fact that ter Haar et.al. [25J have seen hundreds
"of bubbles produced by therapeutic ultrasound devices coupled with the
54*--*i* ** *---'.~ _~'
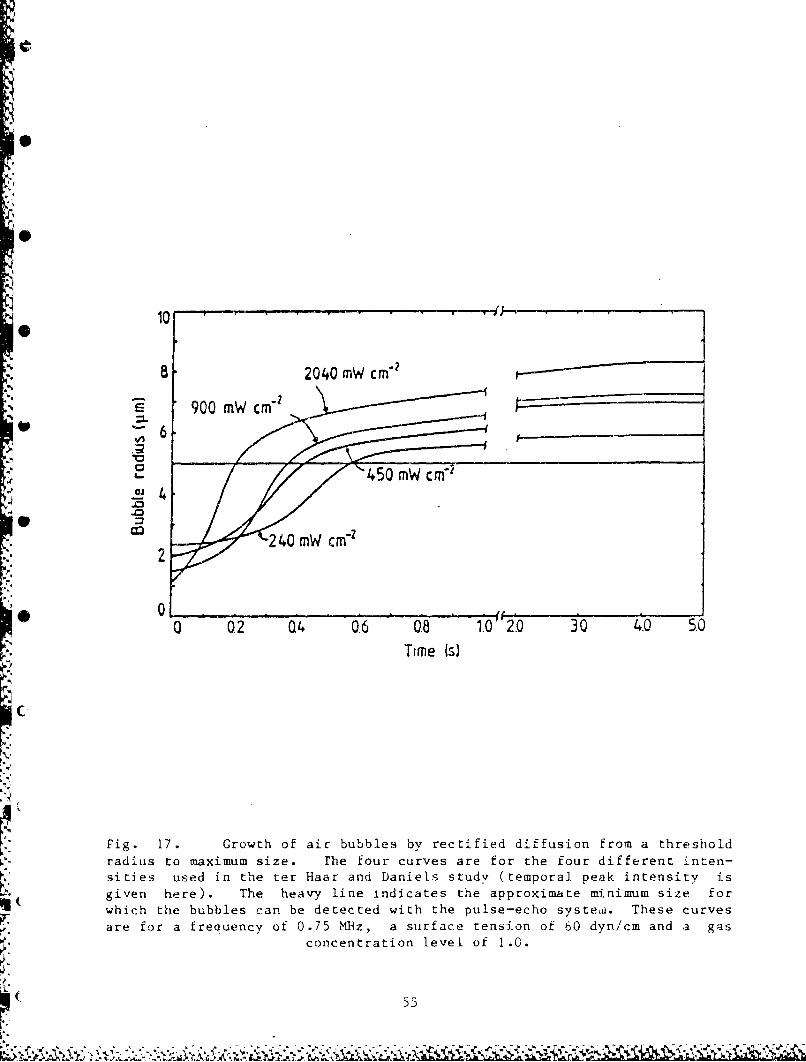
01
"8 2040 mW cm•2
•., .0 22
90 Time Cs)
v6
4.4
Fig. 17. Growth of air bubbles by rectified diffusion from a threshold
radius to maximum size. The four curves are for the four different inten-sities used in the ter Haar and Daniels study (temporal peak intensity isgiven here). The heavy line indicates the approximate minimum size forwhich the bubbles can be detected with the pulse-echo systew. These curves
are for a frequency of 0.75 Mthz, a surface tension of 60 dyn/cm and a gasconcentration level of 1.0.
55
observalon by Crum and Hansen f65] that this growth is consistent with the
predictions of rectified diffusion leads us to believe that this type of
behavior has a widespread occurrance. Recent studies by Dyson [75] that
healing rates can be significantly improved by application of therapeutic
ultrasound give additional evidence to this contention. In both ter Haar's
and Dyson's experiments, the application of a few atmospheres of static
pressure essentially eliminates the effects. Obviously bubbles are
involved; the mechanism of rectified diffusion is a likely candidate for
the explanation of the observations.
(iii) stabilized nuclei may have significantly lower rectified
diffusion thresholds: It was observed in the above discussions that there
is a threshold for rectified diffusion because one needs to overcome the
tendency of surface tension forces to force the gas contained within a
bubble into solution. However, the fact that cavitation nuclei are
stabilized implies that this surface tension force is somehow already
balanced. In the ionic skin model of Aculichev [6 ] arid the organic skin
model of Yount [12], a pulsation that did not break up the skin would cause
bubble growth essentially without a threshold. Some experimental support
for this concept exists in that Crum [63] has found that the addition of
surfactants to water both lower the threshold and increase the growth rate.
On the other hand, since a threshold does exist in water, these models
probably need some modification to account for the presence of the
threshold. Perhaps, in water, a crevice model is required, with ionics and
organics on the surface! Within biological tissue, however, it is quite
logical to assume that the small pockets of gas that do exist are
stabilized by mechanisms that effectively eliminate the surface tension and
thus reduce significantly the threshold for rectified diffusion.
56
III. STABLE CAVITATION
A. Introduction
There are manv areas associated with the biological effects of
ultrasound in which the amplitude of the acoustic field is relatively low
Sand the irradiation is continuous. Examples of such applications are some
"doppler scanners, and a variety of therapeutic devices. For these
situations, a preexisting cavitation nucleus may be nucleated according to
the conditions specified in section I, grow by rectified diffusion
according to the equations of section II, and pulsate violently for several
cycles - which we shall define as "stable" cavitation and now aiscuss in
some detail.
B. Some governing equations
The general topic of bubble dynamics is rather broad, will probably be
treated elsewhere in this course, and is beyond the scope of much of what
we wish to do here. Nevertheless, we shall need to do scme mathematical
analysis to obtain the equations we wish to utilize.
Consider a spherical bubble present in an infinite liquid and subject
to an oscillating pressure field. Following Prospereuti [76] who leans
heavily on the work of Keller [77], the followiug equation for the rad..al
oscillation of a bubble of instantaneous radius R(t) is obtained
(1-I•/c)RR + 3R 2 (i-1/3c)/2 = (I + 1k/c)(pi(R,t) - p (t))/p
4- (R/pc) dp(R,t)/dt. (42)
Here c is the velocity of sound, the dots denote differentiation with
respect to time, p. is the internal pressure, 1' is the static pressure
plus the appiled oscillating pressure and p is the pressuce in the liquid
57
*-<

just outside the bubble. The internal pressure is connected to the
external pressure by the condition on the normal stresses, viz.,
Pi(R,t) - p(R,t) + 2a/y + 4pR/R. (43)
* Again, a is the surface tension and p zhe viscosity of the liquid. The
viacous damping term is included in (-'3) and not in (42) partly out of
convenience and mostly because it can be quite significant for very small
bubbles. Eq. (42) contains the effef:t of the comnpressibility of the
liquid and does not make the polytropic exponent approximation. If the
liquid is assumea to be incompressible and the polytropic approximation is
made, then the well-known Rayleigh-.Plesset equation, given earlier as Eq.
(16), is obtained. It will be desirable to use (42) in. some of our
calcuJ3tions tc be discussed below rather Jian (16).
For the time being, ho-, ever, let us assume that th,- polyrropic
exponent approximation, can be made and examine solutions to the Rayleigh-
Plesser equatior that v:ill enable us to describe the oscillations :f a gas
bubble driven at relatively low iressure amplitudeq.
The linear or first-order approach to Lhis 2robl,?m is c(, assume Lhia-
the radius of the bubble can be written as
P - r, ( + x). (44)
( where x is given by Eqs. (22) throughi (26). This approach enables c-", to
obtain an analytical expressioa thac closely approximates the threshold and
growth rate for rectified diffusion, as shown earlier in Figs. 10 and 13,
p and enables one [78] to indirectly measure the variation of the polytropic
exponent with bubble radius, as shown in Fig. 18. This figure shows that
the linear approximation described above gives a general description of the
•t variation of the polytopic exoonent with the bubble radius until the :atio
* of bubble size to rsonance size approaches the value 0.5. At this point,
58
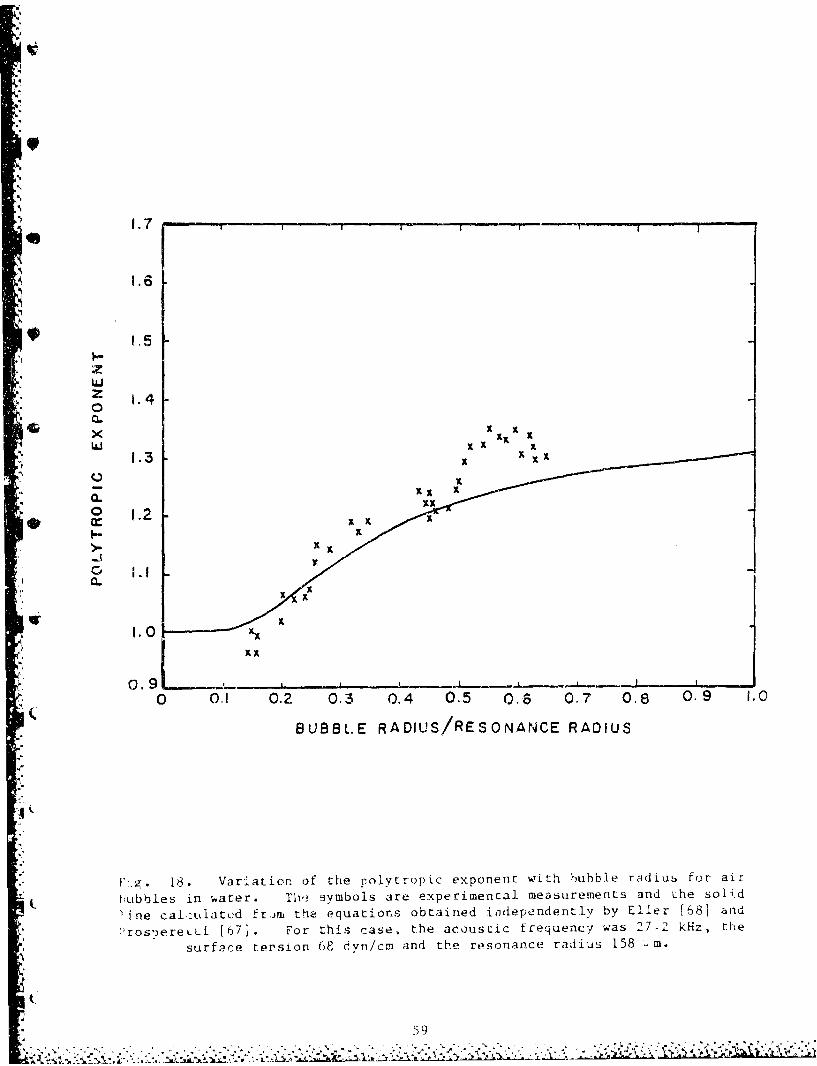
:.7
1.7
Z 1-4~XLI
w X X X
1.3 -
C.o0 1.2-
xx
0 0.! 0.2 0.•3 0.4 0.5 0.6 0.7 0.8 0. 9 1.0
,- BUBB1E RADIUS/RESONANCE RADIUS
I='•l" I--g . 18" Variation of the polyitropic exponent with bubble radiu~s for air
!•. Ibubbles in hater. Th• symbols are experimental measurements and the solid
-• ne cal-tuiatod from the equations obtained inidependently by Eller {68j and
-%" t'ros-)ereLLi [67j. For this case, the acoustic frequency •as 2°7.2 kHz, the•'., surface terston 68 dyn/cm and the resonance radius 158 iJm.
59
CL2.
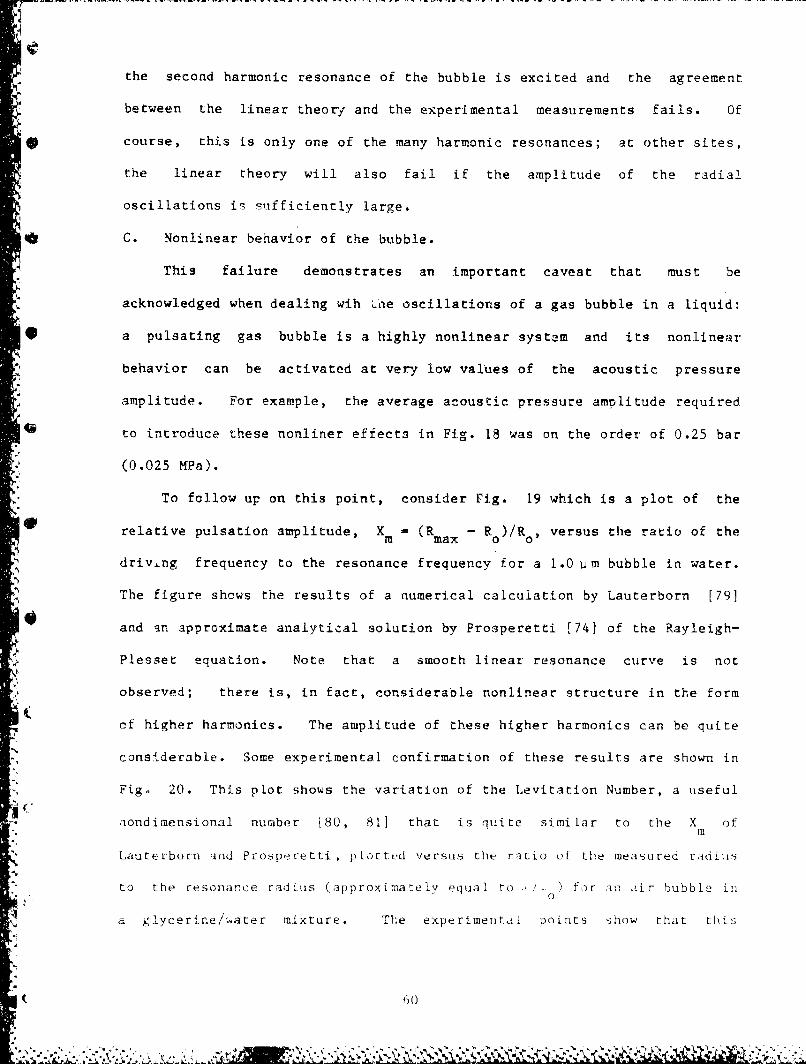
the second harmonic resonance of the bubble is excited and the agreement
between the linear theory and the experimental measurements fails. Of
* course, this is only one of the many harmonic resonances; at other sites,
the linear theory will also fail if the amplitude of the radial
oscillations is sufficiently large.
- C. Nonlinear behavior of the bubble.
This failure demonstrates an important caveat that must be
acknowledged when dealing wih Lne oscillations of a gas bubble in a liquid:
* a pulsating gas bubble is a highly nonlinear system and its nonlinear
behavior can be activated at very low values of the acoustic pressure
amplitude. For example, the average acoustic pressure amplitude required
to introduce these nonliner effects in Fig. 18 was on the order of 0.25 bar
(0.025 MPa).
To follow up on this point, consider Fig. 19 which is a plot of the
relative pulsation amplitude, Xm M (Rmax - Ro)/Ro, versus the ratio of the
driving frequency to the resonance frequency for a 1.0 im bubble in water.
The figure shows the results of a numerical calculation by Lauterborn [79]
and in approximate analytical solution by Prosperetti [74) of the Rayleigh-
Plesset equation. Note that a smooth linear resonance curve is not
- observed; there is, in fact, considerable nonlinear structure in the form
of higher harmonics. The amplitude of these higher harmonics can be quite
considerable. Some experimental confirmation of these results are shown in
Fig. 20. This plot shows the variation of the Levitation Number, a useful
nondimensional number j80, 81] that is quite similar to the X ofrm
Lauterborn and Prosperetti, p lotted versus the ratio of the measured radius
to the resonance radius (approximately equal to fo ) tr an air bubble inl
600
• aglycerinei~ater mixture. The expe rimentalI points show that this
'( 6O(
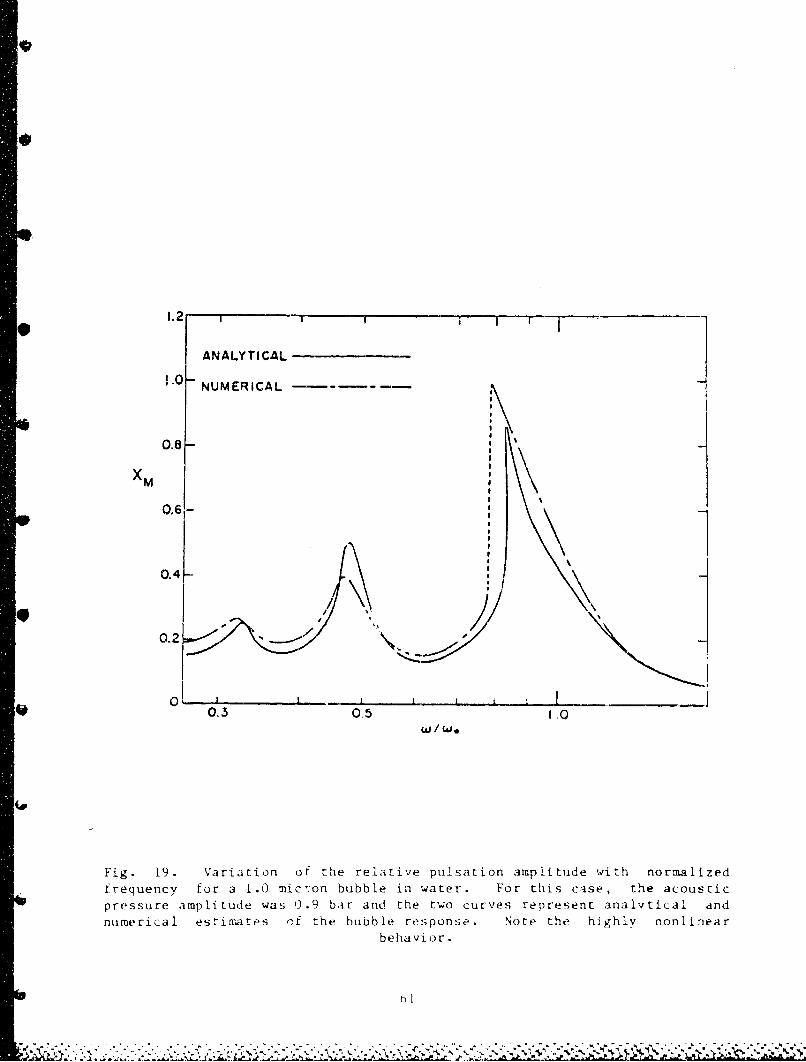
1l.2 I I I I r;1.2
ANALYTICAL
NUMERICAL
0.8 F
XM
0.6-
0 .4 r
0.2 • , -7
* 01
0.3 0.5 1.0WI W.
Fig. 19. Variation of the relative pulsation amplitude with normalizedfrequency for a 1.0 mic'.on bubble in water. For this case, the acousticpressure amplitude was 0.9 bar and the two curves represent analytical andnumerical estimates of the bubble response. Note the highly nonlinear
behavior.
t)~ t
0. 105-
V 0 029 0 I~J. /
_--.-
+
0. 075
*
o. 0. 000
for an air bubble in a glv(eri.ne/watc r mixture. Te solid line represents
a numerical solution to Eq. (lb) with use ot a pol7tropic aporoxi mation and
o an Ietrec tibVe vi S ositv used zo account t. r the the ma I d amp i ng . Thebroken line represents a naumerical solution to Eq. ( 4-` ) wi t the thermal
damping calculated direc tly from the internal pressure. The svmboIs ,t re
experimental mnas lre~nents. For- Lhi.s casei, the driving frequencv wa, -2..2
-iand the re,.onance radius was 1.38 microns.
<(
%0
nonlinear behavior is Easily observed; the dravn lines are theoretical
calculations that indicate that there is not good agreement between the
calculated and measured values. The solid line shows the analytical4P•result that one would expect if one assumes a polytropic approximation;
the broken line is a numerical result in which the interna7. pressure is
calculated directly, and the thermal damping obtained from this resultý in
this recent calculation, we have used Eq. (42) and obtained "he internal
pressure by a solution of the Navier-Stokes equations [821. This new
formulation is quite fundamental in approach and gives us an opportunity to
examine a host of interesting problems of this nature in the future.
D. Harmonics, subharmonics and noise.
One anticipates that the sound radiated by an oscillating bubble will
be related to the radius-time curve of a bubble's oscillation for a given
set of physical parameters. We have shown that most aspects of nonlinear
bubble dynamics can be described (in a qualititive sense, at least) by
* analytical and numerical approaches. We show in Fig. 21 the radius-time
(R-t) curve that was obtained numerically for a bubble under thi given
conditions shown on the figure. This result was obtained by a numerical
integration if the Rayleigh-Plesset quation, Eq. (16). Also shown in Fig.
21 in the upper left-hand corner, is a frequency spectrum of that bubble's
oscil.at!on. Note that the bubble's R-t curve shows obvious nonlinear
effects that are detailed more clearly in the frequency spectrum (hereafter
referred to as the Fast Fourier Transform, FFT). It is seen that with the
given conditious, the frequency saectrum is rich in harmonics, kýut shows
only an indication of suhharmonLC behavior. We shall assume (somewhat
naively) that the -:ound radiated from the bubble would reflect the
composition of the FFT. By tne way, our numeric-ii solution given in Figs.
21 and 22 includes oi:r best: estimate of intrinsic bubble parametrOts such as
* * A ~, * 0 .
* *
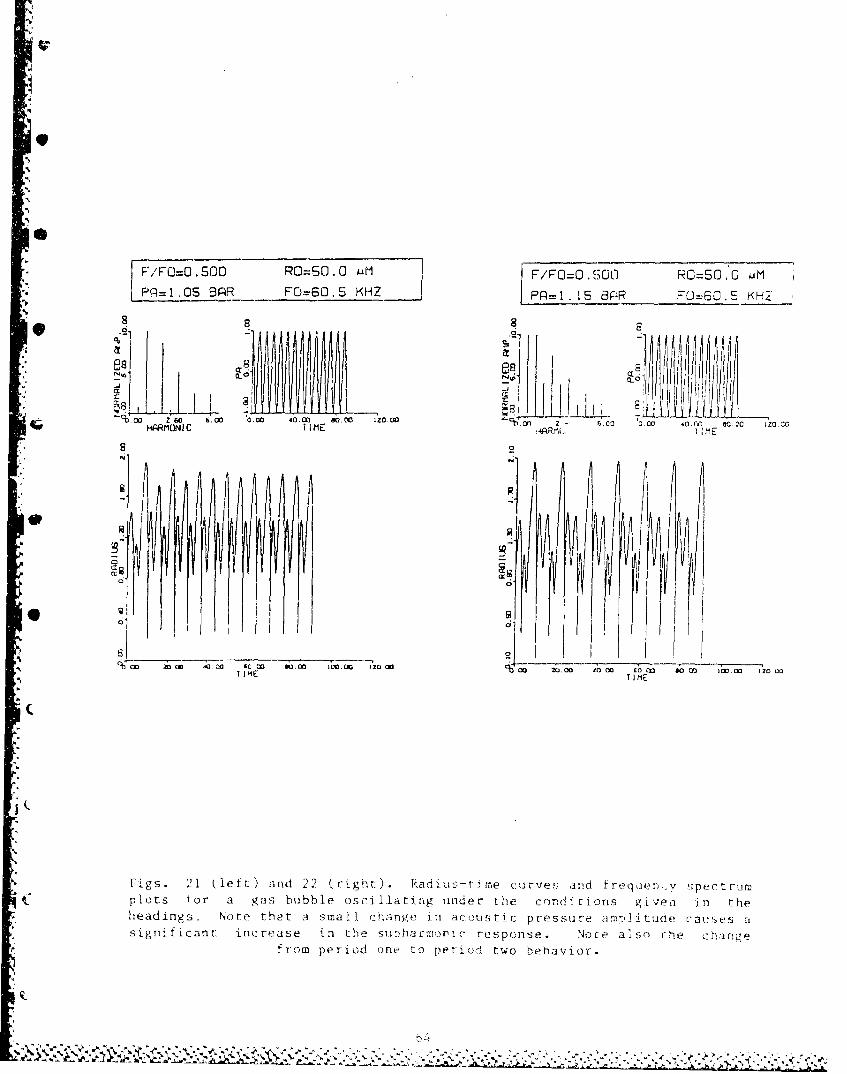
F/F0=0.500 P0=S0. 0 ON F/FO=0.500 RC=50.0O mM
PA=1.OSBAR F0=60.5 KHZ PP=1ji5 BPR FCJ60. S rKHZ-
a8
0000
TIME 2-0 60a 600 000 so 00 100.00 iZO 001-'0 2
F Pigs 1 (1 f ) in " Cs 1 m TIME.ý: and fr qie i C s ectCrum
_1 g_ LVhe d n s Note th a 'j) C LSI(, tP ,; r ,1, itu e c i s asigniticant,~ ~ ~ ~~~~~~~~I inraei h s!hroi epos.Nc'lo -eh 70 ~ ~ e id oeiopro w I
the damping and the polyropic exponerit,,
A w-ry important aspect. of our still preliminary results is shown in
Fig. 22. This figure reflects the same conditions shown in Fig. ') except
that the acoustic pressure amplitude has been increased by approximately
10%.
The FFT now shows that the bubble's oscillation is rich in
subharmonics and ultraharmonics (3f /2, 5f /2 eLc.). The rapid appearance
of these frequency components implies that a threshold exists for their
generation and that once they appear the spectrum can rapidly approach what
one can term white noise. We can show this idea by taking a slight
digression to consider what is commonly called the theory of "deterministic
* chaos".
E. Bubble Chaos
It can be observed in Fig. 21 that in the R-t curve, there is an
obvious transient response that rapidly leads to steady-state behavior.
The steady state that the bubble may approach may be a simple linear
resuonse that oscillates at the driving frequency, or, if the driving
.2 amplitude is safficiently high, at a frequer.y that is half the driving
frequency (subharmonic of order 1/2), or t_ frequency that is twice the
driving frequency (harmonic of order 2), or any number of other allowed
frequencies. Consider a phase-space plot of the velocitv of the bubble's
interfare versus the radius of the bubble (often called a Poincare Plot) as
shown in Fig. 23,, This plor is generated by examining a constant-phase
value of the radius and the velocity after each cycle. In this case, the
bubble was drivn at an amplitude sufficiently high to cause it to oscillate
in a 'pefiod two" mode, i.e., a subharmonic ot order i/2. Further, there
( was only a small amount of damping supplied so that the transient exisced
: or several cycles.
65
-J
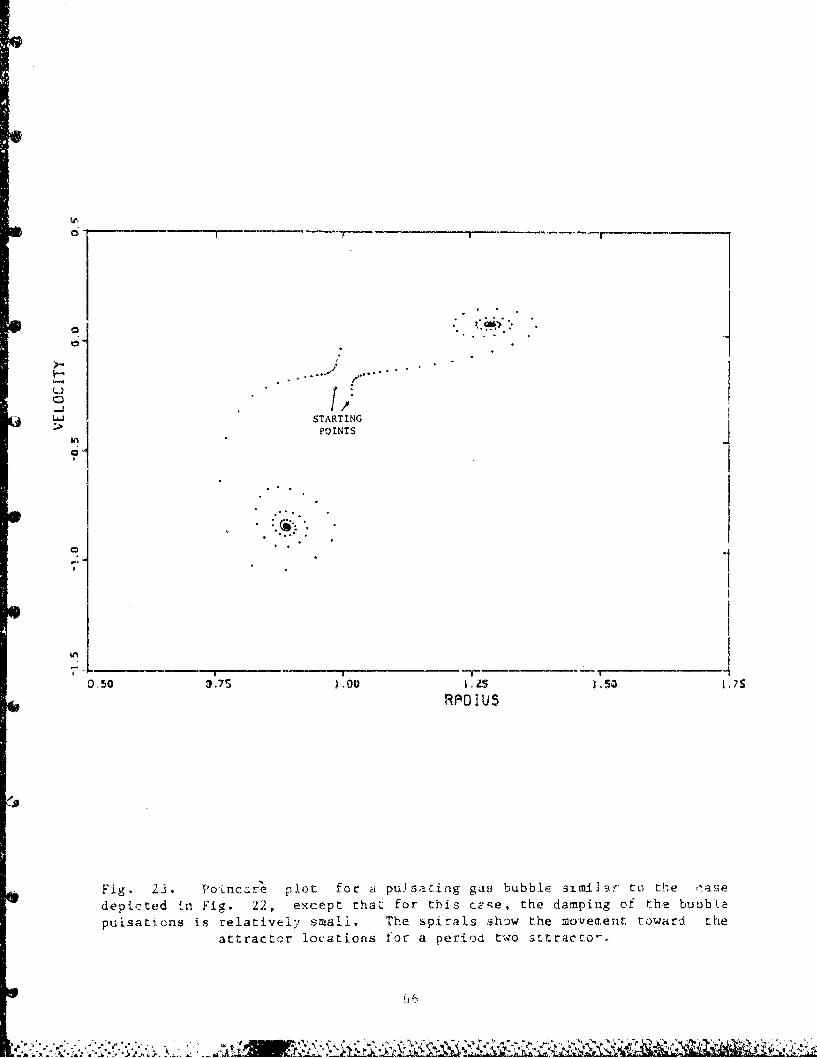
"tI
- . 6.•
I STARTINGPOINTS
7'
7"
0.50 a .7S .00 1.25 1.5a l.7S
RIMOUS
Fig. 23. Poincc-r~e lot for a pu) sating gas bubble simi I ar to th.e aas•edepicted in Fig. 22, except that for this coe, the damping of the buLb .epulsations is relative',, smali. The spirals show the moveir.ent towardi the
attractor locations for a period two -ttracto-'
The two regions ,shoiwn on the figure show that the bobble slowly
spirals into two points, called "attractors" In phase-space. If the bubble
wer'e driven at a relatively low amplltude, then it would behave linearly
and spiral into only .:ne point, and would oscillate in a "period one" mode.
We next consider what happens as the bubble is driven at progre2sively
higher amplitudes. One method for determining what occurs is to examine
the FFT. This approach is sow.ewýiat expirical in tnat one only observes
what "has oc'zurred", rather thans following a logical., predictable path to
expl,-in what "should happen". The ",-nnos" approach (83-84] is to examine
certain modes of oscillation in order to determine when and how the
tvansiAion to chaotic behawior occurs. Consider Fig. 24 below, which we
have ootained froin our numerical scudiec., and which describes the behavior
of our no)nlinear bubble systew as it bifurcates to higher and higlher
periods. Plotted as the ordinate is the value of the radius, at some
arbitrarily-fixed point in its cycle, examined as a function of driving
amplitude, at the same point in the cycle. (Thia is as if one Look a strobe
picture each cycle.) Plotted as th2 abscissa is the driving acoustic
pressure amplitude exerienced by the bubble. Note from the figure that as
• the amplitude is increased, there is a bifurcation from "period one"
b~havlor to "period two" behavior at the amplitude A1 , from "period two" to
"'per.cd four" at A2 etc., until one reaches a chaotic state. Although the
• ieery of chaos in nonlinear mechianics is styill in its itnfa.ncy, it has been
determined that for dissipative systems (such as an air bubble), the imit
of the ratio (AN+ I -, A 11/'(AN- 2 -AN+I) should be given by a constant, called
FeJ4 s C0 T1S l 0, tN81. 0ýr ul ssFeigenbaum's constant !841 (Jor our s astem here, the value we get for
", .nis constant is 2.0, as c~ompared to an accepc.e' valkie of 4,6J9; .how eve r,
D our results are preliinirarv and lots of wcork still needs to be done. The
* fact tha,: these Lwo numbers don' agtee 5s in itself Lsther interesting.
( 67
CDL.)
I I C Ln
C7.. *.. .. . ,,. .•.;i
* . . .
C-U
?•" •o 1 .. I.1 ... .. .
*• ...-. .. .- .. 1*
CZ
X8-• • ------ ---- :--,G : ' o -
1L.00 1.08 1.1is 1.24 .Z14PR
-I ." . .
Fig. 24. Feigenbaum "tree" s' owing the systematic sequence of bifurcation
* leading to chaos for agas bub'L Le of 50 microns and driven at approximatelyone half its resonance frequency.
4: 68
Thus, in principle, one can systematically determine the advent of each
bifurcation and its associated frequency of sound radiation, as the system
approaches chaos (or white noise).
What has all this to do with the biological effects of ultrasound? Quite
a lot, really! The principal method used so far to determine that
cavitation does or does not exist in an opaque medium is to detect the
presence of radiated acoustic signals that are associated with cavitation -
subharmonics or white noise. Our examination of where this noise
originates, and why it is there is extremely important if these concepts
are still to used said as cavitation indicators. Further, if clinical
ultrasound systems are found to be inducing cavitation, either stable or
transient, it will be very important to determine as much as we can about
the nature of the cavitation and its potential for damage. We now examine
a cavitation phenomenon that has high damage potential.
F. Sonoluminescence from stable cavitation
Sonoluminescence is a phenomenon first observed over 50 years ago [85]
in which light is emitted from a gas bubble set into violent oscillation by
an acoustic field. Several explanations (86] for this light emission have
been given over the years but it is now reasonably well established [49-51]
to be a result of the radiative recombination of certain free radical
species produced by the collapsing bubble as it drives the interior gases
to high temperatures.
Although detection schemes for this phenomenon have included the naked
eye [87], exposure of photographic plates [881, and photomultipliers [88],
recently Reynolds et.al. [89] have used an image intensification technique
to record low-level omissions. We wish to now describe the use of this
system tcr examine cavitation produced by an ultrasonic horn driver in a
V?
- - ., S*
tank of water. The horn produced standing waves within the tank and
cavitation-like bubble activity was observed to occur at the pressure
antinodes according to the general custom.
0 The experimental apparatus is shown in Fig, 25. After a desirable
level of sonoluminscence was achieved by adjusting the position of the horn
"in the chamber, the output of the image intensifier tube (UiT) was recorded
by a video camera on magnetic tape for a variety of voltages supplied to
the horn. The patterns observed by the liT were later reviewed with the
VCR, and when a desirable feature was observed, the frame was frozen and a
still photograph taken with a 35 mm camera. A succession of these photos
for increasing pressure amplitude are shown in Fig. 26.
Fig. 26a shows that light emissions begin to appear in a layer near
the tip of the horn. It is known that an antinodal plane of pressure
should exist there and at successive half-wavelength distances from the
horn in a vertical direction if standing waves are excited in the tank of
water. In Fig. 26a the broad band of light emission near the bottom of the
frame coincides with the horn tip. Note also that there is a single spot
of light occurring in the upper left of this frame. This spot if; at the--0
position of the second antinodal plane as is indicated by the development
of this band in Figs. 26b and 26c. The curious row of 6 separate spots of
light in this band maintained their individual identities until the
pressure amplitude was increased. As shown in Fig. 26d, a third row of
individual light producing centers developed that became well defined in
* Fig. 26e. At this stage, there was considerable movement of the light
emitting centers back and forth within separate antinodal planes, but no
* distinguishable mGvement between planes. Furthet, it is seen in Fig. 26e
•( that the 6 separate centers of Fig. ?6d have started to blend into one
single band.
• 70- (
-- LIGHT TIGHT BOX
<--HORN OUTPUT PHOSPHOR
VIDE"" WATER TANK
- INPUT
PHOTOCATHODE
HORN
* •DRIVER
MONITOR
STILL CAMERA
Fig. 25. Experimental arrangement for obtaining information about
sonolumiriescence asing a image intensifier tube appar-atus.
71
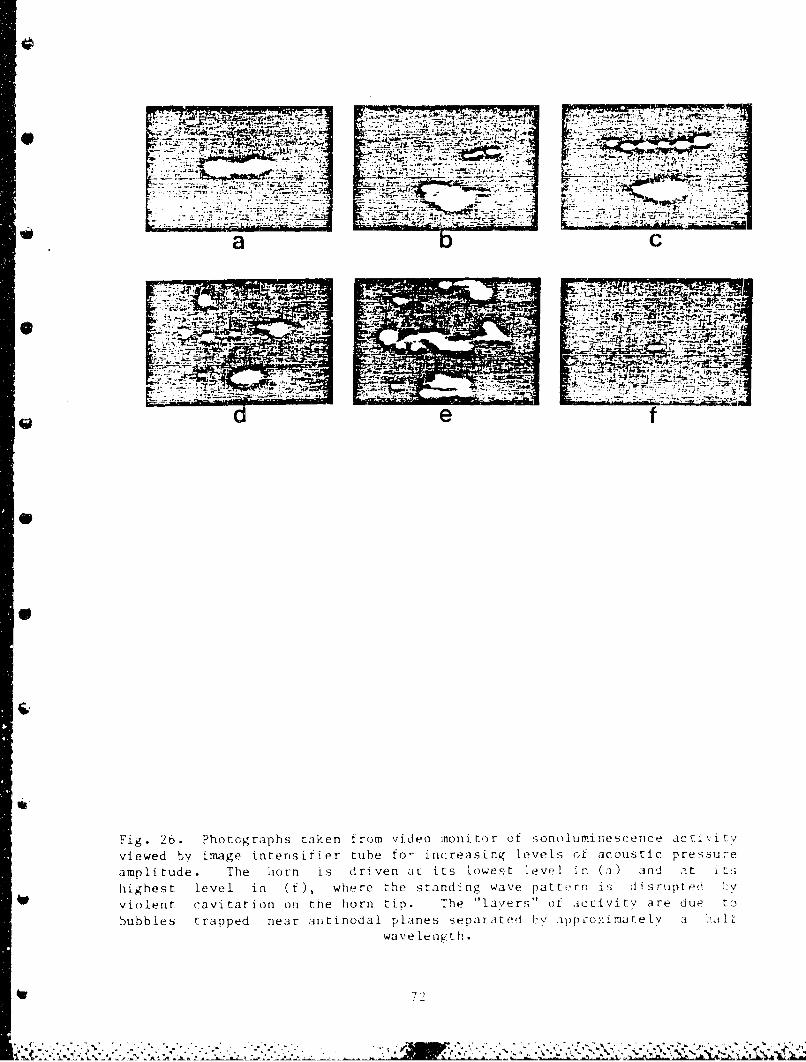
W;&
* '-~~' ~qr - 4-
___________ ~ -7- ,--- ,, V
Fig 26. Phtgah ae rm.ie.oio tsnluiecneaf.~
viewed by image intensifier tube fo- increasing levels (A acoustic pressure
amplitude. The iio rn i s driven at its laweý-t; level In (,-0) anA t I. I;
h igh e st Level ina ( f) where the standing wave pattern, is dIi srup ted I-V
vio lent cavi tation on the horn -Lip. The "lavers" of acuivi tv are dup t o
hubbies trapped near antinodal planes Separated Lv appra,:imarely a Iawa ve 1t n g t h .
If the pressure amplitude is increased even further, the light
emission nearly cease2s, except for oue spot near the tip of the horn, as
sLown in Fig 26f. This effect is a well-known characteristic of cavitation
produced by horn radiators and is a consequence of such violent cavitation
on the horn tip that the sound is no longer propagated into the bulk of tfte
- fluid. A rough measurement of the sound field indicated a threshold for
light emission on the order of 1.5 bars (0.15 MPa).
The degree of sonoluminescence activity described here is rather
* renarkable considering the relatively low level of cavitation activity
associated with the modest levels of acoustic pressure amplitude ganerated
in the tank.
A visual inspection of the system revealed that at low driving levels,
* say Fig. 26a, there was almost no bubble activity at all, perhaps a thin,
-. barely visible "streamer", but certainly no 'snappy" cavitation typical of
"4p transient events. Even at the hi.ghest level of light emission, as in Fig.
26e, only a few thin streamers were visible. On occasion, the feather-like
track [90-92] and sharp snap of a transient event was observ;ed, but only
near t.he very bottom of the tank, well below the area viewed by the ITT.
It appears that there can be considerable amounts of light emitted from
what most of us would cal.1 "stable" cavitation.
In a detailed and extensive report on a similar experiment, Saksena
and Nyborg 193] described the observation of sonoluniinescence from "stable"
c cavit..tion iLi both water and a niuture of glycerine and water. There,
1, ight was observed even in the absence of streamers in the gliceri nei'wate,7
mixture Our eusi rvat ions e ere corroborate those findings and indicate
that v lent, osC Lrac' iVe collapses nc ed not occur turr consider) 1be amount s
-c li, ht 3ut:ut to occur. Since it is now rather weLi-es!abiished that the
4; 73
light-emission mechanism is associated with free radical production (and.
_ recombination), the presence of sonoluminescence is an indication oc
F_ potentially very harmful chemical activity,,
Using our new formulation of bubble dynami.,a, we have been able to
calculate the temperatures associated with a violently pulsating gas bubble
driven near its principal resonance and at an off-resonance point. Shown
!.n Fig. 27 is the temporal variation of the temperature for a 50 wm bubble
driven at the modest pressure amplitude of 0.6 bar (0.06 MPa) and for
frequencies equal to 0.8 and 0.4 times its resonance frequency. It can be
seen that the temperature in the interior of the bubble rises to nearly
03000 K, sufficiently high for luminescenceto occur, for the excitation near
the principal resonance.
G. Concluding remarks.
This phenomenon of stable cavitation becomes particularly appropriate,
in a biological-effects sense, when one considers the fact that theraputic
ultrasound with acoustic pressure amplitudes on the order of 0.1 MPa has
been shown to induce bubble formation in vivo [25-26], and that these
bubbles are made to grow by ultrasonic means [27). A bubble trapped in
tissue would not be as free to move away from the pressure maxima as they
are in liquids, and accordingly could generate copious awounts of highly
reactive free radicals. It seems logical that growth by rectified
diffusion would also be restrained and consequently the bubble could spend
a considerable number of oscillations in large-amplitude 1u.sation before
-• it broke up, or grow through resonance by rectified diffusion. Further,
even ii it broke apart during its most violent oscillations, it would
. ikelv regrow through the large-.impl. tude reg ions agai a and lgain. IU. i s
rnot clear that these eftects would always be harmful, especially since
Dyson et.al. [75,941 have seen beneficial results, but ;ith the widespread
k'4.. . . . . . . . . . . . . . . . . ..•,\'-',.9•• • ,•,',".'" "-•,.,.. --. '.-. =-...- .v ,-..•.. .'
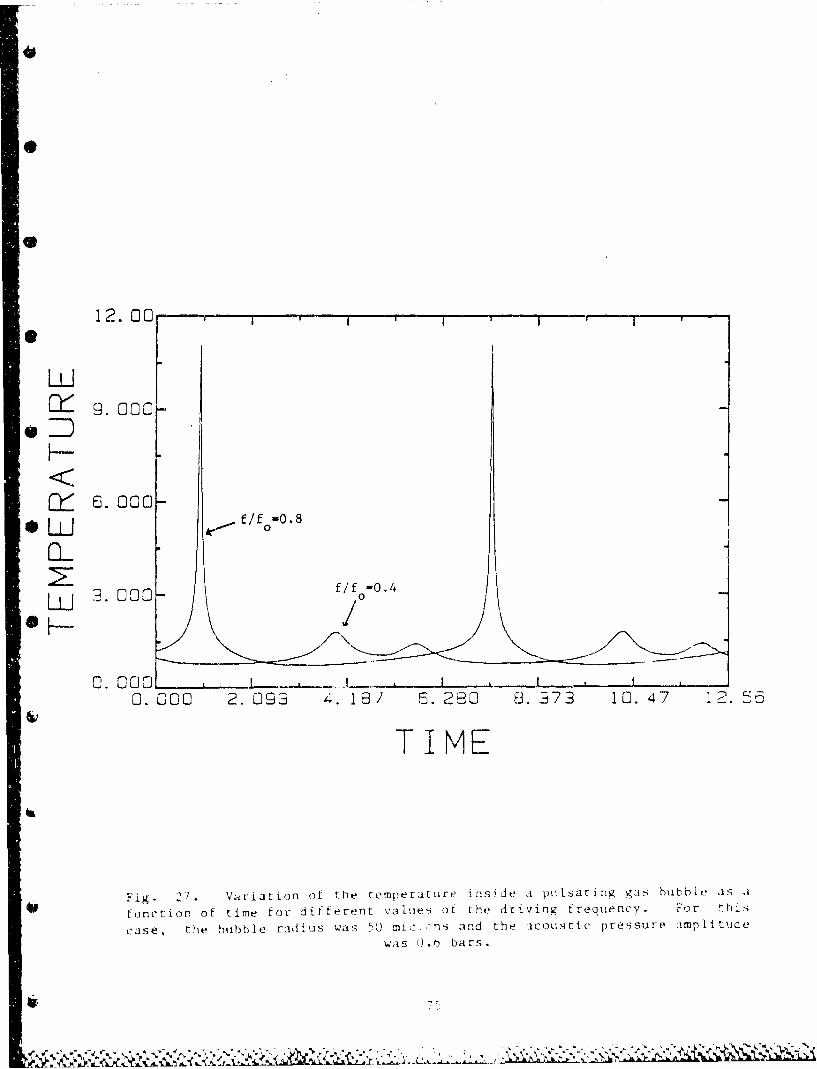
ry 9. 000
S6. 000--0.8a-J
f/f -0.4
3.00C ~0
0. 0M0. 000 2. 093 '1 6. 280 8. 7 10. 47 2 5-
Fig.- 27 . Vairiation of the temperature inside a pulsating 9,as, bubble as ai
function of time for7 different values of the driving frequency. For thi~s
case, the bub~ble rad'ius was 501 mi c ;ns and the acoustic pressure amp li tudle
was O.t) bars.
ie
use of ultrasound systems in clinical medicine, increased attention should
be given this phenomenon in order to ascertain what types of bio-effects
O may be occuring.
-0
___ - N
IV. EXPERIMENTAL MEASUREMENTS
OF CAVITATION PRODUCED BY SHORT ACOUSTIC PULSES
* In this section we wish to describe some recent experimental
"measurements that we have performed of cavitation produced by short
acoustic pulses. We shall examine only the experimental aspects of the
fa study; the tneoretical analysis of short pulse cavitation is treated in
another section by Professor Flynn.
A. Introduction
i* Recently Flynn [95] and Apfel [96] have calculated that microsecond
"length pulses of ultrasound can generate transient cavitation in water for
2temperal peak intensities in the range of 10 to 30 W/cm (depending upon
the initial conditions). Since scme diagnostic ultrasound systems current-
ly in clinical use generate microsecond length pulses with temporal peak
2intensities greater than 100 W/cm (97-98], there was reason to believe
that this mechanism could operate under diagnostic conditions in aqueous
media. However, until this study, there had been no reported experimental
confirmation of these theoretical calculations. We wish to present
evidence that ultrasonic pulses as short as one cycle at a frequency of 1.0
MHz give rise to luminescence flashes characteristic of violent cavitation.
B. Experimental Procedure
The experimental system is described in more detail by Roy, et.al
[99]; only a briet descrf.ption will 1,e given here.
Since the collapse ot a cavitation "bubble" is restricted to extremely
small dimensions at megahertz "requenci es, we decided not to util ze the
Commonly used cavi Lation detect, ion cri terion -- the acoAistic detection of a
Sshock wave `h,..dre . :; otn 120 ,vi,.n,' that ca'JIt l Se.. in t.h1
fre•,len'y re" a W...i n,: be da te h b.e icoustica:lil. Rthyr , we have used
- .- y~.,.y....',-r-rqrw-rr ri rb- ..... X~o the observatW W *ion- r, via a r-WiJr pho ~'omu!-
a photometric detection system bF'- uýon the observation, via a photomul-
tiplier tube, that light is produced by the oxidation of luminol throogh a
reaction that is initiated by the free radicals generated during the
collapse of a cavity. We shall describe this process as chemiluminescence
rather than sonoluminescence and discuss the distinction between the two
processes later. The details of the experimental procedure are now given.
An essential ingredient of the cavitation generation system is that
the acoustic pressure amplitude of the sound field is increased linearly
with time, at a reproducible rate, until cavitation occurs. The heart of
the system is a ramp generator that drives both the amplitude modulation
input of a function generator and a strip recorder. The DC voltage level
on the strip chart record is linearly related to the peak to peak output of
the function generator. This signal is amplified and delivered to a
focused transducer (resonance frequency approximately 1.0 MHz) that
radiates into an echo-free chamber (walls lined with acoustic absorber)
filled with distilled water containing luminol. The chart record is
calibrated in units of megapascals by inserting a small, calibrated hydro-
* phone (Medicoteknisk Institut, PVDF ultrasonic probe, o.d. 1.0mm) into
the focal region of the sound field during simulated measurements at low
amplitudes. Fig,, 28 shows the cavitation generation apparatus that we use.
* ( The cavitation detection scheme is critical to these measurements and
is now described. Light generated by the collapsing cavity (discussed in
more detail below) in the focal region is detected by a photomultiplier
tube (PMT) and the resulting pulse from the PMT base is preamplified and
fed into a pulse height discriminator. The discriminator level determines
the senritivitv of the apparatus and is set to 600 mV, which Is well above
the average electrical background level (-150mV) but below the ty ica
- chemiluninescence pulse height (-I.0V). After discrimination, the signal
78
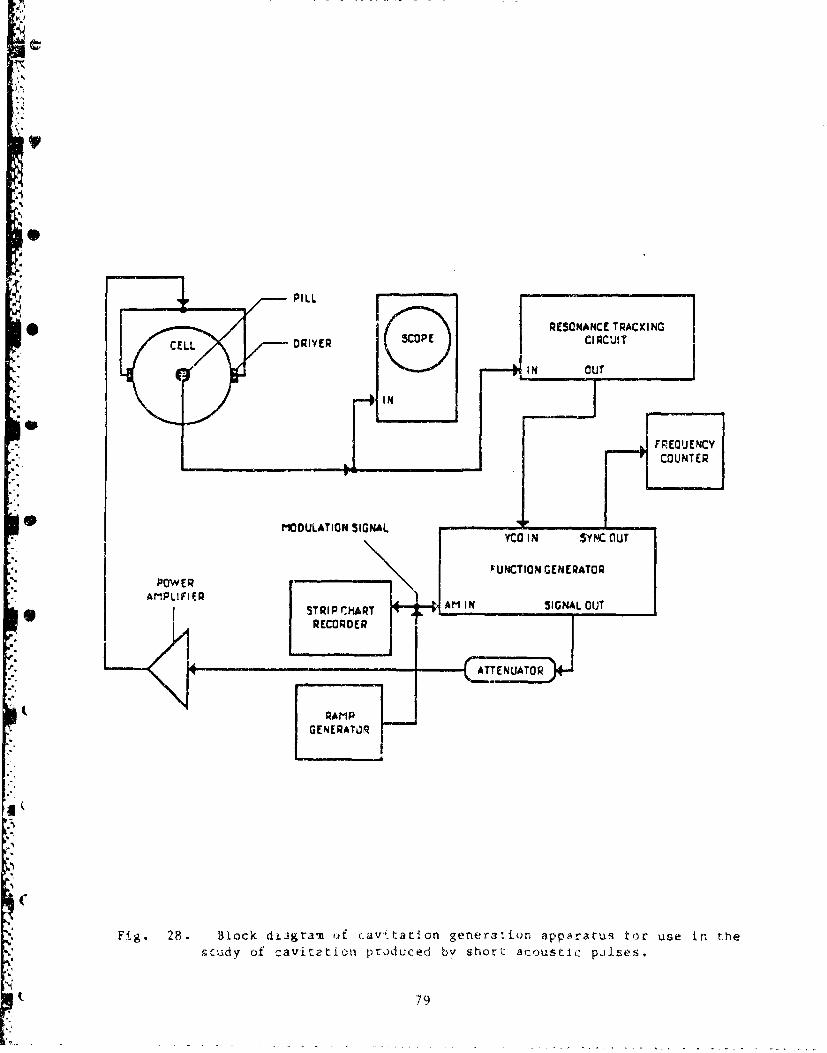
O
PILL
(31)O RESONANCE TRACKINGCELL D RiYER SOECIRCUIT
IN
IN
i F • €[• E NC YCOUNTER
I9 MODULATION SIGNAL -l YCO IN SYKq OUT
• I FUNCTION GENERATORPOWER
AMPLIFIE~R STRIP rMART AM IN SIGNAL OUT
RECORDER
1- ....
ATTENUATOR
:• ~GE NE RATOR
rri
2'
Fig. 28. Block diagram i.,f cav4.tation genera ionr apparatus tor use in, thestudy of cavitetion produced by short acoustic polses.
79
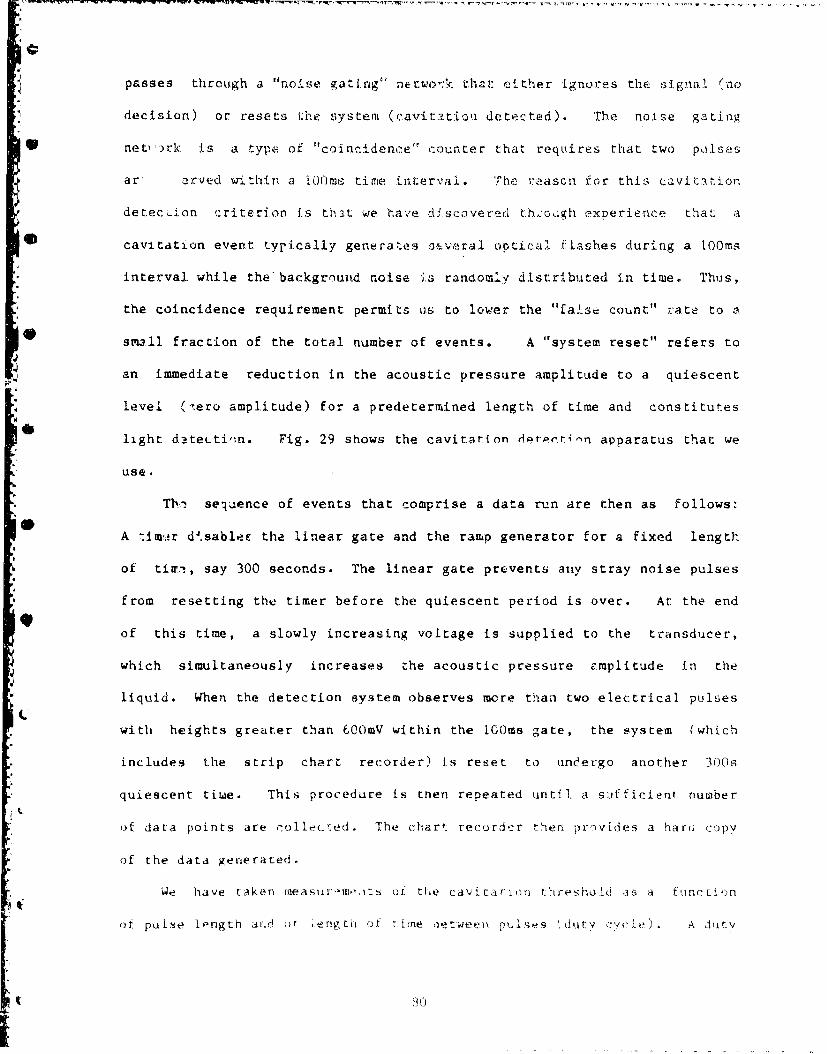
n.... ryy: -rry,; .... Q., r..- = n. • 'r, t'orw w- r,, ., a..,-.r., .w rrr : , •, -y i.n -ow -,,.U . ,-,-.v, r -,r•i•w•. ---. ,..--' , •. .U • C,.+.• U . ,.. -I ,. .. • • - +
passes through a "nolse gatrig network. that either ignores the signal (no
decision) or resets 1.hhe system (cavit.-tiou. dete'ted). The nolse gating
* net, )rk is a ty7Pe' of "coincidence counter that requires that two p l 1.S 6!.s
art arved wi thin a 100mzi time interval. The reascn for this caviltatiorn
detecLion .,riterion is thit we have disc'overed tr•'oigh experience that a
cavitation event typically generates o--.veral optica2, flashes during a lOOms
interval while the'background noise -s randomly distributed in time. Thus,
the coincidence requirement permits us to lower the "faise count" rate to a
"-•small fraction of the total number of events. A "system reset" refers to
an immediate reduction in the acoustic pressure amplitude to a quiescent
level (-,ero amplitude) for a predetermined length of time and constitutes
light dtecti,'n. Fig. 29 shows the cavitation & trp'-i-n apparatus that we
use.,
"Th-i sequence of events that comprise a data run are then as follows:
A timer dV.sableE the linear gate and the ramp generator for a fixed length
of tiw',-, say 300 seconds. The linear gate prevents any stray noise pulses
from resetting the timer before the quiescent period is over. At the end
of this time, a slowly increasing voltage is supplied to the transducer,
which simultaneously increases the acoustic pressure amplitude in the
liquid. When the detection system observes more than two electrical pulses
with heights greater than 6OOmV within the [GOrms gate, the system (which
includes the strip chart recorder) is reset to undergo another 300s
quiescent tiwe. This procedure is then repeated until a suffivient. number
of data points are rcollec!.:ed. The chart recordeŽr then proviides a hani copy
of the data generated.
We have t:ken rneasur ,,,- it•. of the cavita,:r on th resholcd i s a fun L i-n
it, puls. se ong t h ar3id or 1 .eag n ,,i time oS O• lS'I ,dl.Aty ,"A v!tV
•.. + K).. l ) A d t
LIGHT TIGHT ENCLOSURE
IN OUT
~'1CEALL
IN IN
: •'GATE G ATESIGNALSI 1,50
HEADPHONES0LI
( SE IGRE3 , REC-O ,[NRDE R GEEAO
Fig. 29 Block d.agram of cavitation detection apparatus fo'r use in the
study of: cavirtati ,n produced by shor, acoustic pulses.
91,
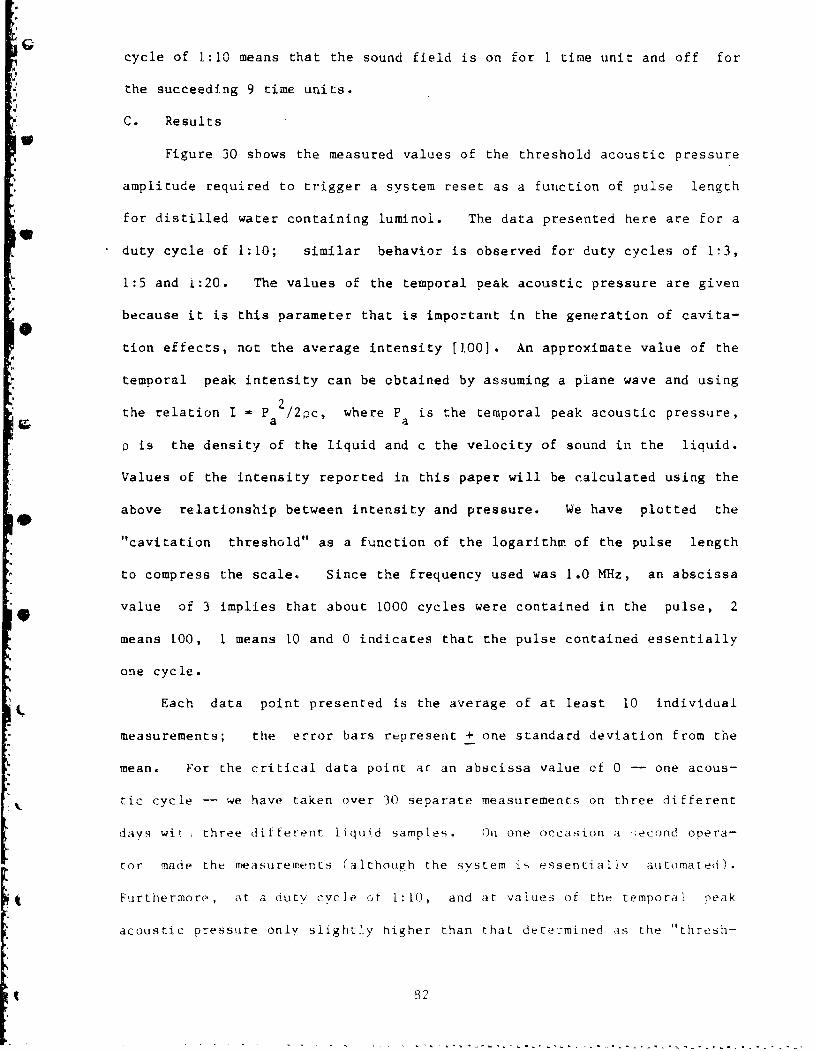
cycle of 1:10 means that the sound field is on for 1 time unit and off for
the succeeding 9 time units.
C. Results
Figure 30 shows the measured values of the threshold acoustic pressure
Samplitude required to trigger a system reset as a function of pulse length
Sfor distilled water containing luminol. The data presented here are for a
duty cycle of 1:10; similar behavior is observed for duty cycles of 1"3,
1:5 and i:20. The values of the temporal peak acoustic pressure are given
because it is this parameter that is important in the generation of cavita-
tion effects, not the average intensity [100]. An approximate value of the
temporal peak intensity can be obtained by assuming a plane wave and using
Sthe relation I M P 2/2pc, where P is the temporal peak acoustic pressure,S~a a'
p is the density of the liquid and c the velocity of sound in the liquid.
Values of the intensity reported in this paper will be calculated using the
above relationship between intensity and pressure. We have plotted the
"cavitation threshold" as a function of the logarithm of the pulse length
to compress the scale. Since the frequency used was 1.0 MHz, an abscissa
value of 3 implies that about 1000 cycles were contained in the pulse, 2
means 100, 1 means 10 and 0 indicates that the pulse contained essentially
one cycle.
Each data point presented is the average of at least 10 individual
measurements; the error bars represent + one standard deviation from the
mean. For the critical data point at an abscissa value of 0 -- one acous-
tic cycle - we have taken over 30 separate measurements on three different
days wit , three different liquid samples. On one occasion a ;;econd opera-
tor made the measurements (although the system iý essentiallyv iutomated).
Furthermore, at a duty cycle of 1:10, and at values of the temporal peak
acoustic pressure only slightly higher than that determined as the "thresh-
82
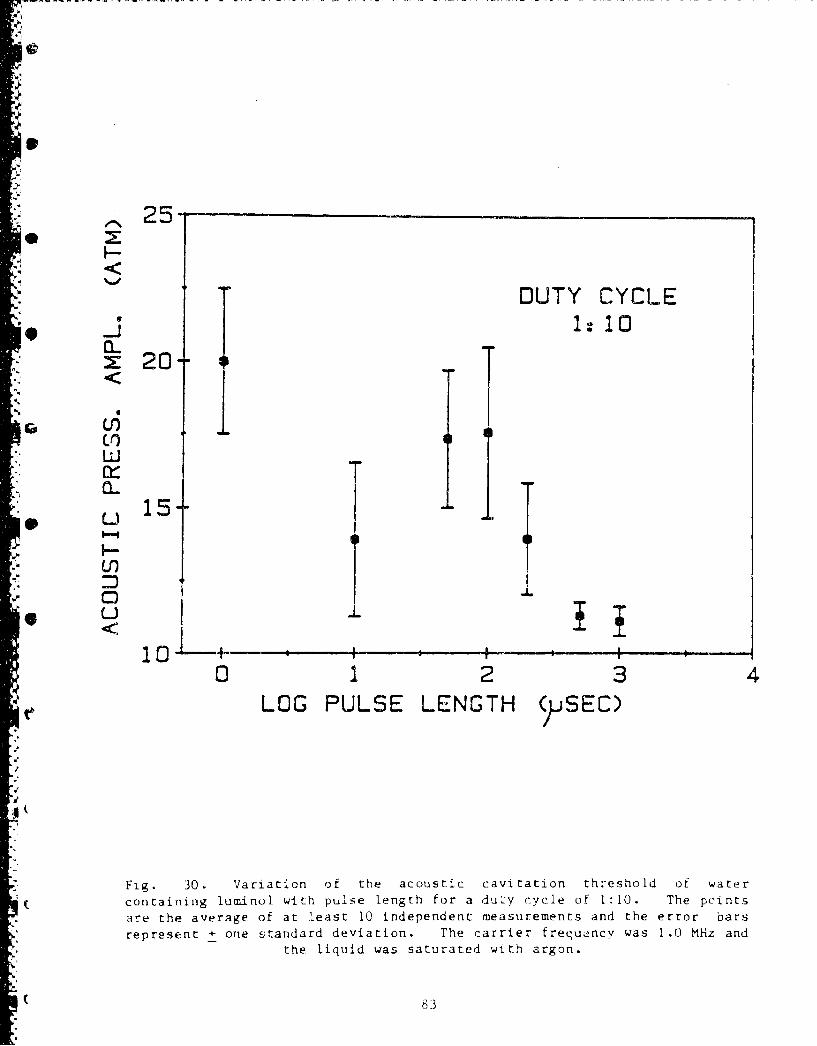
_ 25"
"DUTY CYCLE- -J 1:10
M 20 IIr)
T IWf'O J.
•O. ILO
-. <I
0 1 2 3 4LOG PULSE LENGTH $PSEC)
V
1
Fig. 30. Variation of the acoustic cavitation threshold of water
containing luminol with pulse length for a du~y cycle of 1:10. The pcintsare the average of at least 10 independent measurements and the error bars
represent + one standard deviation. The carrier frequency was 1.0 MHz andthe liquid was saturated with argon.
813
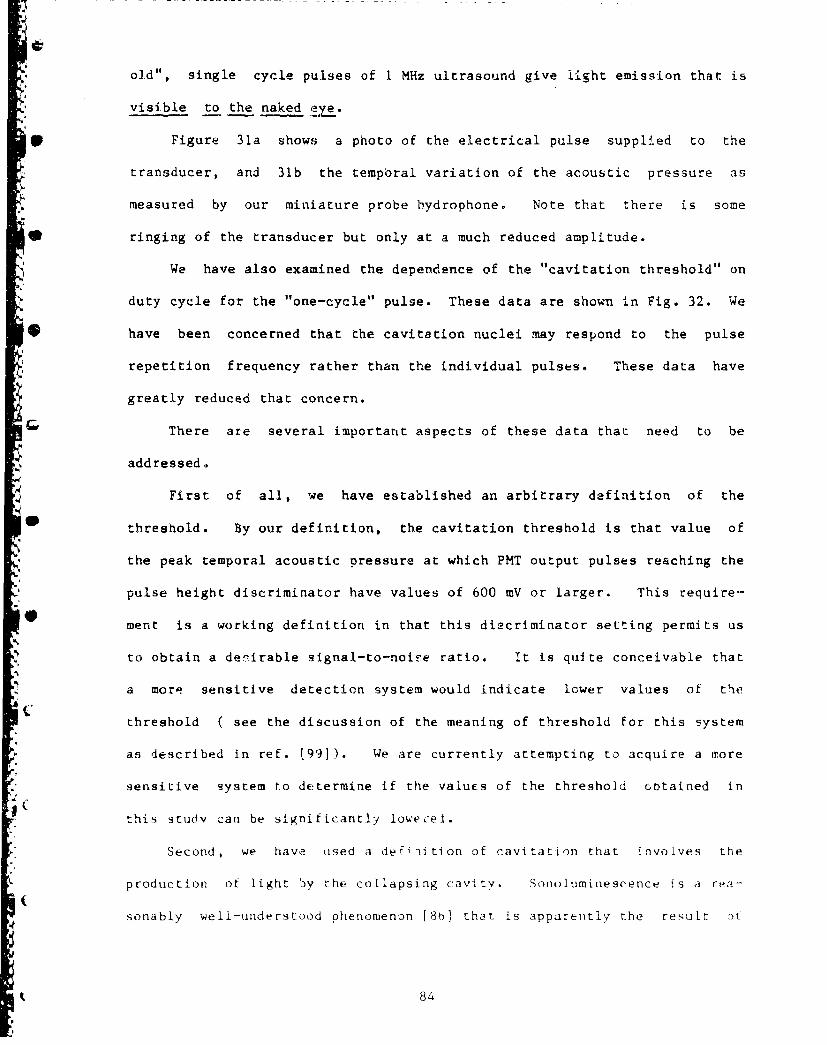
old", single cycle pulses of I MHz ultrasound give light emission that is
visible to the naked ev.
* Figure 31a shows a photo of the electrical pulse supplied to the
transducer, and 31b the temporal variation of the acoustic pressure as
measured by our miniature probe hydrophone. Note that there is some
ringing of the transducer but only at a much reduced amplitude.
We have also examined the dependence of the "cavitation threshold" on
"duty cycle for the "one-cycle" pulse. These data are shown in Fig. 32. We
* have been concerned that the cavitation nuclei may respond to the pulse
repetition frequency rather than the individual pulses. These data have
greatly reduced that concern.
There are several important aspects of these data thac need to be
addressed.
First of all, we have established an arbitrary definition of the
threshold. By our definition, the cavitation threshold is that value of
the peak temporal acoustic pressure at which PMT output pulses reaching the
pulse height discriminator have values of 600 mV or larger. This require-
ment is a working definition in that this discriminator setting permits us
to obtain a derirable signal-to-noise ratio. It is quite conceivable that
a more sensitive detection system would indicate lower values of the
threshold ( see the discussion of the meaning of threshold for this system
Sas described in ref. [991). We are currently attempting to acquire a trore
sensitive system to determine if the valuEs of the threshold obtained in
i this study can be significantly lowecei.
Second, we have used a de~ilition of cavitation that involves the
production of light by the collapsing cavity. Sonoluminescence is a rea-
sonably well-understood phenomenon [86] that is apparently the result ot
84
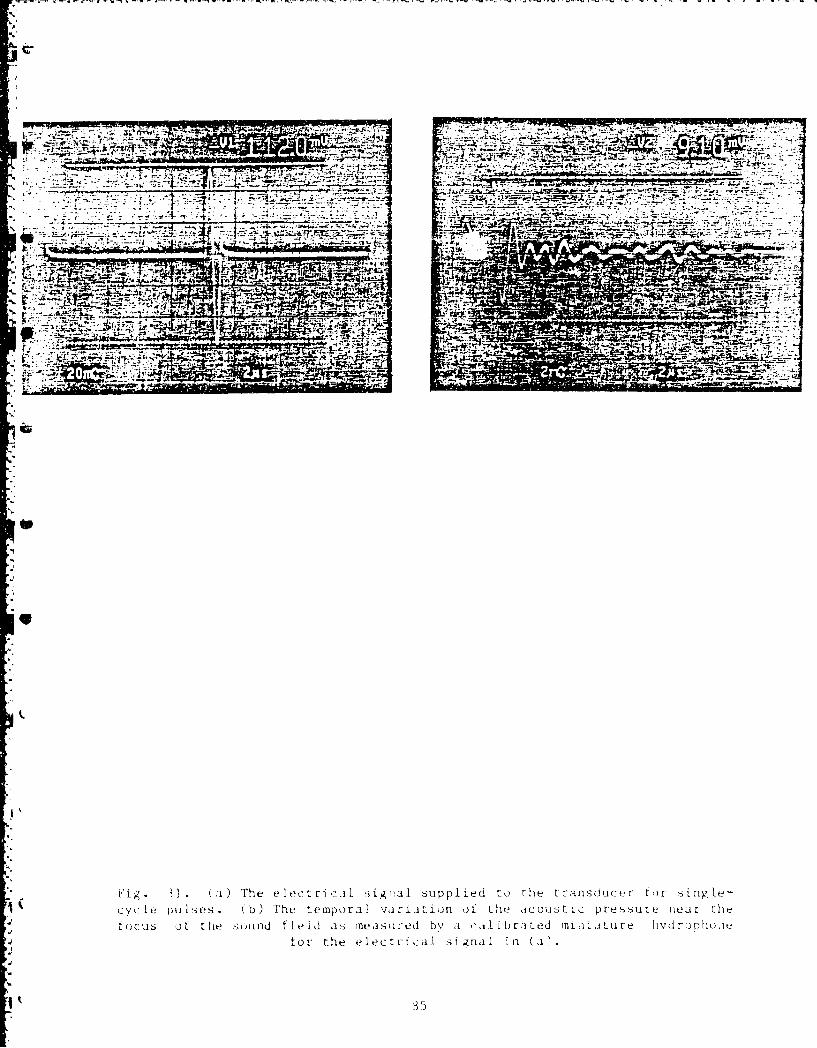
.wrrrrrrl.rw 4F- rrw w4¶!:r g--r~-~ flv;.r aw1sr'r#rrv- ~- u- ~~- w.-
C-w
p E7 - v
;- 45 799-.
-'ý! rý-2., -
* ~ ~ U. (:i)forThe electriL iical suppie wri I h trnoue irr sinIa
i~~ ~ ~~~~~~~~~~~~~~~~~ 5 v eple. ()Tetrprf aite tteoosi rsueni h
3$5
PULSE LENGTH-*"- 1.0 /SEC
*- 25
LO_20}CL
U
i10CCD
- ~<
T5 10 15 20 25
DUTY CYCLE (AXIS 1:N)
Fig. 32. Variation of the acoustic cavitation Lhreshold of water contain-
ing luminol with duty cycle for a pulse length of approximately 1 micro-
sccond. The carrier frequency was 1.0 MHz ýnd the liquid was saturatedwith argon.
86
the radiative recombination of free radicals produced by the high tempera-
tures and pressures developed by the collapsing ca',rity [49-51]. However,
the light emission that we observe is probably not sonoluminescence pro-
duced by the recombination of free radicals within the cavity itself.
Rather, we observe light from the bulk of the liquid indirectly resulting
from free radicals produced within the cavity. Luminol has been used by
several researchers (see for example, ref. (88]) to increase the output of
light emissions from acoustic cavitation and the specific oxidation reac-
tions that lead to light emission have been studied in aome detail [101-
102]. What is most important, and relevant to this work is that the
presence of free radicals are required for light emission to occur. Since
these free radicals are highly reactive, and pose a threat to biological
tissues, it is their presence that is important, not the light emission per
se.
A third aspect of the observation reported here is that the light
emission from the insonified area can be seen by the naked eye, and appears
in the form of "streaks" rather than "flashes". We interpret this phenome-
*• non to be due to the relatively long lifetime of the oxidation reaction (as
long as 50ms ic-cording to Finch [88]) and the ranid movement of collapsing
cavities through the focal region due to radiation pressure forces. Howev-
er, as discussed earlier, we have also recently observed intense lUght
emission from a form of "stable" cavitation with the use of an image
intensifier týibe as a light detector [103]. Although tie temporal peak
acousti .±ssures are quite large, we don't wish to discount some furn ofI
stable cavitation at this time, especially sirnce the liquid probably con-
tains a large number of large cavitati-n nuclei [104].
D. Some Final Concluding Commeiits
Our recent examination of t-he possible generation of cavilatlon by
87
clinical devices has lead us to the following conclusions.
(i) There can be no doubt that small pockets of free gas are
contained in biological tissue; the widespread presence of these
microbubbles is well established by decompression studies.
(ii) It has been observed experimentally that these microbubbles can
* be activated by both continuous and pulsed acoustic systems.
Furthermore, the experimental oservations are roughly in
agreement with the theoretical pedictions.
* (iii) Because cavitation is hard to detect, unless one knows what to
look for, there is now good reason to believe that cavitation is
being produced by some therapeutic and diagnostic ultrasound
W devices. An extensive risk-assessment study emphasizing the
physical mechanisms should be carried out immediately.
88

V. LIST OF REFERENCES
• [1]. R.E. Apfel, Nature 223, 119 (1971).
[2]. R. Roy, A. Atchley, L. Crum, J. Fowlkes and J. Reidy, "A precise
technique for the measurement of acoustic cavitation thresholds,
and some preliminary results", J. Acoust. Soc. Am. (to be
published).
[3]. P.S. Epstein and M.S. Plesset, J. Chem. Phys. 18, 1505 (1950).
[4]. T. Alty, Proc. Roy. Soc. Ser. A. 112, 235 (1926).
[5]. M.G. Sirotyuk, Sov. Phys. Acoust. 16, 482 (1971).
"[6]. V.A. Akulichev, Soy. Phys. Acoust. 12, 144 (1966).
[7]. F.E. Fox and K.F. Herzfeld, J. Acoust. Soc. Am. 26, 985 (1954).
• [8]. M. Strasberg, J. Acoust. Soc. Am. 31, 163 (1959).
[9]. K.F. Herzfeld, Comment in Proc. First Sympos. Naval Hydrodyn. (Nat.
Acad. Sci,, Wash. D.C.), F.S. Sherman, ed. pp. 319-320 (1957).
[10]. M.G. Sirotyuk, Soy. Phys. Acoust. 16, 237 (1970).
[111. D.E. Yount and R.H. Strauss, J. Appl. Phys. 47, 5081 (1976).
[12]. D.E. Yount, J. Acoust. Soc. Am. 65, 1429 (1979).
[13]. D.E. Yount, C.M. Yeung, and F.W. Ingle, J. Acoust. Soc. Am. 65,
1440 U1979).9
[14.] D.E. Yount, J. Acoust. Soc. Am. 71, 1473 (1982).
"[15'j. D.E. Yount, E.W. Gillary and D.C. Hoffman, J. Acoust. Soc. Am. 76,
"15"l (1984).
"[161. A.A. Atchley, "The nucleation of cavitation in aiqueous Media , Ph.
1). Dis-rt-ition, Universitv otf Missiisippi, Oxford, 4S ('4g5).
S171. E. N. Hiarte .rv K.K. Bartieq , W.D. 'IcElrov, 4.Hf. 4hi r-y, D.P . pease
Sand K.W. Cooper, J. Cell. Comp. Phsiol. '4, 1 (1914,4).
j"181. R.E. Aptel, I. Acoust. Soc. Am. ,4M 18 7-) 1 1,4 )
[19]. L. A. Crum, Nature 218, 148 (1979).
[20]. L.A. Crum, "Acoustic Cavitation Thresholds in Water", in Cavitation
and Inhomogeneities in Underwater Acoustics, W. Lauterborn, ed.,
(New York, Springer-Verlag) 1980.
[21). A.A. Atchley and A. Prosperetti, "The critical radius approach to
the crevice model of cavitation nucleation", J. Acoust. Soc. Am.
(to be published).
[22]. F.G. Blake, "The onset of cavitation in liquids", Tech. Memo. No.
12, Acoustics Research Lab. Harvard University, (1949).
(231. A. Prosperetti, "Bubble phenomena in sound fields", Ultrasonics (to
be published).
"[24.] W. Galloway, J. Acoust. Soc. Am. 26, 849 (1954).
[25.] G. ter Haar and S. Daniels, PhyE. in Med. Biol. 26, 1145 (1981).
[26]. G. ter Haar, S. Danieis, S. East az-th and C.R. Hill, Dr J. Cancer,
45, 151 (1982).
[27]. L.A. (,.rum ind G.M. Hansen, Phys. Med. and Biol. 27, 413 (1982).
[28]. S.Z. Child and E.L. Carstensen. Ultrasound Med. Biol. 8, 311
(1982).
[29]. S.Z. Child, E.L. (C;,ý-tensen and S.K. Lam, Ultrasound Med. Biol. 7,
"167 (1981).
I. [301. P.M. McDonough and E.A. flemmingsen, J. Appl. Physiol. 56, 513
[31]. P.M. McDonough and E.A. Hemmingsen, 1. App.Physlol. 57, 117 (1984).
[32]. L.A. Frtzzell, C.S. Lee, P.D. ,schenhack, M.J. Bortelli , R.S.
Mori moto, and F. Dunn, .. Acoust. Soc. Am. 1.,, 1-2 ( q83).
{33!. W.D. Frasee, - J.P. LancO I ý :1d t,.I-.. Morev, actat Uto1arvwo1 95, 95
t (19831).
1• 341. q.D. Vajn Liew, Akm. .J. Physiol. 2 1" 1[7" k 1468).
90
[35], H.D. Van Liew and M Passke, Aerosp. Med. 38, 829 (1967).
[361. E.A. Hlemmingsen, J. Exp. Zool. 220, 43 (1982).9,
[37]. F.C." Golding, P. Griffiths, W.D.M. Paton, D.N. WAlder, and H.V.
Hempleman, Br. J. Ind. Med. 17, 167 (1960).
[38]. O.E. Van Der Aue, R.J. Keller and E.S. Brinton, "The effect of
exercise during decompression from increased barometric pressures
on the incidence of decompression sickness in wan", Washington D.C.
US Navy Exp. Diving Unit, 1949. (Res. Rept. 8-49).
9 [39]. C.G. MacKenzie and A.H. Reisen, J. Am. Med. Assoc. 124, 499 (1944).
[40]. M.P. Spencer, D.C. Johnson and S.D. Campbell, "Safe decompression
with the Doppler ultrasonic blood bubble detector" in Underwater
Phyilg V, C.J. Lamberten, ed. (Bethesda, ME: FASEB), 1976, pp.
311-325.
"[41]. J.A. Rooney, J. Acoust. Soc. Am. 52, 1718 (1972).
[42]. P.A. Lewin and L. Bjorno, J. Acoust. Soc. Am. 71, 728 (1982).
[43]. P.A. Lewin and L. Bjorno, J. Acoust. Soc. Am. 69, 864 (1981).
[44] D.L. Miller, Ultrasound Med. Biol. 5, 351 (1979).
[45]. A.R. Williams and D.L. Miller, Ultrasound Med. Biol. 6, 251 (1980).
* [461. C.L. Kling and F.G. Hammitt, J. Basic Engr. D94, 825 (1972).
[47]. C.F. Naude and A.T, Ellis, J. Basic Engr. 83, 648 (1961).
- [48]. W. Lauterborn, Appl. Phys. Lett. 21, 27 (1972).
: [49]. C. Sehgal, R. G. Sutherland and R. E. Verrall, J. Phys. Chc'a, 84,
2920 (1980).
- [50]. C. Sehgal, R. G. Sutherland and R. E. Vervall, J. ?hys. Chem. 70,
2242 (1979).
%[51]. C. Sehgal, R. G. Sutherland and R. E. Verrall, J. Phys. Chem. 84,
529 (W180).
[52]. P. Riesz, D. Berdahl, and C.L. Christman, "Free radical generation
91
-- - - - - - - - - - - - - - - ---- - - -- ' ,". . " .- ,+.. '," -- • -- "- - I
by ultrasound in aqueous and non-aqueous solutions", Eavironmentai
Health Persectives (to be published).
*[531. D.Y. Hsieh and M.D. Plesset, J. Acoust. Soc. Am. 33, 206 (1961).
(54]. M. Strasberg, J. Acoust. Soc. Am. 33, 359 (1961).
[551. A.I. Eller and H.G. Flynn, J. Acoust. Soc. Am. 37, 493 (1965).
*[56]. M.H. Safar, J. Acoust. Soc. Am. 43, 1188 (1968).
[571. A.I. Eller, J. Acoust. Sac. Am. 46, 1246 (1969).
[58]. R.K. Gould, J. Acoust. Soc. Am. 56, 1740 (1974).
[591. B.J. Davison, J. Sound Vib. 17, 261 (1971).
[601. O.A. Kapustina and Y.G. Statmikov, Sov. Phys. A(oust. 13, 327
(1968).
[611. L.A. Skinner, J. Acoust. Soc. Am. 51, 378 (1972).
[621. A.I. Eller, J.. Acoust. Soc. Am. 57, 1374 (1975).
-• [63]. L.A. Crum, J. Acoust. Soc. Am. 68, 203 (1980).
[64]. R.E. Apfel, J. Acoust. Soc. Am. 64, 1624 (1981).
(65]. L.A. Crum and G.M. Hansen, Phys. Med, Biol. 27 413 (0982).
[661. L.A. Crum, Ultrasonics, 22, 215 (1984).
[67]. A. Prosperetti, J. Acoust. Soc. Am. 61, 17 (1977).
[681. A.E. Eller, J. Acoust. Soc. Am. 47, 1469 (1970).
( [69]. C. Devin, J. Acoust. Soc. Am. 31, 1654 (1959).
[70]. A.S, Tucker and C.A. Ward, J. Appl. Phys. 46, 4801 (1975).
[711. V.F.K. Bjerknes, Die Kraftfelder (Vieweg and Sohn, Braunschweig,
Germany, 1909).
[72]. L. A. Crum, J. Acoust. Soc. Am. 57, 1363 (1975).
t7'31. L.A. Crum and G.M. Hansen, J. Acoust. Soc. Am. 72, 1586 (1982).
( 74]. A. Prosperetti., J. Acoust. Soc. Am. 56, 878 (1974).
[75K. M. Dyson, Infections in S:2 rgery, 9, 37 (1982).
92
.r'trrr'r r. w-r- .rr-r ."rrr•r wr: :r 'r rw rr wrrrr::, 'r-rrvr' cr ,r • ;S TW, :¸ -'.n .fl W rrw -W .'7 rrr CT WV• '.W r, . r U- 'rr r W 'r , -- ,
[761. A. Prosperetti, Ultrasonics, 22, 77 (1984).
(77]. J.B. Keller and M. Hiksis, J. Acoust. Soc. Am. 68, 328 (1980).
[78]. L.t.. Crum, J. Acoust. Soc. Am. 73, 116 (1983).
1,1791. W. Lauterborn, J. Acoust. Soc. Am. 69, 1624 (1981).
[80]. L.A. Crum and A. Prosperecti, J. Acoust. Soc. Am. 73, 121 (1983).
"[81]. ) . A. Crum and A. Prosoeretti, J. Acoust. Soc. Am. 75, 1910 (1984).
[82]. A. Prosperetti, L. A. Crum and K. C. Commander, J. A:oust. Soc. Am.
(to be published).
[83]. W. Lauterbrrn and E. Cramer, Phys. Rev. Lett. 47, 1445 (1981).
[84]. M.J. Feigenbaum, J. Stat. Phys. 19, 25 (1978).
(85]. N. Marinesco and J.J. Trillat, C.r. Lebd. Seanc. Acad. Sci., Paris,
196, 858 (1933).
t186]. k.J. Walton and G.T. Reynolds, "Sonoluminescence", submitted to
Advances in Physics.
[87]. L.A. Chambers, J. Chem. Phys. 5, 280 (1937).
"[88]. R.D. Finch, Ultrasonics 1, 87 (1964).
[89]. G.T. Reynolds, A.J. Walton and S. Gruner, Rev. Sci. Inst. 53, 1673
(1982).
[90]. G.W. Willard, J. Acoust. Soc. Am. 25, 669 (1953).
[91]. E.A. Neppiras and W.T. Coakley, J. Sound Vib. 45, 341 (1976),
t [92]. L.A. Crum and D.A. Nordling, J.Acoust. Soc. Am. 52, 294 (1972).
[93]. T.K. Saksena and W.L. Nyborg, J.Chem. Phys. 53, 1722 (1970).
[94). M.Dyson and D.S. Smalley, in ultrasound Interactions in Biology and
Medicine, R. Millner, E. Rosenfeld and V. Cobet, eds.
"(Plenum:London) 1983.
[951. H.G. Flvnr, J. Acoust. Soc. Am. 72, 1926 (i92).
[961. R.E. Apfel, Brit. J. Cancer, Suppl. V, 45, L40 (19S2).
-97). E.L. Carstensen and H.G.Flynn, UlLrasound Med. l3icl.8, 17"0 (19 82,
"93
[98]. F.W. Kremkau, Clinics in Obstet. Gyn. 10, 395 (1983).
[99]L R.A.Roy, A.A.Archlev, L.A. Crum, J.B.Fowlkes, and J.J. Reidy, "A
"precise technique for the measurement of acoustic cavitation
tnresholds, and some preliminary results", J. Acoust. Soc. Am. (to
be published).
[100]. E.L. Carstensen, K.J. Parker and D. 3. Barbee, J. Acoust. Soc. Am.
74, 1057 (1983).
[101]. E. H. White and D. F. Roswele, Acc. Chem. Res. 3, 54 (1970).
[102]. T.G. Burdo and W.R. Seitz, Anal. Chem. 47, 1643 (1975).
[1031. L. A. Crum and G. T. Reynolds, "Sonoluminescence from stable
cavitation", J. Acoust. Sc. Am. (to be published).-
[1041. L.A. Crum, App. Sci. Res. 38, 101 (1982).
[105]. W. Connolly and F. Fox, J. Acoust. Soc. &m. 26, 843 (1954).
0
94'
'WY'V. v.'2 \. .Ž~. I t C A.C§ ' - N -IN 75 K