9. variations in ultrasonic velocity and density with pore pressure
TRANSCRIPT

Shipley, T.H., Ogawa, Y., Blum, P., and Bahr, J.M. (Eds.), 1997Proceedings of the Ocean Drilling Program, Scientific Results, Vol. 156
9. VARIATIONS IN ULTRASONIC VELOCITY AND DENSITY WITH PORE PRESSUREIN THE DÉCOLLEMENT ZONE, NORTHERN BARBADOS RIDGE ACCRETIONARY PRISM 1
Harold J. Tobin2 and J. Casey Moore3
ABSTRACT
In a recent three-dimensional multichannel seismic reflection survey, the décollement zone of the northern Barbados Ridgeaccretionary prism exhibits both negative and positive-polarity, high-amplitude fault plane reflections. The negative-polarityregions of this reflector have been interpreted as a response to elevated fluid pressure with attendant low velocity and density inthe fault zone. Here, we use core samples from above, within, and below the décollement at Site 948 on Ocean Drilling Pro-gram Leg 156 to evaluate the effect of varying fluid pressure (or effective pressure) conditions on the P-wave velocity and den-sity of the samples.
At Site 948, the décollement zone exhibits a positive-polarity fault plane reflection probably caused by a shift to higher den-sity across a lithologic boundary coincident with the décollement zone. The density distribution observed in the borehole andvelocities consistent with inferred fluid pressures suggest a positive impedance contrast. The negative-polarity waveform of thereflector below Site 947 requires a low-impedance zone superimposed on this lithologic boundary. Overpressures above esti-mates for hydrostatic or ambient conditions at Site 948 cause a velocity decrease of ~100−200 m/s, and a percent porosityincrease of up to ~4%. The minimum acoustic impedance measured for the upper part of the décollement is ~2.83 × 10⁶ Mg/m2sat near-zero effective pressure. Published synthetic seismic models for examples of the negative-polarity reflections requirereflection coefficients that imply much lower impedance in this interval. We conclude that significant hydraulic dilation of thefault at lithostatic fluid pressure is necessary to generate the observed reflectivity.
dd
ig2 tf rgloas
, n
llti
Legd onnlysi-n-ns94).ere
, yetenal di-ting ex- to pos-
ffec-se ofcol-sedi-ust
h-
asaryudedosas-4)e,
INTRODUCTION
The northern Barbados Ridge accretionary prism now ranks as themost intensively studied prism on earth, with three legs of Deep SeaDrilling Project (DSDP) and Ocean Drilling Program (ODP) drilling,numerous submersible dives, and two- and three-dimensional multi-channel seismic reflection (MCS) surveys dedicated to understandingthe tectonic, physical, and chemical processes of accretion. The Bar-bados prism has been characterized as the fine-grained end-memberof the continuum of prisms from mud dominated to sand dominated.Its narrow taper and thin incoming sediment section makes the ollement zone at the base of the prism much more accessible to ing than most. Accretionary prisms in general are among the mtectonically active regions of the earth’s crust, with extremely hstrain rates and vigorous fluid circulation (Moore and Vrolijk, 199One of the main focuses of investigation in accretionary prisms ofpast decade has been to define the magnitudes and pathways oflow as pore waters and other fluids are produced and exit theforming sediments of the prism. A clear conclusion that has emefrom this research is that fluids are predominantly channeled aactive thrusts and other faults within the toes of prisms (Moore Vrolijk, 1992, and citations therein; Tobin et al., 1993). Fluid presure gradient is the driving force for fluid flow. At the same timehas been known for decades that high pore-fluid pressure can elow-angle thrusting (Hubbert and Rubey, 1959).
For these reasons, the primary objectives of Leg 156 were tovestigate fluid flow, fluid pressure, and permeability of the décoment zone. Indirect evidence for high fluid pressure and low effec
1Shipley, T.H., Ogawa, Y., Blum, P., and Bahr, J.M. (Eds.), 1997. Proc. ODP, Sci.Results,156: College Station, TX (Ocean Drilling Program).
2Geophysics Department, Stanford University, Stanford, CA 94305-2215, [email protected]
3Earth Sciences Department, University of California, Santa Cruz, Santa Cruz, CA95064, U.S.A.
3UHYLRXV�&KDSWHU3UHYLRXV�&KDSWHU 7DEOH�RI�&7DEOH�RI�&
éc-rill-osth
).he fluidde-edngnd-itable
in-e-ve
stress in the décollement comes from DSDP Leg 78A and ODP 110, as well as studies of other prisms, including inferences basestructural, geochemical, and other seismic reflection data. The oinformation available on the distribution of fluid pressure (and posbly flow paths) in the fault zone is inferred from the three-dimensioal seismic reflection data set, in which negative-polarity reflectiohave been proposed to indicate fluid-rich zones (Shipley et al., 19Successful hydrologic measurements in the décollement zone wobtained on Leg 156 at Sites 948 and 949 (Fisher et al., 1996)drilling and testing of a high-amplitude, negative-polarity fault-zonreflection (attempted at Site 947) proved impossible on operatiogrounds (see Shipley, Ogawa, Blum, et al., 1995). Lacking suchrect observations, indirect means must be employed for estimathe fluid-pressure conditions in the parts of the décollement zonehibiting negative-polarity reflections. The strategy in this study isuse core samples and log data obtained at Site 948—which has aitive-polarity fault reflector—to study the P-wave velocity and den-sity responses of the sediments to changes in fluid pressure and etive stress conditions.These data are then used to infer the cauthe negative-polarity reflector at Site 947 and elsewhere in the délement zone. In short, the question addressed here is: given the ments and structures at Site 948, what conditions or properties mchange to convert the reflection from low-amplitude positive to higamplitude negative polarity?
BACKGROUND
Fault Plane Reflections
The acquisition of high quality MCS data in recent years hgreatly enhanced the imaging of fault-plane reflectors in accretionwedges globally and has permitted detailed waveform and amplitstudy of those reflections. The Nankai (Moore et al., 1990), Barba(Westbrook et al., 1988), Costa Rica (Shipley et al., 1990), and Ccadia (MacKay et al., 1992; Moore et al., 1991; Tobin et al., 199accretionary prisms include thrust faults showing high-amplitud
125RQWHQWVRQWHQWV 1H[W�&KDSWHU1H[W�&KDSWHU
H.J. TOBIN, J.C. MOORE
1000
200
50005000
5000
5000TIBURON RISE
BARRACUDA RIDGEDSDP/ODP Drill Sites'92 3-D Survey Area
5000
40004000
5000
3000
40001000
200
1000
50002000
200
200 200
1000
2000
3000
2000
3000
4000
1000
3000
4000
1000
20
Barbados
4000
5000
5000
4000
4000
200
200
2000
200
1000
13°
14°
15°
16°
62° 61° 60° 59° 58°
South America
Barbados
5000
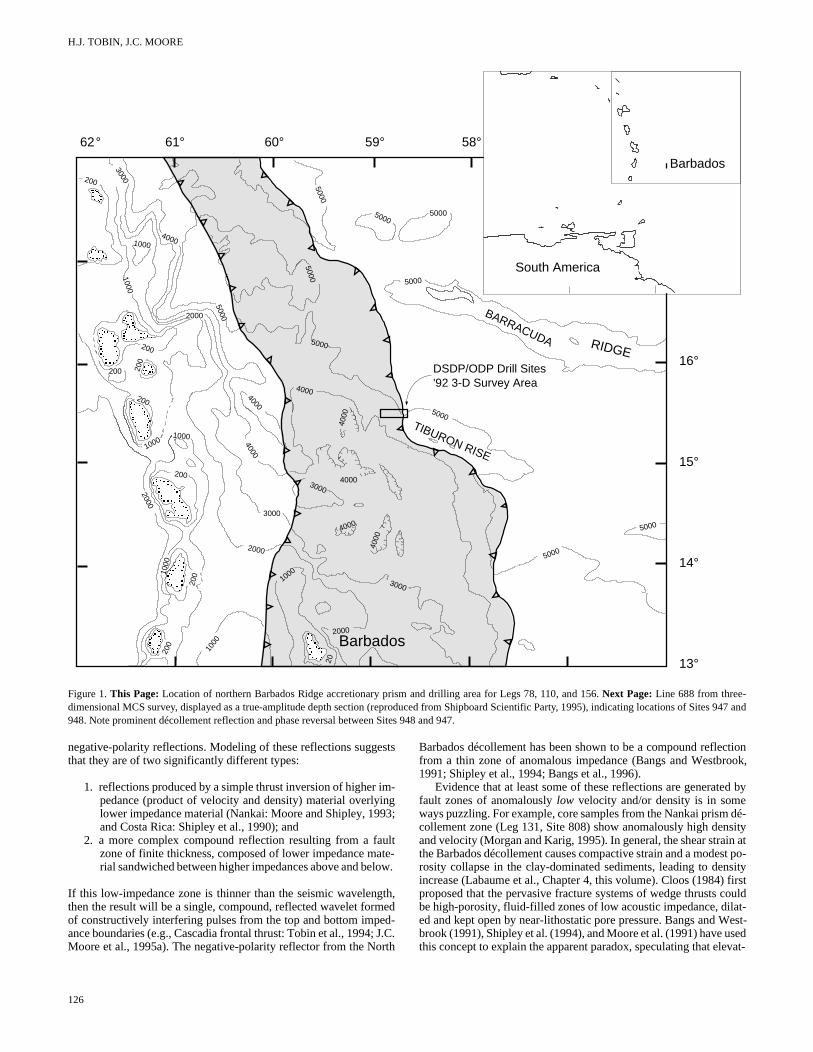
Figure 1. This Page: Location of northern Barbados Ridge accretionary prism and drilling area for Legs 78, 110, and 156. Next Page: Line 688 from three-dimensional MCS survey, displayed as a true-amplitude depth section (reproduced from Shipboard Scientific Party, 1995), indicating locations of Sites 947 and948. Note prominent décollement reflection and phase reversal between Sites 948 and 947.
ctionook,
d by
dé-sityin atst po-sity
firstcouldat-
est-sed
evat-
negative-polarity reflections. Modeling of these reflections suggeststhat they are of two significantly different types:
1. reflections produced by a simple thrust inversion of higher im-pedance (product of velocity and density) material overlyinglower impedance material (Nankai: Moore and Shipley, 1993;and Costa Rica: Shipley et al., 1990); and
2. a more complex compound reflection resulting from a faultzone of finite thickness, composed of lower impedance mate-rial sandwiched between higher impedances above and below.
If this low-impedance zone is thinner than the seismic wavelength,then the result will be a single, compound, reflected wavelet formedof constructively interfering pulses from the top and bottom imped-ance boundaries (e.g., Cascadia frontal thrust: Tobin et al., 1994; J.C.Moore et al., 1995a). The negative-polarity reflector from the North
126
Barbados décollement has been shown to be a compound reflefrom a thin zone of anomalous impedance (Bangs and Westbr1991; Shipley et al., 1994; Bangs et al., 1996).
Evidence that at least some of these reflections are generatefault zones of anomalously low velocity and/or density is in someways puzzling. For example, core samples from the Nankai prismcollement zone (Leg 131, Site 808) show anomalously high denand velocity (Morgan and Karig, 1995). In general, the shear strathe Barbados décollement causes compactive strain and a moderosity collapse in the clay-dominated sediments, leading to denincrease (Labaume et al., Chapter 4, this volume). Cloos (1984)proposed that the pervasive fracture systems of wedge thrusts be high-porosity, fluid-filled zones of low acoustic impedance, diled and kept open by near-lithostatic pore pressure. Bangs and Wbrook (1991), Shipley et al. (1994), and Moore et al. (1991) have uthis concept to explain the apparent paradox, speculating that el

VARIATIONS IN ULTRASONIC VELOCITY AND DENSITY
Figure 1 (continued).
o
.reosndtrt
b gkt
ep-uthllednd by
cton-420entcle,
f latelowolle-
f ex-en-
at,ol-an-his IIE off
and un- the theard
de- and re-
ed pressure in fluid migrating along the fault causes dilation of thefractures, resulting in overall low impedance in the fault. Tobin et al.(1994) estimated fault-zone fluid pressure by synthesizing fault re-flectivity with velocity vs. effective pressure data for samples fromthe Cascadia frontal thrust at ODP Site 891. This study showed thatoverpressures of 86%–100% of lithostatic in a thin (~10 m) fault zcould produce the observed reflectivity. Although not excluded, nther significant hydrofracture nor dilation was required to causereflection, in contrast to previous inferences (Moore et al., 1991)
Here, we present laboratory acoustic data for the very diffesediments—but similar reflections—of the Barbados décollemzone. We collected a suite of whole-round samples from the décment zone at Site 948, as well as the hanging wall and foot wall iments, with the goal of experimentally determining the dependeof velocity and density on fluid pressure. When compared to mo(Bangs et al., 1996) of the seismic impedance of the décollemensults indicate that high-amplitude negative-polarity regions are pably caused by lithostatic fluid pressure and hydraulic dilation of fault zone.
Tectonic Setting
The northern Barbados Ridge is the accretionary prism formforward of the Lesser Antilles arc, where oceanic crust of the NoAtlantic portion of the North American Plate is being underthrust neath the Caribbean Plate at rates between 25 and 40 km/m.y.1A). In the drilling area, the prism forms a wide, low taper-anwedge (Fig. 1B), up to 10 km thick and 120 km across (Westbrooal., 1988). Incoming section on the subducting plate is relatively in this region (410 m at reference Site 543 east of the deforma
neei-the
entntlle-ed-ceels, re-ob-he
edrthe-(Fig.le et
hintion
front), owing in part to the influence of the Tiburon Rise on the dosition of sediments derived from the northern margin of SoAmerica. At Site 948 (essentially the same as the previously driSite 671), 490 m of thrust-imbricated, poorly lithified pelagic ahemipelagic muds overlie a 40-m-thick décollement zone, definedthe presence of shear deformation structures (scaly fabric and teic breccia) in the cores (Fig. 2). Below the décollement, another ~m of little-deformed hemipelagic and clastic terrigenous sedimoverlies the oceanic basement of the downgoing plate (MasMoore, et al., 1988). The offscraped sediments of the prism are oMiocene to early Pleistocene age, whereas the drilled interval bethe décollement is of Cretaceous to late Oligocene age. The décment zone is known from pore-water geochemistry to be a site otremely localized fluid flow (Gieskes et al., 1990; Shipboard Scitific Party, 1995).
Results from drilling on Legs 78A, 110, and 156 indicate thwithin a few kilometers arcward of the deformation front, the déclement is consistently localized on the lower Miocene radiolaribearing hemipelagic clay at the base of lithologic Unit II (Fig. 2; tinterval was designated Unit IIC on Leg 110 at Site 671, but Uniton Leg 156 at Site 948). Macroscopically, the décollement stripsthe Miocene to lower Pleistocene Units I and II into the prism, permits the Cretaceous to upper Oligocene Units III and IV to bederthrust beneath the prism without significant deformation. Forpurpose of this study, we assume that this fault geometry andstratigraphy is consistent laterally at least to Site 947, 1.7 km arcwof Site 948.
This assumption of lateral consistency is supported by two inpendent arguments. First, drilling results at Sites 541, 672, 675,676 all indicate that the stratigraphy is correlative over a broad
127

H.J. TOBIN, J.C. MOORE
v
eromce-ite et
verentrills of4).li-ns
thatryghal
91)om-tede-te sta-
on ar- thess in theom
re-ereen-ndleentns-T)gi-
hreeals.pens-als
ap-dedren topro-am-nd-llyalardea-led
di-
gion. This is not surprising given the deep-water pelagic and hemipe-lagic facies, in which depositional complexities such as channelingare much less likely than in the trench turbidite facies of continentalmargin subduction zones. The units through the décollement secare characterized by slow sedimentation in tranquil water (ShipboScientific Party, 1995; Mascle, Moore, et al., 1988). This tendsproduce uniform deposition of broad areal extent. Second, an indi
Fault
Zones
Déc
olle
men
t Z
on
e
Dep
th(m
bsf)
Cor
eR
ecovery Structural Features
BeddingDip
ScalyFabric
0 90
430
440
450
460
470
480
490
510
520
530
540
550
560
570
580
590
10X
11X
12X
13X
14X
15X
16X
17X
18X
19X
Hole 948CStructural Summary
2X
3X
4X
5X
6X
7X
8X
9X
Stratal disruption
Veins: rhodochrositeor
phillipsiteCore-scale fold
Minor reverse fault
Minor normal fault
Sediment-filled vein
Brecciated zone
500
Features
DO
MA
IN II
: DE
CO
LLE
ME
NT
DO
MA
IN II
I: U
ND
ER
TH
RU
ST
SE
CT
ION
DO
MA
IN I:
PR
ISM
Test sample location
Figure 2. Structural summary log of Site 948 coring, including location ofUnit II/III boundary. Locations of tested whole-round samples marked withblack ovals.
128
tionard toid-
ual reflecting horizon in the seismic data (“Horizon A” of G.F. Mooret al., 1995), interpreted as a stratigraphic horizon, can be traced fthe basin into and under the décollement zone. This horizon is traable under the negative-polarity décollement reflector below S947, showing the lateral continuity of the stratigraphy (G.F. Mooreal., 1995).
Décollement Zone Reflectivity
The décollement zone forms a prominent seismic reflector omuch of its extent. A recent study of the character of the décollemreflection in the three-dimensional survey, which includes the dsites, shows that this reflection is variable in character, with areaboth negative and positive reflection polarity (Shipley et al., 199Many of the regions of negative polarity are of unusually high amptude (Fig. 3), and modeling of an area of negative-polarity reflectiosomewhat to the south of the drilling transect (Line 630) suggests they result from a thin interval, associated with the fault zone, of velow impedance (Shipley et al., 1994; Bangs et al., 1996). Throuearlier modeling of the décollement reflection in a two-dimensionline approximately 100 km to the north, Bangs and Westbrook (19showed that the reflector there also was likely to represent an analously low-impedance zone about 20 m thick. Site 947 was situawithin the regionally extensive high-amplitude negative-polarity rflection (Fig. 3). Unfortunately, at Site 947 drilling failed to penetrathrough or even into the décollement zone because of poor holebility, so this reflector remains unsampled.
Regions of the décollement zone that exhibit positive reflectipolarity (such as Sites 948 and 671) generally are more limited ineal extent and have peak amplitudes only about half the value ofpeak negative values (Fig. 3). It has been proposed that the succepenetrating the fault zone at these sites offers indirect support forhypothesis that negative-polarity reflections elsewhere result frextreme fluid pressures (Shipley et al., 1994).
EXPERIMENTAL METHODS
For this study, 15- to 20-cm-long whole-round samples were cafully selected upon core recovery at Site 948. Whole rounds wchosen to represent the varying lithologies and structural fabrics countered in this borehole, and were taken from above, within, abelow the structurally defined décollement zone (Fig. 2). Whorounds were immediately sealed into sections of core liner to prevloss of pore fluids and physical coherency during subsequent traport and handling. After the cruise, five computed tomography (Cscans of each sample were obtained: two mutually orthogonal lontudinal sections passing through the center of the sample, and thorizontal sections across the core at regularly spaced intervThese CT-scans clearly image the locations of lithologic breaks, ocracks, and other drilling- and handling-induced damage (“drill bicuit” surfaces), and were invaluable in choosing coherent intervfrom the whole rounds for subsample locations.
Whole-round samples were trimmed using a band-saw into proximately cubic subsamples 25 mm on a side, and were then loainto a confining vessel fitted with ports allowing independent popressure and confining pressure control (Fig. 4). Care was takemaintain seawater saturation throughout the sample preparation cess to minimize induced cracking and other disturbance of the sples. P-wave velocity transducers were mounted in the sample eplatens to measure velocity in a vertical path, mimicking verticaincident seismic reflection data acquisition. Significant directionanisotropy of velocity is likely in these samples based on shipbomeasurements (Shipboard Scientific Party, 1995), but was not msured in this study because it should not affect the vertically sampimpedance structure. Ultrasonic P-wave velocity (vp) was measuredunder constant confining pressure and varying fluid-pressure con

VARIATIONS IN ULTRASONIC VELOCITY AND DENSITY
600
650
700
750
800
800 1000 1200 1400 1600
5300
5300
5400
5500
5600
0 1 2 3 4 5 -6.6 -5.0 -4.0 -3.0 -2.0 -1.0 0.0 1.0 2.0 3.2
-58˚ 46' -58˚ 44' -58˚ 42' -58˚ 40'
15˚ 32'
541 542A
671B
675A676A
947A948A/C948B/D
949A/CB
Kilometers Seismic Decollement Amplitude Common Midpoint
Line
Figure 3. Décollement amplitude map of Shipley et al. (1994). Site 947 is located in a region of high-amplitude negative polarity, where penetration of thereflective zone failed. Site 948 is located on a medium-amplitude, positive reflection, where the fault zone was successfully drilled and sampled.
f
o
ddthwr
uat
flin
wellone not
ityval- ofn in
rated
ioustion
ess,tion load-at ituc-Be-o al- theg totedpleree
reas- un-ive
both
ent
tions. Internal fluid pressure (Pf) was controlled by means of a pres-sure generator ported to the sample, and the pore fluid (seawater) wasisolated from the confining medium by a flexible latex membraneplaced over the sample and end-platens. The samples were then sub-jected to isotropic confining pressure (Pc) equivalent to the calculatedlithostatic overburden load given the depth below the seafloor fromwhich the sample was recovered and the density of the overlying sed-iments. The pressure of the overlying column of water above the sea-floor was neglected as it does not contribute to the effective pressure(Peff) experienced by the sample.
Isotropic stresses are a reasonable simplification of in situ condi-tions for the purpose of this study. Both principal horizontal stressesmust be at least equal to the overburden load to produce a thrust fail-ure mode, but given the weak, unlithified, and clay-dominated lithol-ogies, differential stresses are likely to be small compared to themean stress. In any case, vertical vp is primarily a function of vertical(overburden) stress (Bourbié et al., 1987), lessening the effect oviations from actual in situ horizontal stress values.
We calculated vp from pulse-transmission time measurements flowing methods adapted from Christensen (1985), using 400-kHztrasonic transducers, excited by a 400-ns, 380-volt pulse producea Panametrics 5055PR pulser/receiver. Traveltime was measureing a Hewlett-Packard digital oscilloscope. Error introduced by frequency difference between ultrasonic and seismic sources considered negligible (Bourbié et al., 1987). The absolute errocalculated velocity for the samples is within 2%, but relative velocchanges within a given sample are accurate to ~1%. All measments were made at a temperature of ~20°C; in situ temperature décollement depth is estimated to be ~40°C (Shipboard ScienParty, 1995). Correction for this temperature difference wouldslight (<1%; Bourbié et al., 1987), so none were applied.
Sample pore pressure was controlled independently of Pc. For allsamples, confining pressure was applied and Pf was simultaneouslybrought up to >99% of Pc, (equivalent to essentially lithostatic fluidpressure conditions, or near-zero effective pressure), then Pf was de-creased in a step-wise manner down to calculated hydrostatic pressure (Ph) conditions, and a vp measurement was taken at each
de-
l- ul- by us-eas
ofityre-t theificbe
uid-
crement. Because in situ maximum past fluid pressures are not known and are likely to be super-hydrostatic, these tests were don a path of increasing effective pressure so that samples weresubjected to any potential primary consolidation prior to velocmeasurement. In this way, individual samples could be used to euate velocity variation with effective stress under a wide rangestress conditions, including effective vertical stress greater thasitu values.
This test scheme means that all curves in the data were genethrough progressive loading to higher Peff; unloading curves wouldtend to give higher velocities at a given pressure step if the prevmaximum effective pressure is exceeded and inelastic consolidaoccurs during the test. Consolidation is a largely irreversible procand significant velocity hysteresis is expected when preconsolidastresses are exceeded (e.g., Bowers, 1994). Using progressiveing curves to interpret pressure vs. velocity is conservative in thpredicts lower fluid pressures to achieve a particular velocity redtion than those predicted from unloading curves (Bowers, 1994). cause of the low permeability of these samples, care was taken tlow the internal sample pore pressure to come to equilibrium withapplied pore pressure before recording the traveltime and movinthe next pressure step. This equilibration time varied for the tessamples from 6 to 24 hr. Thus, complete testing of a given samtook up to two weeks under continuous confining pressure. For thof the samples, a low-pressure cycle of decreasing and then incing fluid pressure was run to evaluate the sample behavior duringloading and reloading through the likely range of previous effectpressure.
RESULTS
Velocity Data
Four samples were tested across the décollement and from major lithologic units (II and III). Interval 156-948C-8X-CC, 12−26cm, comes from the prism structural domain, above the décollemas defined in the cores. Interval 156-948C-9X-6, 28−43 cm, repre-
129
H.J. TOBIN, J.C. MOORE
e-5ilw ae
p
r
e-
r
sf-
iv
as-wellSci-o-s ifack-elyu-lib-de- al-reedayelye.
ed theci-
tainle ofy.
810
sents the upper, most hydrologically active part of the décollemInterval 156-948C-12X-3, 40−57 cm, exhibits the intense scaly fabric that is the structural hallmark of the décollement, and interval 1948C-16X-7, 15−31 cm, is from the underthrust section and exhibno macroscopic deformation features. Lithostatic overburden, calated hydrostatic pressure, and apparent in situ fluid pressure extracted from an empirically generated curve (J.C. Moore et1995b; Fig. 5), which is based on density logs and consolidation t
Velocity vs. effective pressure data from all four tested sampare presented in Figure 6. Lines labeled “hydrostatic” on the grarepresent Peff, assuming hydrostatic fluid-pressure conditions, calclated from the difference between the lithostatic and hydrostatic psure trends in Figure 5. The lines labeled “in situ” represent thePeff
for each sample assuming the fluid-pressure curve in Figure 5. Nthat “in situ” in all cases indicates substantially lower effective prsure than “hydrostatic” does, as even Site 948 (the supposed lowid pressure site) is likely to be overpressured to at least λ = 0.8 at dé-collement depths (where λ is the overpressure ratio, or fluid pressudivided by lithostatic pressure).
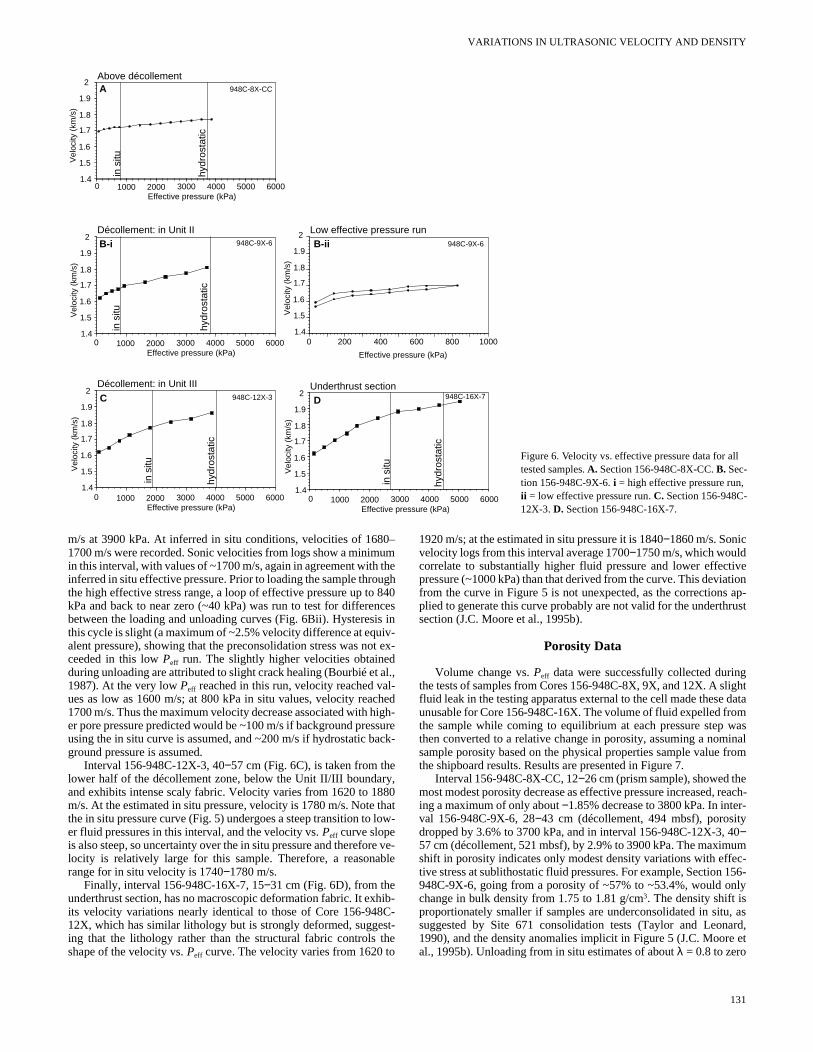
Interval 156-948C-8X-CC, 12−26 cm, from the prism and clearlyabove the décollement zone, is from the smectite-rich (~50% smtite) Unit IID and does not exhibit scaly fabric or fractures or othmacroscopic indications of deformation. The sediment is masand only incipiently lithified. It shows a relatively flat velocity vs. efective pressure curve (Fig. 6A). The low-effective pressure endthe curve has a velocity of 1700 m/s, rising to about 1775 m/s g
Confining Fluid
Pc
Pore Pressure Intensifier
CELL
seawaterpore fluid
Sample
Pressure Gauge Oscilloscope
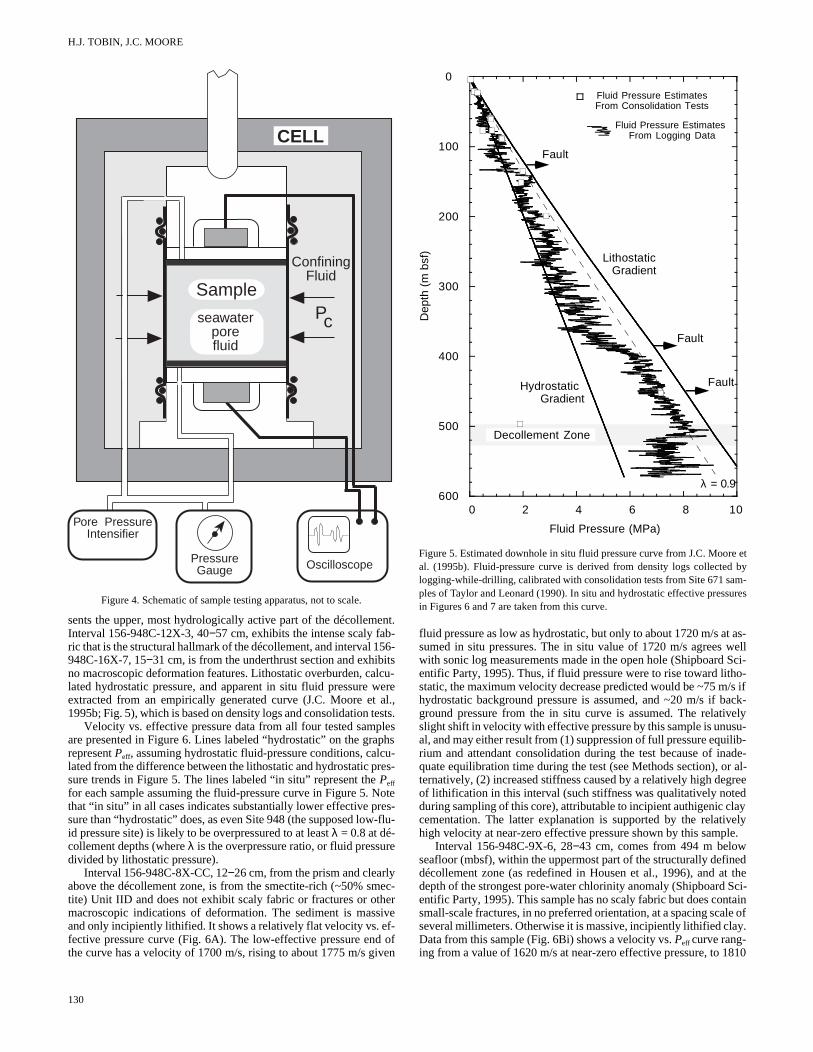
Figure 4. Schematic of sample testing apparatus, not to scale.
130
nt.
6-tscu-erel.,
sts.leshs
u-es-
otes-flu-
e
ec-erive
ofen
fluid pressure as low as hydrostatic, but only to about 1720 m/s atsumed in situ pressures. The in situ value of 1720 m/s agrees with sonic log measurements made in the open hole (Shipboard entific Party, 1995). Thus, if fluid pressure were to rise toward lithstatic, the maximum velocity decrease predicted would be ~75 m/hydrostatic background pressure is assumed, and ~20 m/s if bground pressure from the in situ curve is assumed. The relativslight shift in velocity with effective pressure by this sample is unusal, and may either result from (1) suppression of full pressure equirium and attendant consolidation during the test because of inaquate equilibration time during the test (see Methods section), orternatively, (2) increased stiffness caused by a relatively high degof lithification in this interval (such stiffness was qualitatively noteduring sampling of this core), attributable to incipient authigenic clcementation. The latter explanation is supported by the relativhigh velocity at near-zero effective pressure shown by this sampl
Interval 156-948C-9X-6, 28−43 cm, comes from 494 m belowseafloor (mbsf), within the uppermost part of the structurally defindécollement zone (as redefined in Housen et al., 1996), and atdepth of the strongest pore-water chlorinity anomaly (Shipboard Sentific Party, 1995). This sample has no scaly fabric but does consmall-scale fractures, in no preferred orientation, at a spacing scaseveral millimeters. Otherwise it is massive, incipiently lithified claData from this sample (Fig. 6Bi) shows a velocity vs. Peff curve rang-ing from a value of 1620 m/s at near-zero effective pressure, to 1
0
100
200
300
400
500
6000 2 4 6 8 10
Fluid Pressure (MPa)
Dep
th (
m b
sf)
Lithostatic Gradient
Hydrostatic Gradient
Decollement Zone
Fault
Fault
Fault
λ = 0.9
Fluid Pressure EstimatesFrom Consolidation Tests
Fluid Pressure Estimates From Logging Data
Figure 5. Estimated downhole in situ fluid pressure curve from J.C. Moore etal. (1995b). Fluid-pressure curve is derived from density logs collected bylogging-while-drilling, calibrated with consolidation tests from Site 671 sam-ples of Taylor and Leonard (1990). In situ and hydrostatic effective pressuresin Figures 6 and 7 are taken from this curve.
VARIATIONS IN ULTRASONIC VELOCITY AND DENSITY
948C-12X-3
Décollement: in Unit III
in s
itu
hydr
osta
tic
C 948C-16X-7Underthrust section
in s
itu
hydr
osta
tic
D
948C-9X-6
Décollement: in Unit II
1.4
1.5
1.6
1.7
1.8
1.9
2V
eloc
ity (
km/s
)
0 1000 2000 3000 4000 5000 6000Effective pressure (kPa)
948C-8X-CC
Above décollement
948C-9X-6
Low effective pressure run
hydr
osta
tichy
dros
tatic
in s
ituin
situ
A
B-i B-ii
0 1000 2000 3000 4000 5000 6000Effective pressure (kPa)
1.4
1.5
1.6
1.7
1.8
1.9
2
Vel
ocity
(km
/s)
0 1000 2000 3000 4000 5000 6000Effective pressure (kPa)
0 1000 2000 3000 4000 5000 6000Effective pressure (kPa)
0 200 400 600
Effective pressure (kPa)
800 10001.4
1.5
1.6
1.7
1.8
1.9
2
Vel
ocity
(km
/s)
1.4
1.5
1.6
1.7
1.8
1.9
2
Vel
ocity
(km
/s)
1.4
1.5
1.6
1.7
1.8
1.9
2
Vel
ocity
(km
/s)
Figure 6. Velocity vs. effective pressure data for all tested samples. A. Section 156-948C-8X-CC. B. Sec-tion 156-948C-9X-6. i = high effective pressure run, ii = low effective pressure run. C. Section 156-948C-12X-3. D. Section 156-948C-16X-7.
u nisi
od lchsa
r8 t
rb
h
sto
ivetion ap-rust
gghtdatamwasinalrom
each-r-
0umc-
156-ly
, asard, et
m/s at 3900 kPa. At inferred in situ conditions, velocities of 1681700 m/s were recorded. Sonic velocities from logs show a minimin this interval, with values of ~1700 m/s, again in agreement withinferred in situ effective pressure. Prior to loading the sample throthe high effective stress range, a loop of effective pressure up tokPa and back to near zero (~40 kPa) was run to test for differebetween the loading and unloading curves (Fig. 6Bii). Hysteresthis cycle is slight (a maximum of ~2.5% velocity difference at equalent pressure), showing that the preconsolidation stress was nceeded in this low Peff run. The slightly higher velocities obtaineduring unloading are attributed to slight crack healing (Bourbié et1987). At the very low Peff reached in this run, velocity reached vaues as low as 1600 m/s; at 800 kPa in situ values, velocity rea1700 m/s. Thus the maximum velocity decrease associated with er pore pressure predicted would be ~100 m/s if background preusing the in situ curve is assumed, and ~200 m/s if hydrostatic bground pressure is assumed.
Interval 156-948C-12X-3, 40−57 cm (Fig. 6C), is taken from thelower half of the décollement zone, below the Unit II/III boundaand exhibits intense scaly fabric. Velocity varies from 1620 to 1m/s. At the estimated in situ pressure, velocity is 1780 m/s. Notethe in situ pressure curve (Fig. 5) undergoes a steep transition toer fluid pressures in this interval, and the velocity vs. Peff curve slopeis also steep, so uncertainty over the in situ pressure and therefolocity is relatively large for this sample. Therefore, a reasonarange for in situ velocity is 1740−1780 m/s.
Finally, interval 156-948C-16X-7, 15−31 cm (Fig. 6D), from theunderthrust section, has no macroscopic deformation fabric. It exits velocity variations nearly identical to those of Core 156-94812X, which has similar lithology but is strongly deformed, suggeing that the lithology rather than the structural fabric controls shape of the velocity vs. Peff curve. The velocity varies from 1620 t
0–umthegh840ces inv-t ex-
al.,-hedigh-sureck-
y,80hatlow-
e ve-le
ib-C-t-
he
1920 m/s; at the estimated in situ pressure it is 1840−1860 m/s. Sonicvelocity logs from this interval average 1700−1750 m/s, which wouldcorrelate to substantially higher fluid pressure and lower effectpressure (~1000 kPa) than that derived from the curve. This deviafrom the curve in Figure 5 is not unexpected, as the correctionsplied to generate this curve probably are not valid for the underthsection (J.C. Moore et al., 1995b).
Porosity Data
Volume change vs. Peff data were successfully collected durinthe tests of samples from Cores 156-948C-8X, 9X, and 12X. A slifluid leak in the testing apparatus external to the cell made these unusable for Core 156-948C-16X. The volume of fluid expelled frothe sample while coming to equilibrium at each pressure step then converted to a relative change in porosity, assuming a nomsample porosity based on the physical properties sample value fthe shipboard results. Results are presented in Figure 7.
Interval 156-948C-8X-CC, 12−26 cm (prism sample), showed themost modest porosity decrease as effective pressure increased, ring a maximum of only about −1.85% decrease to 3800 kPa. In inteval 156-948C-9X-6, 28−43 cm (décollement, 494 mbsf), porositydropped by 3.6% to 3700 kPa, and in interval 156-948C-12X-3, 4−57 cm (décollement, 521 mbsf), by 2.9% to 3900 kPa. The maximshift in porosity indicates only modest density variations with effetive stress at sublithostatic fluid pressures. For example, Section 948C-9X-6, going from a porosity of ~57% to ~53.4%, would onchange in bulk density from 1.75 to 1.81 g/cm3. The density shift isproportionately smaller if samples are underconsolidated in situsuggested by Site 671 consolidation tests (Taylor and Leon1990), and the density anomalies implicit in Figure 5 (J.C. Mooreal., 1995b). Unloading from in situ estimates of about λ = 0.8 to zero
131

H.J. TOBIN, J.C. MOORE
ie
fsdtit s ,
or
u
sg
o
y
i
n
ug
s
s
d
on
o
<elo
asmnysi-rook,al.,ffectanda-le
s ofc-
ent. byeh-
hisary
t atcanpres-resi--lar-
ofsitytonndi-di-ers,he re-
e ef-
dped-enceocitysity thepre-
Peff (λ = 1.0) would yield a porosity change from 56.5% to 57%, pro-ducing a near-negligible density shift of 1.747–1.755 g/cm3.
All three samples have a similar shape to the porosity-effectpressure curve: an initial very low gradient at low effective pressura distinct break in slope, then a linear or near-linear decreasing poity as pressure rose. The break in slope may be a manifestation omaximum past effective stress experienced by the sample in This would be analogous to the preconsolidation stress on a stanconsolidation test, with the steeper gradient reflecting the transifrom reloading to the virgin consolidation curve. It is important note that these data were collected under isotropic stress ratherthe uniaxial strain conditions used in standard consolidation tethey are not a substitute for yield tests. However, under the higheral stress conditions expected in the toes of accretionary prismsisotropic test may duplicate in situ conditions better than uniaxconsolidation tests. The in situ Peff derived from the fluid-pressurecurve (Fig. 5) has been indicated on each curve in Figure 7 for cparison. The break in slope on the Core 156-948C-8X porosity cusuggests a preconsolidation pressure of 600−700 kPa, close to the es-timated in situ effective stress value of 800 kPa derived from Fig5. That of Core 156-948C-9X also agrees well, because the breaslope occurs at 950 kPa or above, and the in situ estimate is 800Core 156-948C-12X does not fit as well, with the break in slope1100 kPa or above, and the in situ estimate at 1850 kPa. As discuin the section above the in situ estimate has an unusually high deof uncertainty for this sample, and could be substantially lower th1850 kPa. If these curves really do give an indication of the precsolidation stress, then they support the in situ pressure curve andderconsolidation suggested by J.C. Moore et al. (1995b) and Taand Leonard (1990), respectively.
DISCUSSION
Causes of the Polarity Reversalsof the Décollement Zone Reflector
Using the results of the laboratory velocity and porosity measure-ments, core-based observations, and comparison to waveform mod-els, we can make several inferences regarding the physical nature ofthe décollement zone. Everywhere that the sediment column andcollement have been penetrated, the décollement is clearly localon the base of Unit II (Fig. 2), with deformation extending tens meters both above and below the Unit II/III boundary (Mascle aMoore, 1990). We believe that it is reasonable to assume that holds true in the nearby regions of negative polarity as well, becastratigraphic horizons can be traced laterally from positive- to netive-polarity regions (G.F. Moore et al., 1995). Using this assumtion, we consider the possible physical cause of the polarity reverbased on the data from Site 948.
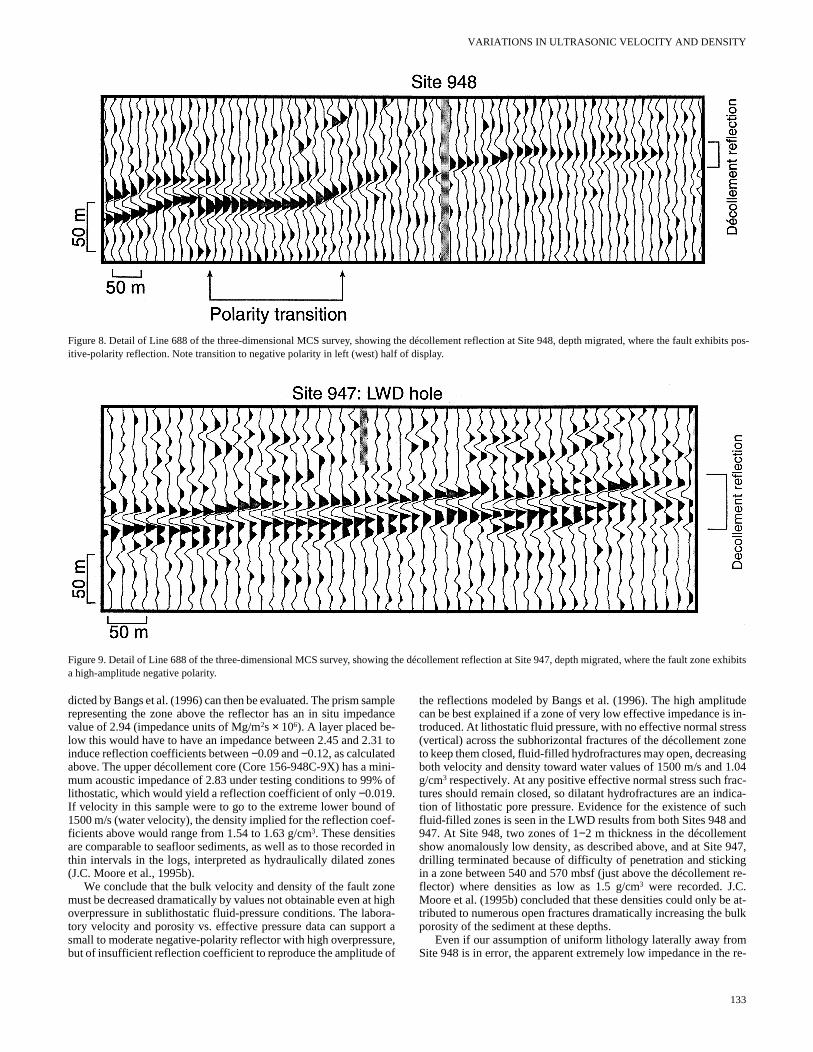
At Site 948, the fault zone is recognized in cores as a 40-m-thzone of well-developed scaly fabric and tectonic brecciation. Tlithologic boundary of Units II and III occurs in the middle of thizone of scaly fabric, with deformation on both sides of the boundaAt calculated in situ pressures, there is a slight (~50 m/s) decreasthe acoustic velocity in the upper part of the fault zone comparesuperjacent sediment, attributed here to the deformation in the fazone sample. This velocity decrease is overshadowed by the prnent shift to higher density across the lithologic boundary as seeboth core physical properties data and logging-while-drilling (LWDdensity logs (Shipboard Scientific Party, 1995). At this site, thereno negative-polarity reflection; we attribute the positive reflecti(Fig. 8) to this density increase. A synthetic seismogram based ondensity log reproduced this positive-polarity reflection (ShipboaScientific Party, 1995). The density log also shows two very thin (m) intervals of anomalously low density at 505 and 514 mbsf, intpreted by J.C. Moore et al. (1995b) as hydrofractures filled with fidized sediment. These apparent low-density zones are too thin tresolved as reflections.
132
ves,
ros- theitu.ard
onothants;lat-thisial
m-ve
rek inkPa.atsedree
ann-
un-lor
dé-zedofd
thissea-
p-als
ickhe
ry.e in toult-mi- in) isn therd3r-
u- be
To produce large-amplitude negative-polarity reflections suchthe one under Site 947 (Fig. 9), assuming the same lithologic coluand similar structural geology of the décollement zone, some phcal property has to change. Previous research (Bangs and Westb1991; Shipley et al., 1994; Tobin et al., 1994; J.C. Moore et 1995a) has shown that the most likely property change that can athe impedance so strongly in a fault zone is for the fluid pressure (therefore Peff) to vary. We first consider the physical cause of negtive polarity with this uniform lithology assumption, then possibscenarios that deviate from this assumption.
Bangs et al. (1996) presented waveform and amplitude modelstrongly negative-polarity regions of the décollement-zone refletion. The impedance structure of the zone is remarkably consistThe moderate- to high-amplitude reflections they modeled are fita low-velocity zone 12−16 m thick, with a velocity decrease relativto the immediately overlying material of 100–200 m/s. The higamplitude reflections require a velocity decrease of 150−200 m/s, as-suming density varies according to relations in Hamilton (1978). Tcombination of velocity and density corresponds to upper boundreflection coefficients of –0.09 to –0.12.
If we assume that the only difference between the décollemenSite 948 and the regions of negative polarity is fluid pressure, we use the laboratory data to place bounds on the magnitude of oversure. Driving fluid pressure to the near-lithostatic maximum for Co156-948C-9X would produce a velocity drop of 100 m/s and a denty change that is less than 0.1 g/cm3, as discussed above. This impedance structure would produce a moderate-amplitude, negative-poity reflection at the décollement zone. The amplitude modelingBangs et al. (1996) 2−3 km to the southwest of the drill sites indicatea velocity drop of 150−200 m/s, but assumes a much larger densdecrease associated with the velocity change, following a Hamil(1978) function coupling density to velocity. This empirical functiois appropriate for normal depth-dependent consolidation of sements, but overestimates density variations with velocity in sements undergoing unloading through rising pore pressure (Bow1994). If density is allowed to vary only slightly, as indicated by tdata presented here, then much larger velocity reduction would bequired than can be supported by the measured values at positivfective pressures.
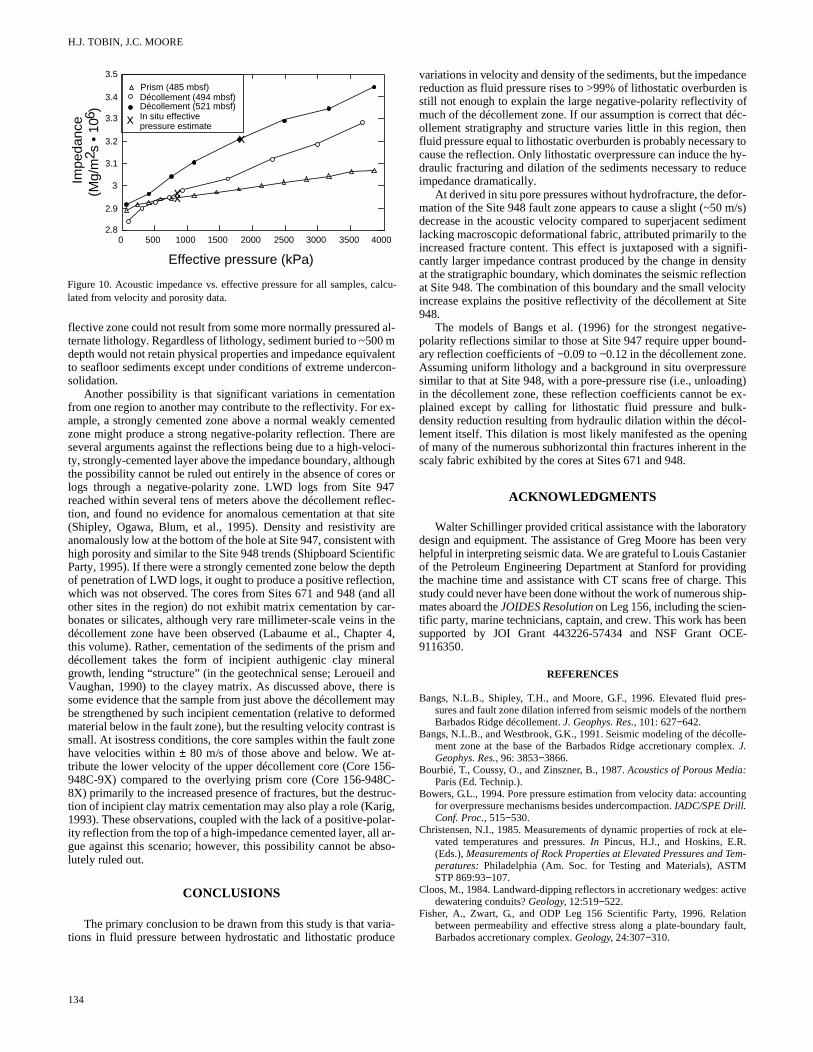
The ambiguity resulting from this trade-off between velocity andensity can be addressed by considering contrasts in acoustic imance, rather than just velocity or density. The impedance dependon effective pressure can be calculated using the measured veland volume change data, transforming the volumetric data to denchange (Fig. 10). Using the plotted acoustic impedance values,impedance drop necessary to obtain the reflection coefficients
-4
-3
-2
-1
0
1
0 500 1000 1500 2000 2500 3000 3500 4000
Décollement (521 m)Décollement (494 m)Prism (485 m)
x In situ effectivepressure estimate
Effective pressure (kPa)
xx
∆ P
oros
ity (
%)
x
Figure 7. Porosity vs. effective pressure for all tested samples, expressed asthe percent change from initial porosity as effective pressure was increased.
VARIATIONS IN ULTRASONIC VELOCITY AND DENSITY
Figure 8. Detail of Line 688 of the three-dimensional MCS survey, showing the décollement reflection at Site 948, depth migrated, where the fault exhibits pos-itive-polarity reflection. Note transition to negative polarity in left (west) half of display.
Figure 9. Detail of Line 688 of the three-dimensional MCS survey, showing the décollement reflection at Site 947, depth migrated, where the fault zone exhibitsa high-amplitude negative polarity.
e
n
o
u
de in-ssoneing.04c-ica-uchndt947,gt re-
at-ulk
re-
dicted by Bangs et al. (1996) can then be evaluated. The prism samplerepresenting the zone above the reflector has an in situ impedancevalue of 2.94 (impedance units of Mg/m2s × 106). A layer placed be-low this would have to have an impedance between 2.45 and 2.31 toinduce reflection coefficients between −0.09 and −0.12, as calculatedabove. The upper décollement core (Core 156-948C-9X) has a mmum acoustic impedance of 2.83 under testing conditions to 99%lithostatic, which would yield a reflection coefficient of only −0.019.If velocity in this sample were to go to the extreme lower bound1500 m/s (water velocity), the density implied for the reflection coficients above would range from 1.54 to 1.63 g/cm3. These densitiesare comparable to seafloor sediments, as well as to those recordthin intervals in the logs, interpreted as hydraulically dilated zo(J.C. Moore et al., 1995b).
We conclude that the bulk velocity and density of the fault zomust be decreased dramatically by values not obtainable even atoverpressure in sublithostatic fluid-pressure conditions. The labtory velocity and porosity vs. effective pressure data can supposmall to moderate negative-polarity reflector with high overpressbut of insufficient reflection coefficient to reproduce the amplitude
ini- of
off-
ed ines
nehighra-rt are,of
the reflections modeled by Bangs et al. (1996). The high amplitucan be best explained if a zone of very low effective impedance istroduced. At lithostatic fluid pressure, with no effective normal stre(vertical) across the subhorizontal fractures of the décollement zto keep them closed, fluid-filled hydrofractures may open, decreasboth velocity and density toward water values of 1500 m/s and 1g/cm3 respectively. At any positive effective normal stress such fratures should remain closed, so dilatant hydrofractures are an indtion of lithostatic pore pressure. Evidence for the existence of sfluid-filled zones is seen in the LWD results from both Sites 948 a947. At Site 948, two zones of 1−2 m thickness in the décollemenshow anomalously low density, as described above, and at Site drilling terminated because of difficulty of penetration and stickinin a zone between 540 and 570 mbsf (just above the décollemenflector) where densities as low as 1.5 g/cm3 were recorded. J.C.Moore et al. (1995b) concluded that these densities could only betributed to numerous open fractures dramatically increasing the bporosity of the sediment at these depths.
Even if our assumption of uniform lithology laterally away fromSite 948 is in error, the apparent extremely low impedance in the
133
H.J. TOBIN, J.C. MOORE
eta
dionc
e a
trsza
8
roll
r
ncen isoféc-en
ry to hy-uce
for-m/s)mentheifi-
nsitytioncityite
ive-nd-.ureing) ex-lk-l-
ing the
ry veryniering Thiship-
eenE-
lle-x.
ting
ele-.
tive
ionault,
c
flective zone could not result from some more normally pressured al-ternate lithology. Regardless of lithology, sediment buried to ~500 mdepth would not retain physical properties and impedance equivalentto seafloor sediments except under conditions of extreme undercon-solidation.
Another possibility is that significant variations in cementationfrom one region to another may contribute to the reflectivity. For ex-ample, a strongly cemented zone above a normal weakly cementedzone might produce a strong negative-polarity reflection. There areseveral arguments against the reflections being due to a high-veloci-ty, strongly-cemented layer above the impedance boundary, althoughthe possibility cannot be ruled out entirely in the absence of cores orlogs through a negative-polarity zone. LWD logs from Site 947reached within several tens of meters above the décollement rtion, and found no evidence for anomalous cementation at tha(Shipley, Ogawa, Blum, et al., 1995). Density and resistivity anomalously low at the bottom of the hole at Site 947, consistenthigh porosity and similar to the Site 948 trends (Shipboard ScienParty, 1995). If there were a strongly cemented zone below the of penetration of LWD logs, it ought to produce a positive reflectwhich was not observed. The cores from Sites 671 and 948 (aother sites in the region) do not exhibit matrix cementation by bonates or silicates, although very rare millimeter-scale veins indécollement zone have been observed (Labaume et al., Chapthis volume). Rather, cementation of the sediments of the prismdécollement takes the form of incipient authigenic clay mingrowth, lending “structure” (in the geotechnical sense; LeroueilVaughan, 1990) to the clayey matrix. As discussed above, thesome evidence that the sample from just above the décollemenbe strengthened by such incipient cementation (relative to defomaterial below in the fault zone), but the resulting velocity contrasmall. At isostress conditions, the core samples within the fault have velocities within ± 80 m/s of those above and below. We tribute the lower velocity of the upper décollement core (Core 1948C-9X) compared to the overlying prism core (Core 156-948X) primarily to the increased presence of fractures, but the destion of incipient clay matrix cementation may also play a role (Ka1993). These observations, coupled with the lack of a positive-pity reflection from the top of a high-impedance cemented layer, ague against this scenario; however, this possibility cannot be alutely ruled out.
CONCLUSIONS
The primary conclusion to be drawn from this study is that vations in fluid pressure between hydrostatic and lithostatic prod
2.8
2.9
3
3.1
3.2
3.3
3.4
3.5
0 500 1000 1500 2000 2500 3000 3500 4000
Effective pressure (kPa)
Décollement (521 mbsf)Décollement (494 mbsf)Prism (485 mbsf)
x In situ effectivepressure estimate
xx
x
Impe
danc
e(M
g/m
2 s •
106
)
Figure 10. Acoustic impedance vs. effective pressure for all samples, lated from velocity and porosity data.
134
flec- sitere
withtificepthn,d allar- theter 4, andralnd
re is maymedt isonet-56-C-
truc-ig,lar- ar-bso-
ia-uce
variations in velocity and density of the sediments, but the impedareduction as fluid pressure rises to >99% of lithostatic overburdestill not enough to explain the large negative-polarity reflectivity much of the décollement zone. If our assumption is correct that dollement stratigraphy and structure varies little in this region, thfluid pressure equal to lithostatic overburden is probably necessacause the reflection. Only lithostatic overpressure can induce thedraulic fracturing and dilation of the sediments necessary to redimpedance dramatically.
At derived in situ pore pressures without hydrofracture, the demation of the Site 948 fault zone appears to cause a slight (~50 decrease in the acoustic velocity compared to superjacent sedilacking macroscopic deformational fabric, attributed primarily to tincreased fracture content. This effect is juxtaposed with a signcantly larger impedance contrast produced by the change in deat the stratigraphic boundary, which dominates the seismic reflecat Site 948. The combination of this boundary and the small veloincrease explains the positive reflectivity of the décollement at S948.
The models of Bangs et al. (1996) for the strongest negatpolarity reflections similar to those at Site 947 require upper bouary reflection coefficients of −0.09 to −0.12 in the décollement zoneAssuming uniform lithology and a background in situ overpresssimilar to that at Site 948, with a pore-pressure rise (i.e., unloadin the décollement zone, these reflection coefficients cannot beplained except by calling for lithostatic fluid pressure and budensity reduction resulting from hydraulic dilation within the décolement itself. This dilation is most likely manifested as the openof many of the numerous subhorizontal thin fractures inherent inscaly fabric exhibited by the cores at Sites 671 and 948.
ACKNOWLEDGMENTS
Walter Schillinger provided critical assistance with the laboratodesign and equipment. The assistance of Greg Moore has beenhelpful in interpreting seismic data. We are grateful to Louis Castaof the Petroleum Engineering Department at Stanford for providthe machine time and assistance with CT scans free of charge.study could never have been done without the work of numerous smates aboard the JOIDES Resolution on Leg 156, including the scien-tific party, marine technicians, captain, and crew. This work has bsupported by JOI Grant 443226-57434 and NSF Grant OC9116350.
REFERENCES
Bangs, N.L.B., Shipley, T.H., and Moore, G.F., 1996. Elevated fluid pres-sures and fault zone dilation inferred from seismic models of the northernBarbados Ridge décollement. J. Geophys. Res., 101: 627−642.
Bangs, N.L.B., and Westbrook, G.K., 1991. Seismic modeling of the décoment zone at the base of the Barbados Ridge accretionary compleJ.Geophys. Res., 96: 3853−3866.
Bourbié, T., Coussy, O., and Zinszner, B., 1987. Acoustics of Porous Media:Paris (Ed. Technip.).
Bowers, G.L., 1994. Pore pressure estimation from velocity data: accounfor overpressure mechanisms besides undercompaction. IADC/SPE Drill.Conf. Proc., 515−530.
Christensen, N.I., 1985. Measurements of dynamic properties of rock atvated temperatures and pressures. In Pincus, H.J., and Hoskins, E.R(Eds.), Measurements of Rock Properties at Elevated Pressures and Tem-peratures: Philadelphia (Am. Soc. for Testing and Materials), ASTMSTP 869:93−107.
Cloos, M., 1984. Landward-dipping reflectors in accretionary wedges: acdewatering conduits? Geology, 12:519−522.
Fisher, A., Zwart, G., and ODP Leg 156 Scientific Party, 1996. Relatbetween permeability and effective stress along a plate-boundary fBarbados accretionary complex. Geology, 24:307−310.
alcu-

VARIATIONS IN ULTRASONIC VELOCITY AND DENSITY
r
id
t
D
-
nl
ta
A.,ck-theg.
nkaiand
94.éc-
nts,ion-
ty at
.,re-
ntal
88.
Gieskes, J.M., Blanc, G., Vrolijk, P., Elderfield, H., and Barnes, R., 1990.Interstitial water chemistry—major constituents. In Moore, J.C., Mascle,A., et al., Proc. ODP, Sci. Results, 110: College Station, TX (Ocean Drill-ing Program), 155−178.
Hamilton, E.L., 1978. Sound velocity-density relations in sea-floor sements and rocks. J. Acoust. Soc. Am., 63:366−377.
Housen, B.A., Tobin, H.J., Labaume, P., Leitch, E.C., Maltman, A.J., aODP Leg 156 Shipboard Science Party, 1996. Strain decoupling acthe décollement of the Barbados accretionary prism. Geology, 24:127−130.
Hubbert, M.K., and Rubey, W.W., 1959. Role of fluid pressures in mechacas of overthrust faulting, Part 1. Mechanics of fluid-filled porous soland its application to overthrust faulting. Geol. Soc. Am. Bull., 70:115−166.
Karig, D.E., 1993. Reconsolidation tests and sonic velocity measuremenclay-rich sediments from the Nankai Trough. In Hill, I.A., Taira, A.,Firth, J.V., et al., Proc. ODP, Sci. Results, 131: College Station, TX(Ocean Drilling Program), 247−260.
Lerouiel, S., and Vaughan, P.R., 1990. The general and congruent effecstructure in natural soils and rocks. Geotechnique, 40:467−488.
MacKay, M.E., Moore, G.F., Cochrane, G.R., Moore, J.C., and Kulm, L.1992. Landward vergence and oblique structural trends in the Oremargin accretionary prism: implications and effect on fluid flow. EarthPlanet. Sci. Lett., 109:477−491.
Mascle, A., and Moore, J.C., 1990. ODP Leg 110: tectonic and hydrolosynthesis. In Moore, J.C., Mascle, A., et al., Proc. ODP, Sci. Results, 110:College Station, TX (Ocean Drilling Program), 409−422.
Mascle, A., Moore, J.C., et al., 1988. Proc. ODP, Init. Repts., 110: CollegeStation, TX (Ocean Drilling Program).
Moore, G.F., and Shipley. T.H., 1993. Character of the décollement inLeg 131 area, Nankai Trough. In Hill, I.A., Taira, A., Firth, J.V. et al.,Proc. ODP, Sci. Results, 131: College Station, TX (Ocean Drilling Program), 73−82.
Moore, G.F., Shipley, T., Karig, D., and Taira, A., 1990. Structural geomeat the toe of the Nankai accretionary prism from MCS and ESP dataJ.Geophys. Res., 95:8753−8765.
Moore, G.F., Zhao, Z., Shipley, T.H., Bangs, N., and Moore, J.C., 19Structural setting of the Leg 156 area, northern Barbados Ridge actionary prism. In Shipley, T.H., Ogawa, Y., Blum, P., et al., Proc. ODP,Init. Repts., 156: College Station, TX (Ocean Drilling Program), 13−27.
Moore, J.C., Brown, K.M., Horath, F., Cochrane, G., MacKay, M., aMoore, G., 1991. Plumbing accretionary prisms: effects of permeabivariations. Philos. Trans. R. Soc. London A, 335:275−288.
Moore, J.C., Moore, G.F., Cochrane, G.R., and Tobin, H.J., 1995a. Negapolarity seismic reflections along faults of the Oregon accretionprism: indicators of overpressuring. J. Geophys. Res., 100:12895−12906.
3UHYLRXV�&KDSWHU3UHYLRXV�&KDSWHU 7DEOH�RI�&7DEOH�RI�&
di-
ndoss
ni-s
s of
ts of
.,gon
gic
the
try.
95.cre-
dity
ive-ry
Moore, J.C., Shipley, T.H., Goldberg, D., Ogawa, Y., Filice, F., Fisher, Jurado, M.-J., Moore, G.F., Rabaute, A., Yin, H., Zwart, G., and Brumann, W., 1995b. Abnormal fluid pressures and fault zone dilation in Barbados accretionary prism: evidence from logging while drillinGeology, 23:605−608.
Moore, J.C., and Vrolijk, P., 1992. Fluids in accretionary prisms. Rev. Geo-phys., 30:113−135.
Morgan, J.K., and Karig, D.E., 1995. Décollement processes at the Naaccretionary margin, southeast Japan: propagation, deformation, dewatering. J. Geophys. Res., 100:15,221–15,231.
Shipboard Scientific Party, 1995. Site 948. In Shipley, T.H., Ogawa, Y.,Blum, P., et al., Proc. ODP, Init. Repts., 156: College Station, TX (OceanDrilling Program), 87−192.
Shipley, T.H., Moore, G.F., Bangs, N.L., Moore, J.C., and Stoffa, P.L., 19Seismically inferred dilatancy distribution, northern Barbados Ridge dollement: implications for fluid migration and fault strength. Geology,22:411−414.
Shipley, T.H., Ogawa, Y., Blum, P., et al., 1995. Proc. ODP, Init. Repts., 156:College Station, TX (Ocean Drilling Program).
Shipley, T.H., Stoffa, P.L., and Dean, D.F., 1990. Underthrust sedimefluid migration paths, and mud volcanoes associated with the accretary wedge off Costa Rica: Middle America trench. J. Geophys. Res.,95:8743−8752.
Taylor, E., and Leonard, J., 1990. Sediment consolidation and permeabilithe Barbados forearc. In Moore, J.C., Mascle, A.,et al., Proc. ODP, Sci.Results, 110:College Station, TX (Ocean Drilling Program), 289−308.
Tobin, H.J., Moore, J.C., MacKay, M.E., Orange, D.L., and Kulm, L.D1993. Fluid flow along a strike-slip fault at the toe of the Oregon acctionary prism: implications for the geometry of frontal accretion. Geol.Soc. Am. Bull., 105:569−582.
Tobin, H.J., Moore, J.C., and Moore, G.F., 1994. Fluid pressure in the frothrust of the Oregon accretionary prism: experimental constraints. Geol-ogy, 22: 979−982.
Westbrook, G.K., Ladd, J.W., Buhl, P., Bangs, N., and Tilley, G.J., 19Cross section of an accretionary wedge: Barbados Ridge complex. Geol-ogy, 16:631−635.
Date of initial receipt: 1 February 1996Date of acceptance: 8 July 1996Ms 156SR-018
135RQWHQWVRQWHQWV 1H[W�&KDSWHU1H[W�&KDSWHU