83. profile on the production of woven pp...
TRANSCRIPT
83. PROFILE ON THE PRODUCTION OF WOVEN
PP BAGS
83-1
TABLE OF CONTENTS
PAGE
I. SUMMARY 83-2
II. PRODUCT DESCRIPTION & APPLICATION 83-2
III. MARKET STUDY AND PLANT CAPACITY 83-3
A. MARKET STUDY 83-3
B. PLANT CAPACITY & PRODUCTION PROGRAM 83-9
IV. MATERIALS AND INPUTS 83-10
A. RAW & AUXILIARY MATERIALS 83-10
B. UTILITIES 83-11
V. TECHNOLOGY & ENGINEERING 83-11
A. TECHNOLOGY 83-11
B. ENGINEERING 83-12
VI. HUMAN RESOURCE & TRAINING REQUIREMENT 83-17
A. HUMAN RESOURCE REQUIREMENT 83-17
B. TRAINING REQUIREMENT 83-18
VII. FINANCIAL ANLYSIS 83-18
A. TOTAL INITIAL INVESTMENT COST 83-18
B. PRODUCTION COST 83-19
C. FINANCIAL EVALUATION 83-20
D. ECONOMIC SOCIAL BENEFITS 83-22

83-2
I. SUMMARY
This profile envisages the establishment of a plant for the production of woven bags with a
capacity of 12,000,000 bags per annum. Woven bags extensively used in packaging industry due
to their wide variety of usage, flexibility and strength.
The demand for woven bags is met through both local production and imports. The present
(2012) demand for woven bags is 188.73 million pieces or 16,609 tons. The demand for woven
bags is projected to reach 318,027,933 pieces or 27, 986 tons and 535,895,561 pieces or 47,159
tons by the year 2017 and 2022, respectively.
The principal raw materials required are polypropylene resin, ink and solvent which have to be
imported.
The total investment cost of the project including working capital is estimated at Birr 46.34
million. From the total investment cost, the highest share (Birr 23.21 million or 50.08%) is
accounted by fixed investment cost followed by initial working capital (19.02 million or 41.06%)
and pre operation cost (Birr 4.10 million or 8.63%). From the total investment cost, Birr 12.15
million or 26.23% is required in foreign currency.
The project is financially viable with an internal rate of return (IRR) of 17.79% and a net present
value (NPV) of Birr 21.48 million, discounted at 10%.
The project can create employment for 57 persons. The establishment of such factory will have a
foreign exchange saving effect to the country by substituting the current imports. The project
will also create backward linkage with plastic manufacturing sub sector and forward linkage with
the packaging and logistics sub sector and also generates other income for the Government.
II. PRODUCT DESCRIPTION AND APPLICATION
One of the growing applications of plastic materials is packing. Among the various types of
plastic materials polypropylene (PP) woven bags and sacks are extensively used in packaging
industry due to their wide variety of usage, flexibility and strength. Woven polypropylene bags
83-3
are specializing in packing and transporting bulk commodities. Due to strength, flexibility,
durability and lower cost, woven polypropylene bags are most popular products in industrial
package, which are widely used in packing grain, feeds, fertilizer, seeds, powders, sugar, salt,
powder, chemical in granulated form. The advantages of PP woven bag include:
Very affordable, Lower cost;
Flexible and high strength, persistent durability;
Can be printed on both sides;
Can be stored in an open area due to UV-stability, up to 6 months;
Water and dust proof design due to inside PE liners or laminated on the outside; hence,
packed materials are protected from outside humidity;
Twisted weave and anti-skid print to prevent slipping; and
Fully recycled.
As compared to jute and paper bags, the polypropylene (pp) bags have higher mechanical
strength, non- contaminant, excellent appearance, flexible to be manufactured at customers needs
(preferred color and texture), easy to print logos, symbols or writings, versatility of the product,
water proof, etc.
III. MARKET STUDY AND PLANT CAPACITY
A. MARKET STUDY
1. Past Supply and Present Demand
The country’s requirement of PP woven bags is met through both local production and imports.
The data source for locally manufactured products i.e. Central Statistical Agency’s “Report on
large and medium scale manufacturing and electricity industries survey” does not show the local
production volume of PP woven bags separately. Therefore, in order to estimate the trend in the
local production of PP woven bags an indirect approach i.e. based on raw material import is
employed.
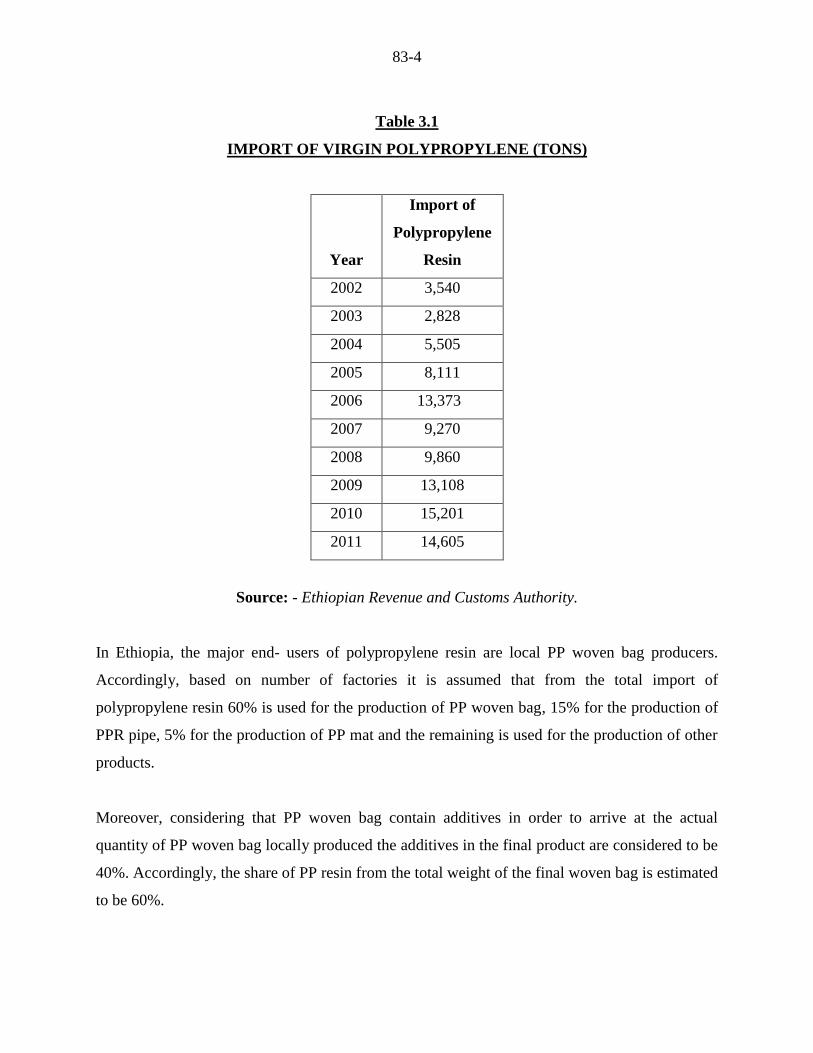
PP woven bags are produced from imported polypropylene resin. During the period 2002 – 2011,
on average the country has imported 9,548 tons of polypropylene resin. During the same period
import of the product has registered an average annual growth rate of 23% (see Table 3.1).
83-4
Table 3.1
IMPORT OF VIRGIN POLYPROPYLENE (TONS)
Year
Import of
Polypropylene
Resin
2002 3,540
2003 2,828
2004 5,505
2005 8,111
2006 13,373
2007 9,270
2008 9,860
2009 13,108
2010 15,201
2011 14,605
Source: - Ethiopian Revenue and Customs Authority.
In Ethiopia, the major end- users of polypropylene resin are local PP woven bag producers.
Accordingly, based on number of factories it is assumed that from the total import of
polypropylene resin 60% is used for the production of PP woven bag, 15% for the production of
PPR pipe, 5% for the production of PP mat and the remaining is used for the production of other
products.
Moreover, considering that PP woven bag contain additives in order to arrive at the actual
quantity of PP woven bag locally produced the additives in the final product are considered to be
40%. Accordingly, the share of PP resin from the total weight of the final woven bag is estimated
to be 60%.
83-5
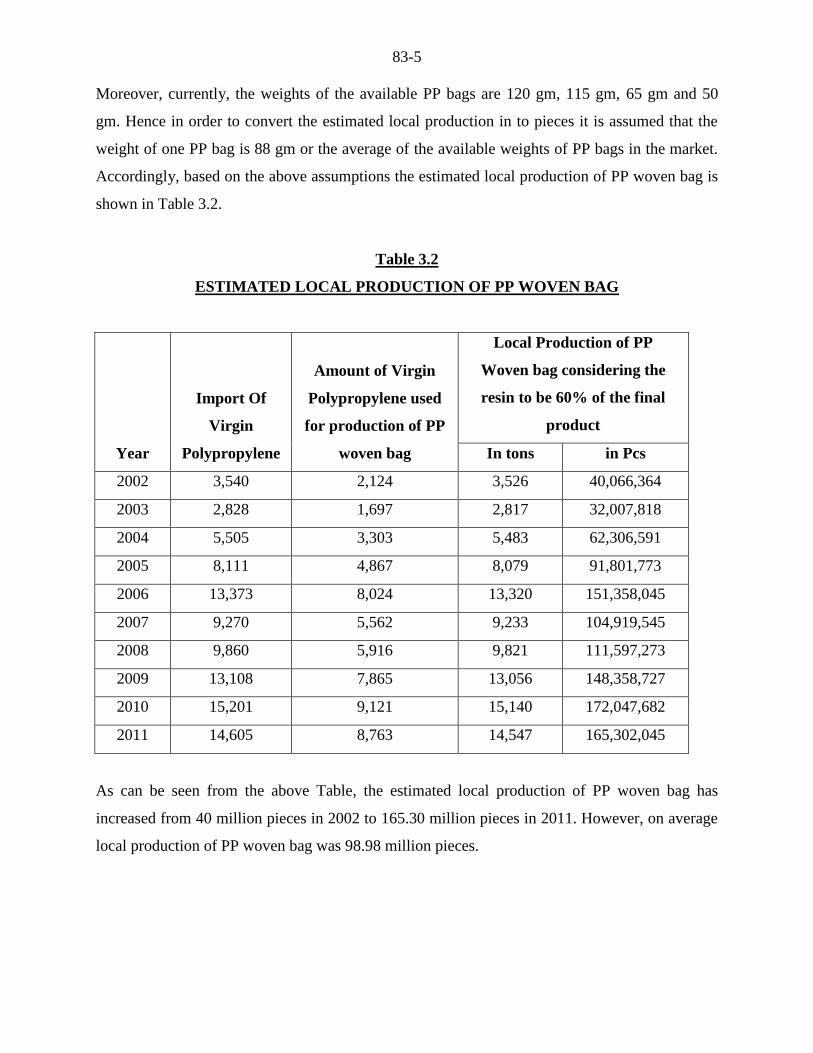
Moreover, currently, the weights of the available PP bags are 120 gm, 115 gm, 65 gm and 50
gm. Hence in order to convert the estimated local production in to pieces it is assumed that the
weight of one PP bag is 88 gm or the average of the available weights of PP bags in the market.
Accordingly, based on the above assumptions the estimated local production of PP woven bag is
shown in Table 3.2.
Table 3.2
ESTIMATED LOCAL PRODUCTION OF PP WOVEN BAG
Year
Import Of
Virgin
Polypropylene
Amount of Virgin
Polypropylene used
for production of PP
woven bag
Local Production of PP
Woven bag considering the
resin to be 60% of the final
product
In tons in Pcs
2002 3,540 2,124 3,526 40,066,364
2003 2,828 1,697 2,817 32,007,818
2004 5,505 3,303 5,483 62,306,591
2005 8,111 4,867 8,079 91,801,773
2006 13,373 8,024 13,320 151,358,045
2007 9,270 5,562 9,233 104,919,545
2008 9,860 5,916 9,821 111,597,273
2009 13,108 7,865 13,056 148,358,727
2010 15,201 9,121 15,140 172,047,682
2011 14,605 8,763 14,547 165,302,045
As can be seen from the above Table, the estimated local production of PP woven bag has
increased from 40 million pieces in 2002 to 165.30 million pieces in 2011. However, on average
local production of PP woven bag was 98.98 million pieces.
83-6
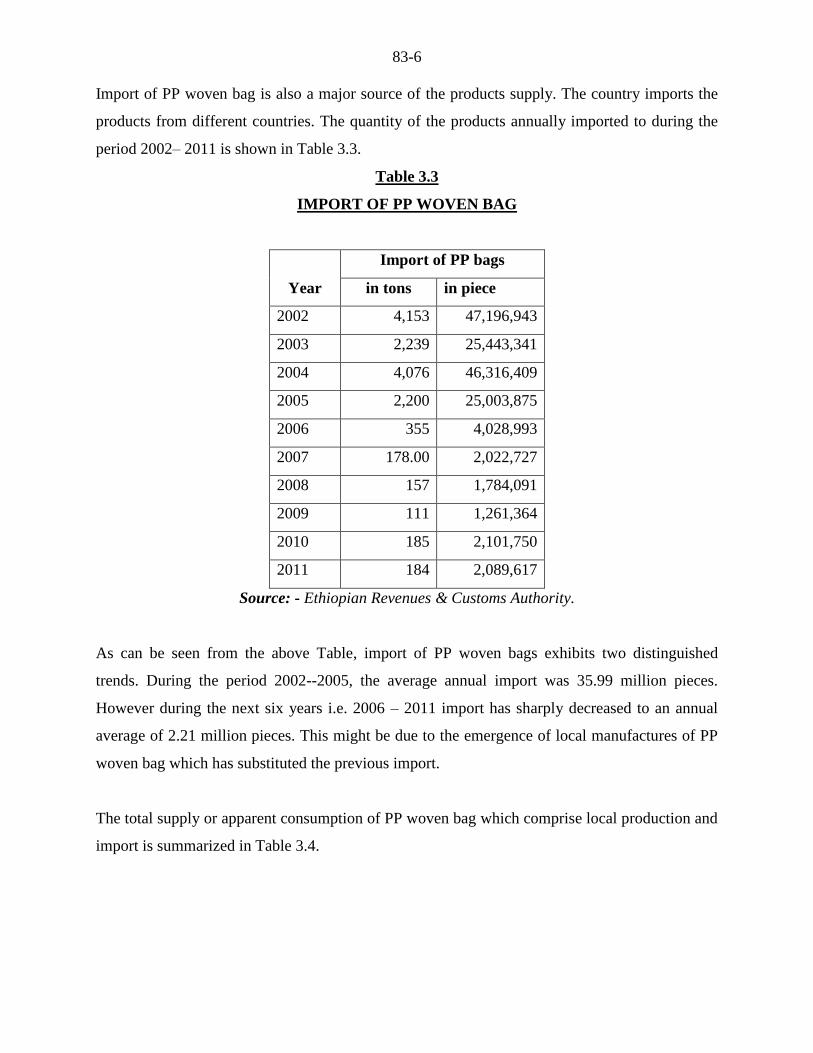
Import of PP woven bag is also a major source of the products supply. The country imports the
products from different countries. The quantity of the products annually imported to during the
period 2002– 2011 is shown in Table 3.3.
Table 3.3
IMPORT OF PP WOVEN BAG
Year
Import of PP bags
in tons in piece
2002 4,153 47,196,943
2003 2,239 25,443,341
2004 4,076 46,316,409
2005 2,200 25,003,875
2006 355 4,028,993
2007 178.00 2,022,727
2008 157 1,784,091
2009 111 1,261,364
2010 185 2,101,750
2011 184 2,089,617
Source: - Ethiopian Revenues & Customs Authority.
As can be seen from the above Table, import of PP woven bags exhibits two distinguished
trends. During the period 2002--2005, the average annual import was 35.99 million pieces.
However during the next six years i.e. 2006 – 2011 import has sharply decreased to an annual
average of 2.21 million pieces. This might be due to the emergence of local manufactures of PP
woven bag which has substituted the previous import.
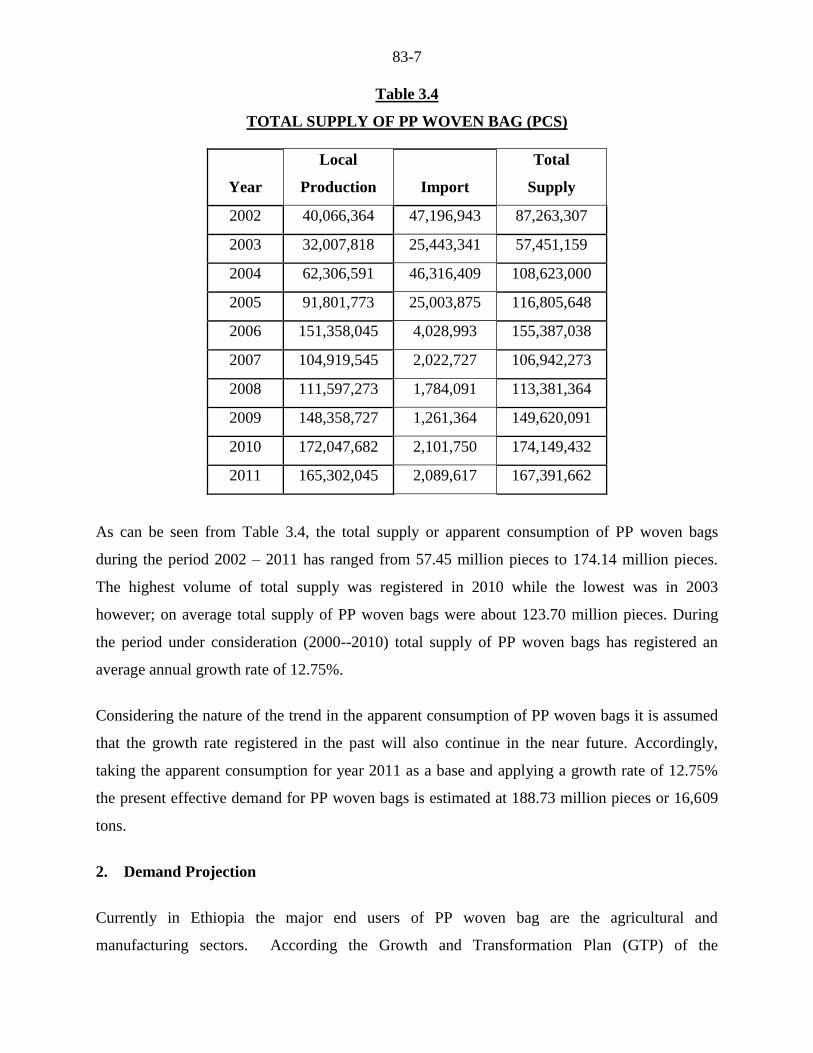
The total supply or apparent consumption of PP woven bag which comprise local production and
import is summarized in Table 3.4.
83-7
Table 3.4
TOTAL SUPPLY OF PP WOVEN BAG (PCS)
Year
Local
Production Import
Total
Supply
2002 40,066,364 47,196,943 87,263,307
2003 32,007,818 25,443,341 57,451,159
2004 62,306,591 46,316,409 108,623,000
2005 91,801,773 25,003,875 116,805,648
2006 151,358,045 4,028,993 155,387,038
2007 104,919,545 2,022,727 106,942,273
2008 111,597,273 1,784,091 113,381,364
2009 148,358,727 1,261,364 149,620,091
2010 172,047,682 2,101,750 174,149,432
2011 165,302,045 2,089,617 167,391,662
As can be seen from Table 3.4, the total supply or apparent consumption of PP woven bags
during the period 2002 – 2011 has ranged from 57.45 million pieces to 174.14 million pieces.
The highest volume of total supply was registered in 2010 while the lowest was in 2003
however; on average total supply of PP woven bags were about 123.70 million pieces. During
the period under consideration (2000--2010) total supply of PP woven bags has registered an
average annual growth rate of 12.75%.
Considering the nature of the trend in the apparent consumption of PP woven bags it is assumed
that the growth rate registered in the past will also continue in the near future. Accordingly,
taking the apparent consumption for year 2011 as a base and applying a growth rate of 12.75%
the present effective demand for PP woven bags is estimated at 188.73 million pieces or 16,609
tons.
2. Demand Projection
Currently in Ethiopia the major end users of PP woven bag are the agricultural and
manufacturing sectors. According the Growth and Transformation Plan (GTP) of the
83-8
government the agriculture and industrial sectors of the country are expected to register a growth
rate of 8.6% and 20%, respectively.
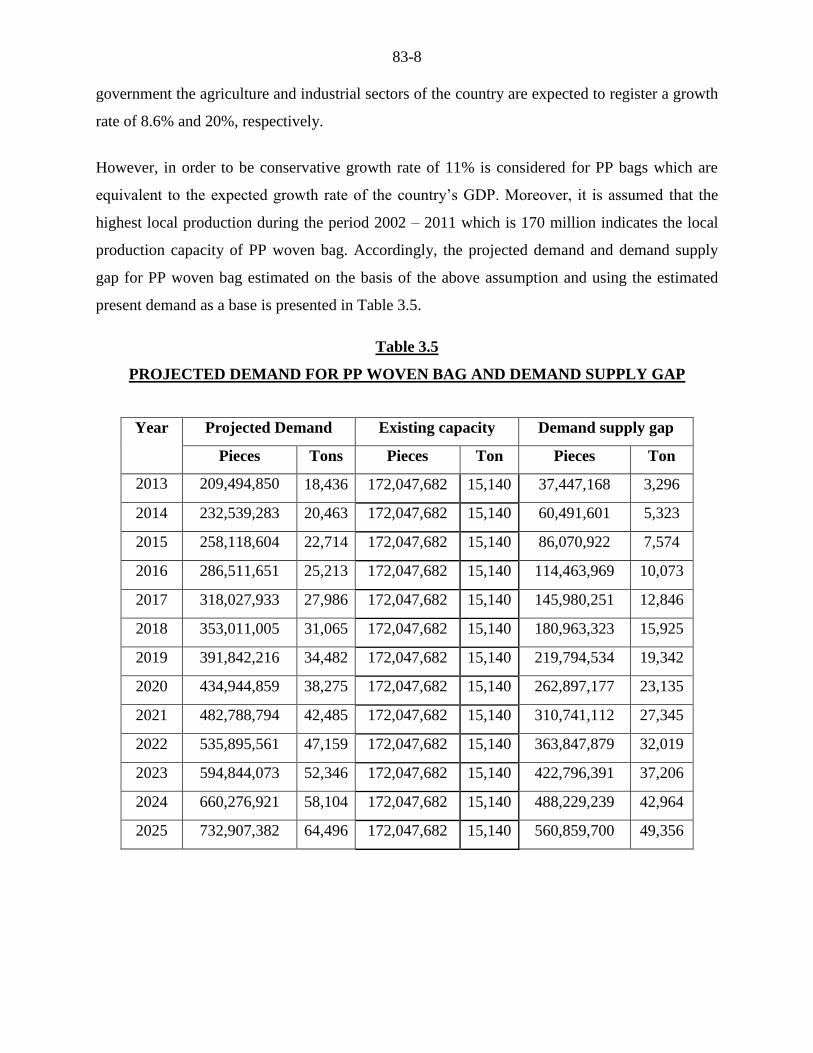
However, in order to be conservative growth rate of 11% is considered for PP bags which are
equivalent to the expected growth rate of the country’s GDP. Moreover, it is assumed that the
highest local production during the period 2002 – 2011 which is 170 million indicates the local
production capacity of PP woven bag. Accordingly, the projected demand and demand supply
gap for PP woven bag estimated on the basis of the above assumption and using the estimated
present demand as a base is presented in Table 3.5.
Table 3.5
PROJECTED DEMAND FOR PP WOVEN BAG AND DEMAND SUPPLY GAP
Year Projected Demand Existing capacity Demand supply gap
Pieces Tons Pieces Ton Pieces Ton
2013 209,494,850 18,436 172,047,682 15,140 37,447,168 3,296
2014 232,539,283 20,463 172,047,682 15,140 60,491,601 5,323
2015 258,118,604 22,714 172,047,682 15,140 86,070,922 7,574
2016 286,511,651 25,213 172,047,682 15,140 114,463,969 10,073
2017 318,027,933 27,986 172,047,682 15,140 145,980,251 12,846
2018 353,011,005 31,065 172,047,682 15,140 180,963,323 15,925
2019 391,842,216 34,482 172,047,682 15,140 219,794,534 19,342
2020 434,944,859 38,275 172,047,682 15,140 262,897,177 23,135
2021 482,788,794 42,485 172,047,682 15,140 310,741,112 27,345
2022 535,895,561 47,159 172,047,682 15,140 363,847,879 32,019
2023 594,844,073 52,346 172,047,682 15,140 422,796,391 37,206
2024 660,276,921 58,104 172,047,682 15,140 488,229,239 42,964
2025 732,907,382 64,496 172,047,682 15,140 560,859,700 49,356
83-9
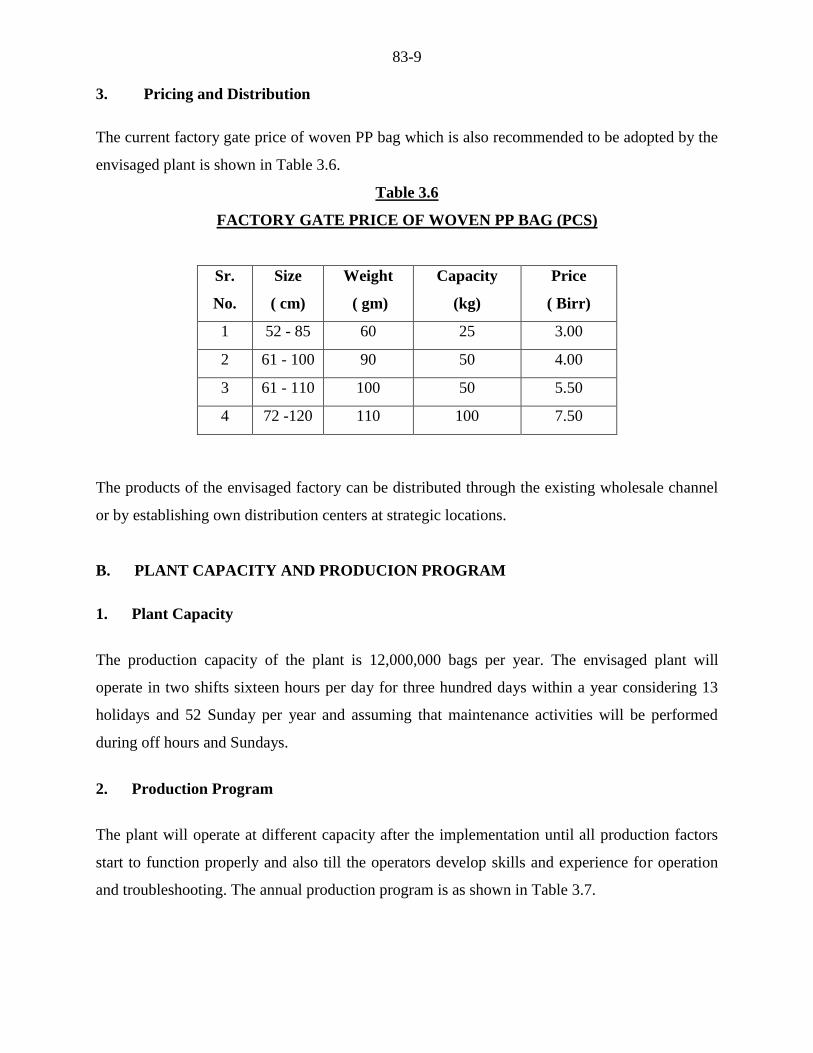
3. Pricing and Distribution
The current factory gate price of woven PP bag which is also recommended to be adopted by the
envisaged plant is shown in Table 3.6.
Table 3.6
FACTORY GATE PRICE OF WOVEN PP BAG (PCS)
Sr.
No.
Size
( cm)
Weight
( gm)
Capacity
(kg)
Price
( Birr)
1 52 - 85 60 25 3.00
2 61 - 100 90 50 4.00
3 61 - 110 100 50 5.50
4 72 -120 110 100 7.50
The products of the envisaged factory can be distributed through the existing wholesale channel
or by establishing own distribution centers at strategic locations.
B. PLANT CAPACITY AND PRODUCION PROGRAM
1. Plant Capacity
The production capacity of the plant is 12,000,000 bags per year. The envisaged plant will
operate in two shifts sixteen hours per day for three hundred days within a year considering 13
holidays and 52 Sunday per year and assuming that maintenance activities will be performed
during off hours and Sundays.
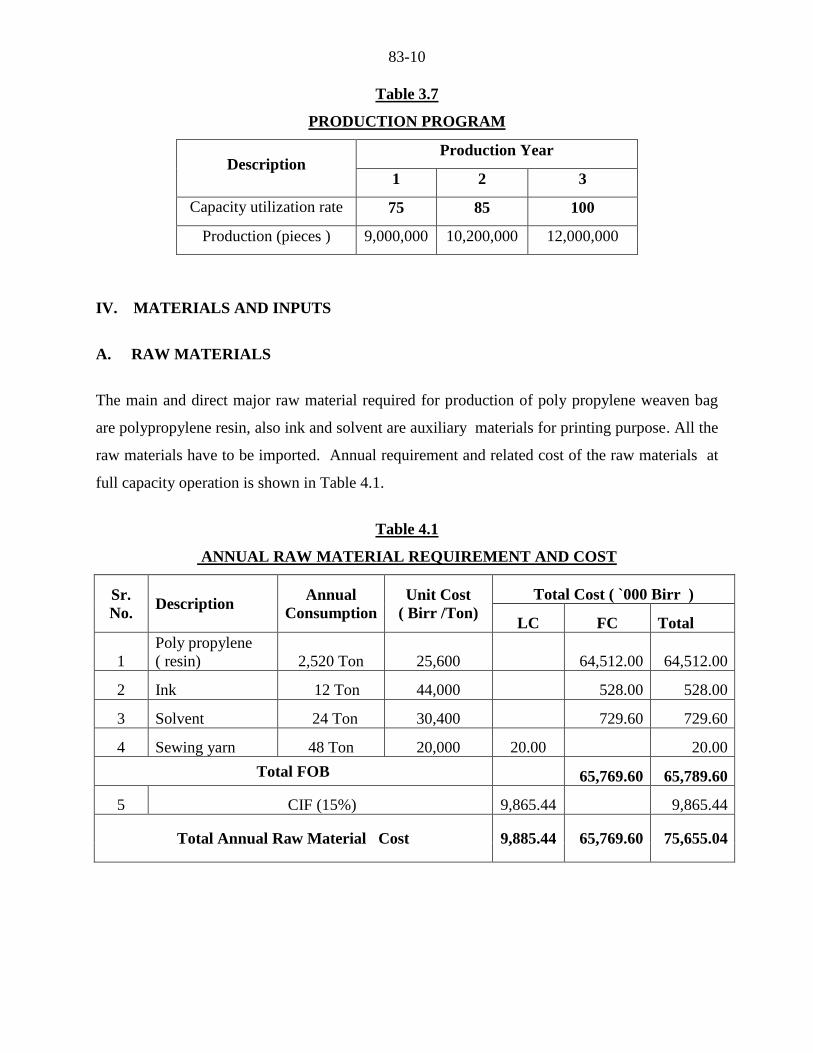
2. Production Program
The plant will operate at different capacity after the implementation until all production factors
start to function properly and also till the operators develop skills and experience for operation
and troubleshooting. The annual production program is as shown in Table 3.7.
83-10
Table 3.7
PRODUCTION PROGRAM
Description Production Year
1 2 3
Capacity utilization rate
(%)
75 85 100
Production (pieces ) 9,000,000 10,200,000 12,000,000
IV. MATERIALS AND INPUTS
A. RAW MATERIALS
The main and direct major raw material required for production of poly propylene weaven bag
are polypropylene resin, also ink and solvent are auxiliary materials for printing purpose. All the
raw materials have to be imported. Annual requirement and related cost of the raw materials at
full capacity operation is shown in Table 4.1.
Table 4.1
ANNUAL RAW MATERIAL REQUIREMENT AND COST
Sr.
No. Description
Annual
Consumption
Unit Cost
( Birr /Ton)
Total Cost ( `000 Birr )
LC FC Total
1
Poly propylene
( resin) 2,520 Ton 25,600 64,512.00 64,512.00
2 Ink 12 Ton 44,000 528.00 528.00
3 Solvent 24 Ton 30,400 729.60 729.60
4 Sewing yarn 48 Ton 20,000 20.00 20.00
Total FOB 65,769.60 65,789.60
5 CIF (15%) 9,865.44 9,865.44
Total Annual Raw Material Cost 9,885.44 65,769.60 75,655.04
83-11
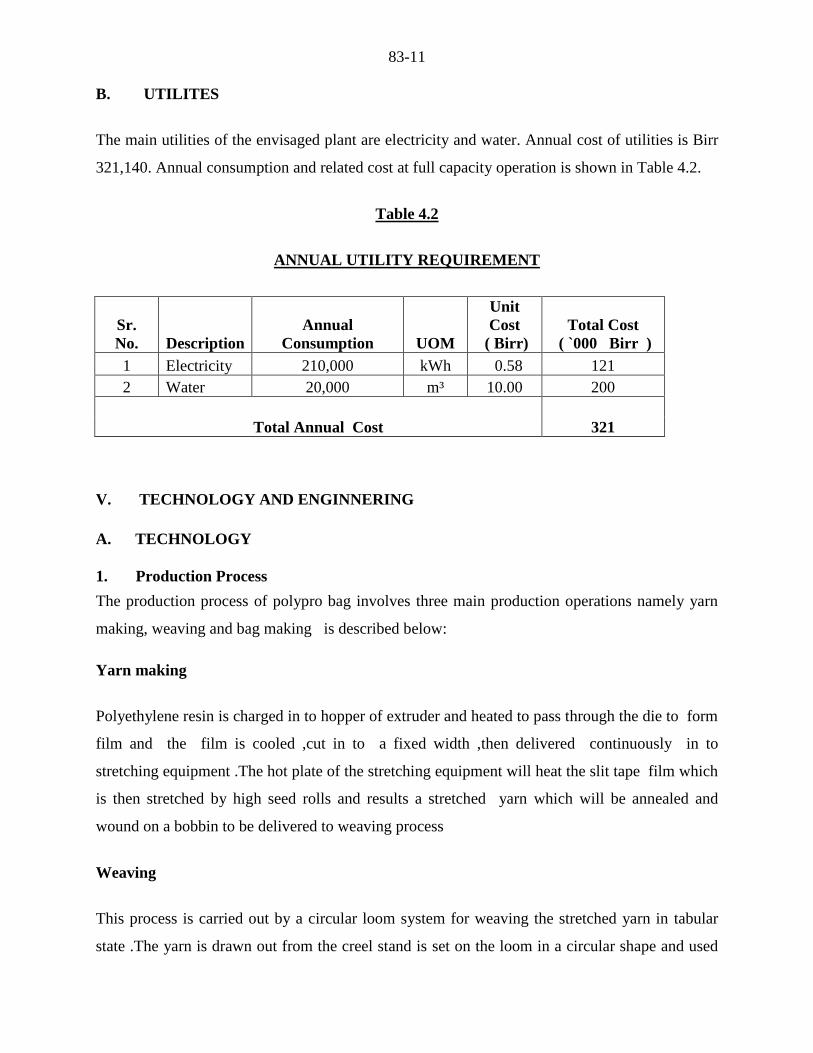
B. UTILITES
The main utilities of the envisaged plant are electricity and water. Annual cost of utilities is Birr
321,140. Annual consumption and related cost at full capacity operation is shown in Table 4.2.
Table 4.2
ANNUAL UTILITY REQUIREMENT
Sr.
No. Description
Annual
Consumption UOM
Unit
Cost
( Birr)
Total Cost
( `000 Birr )
1 Electricity 210,000 kWh 0.58 121
2 Water 20,000 m³ 10.00 200
Total Annual Cost 321
V. TECHNOLOGY AND ENGINNERING
A. TECHNOLOGY
1. Production Process
The production process of polypro bag involves three main production operations namely yarn
making, weaving and bag making is described below:
Yarn making
Polyethylene resin is charged in to hopper of extruder and heated to pass through the die to form
film and the film is cooled ,cut in to a fixed width ,then delivered continuously in to
stretching equipment .The hot plate of the stretching equipment will heat the slit tape film which
is then stretched by high seed rolls and results a stretched yarn which will be annealed and
wound on a bobbin to be delivered to weaving process
Weaving
This process is carried out by a circular loom system for weaving the stretched yarn in tabular
state .The yarn is drawn out from the creel stand is set on the loom in a circular shape and used
83-12
as a warp .The pick is set on four shuttles which are inside the loom and when the loom is
operated the shuttle rotates in a circular shape which results the pick to move through the warp in
a circular shape to effect weaving
Bag making
This is the last stage of the production process where the woven yarn is printed, cut to length
and converted to bag using cutters, printers and sewing machine in the process
2. Environmental Effect
The envisaged plant is a manufacturing plant with no chemical or any hazardous waste to the
surrounding environment and process scrapes and wastes will be sold to surrounding market for
different application so that there will not be additional investment for environmental protection
B. ENGINNERING
1. Machinery and Equipment
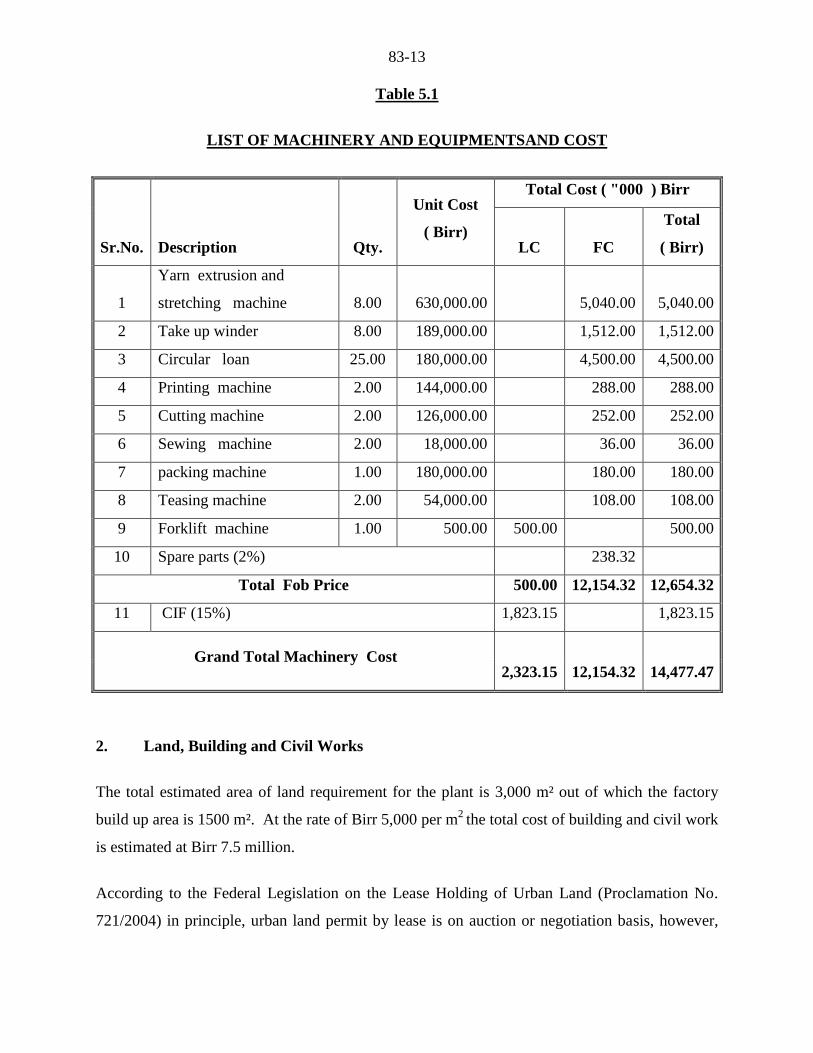
Total cost of machinery and equipment is estimated at Birr 14.48 million out of which Birr
12.154 million is required in foreign currency. For details see Table 5.1.
83-13
Table 5.1
LIST OF MACHINERY AND EQUIPMENTSAND COST
Sr.No. Description Qty.
Unit Cost
( Birr)
Total Cost ( "000 ) Birr
LC FC
Total
( Birr)
1
Yarn extrusion and
stretching machine 8.00 630,000.00 5,040.00 5,040.00
2 Take up winder 8.00 189,000.00 1,512.00 1,512.00
3 Circular loan 25.00 180,000.00 4,500.00 4,500.00
4 Printing machine 2.00 144,000.00 288.00 288.00
5 Cutting machine 2.00 126,000.00 252.00 252.00
6 Sewing machine 2.00 18,000.00 36.00 36.00
7 packing machine 1.00 180,000.00 180.00 180.00
8 Teasing machine 2.00 54,000.00 108.00 108.00
9 Forklift machine 1.00 500.00 500.00 500.00
10 Spare parts (2%) 238.32
Total Fob Price 500.00 12,154.32 12,654.32
11 CIF (15%) 1,823.15 1,823.15
Grand Total Machinery Cost 2,323.15 12,154.32 14,477.47
2. Land, Building and Civil Works
The total estimated area of land requirement for the plant is 3,000 m² out of which the factory
build up area is 1500 m². At the rate of Birr 5,000 per m2
the total cost of building and civil work
is estimated at Birr 7.5 million.
According to the Federal Legislation on the Lease Holding of Urban Land (Proclamation No.
721/2004) in principle, urban land permit by lease is on auction or negotiation basis, however,

83-14
the time and condition of applying the proclamation shall be determined by the concerned
regional or city government depending on the level of development.
The legislation has also set the maximum on lease period and the payment of lease prices. The
lease period ranges from 99 years for education, cultural research health, sport, NGO , religious
and residential area to 80 years for industry and 70 years for trade while the lease payment
period ranges from 10 years to 60 years based on the towns grade and type of investment.
Moreover, advance payment of lease based on the type of investment ranges from 5% to
10%.The lease price is payable after the grace period annually. For those that pay the entire
amount of the lease will receive 0.5% discount from the total lease value and those that pay in
installments will be charged interest based on the prevailing interest rate of banks. Moreover,
based on the type of investment, two to seven years grace period shall also be provided.
However, the Federal Legislation on the Lease Holding of Urban Land apart from setting the
maximum has conferred on regional and city governments the power to issue regulations on the
exact terms based on the development level of each region.
In Addis Ababa, the City’s Land Administration and Development Authority is directly
responsible in dealing with matters concerning land. However, regarding the manufacturing
sector, industrial zone preparation is one of the strategic intervention measures adopted by the
City Administration for the promotion of the sector and all manufacturing projects are assumed
to be located in the developed industrial zones.
Regarding land allocation of industrial zones if the land requirement of the project is below
5,000 m2
the land lease request is evaluated and decided upon by the Industrial Zone
Development and Coordination Committee of the City’s Investment Authority. However, if the
land request is above 5,000 m2, the request is evaluated by the City’s Investment Authority and
passed with recommendation to the Land Development and Administration Authority for
decision, while the lease price is the same for both cases.
Moreover, the Addis Ababa City Administration has recently adopted a new land lease floor
price for plots in the city. The new prices will be used as a benchmark for plots that are going to
83-15
be auctioned by the city government or transferred under the new “Urban Lands Lease Holding
Proclamation.”
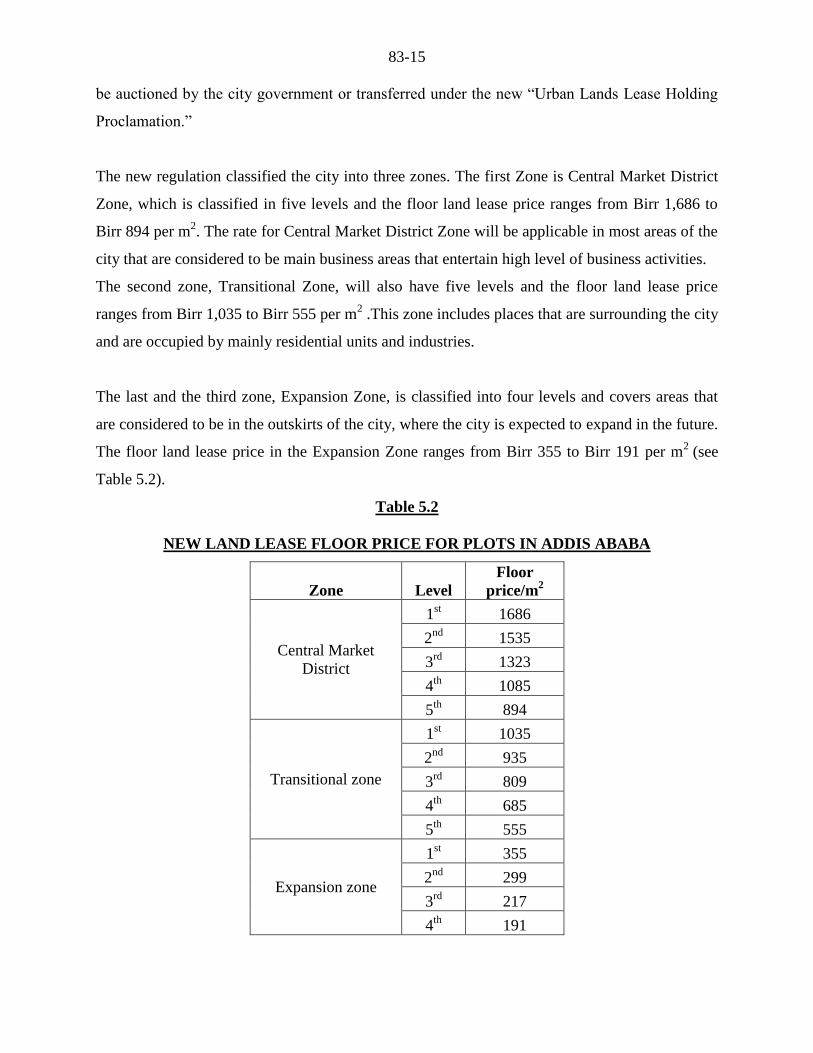
The new regulation classified the city into three zones. The first Zone is Central Market District
Zone, which is classified in five levels and the floor land lease price ranges from Birr 1,686 to
Birr 894 per m2. The rate for Central Market District Zone will be applicable in most areas of the
city that are considered to be main business areas that entertain high level of business activities.
The second zone, Transitional Zone, will also have five levels and the floor land lease price
ranges from Birr 1,035 to Birr 555 per m2 .This zone includes places that are surrounding the city
and are occupied by mainly residential units and industries.
The last and the third zone, Expansion Zone, is classified into four levels and covers areas that
are considered to be in the outskirts of the city, where the city is expected to expand in the future.
The floor land lease price in the Expansion Zone ranges from Birr 355 to Birr 191 per m2
(see
Table 5.2).
Table 5.2
NEW LAND LEASE FLOOR PRICE FOR PLOTS IN ADDIS ABABA
Zone Level
Floor
price/m2
Central Market
District
1st 1686
2nd
1535
3rd
1323
4th
1085
5th
894
Transitional zone
1st 1035
2nd
935
3rd
809
4th
685
5th
555
Expansion zone
1st 355
2nd
299
3rd
217
4th
191
83-16
Accordingly, in order to estimate the land lease cost of the project profiles it is assumed that all
new manufacturing projects will be located in industrial zones located in expansion zones.
Therefore, for the profile a land lease rate of Birr 266 per m2
which is equivalent to the average
floor price of plots located in expansion zone is adopted.
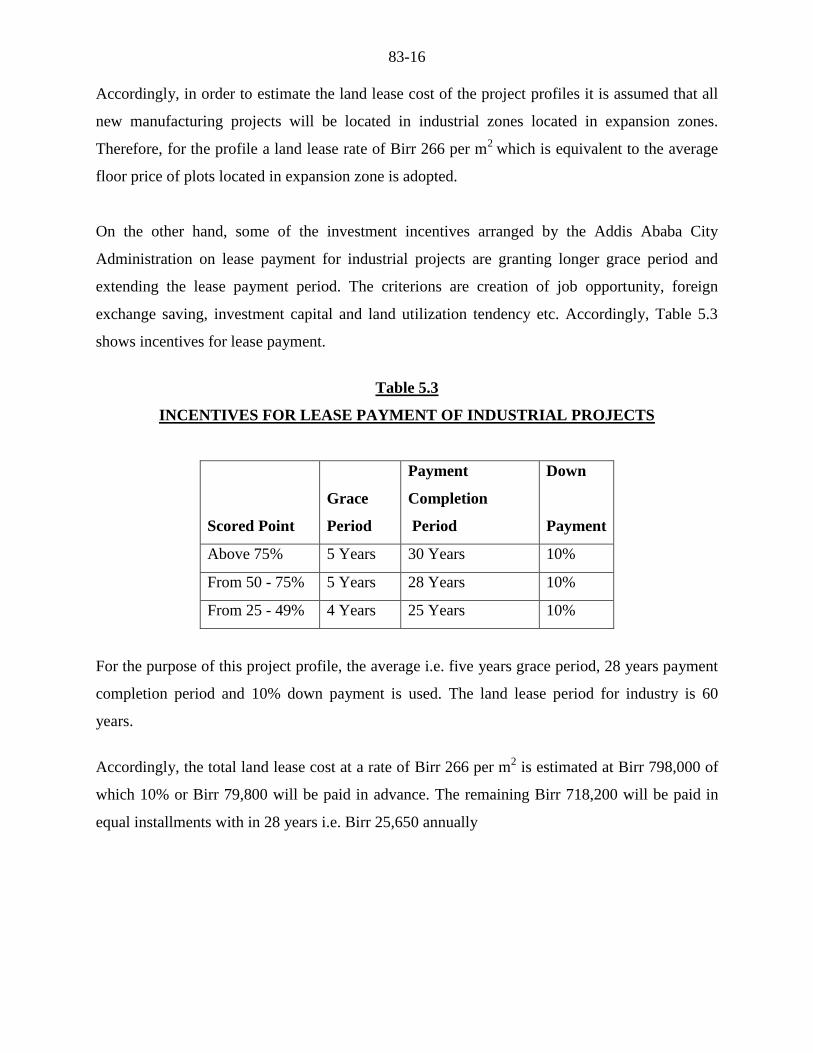
On the other hand, some of the investment incentives arranged by the Addis Ababa City
Administration on lease payment for industrial projects are granting longer grace period and
extending the lease payment period. The criterions are creation of job opportunity, foreign
exchange saving, investment capital and land utilization tendency etc. Accordingly, Table 5.3
shows incentives for lease payment.
Table 5.3
INCENTIVES FOR LEASE PAYMENT OF INDUSTRIAL PROJECTS
Scored Point
Grace
Period
Payment
Completion
Period
Down
Payment
Above 75% 5 Years 30 Years 10%
From 50 - 75% 5 Years 28 Years 10%
From 25 - 49% 4 Years 25 Years 10%
For the purpose of this project profile, the average i.e. five years grace period, 28 years payment
completion period and 10% down payment is used. The land lease period for industry is 60
years.
Accordingly, the total land lease cost at a rate of Birr 266 per m2 is estimated at Birr 798,000 of
which 10% or Birr 79,800 will be paid in advance. The remaining Birr 718,200 will be paid in
equal installments with in 28 years i.e. Birr 25,650 annually
83-17
VI. HUMANRESOURCE AND TRAINING REQUIREMENTS
A. HUMANRESOURCE REQUREMENT
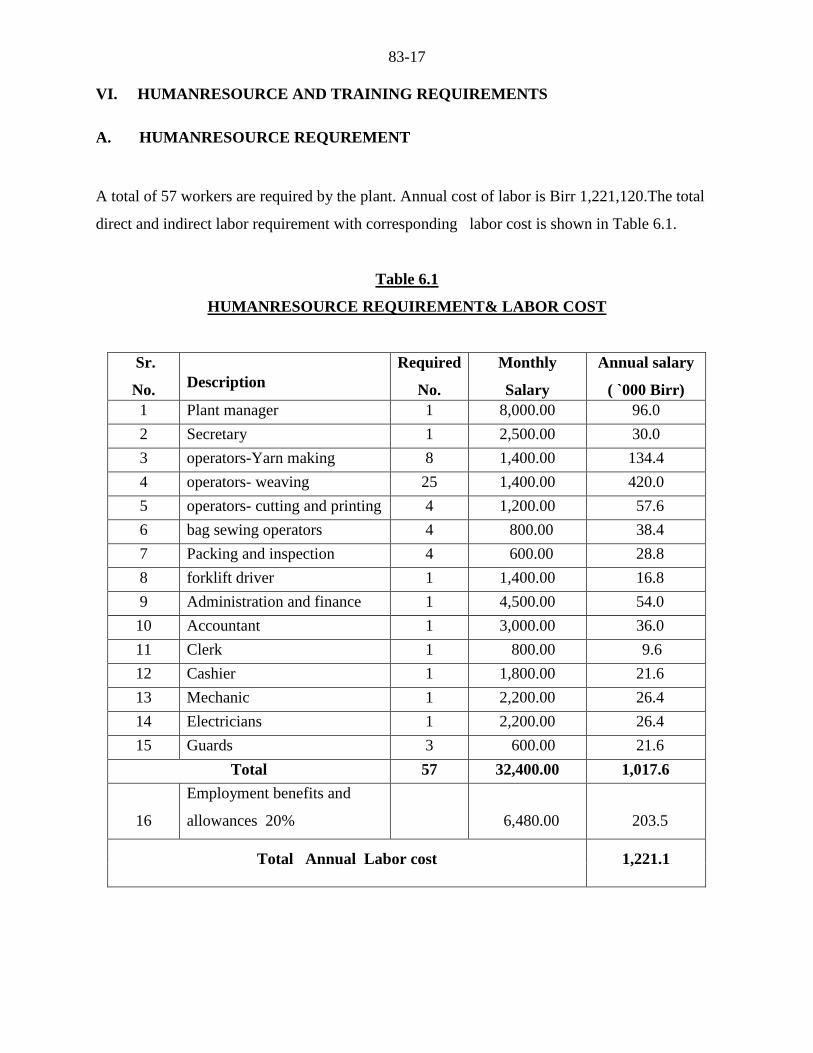
A total of 57 workers are required by the plant. Annual cost of labor is Birr 1,221,120.The total
direct and indirect labor requirement with corresponding labor cost is shown in Table 6.1.
Table 6.1
HUMANRESOURCE REQUIREMENT& LABOR COST
Sr.
No. Description
Required
No.
Monthly
Salary
( Birr)
Annual salary
( `000 Birr)
1 Plant manager 1 8,000.00 96.0
2 Secretary 1 2,500.00 30.0
3 operators-Yarn making 8 1,400.00 134.4
4 operators- weaving 25 1,400.00 420.0
5 operators- cutting and printing 4 1,200.00 57.6
6 bag sewing operators 4 800.00 38.4
7 Packing and inspection 4 600.00 28.8
8 forklift driver 1 1,400.00 16.8
9 Administration and finance 1 4,500.00 54.0
10 Accountant 1 3,000.00 36.0
11 Clerk 1 800.00 9.6
12 Cashier 1 1,800.00 21.6
13 Mechanic 1 2,200.00 26.4
14 Electricians 1 2,200.00 26.4
15 Guards 3 600.00 21.6
Total 57 32,400.00 1,017.6
16
Employment benefits and
allowances 20% 6,480.00 203.5
Total Annual Labor cost 1,221.1
83-18
B. TRAINING REQUIREMENT
Since the complication of the production technology is very low ,on -job training can be arranged
by hiring both for the maintenance workers and operators before machinery commissioning and
make them involved both at installation and commissioning stage of the plant with a total
estimated on job training cost of Birr 150,000
VII. FINANCIAL ANALYSIS
The financial analysis of the woven bags project is based on the data presented in the previous
chapters and the following assumptions:-
Construction period 1 year
Source of finance 30 % equity & 70 % loan
Tax holidays 3 years
Bank interest 10%
Discount cash flow 10%
Accounts receivable 30 days
Raw material local 30 days
Raw material imported 120 days
Work in progress 1 day
Finished products 30 days
Cash in hand 5 days
Accounts payable 30 days
Repair and maintenance 5% of machinery cost
A. TOTAL INITIAL INVESTMENT COST
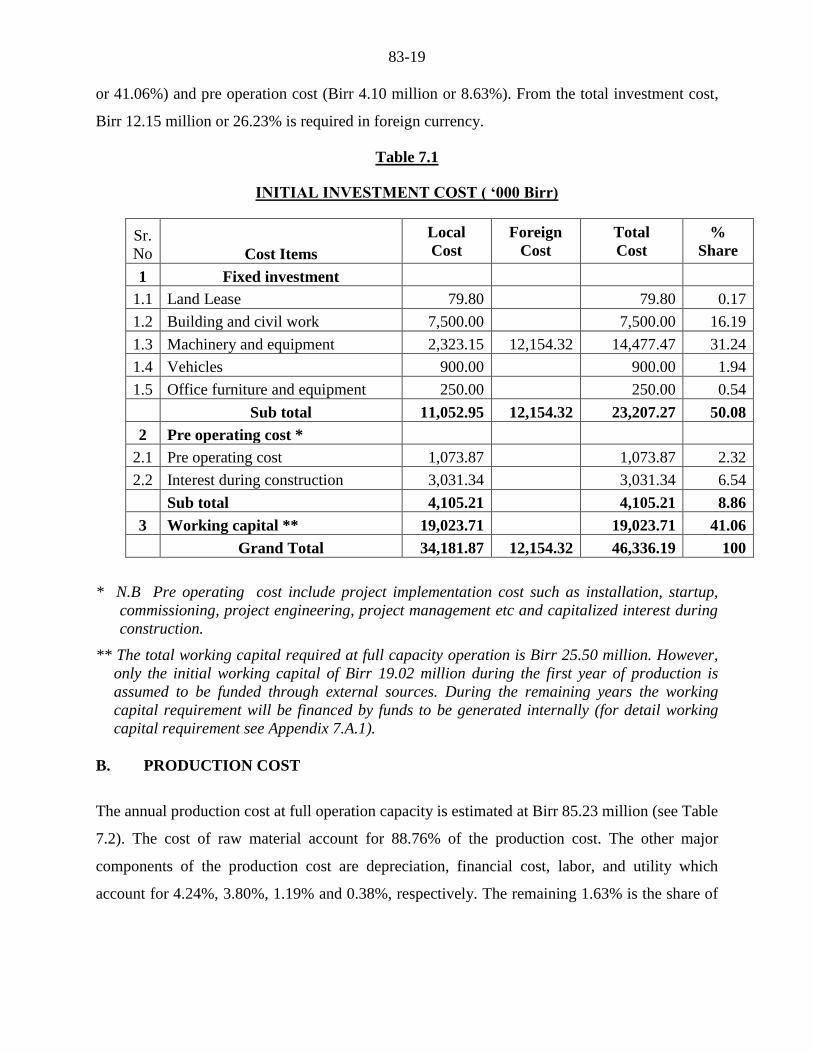
The total investment cost of the project including working capital is estimated at Birr 46.34
million (see Table 7.1). From the total investment cost, the highest share (Birr 23.21 million or
50.08%) is accounted by fixed investment cost followed by initial working capital (19.02 million
83-19
or 41.06%) and pre operation cost (Birr 4.10 million or 8.63%). From the total investment cost,
Birr 12.15 million or 26.23% is required in foreign currency.
Table 7.1
INITIAL INVESTMENT COST ( ‘000 Birr)
Sr.
No Cost Items
Local
Cost
Foreign
Cost
Total
Cost
%
Share
1 Fixed investment
1.1 Land Lease 79.80 79.80 0.17
1.2 Building and civil work 7,500.00 7,500.00 16.19
1.3 Machinery and equipment 2,323.15 12,154.32 14,477.47 31.24
1.4 Vehicles 900.00 900.00 1.94
1.5 Office furniture and equipment 250.00 250.00 0.54
Sub total 11,052.95 12,154.32 23,207.27 50.08
2 Pre operating cost *
2.1 Pre operating cost 1,073.87 1,073.87 2.32
2.2 Interest during construction 3,031.34 3,031.34 6.54
Sub total 4,105.21 4,105.21 8.86
3 Working capital ** 19,023.71 19,023.71 41.06
Grand Total 34,181.87 12,154.32 46,336.19 100
* N.B Pre operating cost include project implementation cost such as installation, startup,
commissioning, project engineering, project management etc and capitalized interest during
construction.
** The total working capital required at full capacity operation is Birr 25.50 million. However,
only the initial working capital of Birr 19.02 million during the first year of production is
assumed to be funded through external sources. During the remaining years the working
capital requirement will be financed by funds to be generated internally (for detail working
capital requirement see Appendix 7.A.1).
B. PRODUCTION COST
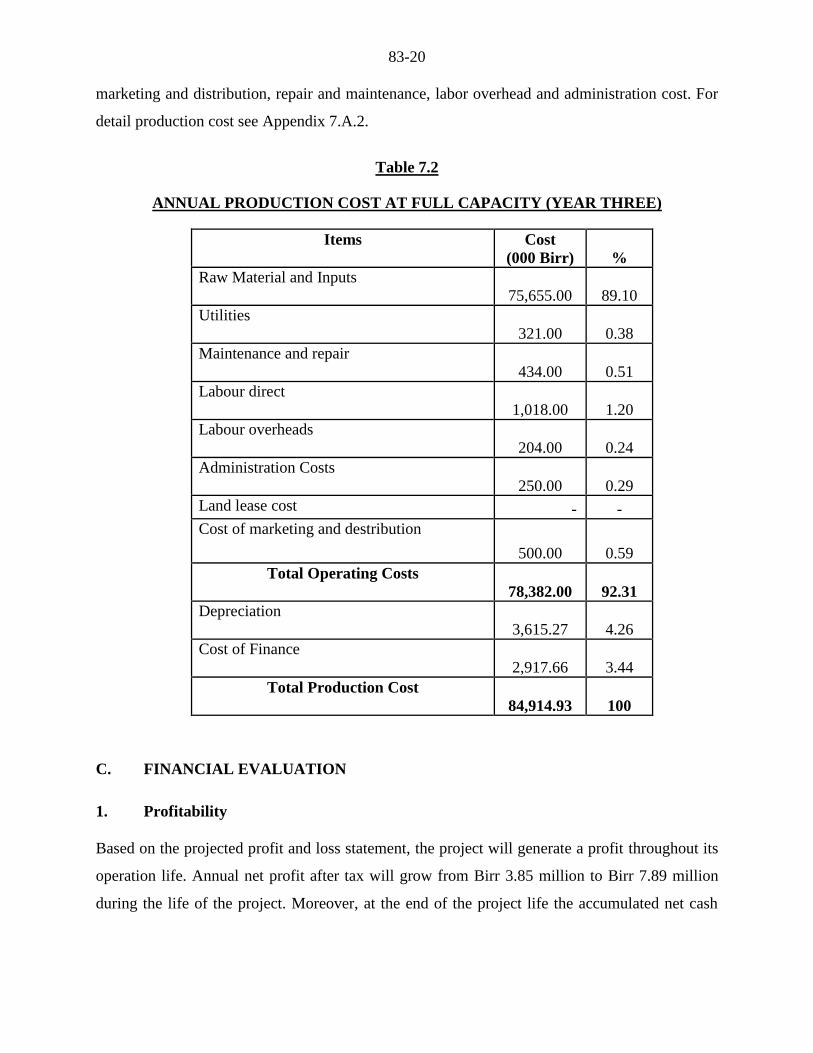
The annual production cost at full operation capacity is estimated at Birr 85.23 million (see Table
7.2). The cost of raw material account for 88.76% of the production cost. The other major
components of the production cost are depreciation, financial cost, labor, and utility which
account for 4.24%, 3.80%, 1.19% and 0.38%, respectively. The remaining 1.63% is the share of
83-20
marketing and distribution, repair and maintenance, labor overhead and administration cost. For
detail production cost see Appendix 7.A.2.
Table 7.2
ANNUAL PRODUCTION COST AT FULL CAPACITY (YEAR THREE)
Items Cost
(000 Birr) %
Raw Material and Inputs
75,655.00 89.10
Utilities
321.00 0.38
Maintenance and repair
434.00 0.51
Labour direct
1,018.00 1.20
Labour overheads
204.00 0.24
Administration Costs
250.00 0.29
Land lease cost - -
Cost of marketing and destribution
500.00 0.59
Total Operating Costs
78,382.00 92.31
Depreciation
3,615.27 4.26
Cost of Finance
2,917.66 3.44
Total Production Cost
84,914.93 100
C. FINANCIAL EVALUATION
1. Profitability
Based on the projected profit and loss statement, the project will generate a profit throughout its
operation life. Annual net profit after tax will grow from Birr 3.85 million to Birr 7.89 million
during the life of the project. Moreover, at the end of the project life the accumulated net cash
83-21
flow amounts to Birr 70.39 million. For profit and loss statement and cash flow projection see
Appendix 7.A.3 and 7.A.4, respectively.
2. Ratios
In financial analysis, financial ratios and efficiency ratios are used as an index or yardstick for
evaluating the financial position of a firm. It is also an indicator for the strength and weakness of
the firm or a project. Using the year-end balance sheet figures and other relevant data, the most
important ratios such as return on sales which is computed by dividing net income by revenue,
return on assets (operating income divided by assets), return on equity (net profit divided by
equity) and return on total investment (net profit plus interest divided by total investment) has
been carried out over the period of the project life and all the results are found to be satisfactory.
3. Break-even Analysis
The break-even analysis establishes a relationship between operation costs and revenues. It
indicates the level at which costs and revenue are in equilibrium. To this end, the break-even
point for capacity utilization and sales value estimated by using income statement projection are
computed as followed.
Break- Even Sales Value = Fixed Cost + Financial Cost = Birr 37,800,000
Variable Margin ratio (%)
Break -Even Capacity utilization = Break -even Sales Value X 100 = 33.96 %
Sales revenue
4. Pay-back Period
The pay -back period, also called pay – off period is defined as the period required for recovering
the original investment outlay through the accumulated net cash flows earned by the project.
83-22
Accordingly, based on the projected cash flow it is estimated that the project’s initial investment
will be fully recovered within 7 years.
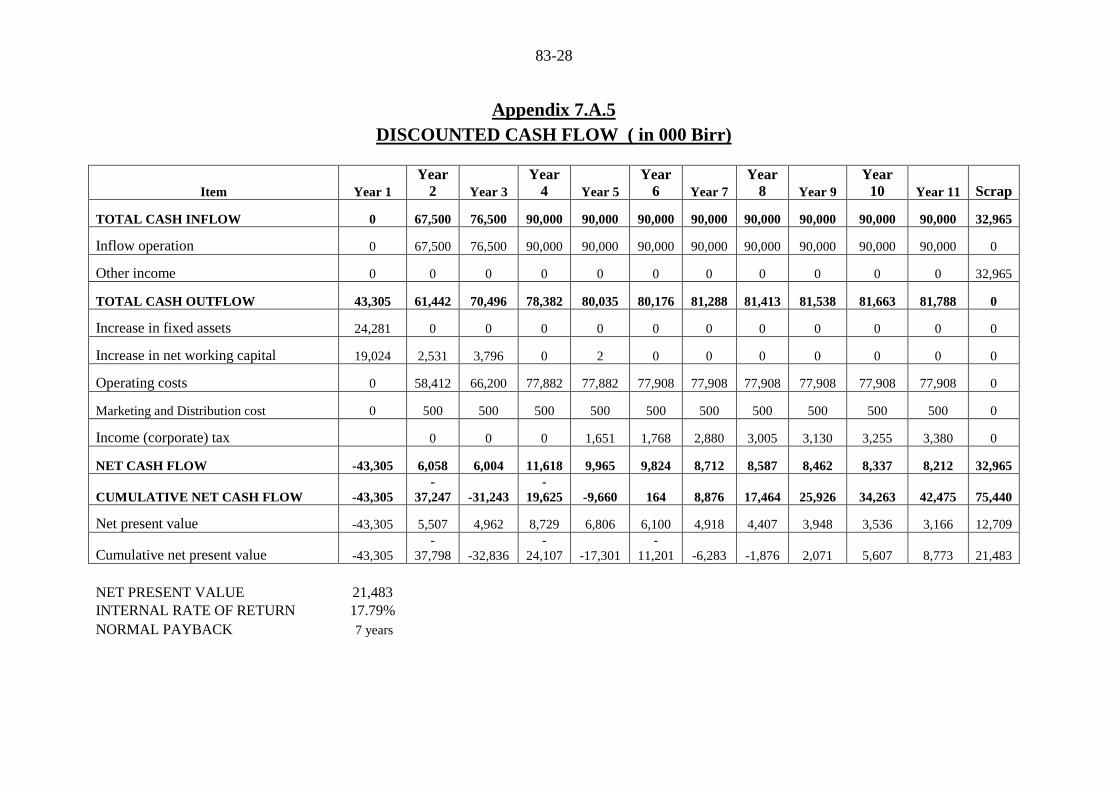
5. Internal Rate of Return
The internal rate of return (IRR) is the annualized effective compounded return rate that can be
earned on the invested capital, i.e., the yield on the investment. Put another way, the internal rate
of return for an investment is the discount rate that makes the net present value of the
investment's income stream total to zero. It is an indicator of the efficiency or quality of an
investment. A project is a good investment proposition if its IRR is greater than the rate of return
that could be earned by alternate investments or putting the money in a bank account.
Accordingly, the IRR of this project is computed to be 17.79% indicating the viability of the
project.
6. Net Present Value
Net present value (NPV) is defined as the total present (discounted) value of a time series of cash
flows. NPV aggregates cash flows that occur during different periods of time during the life of a
project in to a common measuring unit i.e. present value. It is a standard method for using the
time value of money to appraise long-term projects. NPV is an indicator of how much value an
investment or project adds to the capital invested. In principle, a project is accepted if the NPV is
non-negative. Accordingly, the net present value of the project at 10% discount rate is found to
be Birr 21.48 million which is acceptable. For detail discounted cash flow see Appendix 7.A.5.
D. ECONOMIC AND SOCIAL BENEFITS
The project can create employment for 57 persons. The project will generate Birr 19.07 million
in terms of tax revenue. The establishment of such factory will have a foreign exchange saving
effect to the country by substituting the current imports. The project will also create backward
linkage with plastic manufacturing sub sector and forward linkage with the packaging and
logistics sub sector and also generates other income for the Government.

83-23
Appendix 7.A
FINANCIAL ANALYSES SUPPORTING TABLES
83-24
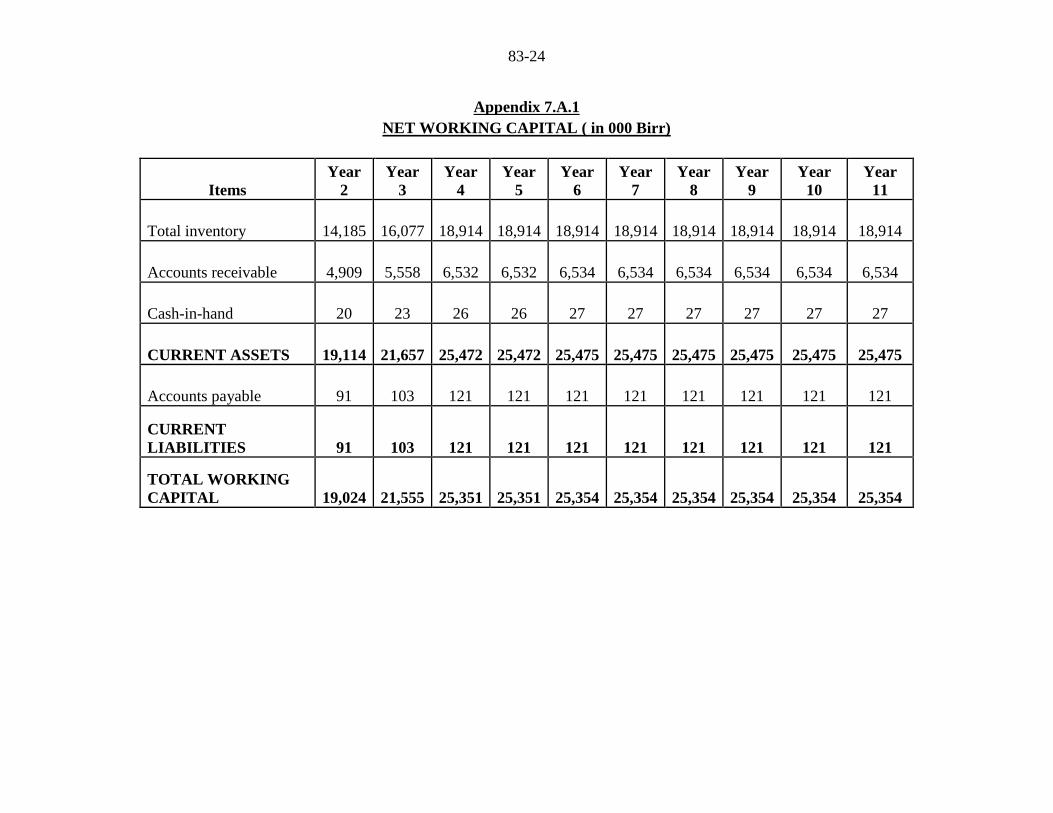
Appendix 7.A.1
NET WORKING CAPITAL ( in 000 Birr)
Items
Year
2
Year
3
Year
4
Year
5
Year
6
Year
7
Year
8
Year
9
Year
10
Year
11
Total inventory 14,185 16,077 18,914 18,914 18,914 18,914 18,914 18,914 18,914 18,914
Accounts receivable 4,909 5,558 6,532 6,532 6,534 6,534 6,534 6,534 6,534 6,534
Cash-in-hand 20 23 26 26 27 27 27 27 27 27
CURRENT ASSETS 19,114 21,657 25,472 25,472 25,475 25,475 25,475 25,475 25,475 25,475
Accounts payable 91 103 121 121 121 121 121 121 121 121
CURRENT
LIABILITIES 91 103 121 121 121 121 121 121 121 121
TOTAL WORKING
CAPITAL 19,024 21,555 25,351 25,351 25,354 25,354 25,354 25,354 25,354 25,354
83-25
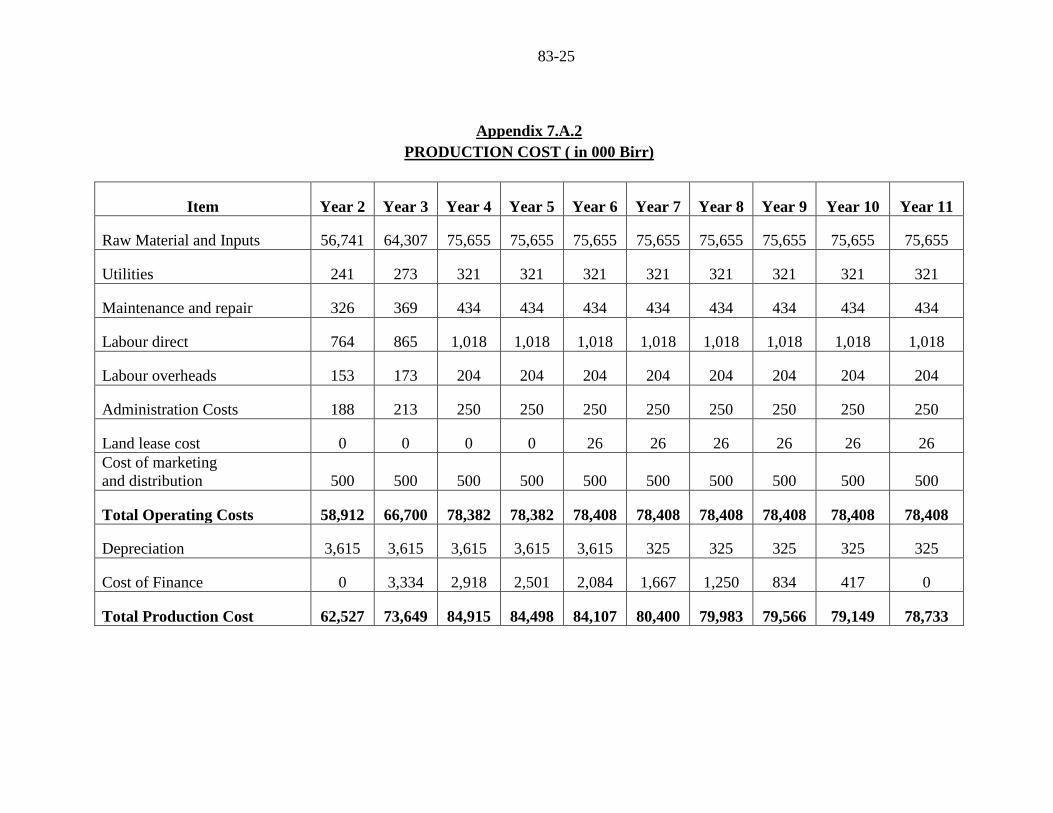
Appendix 7.A.2
PRODUCTION COST ( in 000 Birr)
Item Year 2 Year 3 Year 4 Year 5 Year 6 Year 7 Year 8 Year 9 Year 10 Year 11
Raw Material and Inputs 56,741 64,307 75,655 75,655 75,655 75,655 75,655 75,655 75,655 75,655
Utilities 241 273 321 321 321 321 321 321 321 321
Maintenance and repair 326 369 434 434 434 434 434 434 434 434
Labour direct 764 865 1,018 1,018 1,018 1,018 1,018 1,018 1,018 1,018
Labour overheads 153 173 204 204 204 204 204 204 204 204
Administration Costs 188 213 250 250 250 250 250 250 250 250
Land lease cost 0 0 0 0 26 26 26 26 26 26
Cost of marketing
and distribution 500 500 500 500 500 500 500 500 500 500
Total Operating Costs 58,912 66,700 78,382 78,382 78,408 78,408 78,408 78,408 78,408 78,408
Depreciation 3,615 3,615 3,615 3,615 3,615 325 325 325 325 325
Cost of Finance 0 3,334 2,918 2,501 2,084 1,667 1,250 834 417 0
Total Production Cost 62,527 73,649 84,915 84,498 84,107 80,400 79,983 79,566 79,149 78,733
83-26
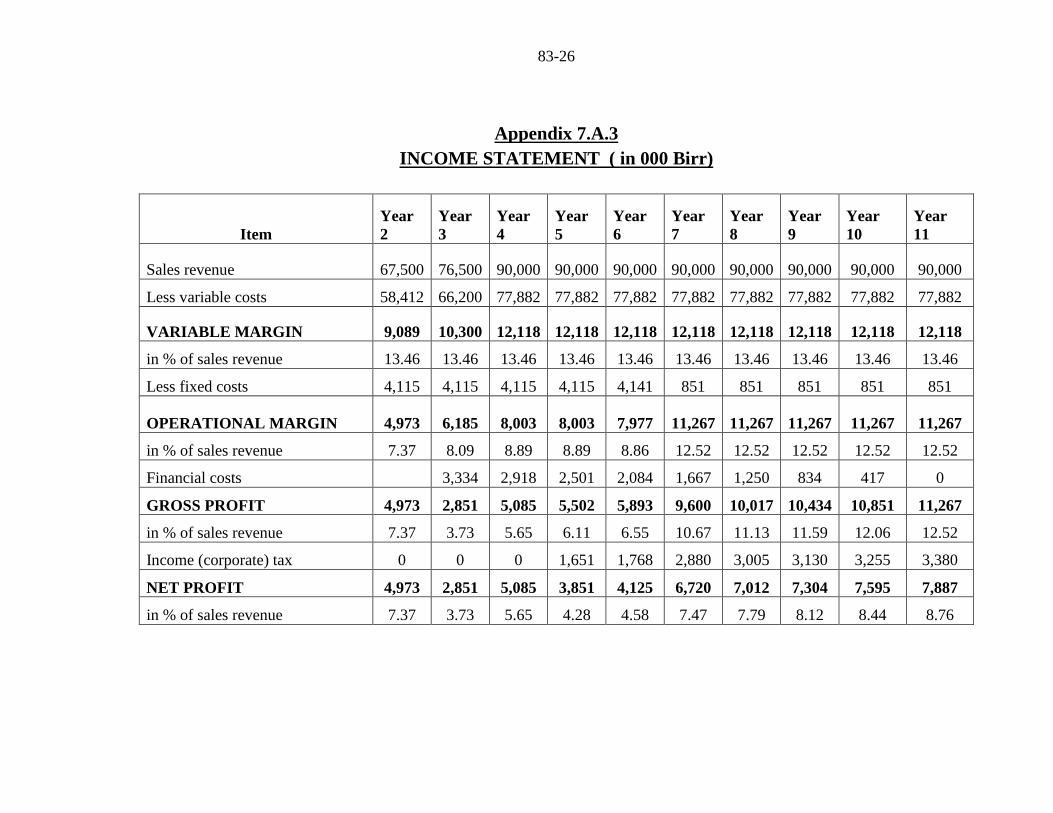
Appendix 7.A.3
INCOME STATEMENT ( in 000 Birr)
Item
Year
2
Year
3
Year
4
Year
5
Year
6
Year
7
Year
8
Year
9
Year
10
Year
11
Sales revenue 67,500 76,500 90,000 90,000 90,000 90,000 90,000 90,000 90,000 90,000
Less variable costs 58,412 66,200 77,882 77,882 77,882 77,882 77,882 77,882 77,882 77,882
VARIABLE MARGIN 9,089 10,300 12,118 12,118 12,118 12,118 12,118 12,118 12,118 12,118
in % of sales revenue 13.46 13.46 13.46 13.46 13.46 13.46 13.46 13.46 13.46 13.46
Less fixed costs 4,115 4,115 4,115 4,115 4,141 851 851 851 851 851
OPERATIONAL MARGIN 4,973 6,185 8,003 8,003 7,977 11,267 11,267 11,267 11,267 11,267
in % of sales revenue 7.37 8.09 8.89 8.89 8.86 12.52 12.52 12.52 12.52 12.52
Financial costs 3,334 2,918 2,501 2,084 1,667 1,250 834 417 0
GROSS PROFIT 4,973 2,851 5,085 5,502 5,893 9,600 10,017 10,434 10,851 11,267
in % of sales revenue 7.37 3.73 5.65 6.11 6.55 10.67 11.13 11.59 12.06 12.52
Income (corporate) tax 0 0 0 1,651 1,768 2,880 3,005 3,130 3,255 3,380
NET PROFIT 4,973 2,851 5,085 3,851 4,125 6,720 7,012 7,304 7,595 7,887
in % of sales revenue 7.37 3.73 5.65 4.28 4.58 7.47 7.79 8.12 8.44 8.76
83-27
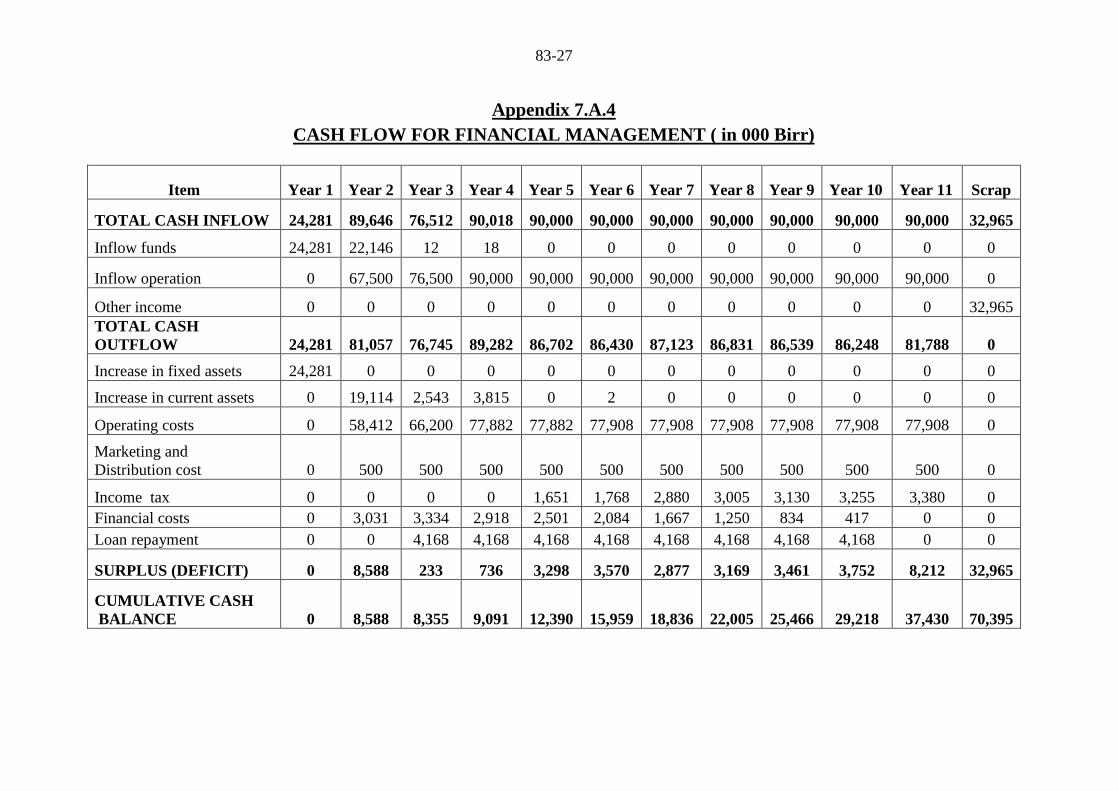
Appendix 7.A.4
CASH FLOW FOR FINANCIAL MANAGEMENT ( in 000 Birr)
Item Year 1 Year 2 Year 3 Year 4 Year 5 Year 6 Year 7 Year 8 Year 9 Year 10 Year 11 Scrap
TOTAL CASH INFLOW 24,281 89,646 76,512 90,018 90,000 90,000 90,000 90,000 90,000 90,000 90,000 32,965
Inflow funds 24,281 22,146 12 18 0 0 0 0 0 0 0 0
Inflow operation 0 67,500 76,500 90,000 90,000 90,000 90,000 90,000 90,000 90,000 90,000 0
Other income 0 0 0 0 0 0 0 0 0 0 0 32,965
TOTAL CASH
OUTFLOW 24,281 81,057 76,745 89,282 86,702 86,430 87,123 86,831 86,539 86,248 81,788 0
Increase in fixed assets 24,281 0 0 0 0 0 0 0 0 0 0 0
Increase in current assets 0 19,114 2,543 3,815 0 2 0 0 0 0 0 0
Operating costs 0 58,412 66,200 77,882 77,882 77,908 77,908 77,908 77,908 77,908 77,908 0
Marketing and
Distribution cost 0 500 500 500 500 500 500 500 500 500 500 0
Income tax 0 0 0 0 1,651 1,768 2,880 3,005 3,130 3,255 3,380 0
Financial costs 0 3,031 3,334 2,918 2,501 2,084 1,667 1,250 834 417 0 0
Loan repayment 0 0 4,168 4,168 4,168 4,168 4,168 4,168 4,168 4,168 0 0
SURPLUS (DEFICIT) 0 8,588 233 736 3,298 3,570 2,877 3,169 3,461 3,752 8,212 32,965
CUMULATIVE CASH
BALANCE 0 8,588 8,355 9,091 12,390 15,959 18,836 22,005 25,466 29,218 37,430 70,395
83-28
Appendix 7.A.5
DISCOUNTED CASH FLOW ( in 000 Birr)
Item Year 1
Year
2 Year 3
Year
4 Year 5
Year
6 Year 7
Year
8 Year 9
Year
10 Year 11 Scrap
TOTAL CASH INFLOW 0 67,500 76,500 90,000 90,000 90,000 90,000 90,000 90,000 90,000 90,000 32,965
Inflow operation 0 67,500 76,500 90,000 90,000 90,000 90,000 90,000 90,000 90,000 90,000 0
Other income 0 0 0 0 0 0 0 0 0 0 0 32,965
TOTAL CASH OUTFLOW 43,305 61,442 70,496 78,382 80,035 80,176 81,288 81,413 81,538 81,663 81,788 0
Increase in fixed assets 24,281 0 0 0 0 0 0 0 0 0 0 0
Increase in net working capital 19,024 2,531 3,796 0 2 0 0 0 0 0 0 0
Operating costs 0 58,412 66,200 77,882 77,882 77,908 77,908 77,908 77,908 77,908 77,908 0
Marketing and Distribution cost 0 500 500 500 500 500 500 500 500 500 500 0
Income (corporate) tax 0 0 0 1,651 1,768 2,880 3,005 3,130 3,255 3,380 0
NET CASH FLOW -43,305 6,058 6,004 11,618 9,965 9,824 8,712 8,587 8,462 8,337 8,212 32,965
CUMULATIVE NET CASH FLOW -43,305
-
37,247 -31,243
-
19,625 -9,660 164 8,876 17,464 25,926 34,263 42,475 75,440
Net present value -43,305 5,507 4,962 8,729 6,806 6,100 4,918 4,407 3,948 3,536 3,166 12,709
Cumulative net present value -43,305
-
37,798 -32,836
-
24,107 -17,301
-
11,201 -6,283 -1,876 2,071 5,607 8,773 21,483
NET PRESENT VALUE 21,483
INTERNAL RATE OF RETURN 17.79%
NORMAL PAYBACK 7 years