7 tips for optimizing mobile app metrics
TRANSCRIPT

7 Tips for Optimizing Mobile App Experience Metrics Rob Kwok, Co-Founder & CTO

“
©2016 Copyright Apteligent
Our busiest branch in 2014 is the 7:01 from Reading to Paddington – over 167,000 of our customers use our Mobile Banking app between 7am and 8am on their commute to work every day.
Ross McEwan CEO
Royal Bank of Scotland
Mobile is About Delivering Great Micro-Moments Delivering the best user experience regardless of location, motion, proximity, time, and speed – at all times, under all conditions

“ ©2016 Copyright Apteligent
It took one day to lose a star and 6 months to get it back.Mobile PM
Major News Service
There’s No Margin for Error on Mobile Getting mobile wrong is hazardous for your business.
• 30% of consumers indicate that they will consider leaving a brand due "to a poor app experience
• 51% of consumers believe mobile should be easier than web
• 70% of millennials will critique an app based on their experience
Source: Apteligent Data

©2016 Copyright Apteligent
Typical Bad User Experiences on Mobile Apps Transaction
Failure Slow apps Crashes Network"
Services Error

©2016 Copyright Apteligent
User-Centered Metrics are Critical for Reputation, Retention, and Monetization
It took one day to lose �a star and 6 months to �get it back
Mobile PM Major News
Service “ • Slow load times • Crashes • Freezes • Failed transactions • Sluggish response ”

©2016 Copyright Apteligent
The “Hierarchy of Abandonment”
Think About Customer Experience from Your User’s Perspective
• The app crashes or freezes • Broken features
• App takes forever to load • Waiting constantly
• App drains my battery • App kills my data plan
FAILURE
FRUSTRATION
ANNOYANCE

©2016 Copyright Apteligent
Prioritize Crashes by Number of Affected Users
Avoid Failure – Tip #1: Fix the Top 10 Crashes Every Sprint
• The best apps have crash rates of less than 0.25% • 75% of apps across iOS & Android platforms do not meet this standard1
data.apteligent.com
1Source: https://data.apteligent.com/ios/benchmarks/global https://data.apteligent.com/android/benchmarks/global

©2016 Copyright Apteligent
Prioritize Crashes Failing Your Most Critical Users
Avoid Failure – Tip #2: Fix Crashes in Critical Userflows
1. Identify the three most important �User Flows in your app• e.g., Login, New Account Registration, �
In-App Purchase
2. Fix the top crashes affecting critical User Flows each sprint
3. Maintain a crash rate < 0.25% in your most critical User Flows
©2016 Copyright Apteligent
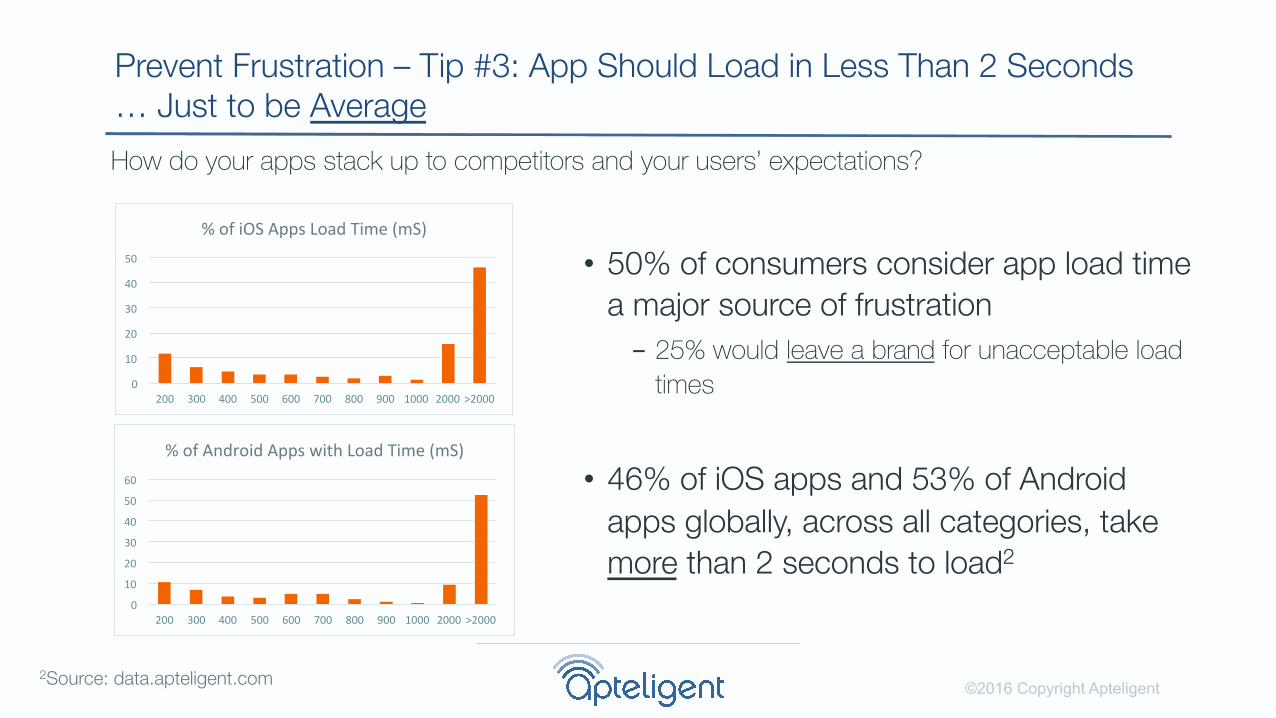
How do your apps stack up to competitors and your users’ expectations?
Prevent Frustration – Tip #3: App Should Load in Less Than 2 Seconds … Just to be Average
• 50% of consumers consider app load time a major source of frustration - 25% would leave a brand for unacceptable load
times
• 46% of iOS apps and 53% of Android apps globally, across all categories, take more than 2 seconds to load2
0
10
20
30
40
50
200 300 400 500 600 700 800 900 1000 2000 >2000
% of iOS Apps Load Time (mS)
0
10
20
30
40
50
60
200 300 400 500 600 700 800 900 1000 2000 >2000
% of Android Apps with Load Time (mS)
2Source: data.apteligent.com

©2016 Copyright Apteligent
Suggested Metrics for High Performance Apps
Prevent Frustration – Tip #4: Interactions Should Take < 1 Seconds
Userflow User Expectation Time App load (time to availability of first user-interaction)
App is “working” 1.0 s
Login (not including data entry) App is “working” 1.0 s
Registration (not including data entry) App is “working” 1.0 s
Search App is “working” 1.0 s
Screen transitions Immediate 0.1 s
Browse Immediate 0.1 s
Add to shopping cart Immediate 0.1 s
Check-out App is “working” 1.0 s
Locate (e.g. locate store) App is “working” 1.0 s
Barcode scan App is “working” 1.0 s
Human computer interaction research shows if a user expects3: • an operation to be instantaneous, then �
it should take no more than 0.1 second • the app to be “working” then the operation
should take no more than�1.0 seconds
3Powers of 10: Time Scales in User Experience, Jakob Nielsen

©2016 Copyright Apteligent
Monitor the latency of network calls that cause the user to wait
Prevent Frustration – Tip #5: Monitor Important Network Calls
1. Monitor the three most important Userflows in your app
2. Time how long they take to complete
3. Identify network calls that each Userflow depends on
4. Monitor the latency and error rate of each call - Latency < 1 second - Error Rate < 0.25%

©2016 Copyright Apteligent
Ensure Your Users Don’t Uninstall Your App
Avert Annoyance: Tip #6: Measure Data and Battery Usage
• Request Volume - Monitor increased network calls due to new SDKs
• Data Received and Sent - Monitor the amount of data your app sends and
receives with each new version and with the addition of new SDKs
• Don’t be a “Battery Killer” - Monitor battery drain

©2016 Copyright Apteligent
Stay On Top of Every OS Release, Every App Release
Tip #7: Monitor Your Performance Metrics – Over Time and Per Release
• Track your app metrics release over release, across internal infrastructure changes (internal API and back-end services), and across major ecosystems events (e.g., OS version releases).
• A historical view of 30 to 90 days will enable you to fill in the critical “why” to the changes you measure (both positive and negative), in the “what” of your key business KPIs.

©2016 Copyright Apteligent 14
Key Metrics and their Targets
To Sum Up: Your Critical Mobile Metrics
• Avoid Failures - Overall Crash Rate < 0.25% - Crash Rate of Critical Userflows (e.g., “Login”) < 0.25%
• Prevent Frustration - App Load Time < 2 seconds (to meet the industry, < 1 second to excel) - Critical Userflows < 1 second - Userflow Dependent APIs: < 1 second latency, < 0.25% error rate
• Avert Annoyance - Monitor Request Volume, Data Sent/Received, and Battery Impact

©2016 Copyright Apteligent 15
Measure metrics from the Customer’s perspective
Final Considerations
• At a bare minimum monitor for app “Failures” like crashes, hangs and exceptions.
• Monitor the time it takes to access the visible and important user flows (how customers typically journey through your app). Address “Frustration” and “Annoyance” issues.
• App load time is key user flow because it has a direct connection to your business result though your abandonment KPI.
• To set app metric targets, recognize the insights of human perception research, and set metrics to meet or exceed your users’ built-in timing expectations.
• Track both the duration of the user flow and the latency and error rates of the underlying network calls over time and between app releases.
©2016 Copyright Apteligent
Build better, Acquire More, Engage Deeper, Monetize Faster
Great Mobile Teams Have Both Vision And Visibility
Apteligent delivers user-centered metrics – helping mobile teams prioritize app issues, focus on new feature
development, and deliver the best possible user experience.
The “why” behind the “what”

©2016 Copyright Apteligent
Build Better, Acquire More, Engage Deeper, Monetize Faster
Apteligent: Real. Enterprise. Mobility
Apteligent provides tools that empower mobile developers and product managers to troubleshoot, prioritize, and resolve issues that damage their users’ app experience.
• Developers get detailed, real-time information to find and resolve crashes, freezes, and
issues in key user flows.
• Product managers and KPI owners get global mobile industry and competitive insight to
better plan and focus their mobile initiatives, as well as real-time visibility to app metrics that
enable rapid issue detection, prioritization, and release-over-release app improvement.
©2016 Copyright Apteligent
Thank You! www.apteligent.com
@robkwok