7 socioeconomic baseline 7.1 project area - erm · 7 socioeconomic baseline 7.1 p roject a rea ......
TRANSCRIPT

ENVIRONMENTAL RESOURCES MANAGEMENT BURGAN CAPE TERMINALS FEIR
7-1
7 SOCIOECONOMIC BASELINE
7.1 PROJECT AREA
The Cape Town Eastern Mole has been ear marked as the location for the development of the Burgan Oil Fuel Storage and Distribution Facility. The Eastern Mole is situated between the Duncan and Ben Schoeman Docks within the Cape Town Port. The Port is zoned for `harbour use’, and is the second largest container port in the country. The site is located on New Portnet Road and the surrounding tenants include Joint Bunker Services (JBS), FFS Refiners (Pty) Ltd (FFS) and Cape Town Bulk Storage (CTBS) tank farms. The Port of Cape Town is bounded by areas and developments such as the Victoria and Alfred (V and A) Waterfront, the suburb of Greenpoint, Table Bay and Table Mountain.
7.2 ADMINISTRATIVE STRUCTURE AND AREA
The Project Area is located within the City of Cape Town Metropolitan area, which is governed by the City Council. The City Council is both a legislative and an executive body. It is empowered by the Constitution to make decisions concerning the exercise of all the powers and the performance of all the functions of the municipality (1). It is responsible for the development of the Integrated Development Plans (IDP) and Strategic Development Framework (SDF), the overall provision of services and infrastructure within the metropolitan areas (2). The diagram below, Figure 7.1 gives a diagrammatic representation of the administrative structure of the City of Cape Town.
(1) City of Cape Town Metropolitan Municipality (2) White Paper on Local Government, 1998

ENVIRONMENTAL RESOURCES MANAGEMENT BURGAN CAPE TERMINALS FEIR
7-2
Figure 7.1 City of Cape Town: Administrative Structure
7.3 POPULATION SIZE AND GROWTH
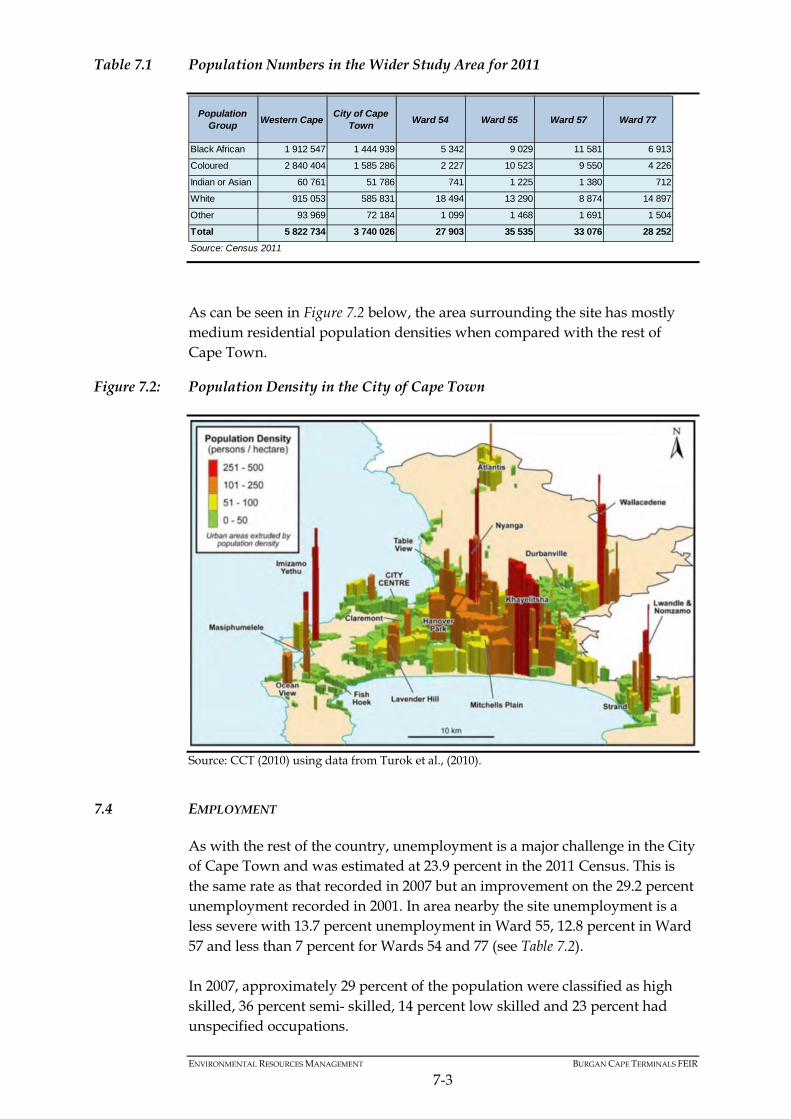
The population of Cape Town was estimated to be 3.74 million in 2011(1) (see Table 7.1). This is up from roughly 2.89 million in 2001 and represents an increase of 29% over the period. The 2011 populations of Ward 55 which encompasses the Port was roughly 35,500 people with the other wards nearby having relatively similar populations of between approximately 28,000 and 33,000 people. The high population numbers can be attributed to the constant in-migration of people from the Eastern Cape Province in search of employment and other opportunities. It covers an area approximately 2,455km² and it has a population density of 1, 507/persons km² (2). The age profile for the Cape Town illustrates a developing population dominated by youth and middle aged people (69 percent are between 15 and 64 years); this is followed by the children (26 percent between zero and 14 years) and the elderly population (above 65 years of age) comprise the remaining five percent. During 2011, the population groups for the City of Cape Town were broken down as follows: 39 percent Black African, 42 percent Coloured, 1,4 percent Indian or Asian, 16 percent White and two percent under the category of ‘Other’(3).
(1) Census, 2011 (2) City of Cape Town Councillor Handbook 2011 (3) Census, 2011
City of Cape Town Councillor Handbook 2011 review
ENVIRONMENTAL RESOURCES MANAGEMENT BURGAN CAPE TERMINALS FEIR
7-3
Table 7.1 Population Numbers in the Wider Study Area for 2011
As can be seen in Figure 7.2 below, the area surrounding the site has mostly medium residential population densities when compared with the rest of Cape Town.
Figure 7.2: Population Density in the City of Cape Town
Source: CCT (2010) using data from Turok et al., (2010).
7.4 EMPLOYMENT
As with the rest of the country, unemployment is a major challenge in the City of Cape Town and was estimated at 23.9 percent in the 2011 Census. This is the same rate as that recorded in 2007 but an improvement on the 29.2 percent unemployment recorded in 2001. In area nearby the site unemployment is a less severe with 13.7 percent unemployment in Ward 55, 12.8 percent in Ward 57 and less than 7 percent for Wards 54 and 77 (see Table 7.2). In 2007, approximately 29 percent of the population were classified as high skilled, 36 percent semi- skilled, 14 percent low skilled and 23 percent had unspecified occupations.
Population Group Western Cape City of Cape
Town Ward 54 Ward 55 Ward 57 Ward 77
Black African 1 912 547 1 444 939 5 342 9 029 11 581 6 913
Coloured 2 840 404 1 585 286 2 227 10 523 9 550 4 226
Indian or Asian 60 761 51 786 741 1 225 1 380 712
White 915 053 585 831 18 494 13 290 8 874 14 897
Other 93 969 72 184 1 099 1 468 1 691 1 504
Total 5 822 734 3 740 026 27 903 35 535 33 076 28 252Source: Census 2011

ENVIRONMENTAL RESOURCES MANAGEMENT BURGAN CAPE TERMINALS FEIR
7-4
Table 7.2 Unemployment in the Wider Study Area for 2011
With respect to employment per sector, Figure 7.3 shows changes with regard to employment patterns in the City of Cape Town between 1996 and 2007. The trend towards greater employment growth in the services and trade sector is made clear whilst employment in manufacturing has decreased significant over the period. The trade, catering and accommodation sector’s share of total employment rose from 15 percent in 1996 to roughly 18.5 percent in 2007. Much of this growth can probably be ascribed to high growth levels in the tourism industry over this period. Similarly, the finance and business services sector’s share of total employment rose from 16.5 percent in 1996 to roughly 23 percent in 2007. In 1996 Manufacturing contributed 22.3 percent to employment, decreasing to 15.8 percent in 2007, with roughly 58,000 jobs being shed in real terms in the sector between 1996 and 2007 (Urban-Econ, 2009).
Figure 7.3 Trends in Sectoral Employment in the City of Cape Town
Source: Urban Econ (2009) drawing on Census and Community Survey data
7.5 INCOME LEVELS
Table 7.3 below shows household income levels in the Study Area for 2011. Approximately 32 percent of households in the City of Cape Town had low incomes below R19,600 per year in 2011. As one would expect, incomes nearer
Employment category Western Cape
City of Cape Town
Ward 54 Ward 55 Ward 57 Ward 77
Employed 2 010 697 1 294 239 13 318 14 583 12 364 13 165
Unemployed 552 733 405 989 704 2 307 1 611 825
% unemployed 21.6% 23.9% 5.0% 13.7% 11.5% 5.9%
Discouraged work-seeker 122 753 81 433 83 313 198 91
% unemployed including discouraged work-seekers 25.1% 27.4% 5.6% 15.2% 12.8% 6.5%
Source: Census 2011

ENVIRONMENTAL RESOURCES MANAGEMENT BURGAN CAPE TERMINALS FEIR
7-5
the site are higher than the city-wide average. Roughly 22 percent of household in Ward 55 and Ward 57 had incomes below R19,600 per year in 2011 whilst roughly 15 percent of household in Ward 54 and Ward 77 had incomes at this level.
Table 7.3 Percentage of Household per Income Category in the Wider Study Area for 2011
7.6 ECONOMIC GROWTH AND SECTORAL TRENDS
The City of Cape Town contributed 76 percent to the Western Cape Gross Regional Product (GRP) of roughly R14.5 billion in 2007 and 11 percent to the national GDP. During the period 2004-2009 the economy grew at roughly four percent per annum on par with the province and slightly higher than the national average (CCT, 2011). With regard to sectoral trends, recent production data in the Draft Analysis of the Cape Town Spatial Economy confirms that the economy is shifting towards the services sector and that this trend may have accelerated in the current economic recession. Figure 7.4 below shows that relative contributions to city GRP have grown rapidly for the finance, insurance and business services sector but have decreased for manufacturing and wholesale and retail trade. Note that although the latter sector declined in relative importance between 2005 and 2009, it experienced strong growth in prior periods. Note also that declining sectoral share does not necessarily imply negative growth, rather indicating that other sectors are growing faster. For example, manufacturing has a low but positive average annual GRP growth rate between 2005 and 2009. The agriculture, mining and construction sectors had very high growth rates but this was of limited significance to production levels because of their relatively small size (CCT, 2010).

ENVIRONMENTAL RESOURCES MANAGEMENT BURGAN CAPE TERMINALS FEIR
7-6
Figure 7.4 GRP Sectoral Contributions and Growth in the City of Cape Town
Source: CCT (2010) using Quantec data
7.7 PETROLEUM INDUSTRY
This section provides a brief overview of the petroleum industry at the national and regional/provincial level in order to provide context for the proposed project.
7.7.1 National Context
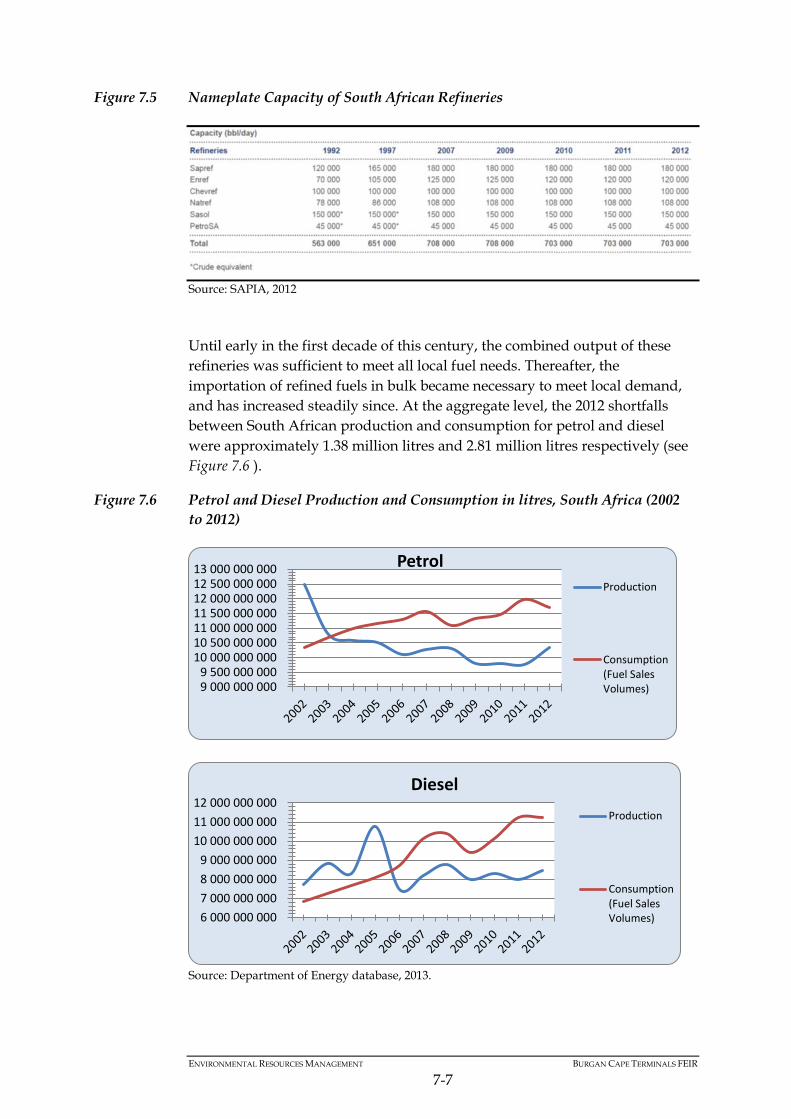
At a national level, South Africa produces about five percent of its liquid fuel needs from gas, about 35 percent from coal and about 50 percent from local crude oil refineries. The remainder (approximately 10 percent) is imported as refined product from refineries elsewhere in the world (NPC, 2012). Liquid fuels production in South Africa currently takes place at six refineries with a combined nameplate capacity of approximately 703,000 barrels/day (see Figure 7.5) (1).
(1) One barrel equals roughly 159 litres. Nameplate capacity refers to the intended technical full–load sustained output of a refinery. This level of output is generally difficult to achieve consistently and economically particularly in older refineries.
ENVIRONMENTAL RESOURCES MANAGEMENT BURGAN CAPE TERMINALS FEIR
7-7
Figure 7.5 Nameplate Capacity of South African Refineries
Source: SAPIA, 2012 Until early in the first decade of this century, the combined output of these refineries was sufficient to meet all local fuel needs. Thereafter, the importation of refined fuels in bulk became necessary to meet local demand, and has increased steadily since. At the aggregate level, the 2012 shortfalls between South African production and consumption for petrol and diesel were approximately 1.38 million litres and 2.81 million litres respectively (see Figure 7.6 ).
Figure 7.6 Petrol and Diesel Production and Consumption in litres, South Africa (2002 to 2012)
Source: Department of Energy database, 2013.
9 000 000 000 9 500 000 000
10 000 000 000 10 500 000 000 11 000 000 000 11 500 000 000 12 000 000 000 12 500 000 000 13 000 000 000 Petrol
Production
Consumption(Fuel SalesVolumes)
6 000 000 000 7 000 000 000 8 000 000 000 9 000 000 000
10 000 000 000 11 000 000 000 12 000 000 000
Diesel Production
Consumption(Fuel SalesVolumes)
ENVIRONMENTAL RESOURCES MANAGEMENT BURGAN CAPE TERMINALS FEIR
7-8
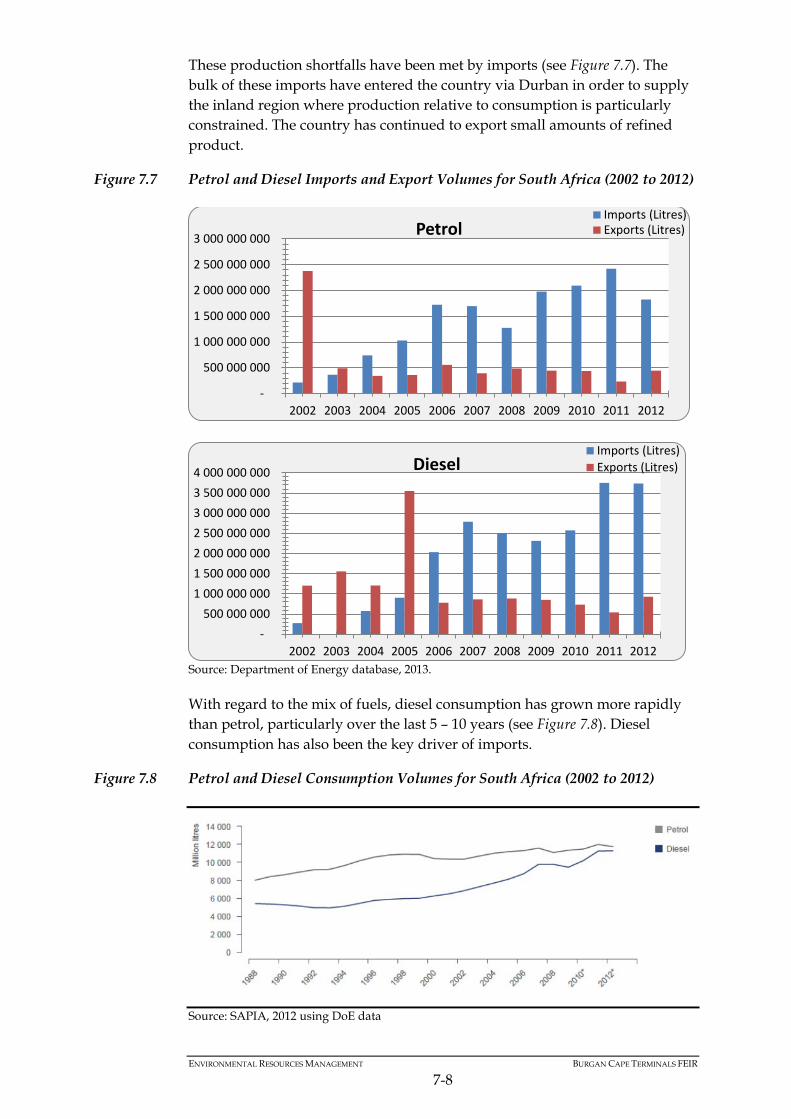
These production shortfalls have been met by imports (see Figure 7.7). The bulk of these imports have entered the country via Durban in order to supply the inland region where production relative to consumption is particularly constrained. The country has continued to export small amounts of refined product.
Figure 7.7 Petrol and Diesel Imports and Export Volumes for South Africa (2002 to 2012)
Source: Department of Energy database, 2013. With regard to the mix of fuels, diesel consumption has grown more rapidly than petrol, particularly over the last 5 – 10 years (see Figure 7.8). Diesel consumption has also been the key driver of imports.
Figure 7.8 Petrol and Diesel Consumption Volumes for South Africa (2002 to 2012)
Source: SAPIA, 2012 using DoE data
-
500 000 000
1 000 000 000
1 500 000 000
2 000 000 000
2 500 000 000
3 000 000 000
2002 2003 2004 2005 2006 2007 2008 2009 2010 2011 2012
Petrol Imports (Litres)Exports (Litres)
- 500 000 000
1 000 000 000 1 500 000 000 2 000 000 000 2 500 000 000 3 000 000 000 3 500 000 000 4 000 000 000
2002 2003 2004 2005 2006 2007 2008 2009 2010 2011 2012
Diesel Imports (Litres)Exports (Litres)

ENVIRONMENTAL RESOURCES MANAGEMENT BURGAN CAPE TERMINALS FEIR
7-9
Prices for liquid fuels (petrol, diesel and illuminating paraffin) while linked to costs, are essentially administered and not set by the free market. This circumscribes competition in the industry. It means that consumers in a given region face identical petrol prices at the pump regardless of the fuel supplier, with only minimal retail variations allowed for diesel. The price setting mechanism gives producers an incentive to keep their costs as low as possible, while providing acceptable returns and ensuring that local refineries and suppliers compete with their international counterparts. The Basic Fuels Price (BFP) was introduced in 2003 by the DoE with agreement from refiners in order to regulate ‘international equivalent’ prices for fuel that refiners could charge. According to the DoE, “The underlying principles for the basis of determination of the Basic Fuels Price (BFP) are to represent the realistic, market-related costs of importing a substantial portion of South Africa's liquid fuels requirements, and it is therefore deemed that such supplies are sourced from overseas refining centres capable of meeting South Africa's requirements in terms of both product quality and sustained supply considerations.” (1)
Genuinely competitive market prices that ‘mimic’ open competition and rival the prices of international producers are thus strived for.
Table 7.4 International Influences on the Basic Fuel Price (BFP) Calculation
Free-on Board (FOB) Values These are petroleum product prices quoted on a daily basis by export orientated refining centres situated in the Mediterranean area, the Arab Gulf and Singapore. Freight This is the cost to transport refined petroleum products from these export refining centres to South African ports. The freight rates used in the BFP calculation are based on freight rates published by London Tanker Brokers Panel on 1 January each year. These freight rates are adjusted on a monthly basis in line with the so-called Average Freight Rate Assessment (AFRA) which is a function of risks and supply and demand of ships transporting refined petroleum products internationally. Demurrage Petroleum products are loaded into ships at ports in the Mediterranean area, Arab Gulf and Singapore and these products are discharged at South African ports. Demurrage rates are published by the World Scale Association Limited. In calculating the demurrage cost, the total demurrage time is limited to 3 days. Insurance An element of 0.15 percent of the FOB-value and freight to cover insurance as well as other costs such as letters of credit, surveyors' and agents' fees and laboratory costs. Ocean Loss A loss allowance factor of 0.3 percent to be calculated on the sum of the FOB, Freight and Insurance values for products is applicable to provide for typical uninsurable losses during transportation of fuels. Cargo Dues (Wharfage) The South African harbour facilities are utilised to off-load petroleum products from ships into on-shore storage facilities. The cost to utilise these harbour facilities is based on the tariff set by the National Ports Authority of South Africa. Coastal Storage This is to recover the cost of providing storage and handling facilities at coastal
(1) See http://www.energy.gov.za/files/esources/petroleum/petroleum_pricestructure.html.
ENVIRONMENTAL RESOURCES MANAGEMENT BURGAN CAPE TERMINALS FEIR
7-10
terminals. In 2002, the typical international storage rate was assessed as USD 3 per ton or 2.5 SA cents per litre per month. The BFP only makes provision for 25 days and the initial value when BFP was implemented amounted to 2.083 c/l. This element is adjusted on an annual basis by the increase in the Producer Price Index (PPI). Stock Financing Stock financing cost is based on (i) the landed cost values of refined petroleum products, (ii) 25 days of stockholding and (iii) the ruling prime interest rate less 2 percent. The BFP, quoted in USD/barrel or USD/ton is converted to US cents/litre by applying the international conversion rates (for example, barrels to tons, tons to gallons and gallons to litres) and is then converted to South African cents/litre by applying the applicable Rand/US Dollar exchange rate. To arrive at the final petrol pump price in the different fuel pricing zones (magisterial district zones), domestic costs, imposts, levies and margins are added to the Basic Fuel Price (BFP). Source: Department of Energy - http://www.energy.gov.za/files/petroleum_frame.html
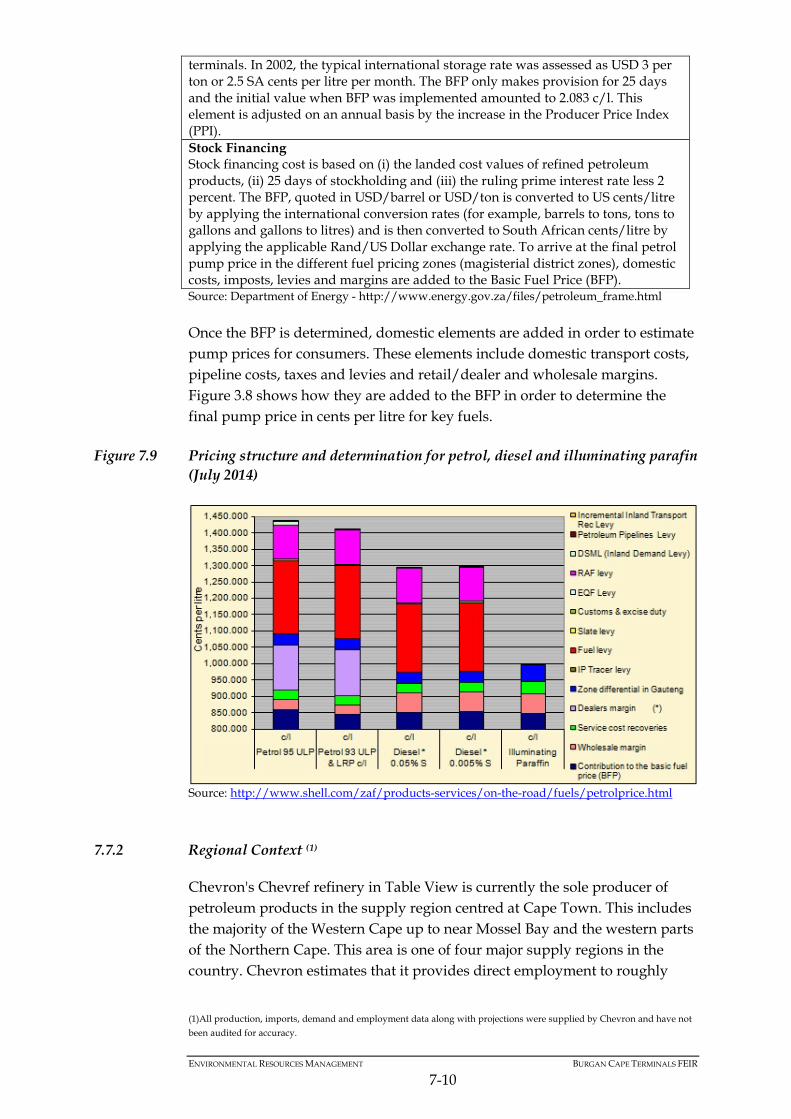
Once the BFP is determined, domestic elements are added in order to estimate pump prices for consumers. These elements include domestic transport costs, pipeline costs, taxes and levies and retail/dealer and wholesale margins. Figure 3.8 shows how they are added to the BFP in order to determine the final pump price in cents per litre for key fuels.
Figure 7.9 Pricing structure and determination for petrol, diesel and illuminating parafin (July 2014)
Source: http://www.shell.com/zaf/products-services/on-the-road/fuels/petrolprice.html
7.7.2 Regional Context (1)
Chevron's Chevref refinery in Table View is currently the sole producer of petroleum products in the supply region centred at Cape Town. This includes the majority of the Western Cape up to near Mossel Bay and the western parts of the Northern Cape. This area is one of four major supply regions in the country. Chevron estimates that it provides direct employment to roughly
(1)All production, imports, demand and employment data along with projections were supplied by Chevron and have not been audited for accuracy.
ENVIRONMENTAL RESOURCES MANAGEMENT BURGAN CAPE TERMINALS FEIR
7-11
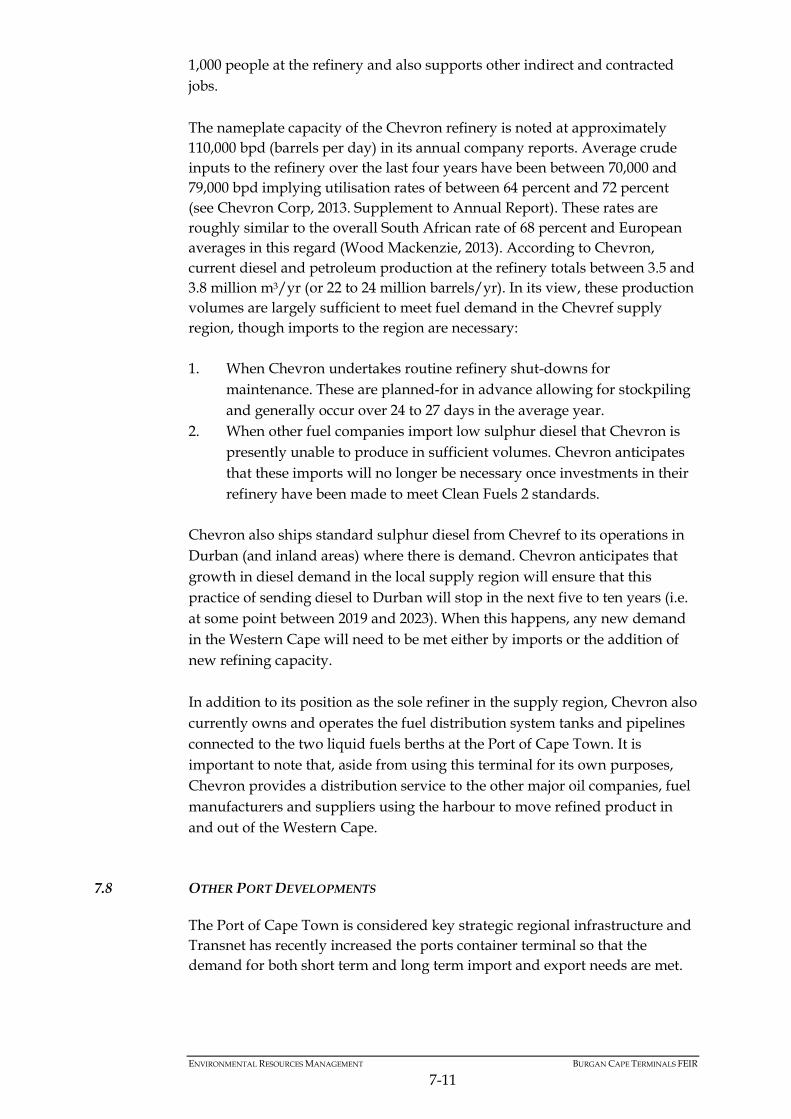
1,000 people at the refinery and also supports other indirect and contracted jobs. The nameplate capacity of the Chevron refinery is noted at approximately 110,000 bpd (barrels per day) in its annual company reports. Average crude inputs to the refinery over the last four years have been between 70,000 and 79,000 bpd implying utilisation rates of between 64 percent and 72 percent (see Chevron Corp, 2013. Supplement to Annual Report). These rates are roughly similar to the overall South African rate of 68 percent and European averages in this regard (Wood Mackenzie, 2013). According to Chevron, current diesel and petroleum production at the refinery totals between 3.5 and 3.8 million m3/yr (or 22 to 24 million barrels/yr). In its view, these production volumes are largely sufficient to meet fuel demand in the Chevref supply region, though imports to the region are necessary: 1. When Chevron undertakes routine refinery shut-downs for
maintenance. These are planned-for in advance allowing for stockpiling and generally occur over 24 to 27 days in the average year.
2. When other fuel companies import low sulphur diesel that Chevron is presently unable to produce in sufficient volumes. Chevron anticipates that these imports will no longer be necessary once investments in their refinery have been made to meet Clean Fuels 2 standards.
Chevron also ships standard sulphur diesel from Chevref to its operations in Durban (and inland areas) where there is demand. Chevron anticipates that growth in diesel demand in the local supply region will ensure that this practice of sending diesel to Durban will stop in the next five to ten years (i.e. at some point between 2019 and 2023). When this happens, any new demand in the Western Cape will need to be met either by imports or the addition of new refining capacity. In addition to its position as the sole refiner in the supply region, Chevron also currently owns and operates the fuel distribution system tanks and pipelines connected to the two liquid fuels berths at the Port of Cape Town. It is important to note that, aside from using this terminal for its own purposes, Chevron provides a distribution service to the other major oil companies, fuel manufacturers and suppliers using the harbour to move refined product in and out of the Western Cape.
7.8 OTHER PORT DEVELOPMENTS
The Port of Cape Town is considered key strategic regional infrastructure and Transnet has recently increased the ports container terminal so that the demand for both short term and long term import and export needs are met.

ENVIRONMENTAL RESOURCES MANAGEMENT BURGAN CAPE TERMINALS FEIR
7-12
This increase in terminal capacity is expected to be able to handle double the current cargo capacity (1). Other port developments currently under-way include the construction of a new entrance at the end of Marine Drive, the rehabilitation of port roads, the replacement of pilot roads and the rehabilitation of the rail network (2). Additionally, other developments surrounding the port include construction at the V and A Waterfront and the CTICC. The majority of imports by the port are due to petrol and petroleum gas products (51 percent) and the sector accounted for 71 percent of the port’s exports during the 2010/2011 financial year (3). Currently, the liquid bulk section of Cape Town only has two berths with a capacity of 3.4 million tons. 71 percent of this capacity was utilised during the 2010/ 2011 financial year which implies that additional capacity is required for future growth (4). Figure 7.10 indicates the demand for liquid fuel and other commodities within the Port of Cape Town.
Figure 7.10 Commodity demand by the Port of Cape Town
Figure 7.12 illustrates the different sector uses at the Port and highlights the use of the Eastern Mole for the use of liquid fuel, which is in line with Burgan Cape Terminal’s proposal to store liquid fuel.
(1) City of Cape Town IDP 2011 review (2) Engineering News (3)Engineering News (4)Engineering News
Transnet Infrastructure Plan, July 2009

ENVIRONMENTAL RESOURCES MANAGEMENT BURGAN CAPE TERMINALS FEIR
7-13
Figure 7.11 Liquid Bulk
Source: http://www.transnetnationalportsauthority.net/DoingBusinesswithUs/Presentations/Cape%20Town.pdf
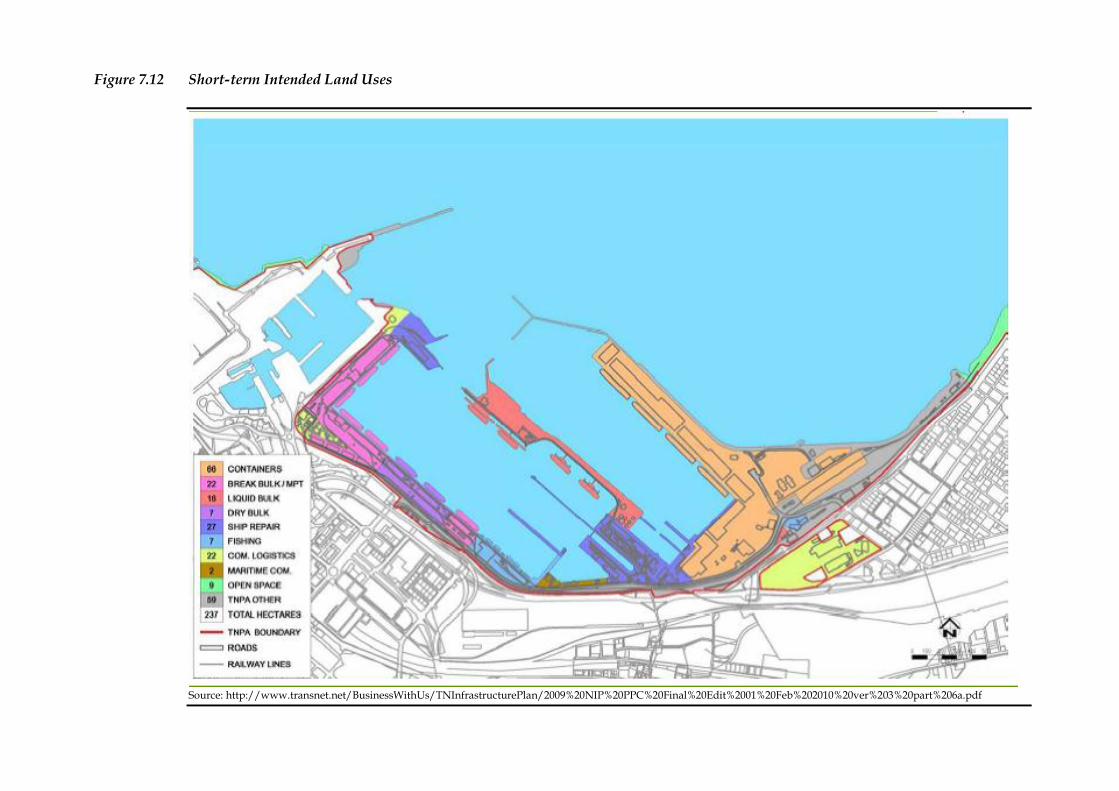
Figure 7.12 Short-term Intended Land Uses
Source: http://www.transnet.net/BusinessWithUs/TNInfrastructurePlan/2009%20NIP%20PPC%20Final%20Edit%2001%20Feb%202010%20ver%203%20part%206a.pdf
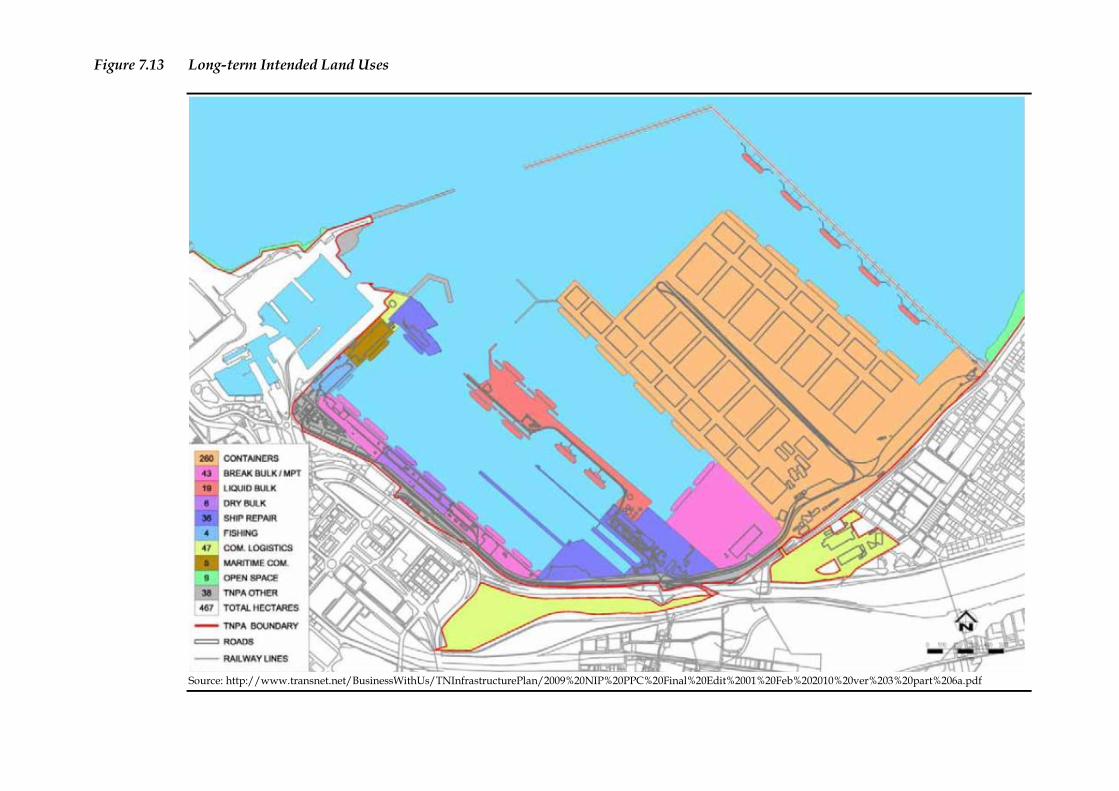
Figure 7.13 Long-term Intended Land Uses
Source: http://www.transnet.net/BusinessWithUs/TNInfrastructurePlan/2009%20NIP%20PPC%20Final%20Edit%2001%20Feb%202010%20ver%203%20part%206a.pdf

ENVIRONMENTAL RESOURCES MANAGEMENT BURGAN CAPE TERMINALS FEIR
7-16
It is understood that the Port of Cape Town has strong economic potential and that an integrated planning approach needs to be undertaken so that the port can maximise its full functionality and competitiveness.
7.9 HEALTH
The City of Cape Town has a total of 179 primary health care (PHC) facilities which includes 22 community health care centres, 20 community day centres, 93 clinics, 24 satellite clinics, six mobile clinics, nine district hospitals and five regional hospitals (1). The City of Cape Town has the lowest rate of HIV/AIDS, sexually transmitted infections (STIs) and tuberculosis (TB) out of all the South African cities. The HIV rate was 18 percent in 2009.
7.10 ON SITE EXISTING INFRASTRUCTURE
The site is currently vacant as it was previously used as a landfill site where `clean’ construction rubble would be dumped. The site however, has the following list of available utilities: • Fresh water supply; • Sewage disposal (a pump sump at each end of the site); • Salt- water fire main; and a • Ten meter wide access road.
7.11 GENERAL SERVICES AND INFRASTRUCTURE
7.11.1 Basic Services
In terms of basic service delivery, for every 4.9 informal households there is one toilet available, for every 13 households there is one tap, and there are 3,721 additional subsidised electricity connections installed in informal areas across Cape Town. Additionally, the generation of waste exceeds population growth by one percent.
7.11.2 Crime
Crime levels increased by four percent between 2009 and 2010. The 2009/10 period saw a slight reduction in commercial crime. Burglaries at business premises have had an annual average increase of 63 percent and residential robberies have had an annual average increase of 24 percent (2). During the 2009/2010 period, there were 39, 677 drug related reported crimes, 5, 881 sexual reported crimes and 1, 541 reported murders (3).
(1) Regional Development Profile: City of Cape Tow: 2010 (2) City of Cape Town IDP 2011 review (3) Regional Development Profile: City of Cape Town: 2010

ENVIRONMENTAL RESOURCES MANAGEMENT BURGAN CAPE TERMINALS FEIR
7-17
7.12 TRANSPORTATION
The section below is based on a specialist traffic study undertaken by Kantey and Templer (see Annex G) (1).
7.12.1 Transportation Landuse
Entrances to Cape Town Harbour are relatively congested during peak hours and at times during the day, depending on the prevailing demand volumes. Most road tankers are expected to arrive via the eastern entrance at the Container Road / Paarden Eiland Road intersection with Marine Drive (R27) and then via Duncan Road. The route to the site is via Duncan Road, Titan Road, Ocean Road, Monument Road and then the New Road alignment with a turning circle at the end of the Eastern Mole (see Figure 4.2 and Figure 4.3). The New Road alignment is a continuation of the existing road along the length of the Eastern Mole. As such the New Road will provide flexibility of movement and satisfactory service levels are anticipated without congestion as internal circulation is likely to be optimal. The FFS tanks currently store diesel for Eskom. During periods of demand by their OCGT Plants at Atlantis, this storage facility will require the use of 30 trucks in a 24 hour period. This constitutes a significant additional load on the road network. There is a limitation on the volume of fuel that can be distributed by road largely due to the limitations of loading for a road tanker which takes approximately 45 minutes to load. Circulation is planned in a clockwise direction and there is adequate space around the fuel loading gantry for fuel tanker manoeuvring.
7.12.2 Existing Traffic Conditions
Existing background traffic information was obtained from traffic counts conducted on the network on 28 March 2012 by Kantey and Templer. The key intersection in the study area, Container Road / Marine Drive / Paarden Eiland Road, was analysed in order to assess existing traffic operations during a typical weekday peak commuter period. The existing traffic includes traffic currently generated by the developments in the area to the south of Marine Drive. The existing traffic data is illustrated in Figure 7.14 below. According to the results of the SIDRA analysis it appears that the existing intersection is currently operating within the range of LOS C with side road delays during the morning and evening peak hours.
(1) Kantey and Templer. April 2012. Proposed Fuel Storage and Distribution Facility, Eastern Mole, Port of Cape Town: Traffic Impact Statement.

ENVIRONMENTAL RESOURCES MANAGEMENT BURGAN CAPE TERMINALS FEIR
7-18
Figure 7.14 Key intersection with existing traffic counts
Source: Kantey and Templer, April 2012.