66. physical properties of basalts from …. physical properties of basalts from holes 417d and 418a...
TRANSCRIPT

66. PHYSICAL PROPERTIES OF BASALTS FROM HOLES 417D AND 418A
Yozo Hamano, Geophysical Institute, Faculty of Sciences, University of Tokyo, Tokyo, Japan
INTRODUCTION
Legs 51-53 of the Deep Sea Drilling Project drilled threedeep holes (Holes 417A, 417D, and 418A) at the southwestend of the Bermuda Rise. These sites are located on magne-tic anomaly MO and the basement is estimated to be about100 m.y. old. These holes penetrated into the basementlayer by 209 (417A), 365.5 (417D), and 544 meters(418A), respectively. The good recovery in these holes as-sures that the recovered basement rocks are representativeof the upper part of Layer 2 at the sites.
In the present paper the results of the physical propertymeasurements on the basement rock samples from Holes417D and 418A are presented and their implications arediscussed. The physical properties examined are bulk den-sity, porosity, compressional wave velocity, shear wavevelocity, electrical resistivity, thermal conductivity, and airpermeability. Grain density, water content, Poisson's ratio,and other elastic constants are derived from the above ob-servations. All the physical properties except porosity andair permeability were measured on sea-water-saturatedsamples, since, for geophysical purposes, it is important toknow the physical properties of the basement rocks underin situ conditions.
From seismic experiments, Layer 2 is subdivided intothree Layers (2A, 2B, and 2C). Previous DSDP sites inwhich deep penetration into basement was attained are lo-cated in relatively young ocean crust and the recoveredrocks are mostly from Layer 2A, whereas the top of thebasement of the present sites is considered to be part ofLayer 2B. Comparison of the presently observed physicalproperties to earlier results, therefore, provides useful in-formation on the structure of the oceanic crust. Alternatively,the relation of seismic velocity to other physical propertiescan be used to estimate the in situ physical properties ofLayer 2, since the oceanic crust has been mainly investigatedby seismic refraction experiments and other physical proper-ties are only indirectly known. In the present study manyphysical properties were measured on each specimen in orderto provide a quantitative basis for such a discussion.
EXPERIMENTS
Measurements of physical properties were made both onboard Glomar Challenger and in our laboratory. Each speci-men was cut to the shape of a right cylinder with a 2.53-cmdiameter and a height of about 2.5 cm. In order to preservetheir in situ properties, each specimen was kept in sea waterbetween measurements and during transportation to ourlaboratory. Although the minicores had to be taken out of sea
water during each measurement, the disturbance can be ne-glected because of their slow drying rate.
The physical properties measured on board were bulk den-sity, porosity, and compressional wave velocity. Twomethods were employed to measure the bulk density oneach minicore. These were the GRAPE (Gamma Ray Atten-uation Porosity Evaluator) 2-minute counting procedure(Boyce, 1976) and a standard gravimetric immersiontechnique (Hyndman and Drury, 1977). In the present studythe estimated accuracies are ±2 per cent (GRAPE) and ±1per cent (immersion technique), respectively. Comparison ofthe results of the two measurements indicates that the twomethods give consistent values within the accuracy citedabove (Site 417 and 418 Reports, this volume).
The porosity measurements were carried out by weighingsea-water-saturated minicores before and after drying for 24hours at 110°C. As discussed by Hyndman and Drury (1977),the observed porosity may give a minimum estimate. A com-parison of the porosity values obtained by slightly differenttechniques on Legs 51, 52, and 53 suggests that the valuesreported here are accurate to ±5 per cent.
Compressional wave velocities were measured with theHamilton Frame velocimeter onboard ship. The experimen-tal procedure as well as the precision of the technique aregiven by Boyce (1976). In the present study the compres-sional wave velocity was measured in three different direc-tions on each minicore sample. The velocities in the verticaland horizontal directions show no systematic discrepancy.The isotropic property of Layer 2 basalts has been observedpreviously (Christensen and Salisbury, 1975). The results ofthe above measurements are reproducible to ±1.5 per cent.
After completion of the shipboard studies, the minicoresfrom Holes 417D and 418 A were brought to our laboratoryfor studies of compressional- and shear-wave velocity, bulkdensity, thermal conductivity, electrical resistivity, and airpermeability. The bulk densities were measured by an im-mersion technique similar to that used on shipboard. Theaccuracy of the measurement, ±0.5 per cent, is better thanthat of the shipboard measurement due to the lack of shipmovement and the use of a precise balance.
A standard pulse transmission method was employed tomeasure compressional and shear wave velocities. The highfrequencies used (2 and 1 mHz for VP and Vs, respectively),compared to that used in the Hamilton Frame (400 kHz),allowed measurements to be made to an accuracy of ± 1 percent. In addition, the compressional wave velocity of somebasalt samples was measured as a function of hydrostaticconfining pressure to 1 kbar. The mercury delay line em-ployed for this measurement permitted velocity measure-
1457
Y. HAMANO
ments to be made with an accuracy of about ±0.05 per cent.The bulk density and compressional wave velocity of fivesamples were measured both onboard ship and in ourlaboratory. The observed values agree with each other towithin the experimental error and show no systematic dis-crepancies . Although there are not enough data to prove theconsistency of the measurements in a statistical sense, wecombine both data sets in later discussions. Similar trendsobserved in the velocity/density relations of the two data setsalso tend to confirm the accuracy of the observations.
The electrical resistivity measurements were carried outat room temperature using a commercial AC bridge with afrequency of 1 kHz. The frequency dependence of the resis-tivity was examined on some samples for a frequency rangeof 100 Hz to 1 MHz. As has been observed previously(Katsube et al., 1977), the frequency dependence of sea-water-saturated samples in this frequency range is small.The data shown in Table 1 are therefore 1 kHz values. Theaccuracy of the measurement was about ±5 per cent.
The thermal conductivity was measured by a QTM-1thermal conductivity meter made by Showa Denko, whichuses a modified needle-probe technique. Because the appa-ratus is designed to measure samples with a large flat sur-face (5 cm × 10 cm), it had to be recalibrated for the presentstudy. Due to the small thermal conductivity of the basaltsamples, the correction factor was only about ±5 per cent.The nominal precision of the apparatus is ±5 per cent, butthe reproducibility of the measurement, when the sensorwas carefully set, was better than ±2 per cent.
Permeability measurements were carried out with acommercial gas-oil test machine which used compressed airfor the fluid medium. A pressure difference of about 7 barswas employed, together with a circumferential pressure of20 bars to avoid surface flow. The volume of air whichpassed through each sample was measured precisely by asmall pipette to obtain the permeability. The flow rate wasbetween 0.001 cnrVmin and 1 cπrVmin. It took about 30minutes to measure the most impermeable sample. Theshort measuring time, realized by using air instead of water,minimized environmental change during the measurement.
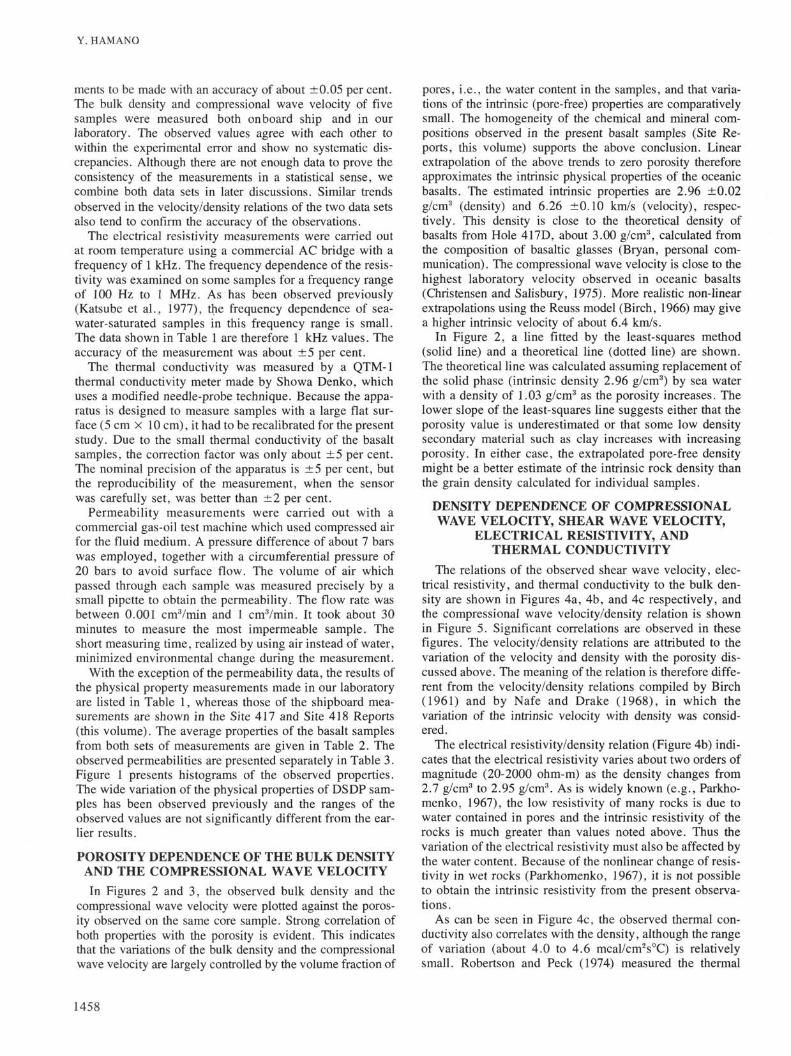
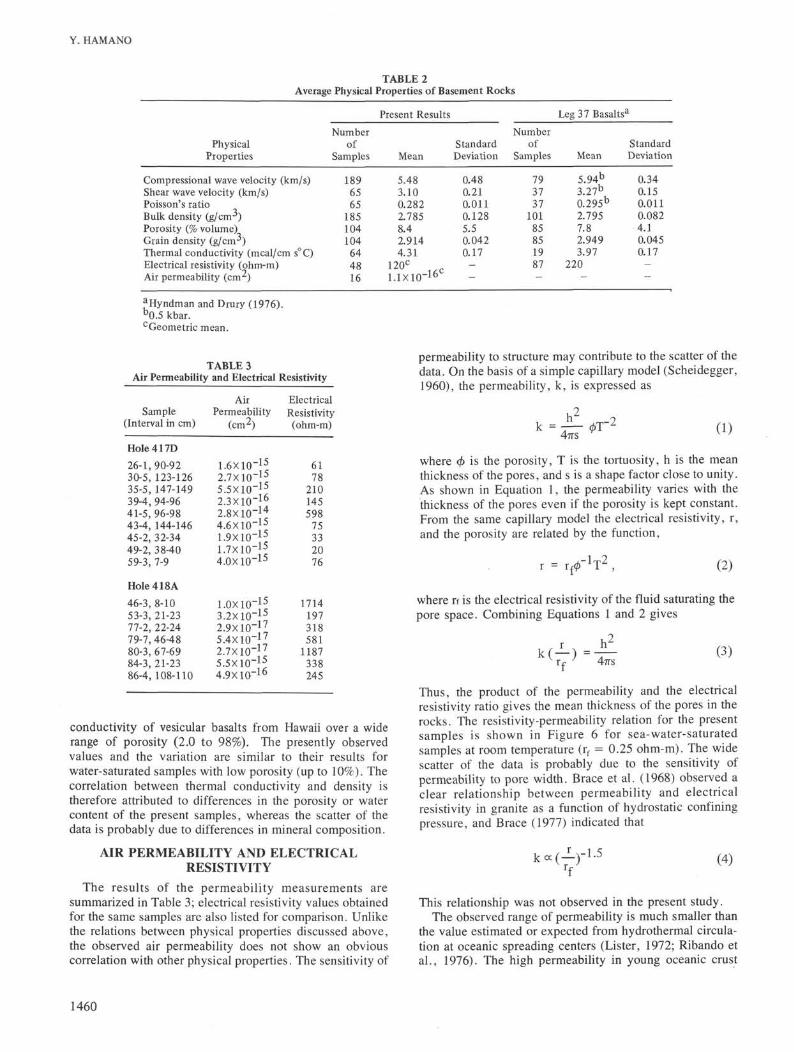
With the exception of the permeability data, the results ofthe physical property measurements made in our laboratoryare listed in Table 1, whereas those of the shipboard mea-surements are shown in the Site 417 and Site 418 Reports(this volume). The average properties of the basalt samplesfrom both sets of measurements are given in Table 2. Theobserved permeabilities are presented separately in Table 3.Figure 1 presents histograms of the observed properties.The wide variation of the physical properties of DSDP sam-ples has been observed previously and the ranges of theobserved values are not significantly different from the ear-lier results.
POROSITY DEPENDENCE OF THE BULK DENSITYAND THE COMPRESSIONAL WAVE VELOCITY
In Figures 2 and 3, the observed bulk density and thecompressional wave velocity were plotted against the poros-ity observed on the same core sample. Strong correlation ofboth properties with the porosity is evident. This indicatesthat the variations of the bulk density and the compressionalwave velocity are largely controlled by the volume fraction of
pores, i.e., the water content in the samples, and that varia-tions of the intrinsic (pore-free) properties are comparativelysmall. The homogeneity of the chemical and mineral com-positions observed in the present basalt samples (Site Re-ports, this volume) supports the above conclusion. Linearextrapolation of the above trends to zero porosity thereforeapproximates the intrinsic physical properties of the oceanicbasalts. The estimated intrinsic properties are 2.96 ±0.02g/cm3 (density) and 6.26 ±0.10 km/s (velocity), respec-tively. This density is close to the theoretical density ofbasalts from Hole 417D, about 3.00 g/cm3, calculated fromthe composition of basaltic glasses (Bryan, personal com-munication) . The compressional wave velocity is close to thehighest laboratory velocity observed in oceanic basalts(Christensen and Salisbury, 1975). More realistic non-linearextrapolations using the Reuss model (Birch, 1966) may givea higher intrinsic velocity of about 6.4 km/s.
In Figure 2, a line fitted by the least-squares method(solid line) and a theoretical line (dotted line) are shown.The theoretical line was calculated assuming replacement ofthe solid phase (intrinsic density 2.96 g/cm3) by sea waterwith a density of 1.03 g/cm3 as the porosity increases. Thelower slope of the least-squares line suggests either that theporosity value is underestimated or that some low densitysecondary material such as clay increases with increasingporosity. In either case, the extrapolated pore-free densitymight be a better estimate of the intrinsic rock density thanthe grain density calculated for individual samples.
DENSITY DEPENDENCE OF COMPRESSIONALWAVE VELOCITY, SHEAR WAVE VELOCITY,
ELECTRICAL RESISTIVITY, ANDTHERMAL CONDUCTIVITY
The relations of the observed shear wave velocity, elec-trical resistivity, and thermal conductivity to the bulk den-sity are shown in Figures 4a, 4b, and 4c respectively, andthe compressional wave velocity/density relation is shownin Figure 5. Significant correlations are observed in thesefigures. The velocity/density relations are attributed to thevariation of the velocity and density with the porosity dis-cussed above. The meaning of the relation is therefore diffe-rent from the velocity/density relations compiled by Birch(1961) and by Nafe and Drake (1968), in which thevariation of the intrinsic velocity with density was consid-ered.
The electrical resistivity/density relation (Figure 4b) indi-cates that the electrical resistivity varies about two orders ofmagnitude (20-2000 ohm-m) as the density changes from2.7 g/cm3 to 2.95 g/cm3. As is widely known (e.g., Parkho-menko, 1967), the low resistivity of many rocks is due towater contained in pores and the intrinsic resistivity of therocks is much greater than values noted above. Thus thevariation of the electrical resistivity must also be affected bythe water content. Because of the nonlinear change of resis-tivity in wet rocks (Parkhomenko, 1967), it is not possibleto obtain the intrinsic resistivity from the present observa-tions.
As can be seen in Figure 4c, the observed thermal con-ductivity also correlates with the density, although the rangeof variation (about 4.0 to 4.6 mcal/cm2s°C) is relativelysmall. Robertson and Peck (1974) measured the thermal
1458

PHYSICAL PROPERTIES OF BASALTS, HOLES 417D AND 418A
TABLE 1Physical Properties of Basement Rocks From Holes 417D and 418A
Sample(Interval in cm)
Hole417D
22-1, 141-14326-1, 90-9227-1, 119-12128-2, 54-5629-1, 88-9030-5, 123-12631-3, 74-7632-5, 133-13533-5,9-1134-2, 60-6335-5, 147-14936-1, 124-12637-5, 23-2538-4, 83-8639-4, 94-9640-1, 90-9241-5, 96-9842-5, 135-13743-4, 144-14644-3, 83-8545-2, 32-3448-6, 58-6049-2, 38-4052-2, 113-11552-4, 125-12754-4, 98-10055-1, 131-13359-3, 7-960-2, 44-4662-3, 21-2365-6, 30-3266-4, 144-14767-2, 80-83
Hole418A
42-1, 88-9043-1, 11-1345-1, 86-8946-3, 8-1048-3, 106-10949-1, 21-2350-3, 130-13252-7, 8-1053-3, 21-2356-6, 127-12957-6, 4-659-6, 53-5560-4, 43-4561-1, 7-962-1, 80-8263-2, 11-1364-4, 131-13365-4, 103-10566-6, 132-13468-2, 98-10069-4, 80-8273-6, 33-3574-4, 134-13676-1, 119-12177-2, 22-2477-3, 73-7579-7, 46-4880-2, 90-9280-3, 67-6983-4, 82-8484-3, 137-13985-5, 23-2586-4, 108-110
Density(g/cm3)
2.782.772.822.702.742.752.822.872.872.882.832.862.762.892.822.782.872.872.842.842.742.782.702.922.832.882.882.812.762.742.772.752.89
2.482.812.802.862.841812.872.852.862.862.902.772.732.902.832.812.762.692.892.912.922.872.941881912.912.902.932.921892.951932.81
CompressionalWave Velocity
(km/s)
5.235.075.605.085.175.245.505.835.945.945.845.645.67
—5.615.505.855.605.575.734.98
—-
—-
5.745.475.365.185.505.355.86
4.905.685.775.795.835.695.735.795.645.865.625.285.155.905.535.235.364.945.816.096.005.826.145.875.886.145.996.236.145.856.116.185.64
Shear WaveVelocity(km/s)
2.932.793.102.852.761843.063.283.243.313.253.003.13
-3.103.083.283.093.023.112.59
---——
3.133.071982.773.061973.27
2.703.173.243.293.233.103.183.233.143.253.062.852.823.283.061792.911703.193.403.283.183.373.223.233.403.283.453.323.143.383.353.03
ThermalConductivity(meal/cm s°C)
4.224.064.244.084.114.074.294.504.404.434.294.094.054.394.284.224.524.334.454.364.214.304.124.514.284.324.334.224.084.034.304.134.44
4.214.174.134.214.304.234.424.34
-4.534.504.29
-4.514.154.304.174.144.254.414.414.624.524.374.624.57
-4.384.434.64
-4.634.22
ElectricalResistivity
(ohm-m)
5861
103364178-
151121223210
5387-
145101598
697579333220
14189
203757651515370
325
39239283
1714--
264-
197-
140-43--90--96--
149--
318-
581-
1187-
338-
245
1459
Y. HAMANO
TABLE 2Average Physical Properties of Basement Rocks
PhysicalProperties
Compressional wave velocity (km/s)Shear wave velocity (km/s)Poisson's ratioBulk density (g/cm^)Porosity (% volume)Grain density (g/cm^)Thermal conductivity (meal/cm s°C)Electrical resistivity (ohm-m)Air permeability (cm2)
Numberof
Samples
1896565
185104104
64
4816
Present Results
Mean
5.483.100.2822.7858.42.9144.31
120c
LIXIO~16
StandardDeviation
0.480.210.0110.1285.50.0420.17
_-
Numberof
Samples
793737
10185851987-
Leg 37 Basaltsa
Mean
5.94b
3.27b
0.295b
2.7957.82.9493.97
220—
StandardDeviation
0.340.150.0110.0824.10.0450.17
——
aHyndman and Drury (1976).b0.5 kbar.cGeometric mean.
TABLE 3Air Permeability and Electrical Resistivity
Sample(Interval in cm)
AirPermeability
(cm2)
ElectricalResistivity(ohm-m)
Hole417D26-1, 90-9230-5, 123-12635-5, 147-14939-4, 94-9641-5,96-9843.4, 144-14645-2, 32-3449-2, 38-4059-3, 7-9
Hole418A
46-3, 8-1053-3, 21-2377-2, 22-2479-7, 46-4880-3, 67-6984-3, 21-2386-4, 108-110
1.6X10"15
2.7X10"15
5.5X10"15
2.3X10"16
2.8X10"14
4.6X101.9X10
-15-15
1.7X10"15
4.0X10'1 5
1.0X10"15
3.2X10"15
2.9X10"17
5.4X10'17
2.7X10"17
5.5X10"^4.9X10"16
6178
210145598
75332076
17141973185811187338245
conductivity of vesicular basalts from Hawaii over a widerange of porosity (2.0 to 98%). The presently observedvalues and the variation are similar to their results forwater-saturated samples with low porosity (up to 10%). Thecorrelation between thermal conductivity and density istherefore attributed to differences in the porosity or watercontent of the present samples, whereas the scatter of thedata is probably due to differences in mineral composition.
AIR PERMEABILITY AND ELECTRICALRESISTIVITY
The results of the permeability measurements aresummarized in Table 3; electrical resistivity values obtainedfor the same samples are also listed for comparison. Unlikethe relations between physical properties discussed above,the observed air permeability does not show an obviouscorrelation with other physical properties. The sensitivity of
permeability to structure may contribute to the scatter of thedata. On the basis of a simple capillary model (Scheidegger,1960), the permeability, k, is expressed as
(1)
where Φ *s m e porosity, T is the tortuosity, h is the meanthickness of the pores, and s is a shape factor close to unity.As shown in Equation 1, the permeability varies with thethickness of the pores even if the porosity is kept constant.From the same capillary model the electrical resistivity, r,and the porosity are related by the function,
r = (2)
where rt is the electrical resistivity of the fluid saturating thepore space. Combining Equations 1 and 2 gives
(3)
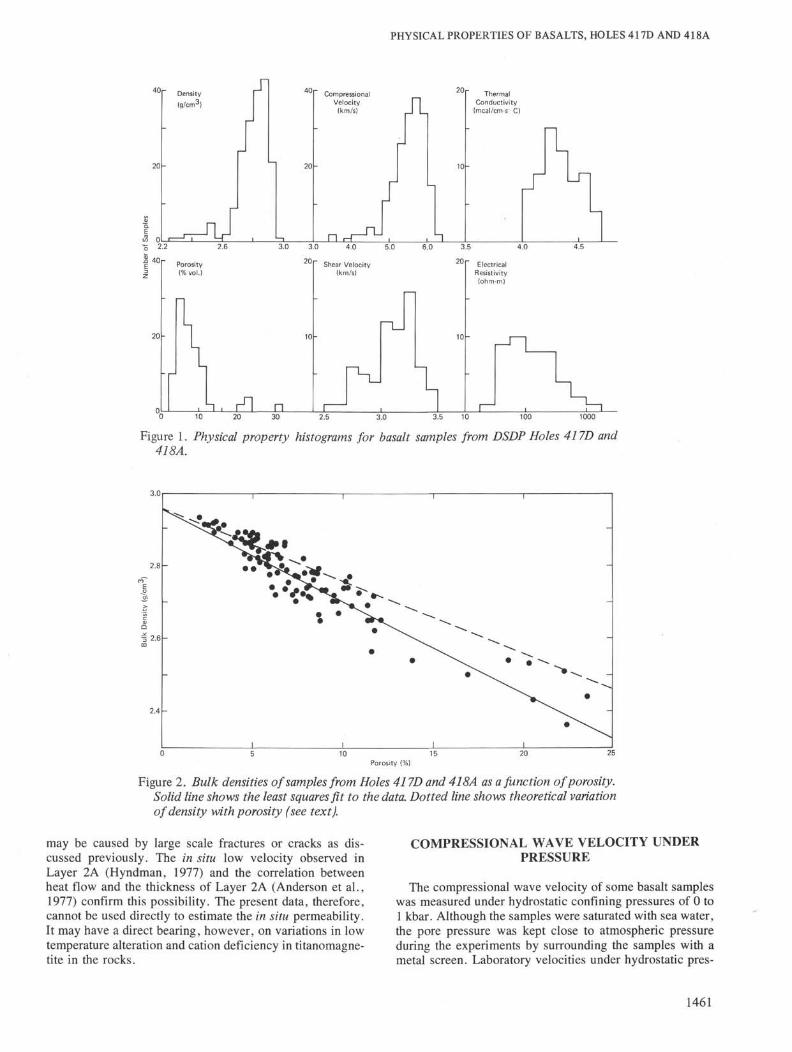
Thus, the product of the permeability and the electricalresistivity ratio gives the mean thickness of the pores in therocks. The resistivity-permeability relation for the presentsamples is shown in Figure 6 for sea-water-saturatedsamples at room temperature (rf = 0.25 ohm-m). The widescatter of the data is probably due to the sensitivity ofpermeability to pore width. Brace et al. (1968) observed aclear relationship between permeability and electricalresistivity in granite as a function of hydrostatic confiningpressure, and Brace (1977) indicated that
--Lr1.5V (4)
This relationship was not observed in the present study.The observed range of permeability is much smaller than
the value estimated or expected from hydrothermal circula-tion at oceanic spreading centers (Lister, 1972; Ribando etal., 1976). The high permeability in young oceanic crust
1460
PHYSICAL PROPERTIES OF BASALTS, HOLES 417D AND 418A
E<Λ 0
Density
(g/cm3)
CompressionalVelocity
(km/sl
ThermalConductivity
(mcal/cm-s C)
Porosity(% vol.)
Shear Velocity(km/s)
ElectricalResistivity
(ohm-m)
Figure 1. Physical property histograms for basalt samples from DSDP Holes 417D and418A.
2.8
ε
Bul
k D
en
2.4
1 1
•
-
1 1
1
i
i
-
-
"̂̂^i
Porosity (%)
Figure 2. Bulk densities of samples from Holes 41 ID and 418A as a function of porosity.Solid line shows the least squares fit to the data. Dotted line shows theoretical variationof density with porosity (see text).
may be caused by large scale fractures or cracks as dis-cussed previously. The in situ low velocity observed inLayer 2A (Hyndman, 1977) and the correlation betweenheat flow and the thickness of Layer 2A (Anderson et al.,1977) confirm this possibility. The present data, therefore,cannot be used directly to estimate the in situ permeability.It may have a direct bearing, however, on variations in lowtemperature alteration and cation deficiency in titanomagne-tite in the rocks.
COMPRESSIONAL WAVE VELOCITY UNDERPRESSURE
The compressional wave velocity of some basalt sampleswas measured under hydrostatic confining pressures of 0 to1 kbar. Although the samples were saturated with sea water,the pore pressure was kept close to atmospheric pressureduring the experiments by surrounding the samples with ametal screen. Laboratory velocities under hydrostatic pres-
1461

Y. HAMANO
10 15
Porosity (% volume)
Figure 3. Compressional wave velocity versus porosity for Holes 41 ID and 418A.
3.5
f 3.0
1 1
Φ
Φ
1
Φ mi
• Φ
Φ #
Φ *Φ
. • •
Φ *
Φ
i 1
1 '
Φ
\ -
%9ml I
t• Φ
Φ
Φ
-
1 i
2.6 2.8
Bulk Density
3.0
Figure 4a. Variation of shear wave velocity with density forbasalt samples from Holes 41 ID and 418A.
sure have been measured on a large number of oceanicbasalt samples obtained by drilling or dredging (Christensenand Salisbury, 1975; Hyndman, 1977). In these experi-ments the pressure varied from 0 to 10 kbar. Under in situconditions oceanic basement rocks are probably saturatedwith sea water at a pore pressure which varies betweenlithostatic and hydrostatic pressures (Brace, 1971). Thus, atthe bottom of Layer 2, the pore pressure probably variesbetween 700 and 1000 bars and the effective pressure, i.e.,the total pressure minus pore pressure, varies between 0 and300 bars. In the present experiments, therefore, the velocity
Bulk Density (g/
Figure 4b. Variation of electrical resistivity with densityfor samples from Holes 41 ID and 418A.
change in the low pressure range was carefully examined.The results of these measurements are shown in Figure 7.
The velocity increase is small and occurs largely between 0and 300 bars. It is to be noted that the amount of the velocityincrease is relatively constant and that the velocity of thelow velocity samples remains low even at 1 kbar pressure.This type of velocity variation has been observed previouslyfor oceanic basalts (Salisbury and Christensen, 1976) andelectrical resistivity data have been shown to display asimilar pressure variation (Drury, 1976). This behavior isquite different from that of continental rocks, in which the
1462

PHYSICAL PROPERTIES OF BASALTS, HOLES 417D AND 418A
Bulk Density (g/cm"3)
Figure 4c. Variation of thermal conductivity with densityfor samples from Holes 417D and 418A.
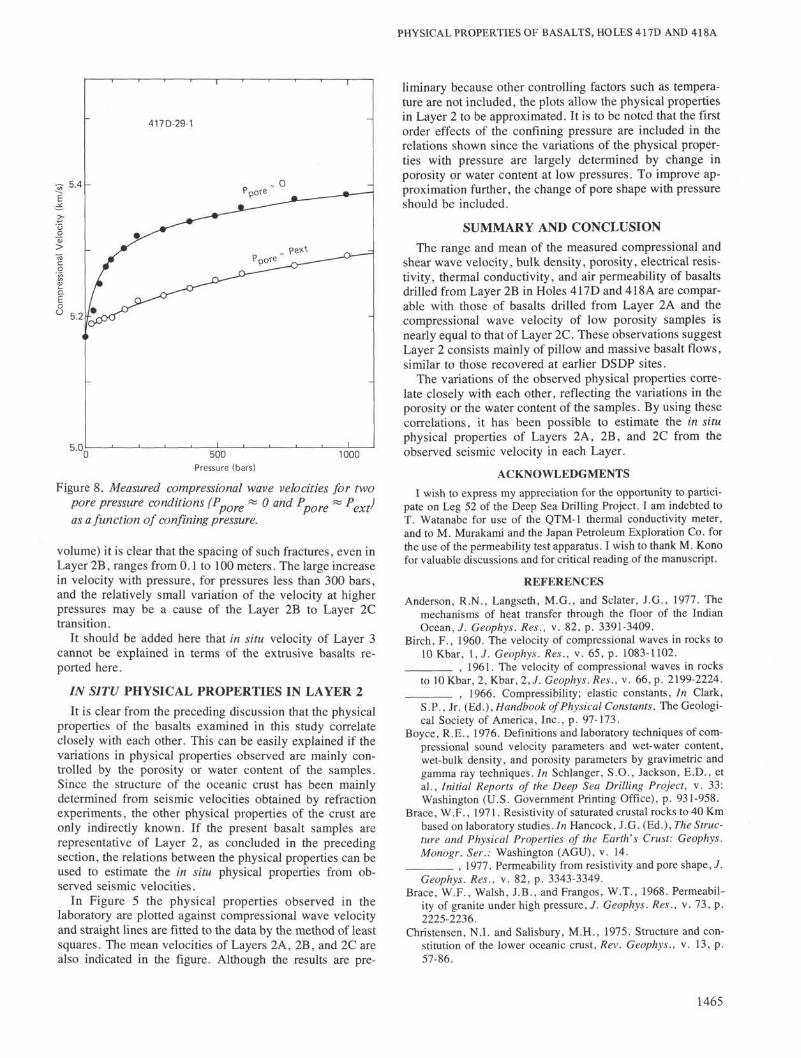
velocities commonly increase to pressures as high as 2 kbar(Birch, 1960; Kanamori and Mizutani, 1965). Since theintrinsic velocities of the present samples appear to be rathersimilar, low velocity materials may be responsible for thelow velocities observed in some samples under pressure.One possibility is that the low fluid permeability of therocks prevents draining of the pore fluid during the durationof the experiment (~2 hours). If this is the case, theobserved variation of velocity with pressure cannot be usedto estimate the in situ velocity of these rocks. At least oneline of evidence indicates, however, that this is not the case:in one run of the experiments, a confining pressure of 1 kbarwas maintained on a sample for about three days, but noappreciable change of velocity was observed. Followingthis experiment, the velocity was then measured as afunction of pressure without the surrounding screen (i.e.,the pore pressure was close to the external pressure). Thevariations in velocity with pressure for these two porepressure conditions are compared in Figure 8. The smallvelocity increase in the latter case indicates that the flow of
Compressional Velocity (km/s)4.0 5.0 6.0
o . U
2.6
2.2
3.0
2.0
101
-
-
-
-
-
-
\
<CM
CDCO
I
/
. ‰ I
×>
tCN
σi
j
•
i *•
^ ^
• *
t "
9(2C
)
oCD
1
#
•
- 0
- 20
- 4.7
-4.3 >
- 3.9
Figure 5. Variations of shear wave velocity, density, poro-sity, thermal conductivity, and electrical resistivity as afunction of compressional wave velocity. Mean com-pressional wave velocities of Layers 2A, 2B, and 2C areindicated by arrows.
water in the samples really controls the observed velocitychange.
From the above evidence it can be concluded that thepermeability of the rocks is not small enough to prevent theflow of pore water within the sample. The observedpermeabilities of some samples (Table 3) also support thisconclusion. Thus, low velocity materials such as clayminerals may be responsible for the low velocities observedin some samples. The existence of clay minerals is alsoinferred from the density-porosity relation discussed above.If this is the controlling mechanism, the observed pressurevariation can be applied to estimate the in situ velocity.From Figure 7, it is clear that the velocity increase at thebottom of layer 2 (i.e., the increase between 0 and 300 bars)
1463
Y. HAMANO
Air Permeability (cm )
Figure 6. Relationship between air permeability and elec-trical resistivity in samples from Holes 417D and 418A.Solid lines show effective pore width calculated fromEquation 3 in text.
is about 3.5 per cent, and is nearly independent of the initialvelocity.
ROCK COMPOSITIONS IN LAYER 2
From seismic refraction experiments, Layer 2 has beensubdivided into Layers 2A, 2B, and 2C (Houtz and Ewing,1976). Although the division is not clear and the velocityrange within each layer is broad and overlapping, the meanvelocity increases with depth in Layer 2 and the top Layer,2A, is characterized by low velocities (about 3.6 km/s).Layer 2A does not always exist under the ocean floor. In theAtlantic Ocean, for example, the layer is not observed atSites 417 and 418 and the recovered basement rocks areconsidered to be samples from Layer 2B. In contrast, theother deep basement penetration sites drilled to date in theAtlantic, such as Holes 332B and 395A, were drilled intoLayer 2A in young crust. Thus, Holes 417D and 418Apresent the first opportunity to compare basement rocksfrom Layer 2B with those from 2A. The data from Hole332B is best suited for such a comparison both because thehole is the deepest drilled in basement to date and becausethe data are presently available (Hyndman, 1977; Hyndmanand Drury, 1977). The average physical properties of theLeg 37 basalt samples obtained by Hyndman and Drury(1976) are shown in Table 2. Some caution is necessary incomparing the two sets of data. The velocities in the Leg 37basalt samples were obtained at a confining pressure of 0.5kbar whereas the present measurements were made at oneatmospheric pressure.
The observed ranges and the means of the bulk density,the porosity, and the electrical resistivity in both sets ofmeasurements are similar and no systematic discrepancy isobserved. After taking into consideration the mean velocityincrease of about 4 per cent at 0.5 kbar confining pressure(Figure 6), the observed velocities are also similar. Thethermal conductivity data show some discrepancies, but thedifference of the mean values is less than 10 per cent. Theabove comparison indicates that the physical properties of
> 5.5
417D-33-5
417D-29-1
500Pressure (bars)
1000
Figure 7. Measured compressional wave velocities for water-saturated samples from Holes 41 ID and 418A as a func-tion of confining pressure.
the basalt samples from Layers 2A and 2B are notsignificantly different from each other. The mineral orchemical compositions are also similar (Site Reports, thisvolume). The rock compositions of Layers 2A and 2B aretherefore considered to be similar. Thus, as concluded byHyndman (1977), the observed low velocity in Layer 2A isprobably caused by the presence of large scale fractures orcracks.
Although Layer 2C has not been drilled, some inferencesconcerning its composition can be drawn from the presentobservations. The in situ velocity in Layer 2C ranges fromabout 6.0 km/s to 6.5 km/s (Houtz and Ewing, 1976). Thehighest laboratory velocity observed in low porosity basalts(less than 3%) is within this range, which indicates thatLayer 2C may be composed of relatively crack-free lowporosity basalts.
From the foregoing discussion it is not unreasonable toassume that Layer 2 is mainly composed of extrusive pillowand massive basalt flows, as inferred from observations inophiolite complexes (Christensen and Salisbury, 1975). Thedifferences in mean velocity between Layers 2A, 2B, and2C are mainly caused by differences in porosity or the watercontent in the formation. The difference between Layers 2Aand 2B is probably caused by large scale pores or fracturesas discussed above. From a comparison of the present datawith the results of logging (Salisbury et al., this volume)and the oblique seismic experiment (Stephen et al., this
1464
PHYSICAL PROPERTIES OF BASALTS, HOLES 417D AND 418A
5 5 4
ε
>
1 Vel
oci
cgΦα.Eo
° 5.2
4
R n
i i i i i
417D-29-1
-
/
0Ppore
A—-—"
.—
1 i
-
-•——
.^——O——
-
I500
Pressure (bars)
1000
Figure 8. Measured compressional wave velocities for twopore pressure conditions (Ppore 0 and Ppore
as a function of confining pressure.
Pext>
volume) it is clear that the spacing of such fractures, even inLayer 2B, ranges from 0.1 to 100 meters. The large increasein velocity with pressure, for pressures less than 300 bars,and the relatively small variation of the velocity at higherpressures may be a cause of the Layer 2B to Layer 2Ctransition.
It should be added here that in situ velocity of Layer 3cannot be explained in terms of the extrusive basalts re-ported here.
IN SITU PHYSICAL PROPERTIES IN LAYER 2
It is clear from the preceding discussion that the physicalproperties of the basalts examined in this study correlateclosely with each other. This can be easily explained if thevariations in physical properties observed are mainly con-trolled by the porosity or water content of the samples.Since the structure of the oceanic crust has been mainlydetermined from seismic velocities obtained by refractionexperiments, the other physical properties of the crust areonly indirectly known. If the present basalt samples arerepresentative of Layer 2, as concluded in the precedingsection, the relations between the physical properties can beused to estimate the in situ physical properties from ob-served seismic velocities.
In Figure 5 the physical properties observed in thelaboratory are plotted against compressional wave velocityand straight lines are fitted to the data by the method of leastsquares. The mean velocities of Layers 2A, 2B, and 2C arealso indicated in the figure. Although the results are pre-
liminary because other controlling factors such as tempera-ture are not included, the plots allow the physical propertiesin Layer 2 to be approximated. It is to be noted that the firstorder effects of the confining pressure are included in therelations shown since the variations of the physical proper-ties with pressure are largely determined by change inporosity or water content at low pressures. To improve ap-proximation further, the change of pore shape with pressureshould be included.
SUMMARY AND CONCLUSION
The range and mean of the measured compressional andshear wave velocity, bulk density, porosity, electrical resis-tivity, thermal conductivity, and air permeability of basaltsdrilled from Layer 2B in Holes 417D and 418A are compar-able with those of basalts drilled from Layer 2A and thecompressional wave velocity of low porosity samples isnearly equal to that of Layer 2C. These observations suggestLayer 2 consists mainly of pillow and massive basalt flows,similar to those recovered at earlier DSDP sites.
The variations of the observed physical properties corre-late closely with each other, reflecting the variations in theporosity or the water content of the samples. By using thesecorrelations, it has been possible to estimate the in situphysical properties of Layers 2A, 2B, and 2C from theobserved seismic velocity in each Layer.
ACKNOWLEDGMENTS
I wish to express my appreciation for the opportunity to partici-pate on Leg 52 of the Deep Sea Drilling Project. I am indebted toT. Watanabe for use of the QTM-1 thermal conductivity meter,and to M. Murakami and the Japan Petroleum Exploration Co. forthe use of the permeability test apparatus. I wish to thank M. Konofor valuable discussions and for critical reading of the manuscript.
REFERENCES
Anderson, R.N., Langseth, M.G., and Sclater, J.G., 1977. Themechanisms of heat transfer through the floor of the IndianOcean, 7. Geophys. Res., v. 82, p. 3391-3409.
Birch, F., 1960. The velocity of compressional waves in rocks tolOKbar, 1,7. Geophys. Res., v. 65, p. 1083-1102.
, 1961. The velocity of compressional waves in rocksto lOKbar, 2, Kbar, 2,7. Geophys. Res., v. 66, p. 2199-2224.
1966. Compressibility; elastic constants, In Clark,S.P., Jr. (Ed.), Handbook of Physical Constants, The Geologi-cal Society of America, Inc., p. 97-173.
Boyce, R.E., 1976. Definitions and laboratory techniques of com-pressional sound velocity parameters and wet-water content,wet-bulk density, and porosity parameters by gravimetric andgamma ray techniques. In Schlanger, S.O., Jackson, E.D., etal., Initial Reports of the Deep Sea Drilling Project, v. 33:Washington (U.S. Government Printing Office), p. 931-958.
Brace, W.F., 1971. Resistivity of saturated crustal rocks to 40 Kmbased on laboratory studies. In Hancock, J.G. (Ed.), The Struc-ture and Physical Properties of the Earth's Crust: Geophys.Monogr. Ser.: Washington (AGU), v. 14.
, 1977. Permeability from resistivity and pore shape, 7.Geophys. Res., v. 82, p. 3343-3349.
Brace, W.F., Walsh, J.B., and Frangos, W.T., 1968. Permeabil-ity of granite under high pressure, 7. Geophys. Res., v. 73, p.2225-2236.
Christensen, N.I. and Salisbury, M.H., 1975. Structure and con-stitution of the lower oceanic crust, Rev. Geophys., v. 13, p.57-86.
1465

Y. HAMANO
Drury, M.J., 1976. Electrical resistivity of basalts, Leg 34. InHart, S.R., Yeats, R.S., et al., Initial Reports of the Deep SeaDrilling Project, v. 34: Washington (U.S. Government Print-ing Office), p. 549-552.
Houtz, R. and Ewing, J., 1976. Upper crustal structure as a func-tion of plate age, J. Geophys. Res., v. 81, p. 2490-2498.
Hyndman, R.D., 1977. Seismic velocity measurements of base-ment rocks from DSDP Leg 37. In Aumento, F., Melson,W.G., et al., Initial Reports of the Deep Sea Drilling Project,v. 37: Washington (U.S. Government Printing Office), p.373-388.
Hyndman, R.D., and Drury, M.J., 1976. The physical propertiesof oceanic basement rocks from deep drilling on the Mid-Atlantic Ridge, J. Geophys Res., v. 81, p. 4042-4052.
, 1977. Physical properties of basalts, gabbros, and ul-tramafic rocks from DSDP Leg 37. In Aumento, F., Melson,W.G., et al., Initial Reports of the Deep Sea Drilling Project,v. 37: Washington (U.S. Government Printing Office), p.395-402.
Kanamori, H. and Mizutani, H., 1965. Ultrasonic measurement ofelastic constants of rocks under high pressures, Bull. Earth-quake Res. Inst. Tokyo Univ., v. 43, p. 173-194.
Katsube, T.J., Frechette, J., and Collett, L.S., 1977. Preliminaryelectrical measurements of core samples, DSDP Leg 37. In
Aumento, F., Melson, W.G., et al., Initial Reports of the DeepSea Drilling Project, v. 37: Washington (U.S. GovernmentPrinting Office), p. All-All.
Lister, C.R.B., 1972. On the thermal balance of a mid-oceanridge, Geophys. J. Roy. Astron. Soc, v. 26, p. 515-535.
Nafe, J.E. and Drake, C.L., 1968. Physical properties of rocks ofbasaltic composition. In Hess, H. (Ed.), The PoldervaartTreatise on Rocks of Basaltic Composition: New York (Inter-science), p. 483-502.
Parkhomenko, E.I., 1967. Electrical Properties of Rocks: NewYork (Plenum Press).
Ribando, R.J., Torrance, K.E., andTurcotte, D.L., 1976. Numer-ical models for hydrothermal circulation in the oceanic crust, J.Geophys. Res., v. 81, p. 3007-3012.
Robertson, E.C. and Peck, D.L., 1974. Thermal conductivity ofvesicular basalt from Hawaii, J. Geophys. Res., v. 79, p.4875-4888.
Salisbury, M.H. and Christensen, N.I., 1976. Sonic velocities anddensities of basalts from the Nazca Plate, DSDP Leg 34. InHart, S.R., Yeats, R.S., et al., Initial Reports of the Deep SeaDrilling Project, v. 34: Washington (U.S. Government Print-ing Office), p. 543-546.
Scheidegger, A.E., 1960. The Physics of Flow Through PorousMedia: Toronto (University of Toronto Press).
1466