5º congreso argentino de gastroenterología, hepatología ... hepato nutri/pdfs/mericq... · 5º...
TRANSCRIPT

Gasto energético y composición corporal en pretérminos de muy bajo peso
5º Congreso Argentino de Gastroenterología, Hepatología y Nutrición Pediátricas Buenos Aires, Agosto de 2014
Verónica Mericq, Instituto de Investigaciones Materno Infantil
(IDIMI), Facultad de Medicina,Universidad de Chile
Departmento de Pediatria, Clinica Las Condes
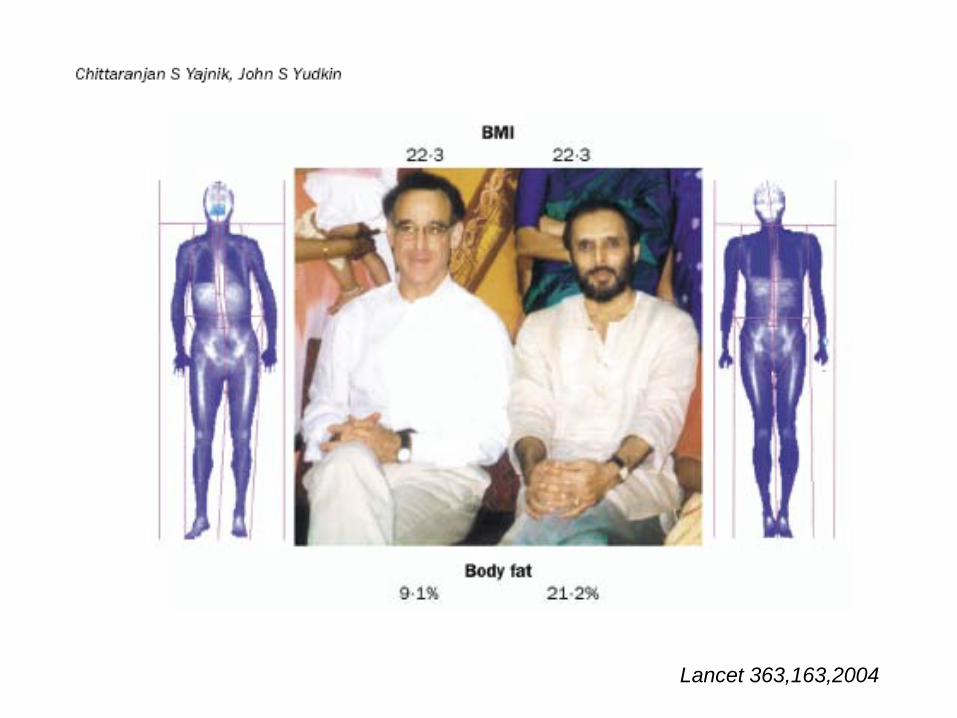
Lancet 363,163,2004


Requerimientos Energéticos
1.-Metabolismo basal (TMB) 2.-Respuesta metabólica a la alimentación3.-Actividad física4.-Crecimiento

Requerimientos Energéticos• 4.-Crecimiento. El costo de la energía del crecimiento tiene dos componentes: 1) la energía necesaria para sintetizar tejidos en crecimiento 2) la energía depositada en los tejidos.
1-3 Kcal/Kg+dia se requiere para 1 gr de crecimiento
El coste energético de crecimiento es ≈ 40 % primer mes, 35 % de las necesidades totales de energía
durante los primeros tres meses de edad, ≈ 17.5 % 3-6 meses, ≈ 6% 6-11m ≈ 3 % a los 12 meses ≈ 3 % en el segundo año, ≈ 1 a 2 % hasta mitad de la adolescencia

Tipo de alimentación: Pecho vs. Formula
• 4 estudios con niños amamantados vs. alimentados con fórmula muestran un mayor gasto energético total durante el primer año de vida
• En comparación con sus homólogos alimentados con leche materna
• A los 3 m 12 % + • A los 6 m 7 % +• A los 9 m 6 % +• A los 12 m 3 % +
• A los 18 y 24 meses, no hubo diferencia entre los bebés que aún reciben leche materna vs. solo formula.
Butte et al, 1990;. Butte et al, 2000b;. Jiang et al, 1998;. Davies et . al, 1990


u
u
u
uu
u u uu
u
u u
60
70
80
90
100
110
120
0 1 2 3 4 5 6 7 8 9 10 11 12
Ene
rgy
requ
irem
ent
(kca
l/kg/
d)
Age (mo)
1985 FAO/WHO/UNU recommendationu
1973 FAO/WHO Energy recommendations
¨
¨
¨
¨ ¨ ¨¨ ¨ ¨ ¨ ¨ ¨
2005 Boys: Proposed energy requirement2005 Girls: Proposed energy requirement
¨
Comparison of present estimates of energy requirements of infants (combined breast-and formula-fed infants) with 1973 & 1985 Reports

N=32 PT , 16 AEG,16PEG , EG: 35 ± 1sem, 7 dias
Bauer, etal. Horm Res 2011
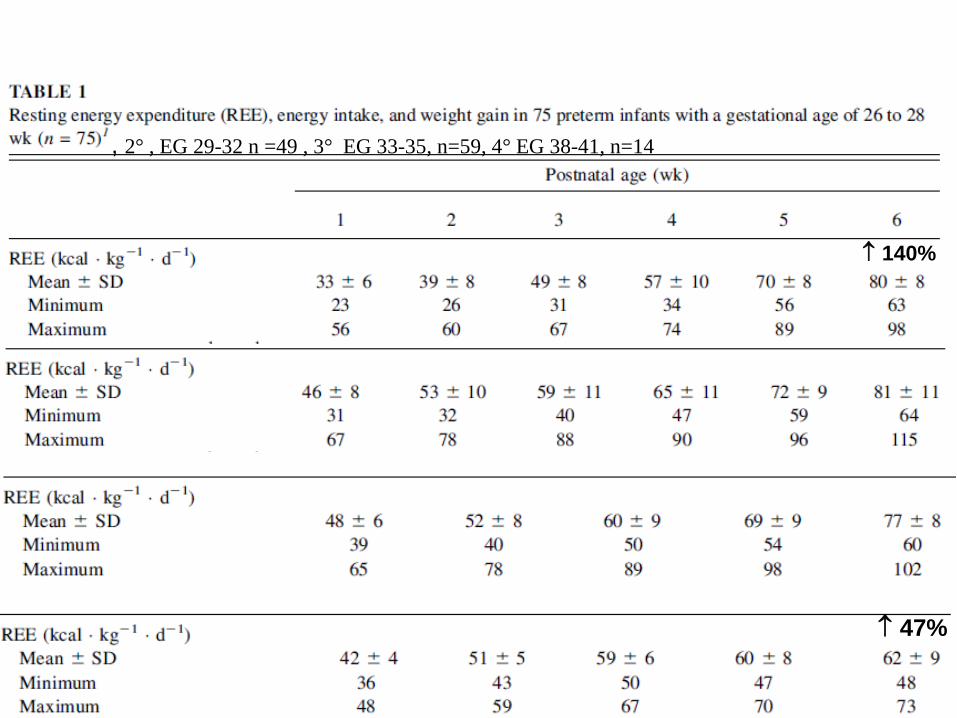
, 2° , EG 29-32 n =49 , 3° EG 33-35, n=59, 4° EG 38-41, n=14
↑ 140%
↑ 47%

El gen agouti se silencia al alimentar a la madre con donantes de grupos metilo:ac folico, B12, colina etc.
Moll cell Biol 2003
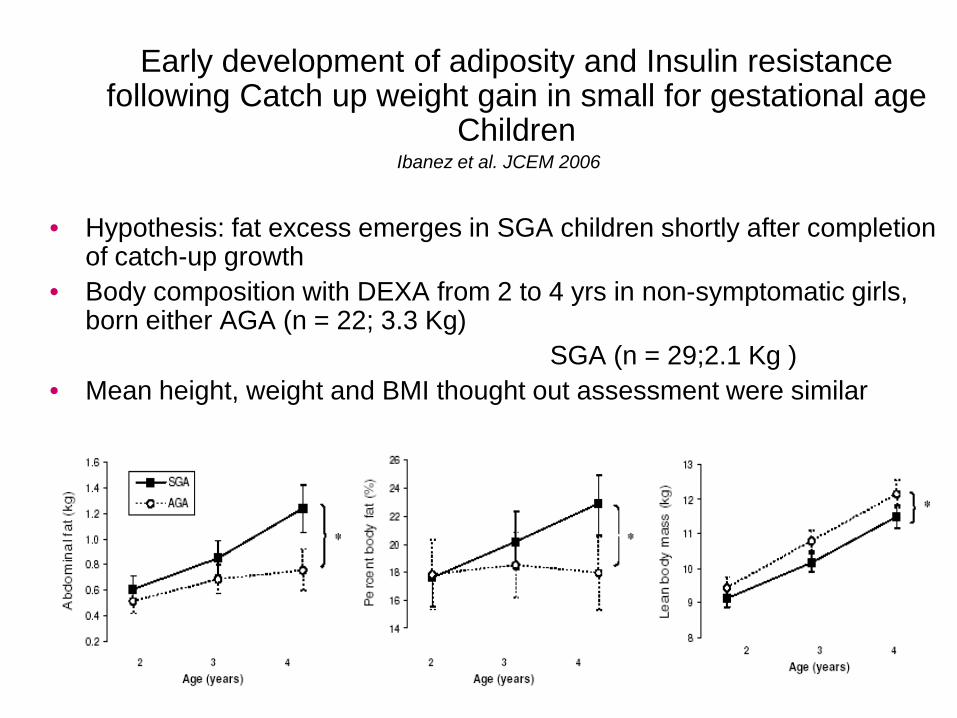
Early development of adiposity and Insulin resistance following Catch up weight gain in small for gestational age
Children Ibanez et al. JCEM 2006
• Hypothesis: fat excess emerges in SGA children shortly after completion of catch-up growth
• Body composition with DEXA from 2 to 4 yrs in non-symptomatic girls, born either AGA (n = 22; 3.3 Kg)
SGA (n = 29;2.1 Kg )• Mean height, weight and BMI thought out assessment were similar

Body composition of preterm subjects during infancy
Measurements at hosp discharge, term,3, 6 &12 mo 125 BW <1750
Rawlings et al Arch Dis Child fetal neonatal ed 1999

Pediatric Research,57,2005


LBW
Body composition ?REE ?
Infancy
Postnatal catch-up growth
In-uteroAdverse EnvironmentAGA vs SGA?
PretermPostnatal Stress?

Horm Res Ped 2013
N=67 , 40 AGA

Asociaciones entre la ganancia de peso en diferentes períodos del primer año de vida y gasto
energético, composición corporal y parámetros metabólicos a los 6.7 años
-20
-15
-10
-5
0
5
10
15
20
REE kcal/d % ox lipids FM kg LM kg % FM % FM ROI % FM trunk
Insulin pmol/l
β (C
I 95%
)A. Term CA to 3m
* ** *
-20
-15
-10
-5
0
5
10
15
20
REE kcal/d% ox lipids FM kg LM kg % FM % FM RO
β (C
I 95%
)
B. 3m to 6m
-20
-15
-10
-5
0
5
10
15
20
REE kcal/d % ox lipids FM kg LM kg % FM % FM ROI % FM trunk
Insulin pmol/l
β (C
I 95%
)
C. 6m to 9m
* * *
-20
-15
-10
-5
0
5
10
15
20
REE kcal/d% ox lipids FM kg LM kg % FM % FM RO β
(CI 9
5%)
D. 9m to 12m
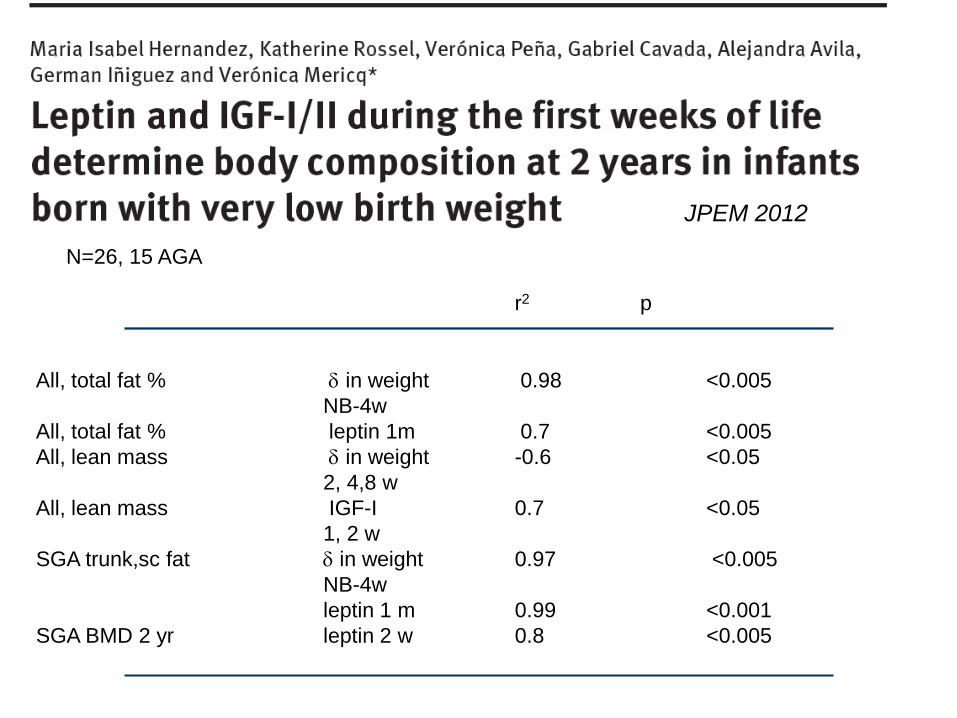
JPEM 2012
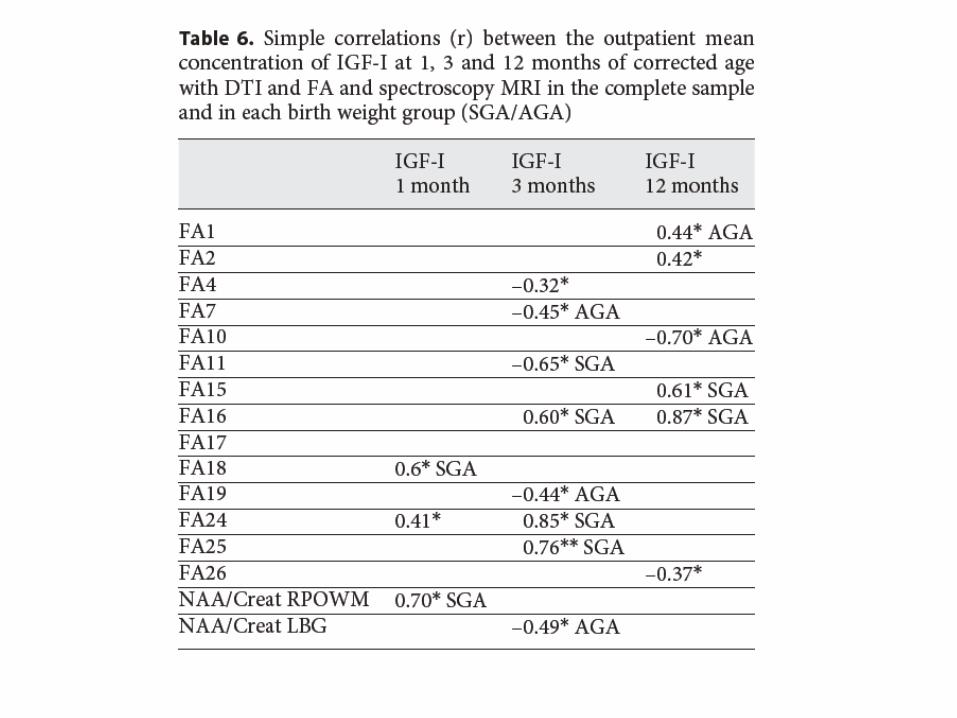
r2 p
All, total fat % δ in weight 0.98 <0.005NB-4w
All, total fat % leptin 1m 0.7 <0.005All, lean mass δ in weight -0.6 <0.05
2, 4,8 wAll, lean mass IGF-I 0.7 <0.05
1, 2 w SGA trunk,sc fat δ in weight 0.97 <0.005
NB-4w leptin 1 m 0.99 <0.001
SGA BMD 2 yr leptin 2 w 0.8 <0.005
N=26, 15 AGA

BMD BMC % of fat mass Trunk fat mass Limb fat mass Lean mass AGA n=23 0.14±0.14 -0.66±1.401.13±3.10 2.67±5.09 1.90±2.87 -2.04±1.40SGA n=16 0.08±0.12 -1.22±1.900.87± 2.90 0.50±2.01 -0.23±2.75 -2.52±0.96 p= non adjusted 0.07 ns ns 0.04 0.02 nsp= adjusted ns ns ns 0.09 0.03 ns
•At 2 yrs no differences in BMD nor BMC between VLBW vs Term, however they had more fat mass and less lean mass.
•VLBW AGA had more fat mass in limbs and trunk tan those born SGA.
•This latter difference was lost when adjusted by height SDS.
• Follow-up of these patients will allow to determine whether these differences ameliorate or increase at older ages.
New data with new feeding protocol ….

Plos 0ne 2011
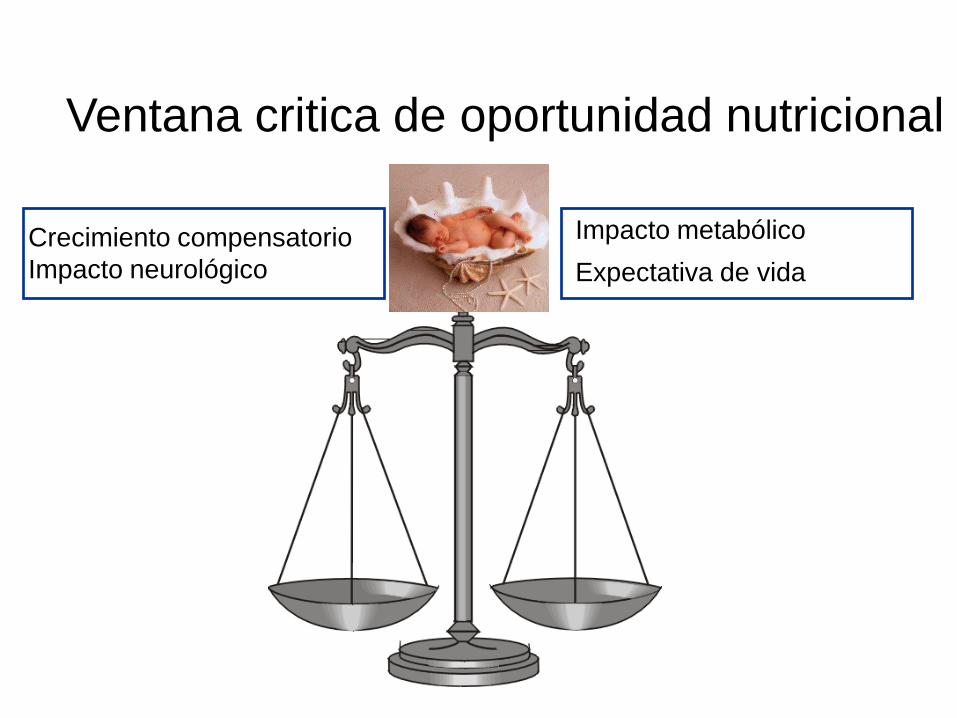
Ventana critica de oportunidad nutricional
Impacto metabólico Expectativa de vida
Crecimiento compensatorioImpacto neurológico


LBW
insulin sensitivity/secretion
Infancy
Postnatal catch up growth
Nutrition

Premies???

Higher CH intake in the first monthof life was associated with greater weight gain after birth
Regan, F. Pediatrics 18, 5, 2006

J Ped Gastroenterolgy 2010
Pediatrics 2009, JPGN 2010
Zachariassen G, Pediatrics 2011 American J of Clinical Nutrition 2006

Roggero P, Pediatrics 2012 Nov;130(5):e1215-21.

PROTOCOLSubjects
Premterms < 32 W GA or/and <1500 grams belonging to the follow-up national program
Age 28 d 1 m 6 m3 m 12 m9 m 24m18 m
Discharge
EVALUATION
NICU time ALPAREnteral
34-40 s
July 2004-July 2005
Preterm formula Term formula
NB < 1000 and/or BPD Preterm formula
Historic control Group July 2002- July 2003
Term formula Fortified cow milk
Follow-up Clinic (Antropomethry , Nutrition)
DEXAGlycemiainsulin
Preterm vs term formulaMore Essential lipids (PUFAs) DHA

J of Pediatrics 2011
ControlN= 529
Intervention N= 560
p
Birth Weight (gr)
1245 ± 310 1226 ± 291 ns
Length (mm) 377 ± 32 376 ± 32 ns
HC (mm) 272 ± 25 271 ± 23 ns
GA W 29.9 ± 2.4 29.6 ± 2.4 nsMales % 52 55 ns< 1000 (n, %) 116, 22 129, 23 nsSGA % 44.8 39.5 ns


J of Pediatrics 2011

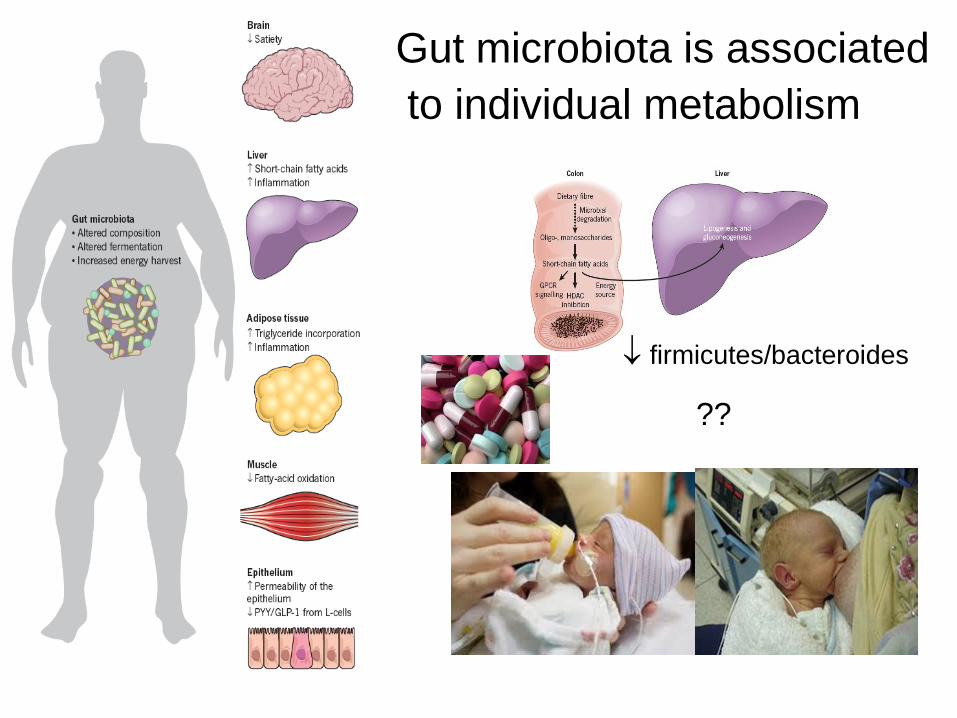
Gut microbiota is associatedto individual metabolism
??
↓ firmicutes/bacteroides
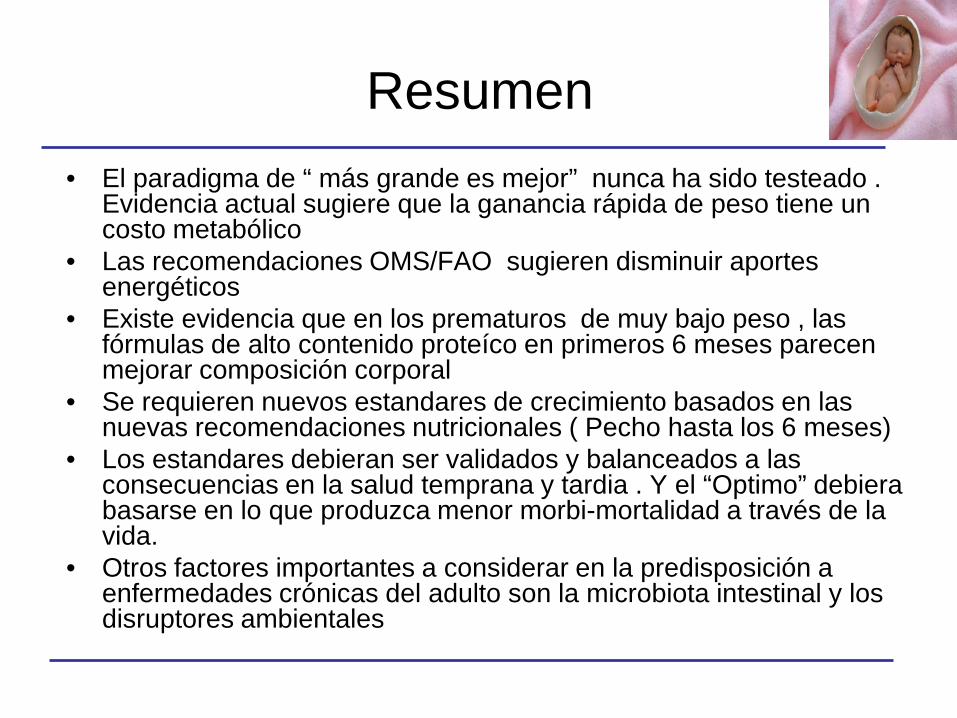
Resumen• El paradigma de “ más grande es mejor” nunca ha sido testeado .
Evidencia actual sugiere que la ganancia rápida de peso tiene un costo metabólico
• Las recomendaciones OMS/FAO sugieren disminuir aportes energéticos
• Existe evidencia que en los prematuros de muy bajo peso , las fórmulas de alto contenido proteíco en primeros 6 meses parecen mejorar composición corporal
• Se requieren nuevos estandares de crecimiento basados en las nuevas recomendaciones nutricionales ( Pecho hasta los 6 meses)
• Los estandares debieran ser validados y balanceados a las consecuencias en la salud temprana y tardia . Y el “Optimo” debiera basarse en lo que produzca menor morbi-mortalidad a través de la vida.
• Otros factores importantes a considerar en la predisposición a enfermedades crónicas del adulto son la microbiota intestinal y los disruptores ambientales

Recommendations Energy Intake 0-24 months
0
200
400
600
800
1000
1200
1400
1 2 3 4 5 6 7 8 9 10 11 12 18 24
FAO/WHO 1985FAO/WHO 2006
Age (months)
Ener
gy (
kcal
/d)

• Analysis of thirteen studies with DLW performed on a total of 417 healthy, well-nourished, non-stunted, infants 0-12 months old.
• Several studies conducted repeated measurements of TEE at 2-3 month-intervals, increasing the number data points to 854.
• Eleven investigations were done in the UK, the USA, and the Netherlands, and two in developing countries (Chile and China).
• Recommendation is the sum of TEE plus energy needed for tissue deposition. Values are 15 % lower than 1985 data based on intake
• Values from breast fed infants are about 5 % lower that for formula fed
Total Energy Expenditure in Infants for the 2004 Energy Report:

u
u
u
uu
u u uu
uu u
1985 FAO/WHO/UNU recommendationu
60
70
80
90
100
110
120
0 1 2 3 4 5 6 7 8 9 10 11 12
Ene
rgy
requ
irem
ent
(kca
l/kg/
d)
Age (mo)
1973 FAO/WHO Energy recommendations
1985 Historic energy intake of infants
WHO. Energy and protein requirements. Report of a joint FAO/WHO/UNU Expert Consultation. Geneva: WHO Technical Report Series, No. 724, 1985

4,6
5
5,4
5,8
6,2
6,6
1 2 3 4 5 6 7 8 9 10 11 12
DeuteriumOxygen-18
Enrich
men
t ( pp
m)
Doubly labeled water technique
Energy Expenditure

Mean from Linear Regression95% Confidence interval for the mean
95% Prediction interval for estimate
Linear relationship and 95% Confidence Intervals of equation to predict TEE from body weight in healthy infants, 1–24 months old FAO/WHO 2005

Mean from Linear Regression 200595% Prediction interval for estimate
IMPLICATIONS OF APPROACH USED TO ESTIMATE ENERGY NEEDS IN TERMS OF SUFFIENCY OF HUMAN MILK AS AN EXCLUSIVE SOURCE OF
FOOD FOR FIRST MONTHS OF LIFE.
Breast milk
Mean from 1985 recommendations95% Prediction interval for estimate
FAO/WHO 1973 recommendations 3 months 120 Kcal/kg
FAO/WHO/UNU 2004 recommendations 6 months 80 Kcal/kg allows for up to 6 mo of exclusive breast feeding 7-7.5 kg baby

• Growth is a sensitive indicator of whether an infant’s energy requirements are satisfied.
• Energy demands for growth constitute about 35% of the total energy requirement during the first three months of age (40% in the first month),
• They drop by half in the following trimester (17.5%), and further reduced to < 6% in the second semester of life and to 3% at 12 months).
• Energy for growth falls to less than 2% of daily requirements in the second year, remains between 1 and 2% until mid-adolescence, and gradually disappears before 20 years of age.
Energy Needs for Infant and Child Growth

1985 FAO/WHO/UNU recommendation
uu
uu
u u u u u uu u
0
20
40
60
80
100
120
0 1 2 3 4 5 6 7 8 9 10 11 12
Ene
rgy
requ
irem
ent
(kca
l/kg/
d)
Age (mo)
u
2005 Boys: Proposed energy requirement
2005 Girls: Proposed energy requirement
2005 estimates of energy requirements of infants (breast-and formula-fed infants) compared with 1985 FAO/WHO/UNU Report

Mean from Linear Regression 200595% Confidence interval for the mean95% Prediction interval for estimate
Linear relationship and 95% Confidence Intervals of equation to predict TEE from body weight in healthy infants, 1–24 months old FAO/WHO 2005
Breast milk
Mean from 1985 recommendations95% Prediction interval for estimate
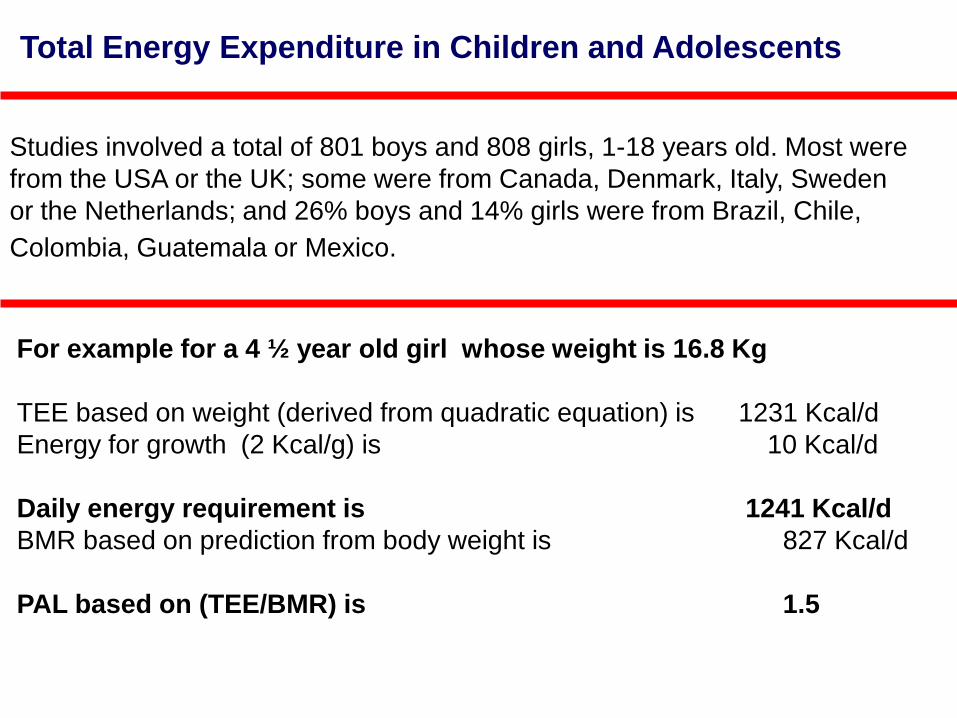
Studies involved a total of 801 boys and 808 girls, 1-18 years old. Most were from the USA or the UK; some were from Canada, Denmark, Italy, Sweden or the Netherlands; and 26% boys and 14% girls were from Brazil, Chile, Colombia, Guatemala or Mexico.
For example for a 4 ½ year old girl whose weight is 16.8 Kg
TEE based on weight (derived from quadratic equation) is 1231 Kcal/d Energy for growth (2 Kcal/g) is 10 Kcal/d
Daily energy requirement is 1241 Kcal/d BMR based on prediction from body weight is 827 Kcal/d
PAL based on (TEE/BMR) is 1.5
Total Energy Expenditure in Children and Adolescents

“Dietary challenges during childhood: Meeting nutritional needs and tackling long-term outcomes” Prof Ricardo Uauy, Professor of Public Health Nutrition and Institute of Nutrition U of Chile, London School of Hygiene and Tropical Medicine UK.
• Have we been overfeeding babies and young children for the last 20 years because recommendations were based on false assumptions rather than on daily energy expenditure ?
• Should we modify the current energy recommendations for infants, children and adolescents, to correct over-or underestimations ?
• Have we been underestimating obesity and promoting overweight by using the CDC/NCHS USA growth standards ?
• Is faster growth and bigger size necessarily better? How should we define optimal growth ?