5467470000 capacity markets in europe final february 2014 v1 4
TRANSCRIPT

Capacity Markets in Europe: Impacts on Trade and Investments A Sweco Multiclient Study February, 2014 Proj no: 5467470000
Insights. Delivered.

February, 2014 2 A Sweco Multiclient Study
Capacity Markets in Europe: Impacts on Trade and Investments
Copyright © 2014 Sweco Energuide AB All rights reserved
No part of this publication may be reproduced, stored in a retrieval system or transmitted in any form or by any means electronic, mechanical, photocopying, recording or otherwise without the prior written permission of Sweco Energuide AB.

February, 2014 3 A Sweco Multiclient Study
Capacity Markets in Europe: Impacts on Trade and Investments
Disclaimer
While Sweco Energuide AB (”Sweco) considers that the information and opinions given in this work are sound, all parties must rely upon their own skill and judgement when making use of it. Sweco does not make any representation or warranty, expressed or implied, as to the accuracy or completeness of the information contained in this report and assumes no responsibility for the accuracy or completeness of such information. Sweco will not assume any liability to anyone for any loss or damage arising out of the provision of this report.

February, 2014 4 A Sweco Multiclient Study
Capacity Markets in Europe: Impacts on Trade and Investments
Study members This study has been financially supported by the study members. The members have also contributed with their insights, comments and suggestions during steering committee meetings and workshops throughout the study, which has been of great benefit for the study. However, all conclusions and errors are the responsibility of the analysis team. The conclusions do not necessarily reflect the view or positions of the study members collectively nor of any individual study member. The steering committee for the study has consisted of representatives from the founding members and the regulatory members.
Founding members
Regulatory members
Ordinary study members

February, 2014 5 A Sweco Multiclient Study
Capacity Markets in Europe: Impacts on Trade and Investments
Analysis team
This study has been carried out by a team from Sweco Energy Markets supported by two external experts:
Project director: Niclas Damsgaard (Sweco) External policy advisor: Gunnar Lundberg (EE Management AB)
External academic advisor: Laurens de Vries (Delft University of Technology)
Sweco analysis team:
Tobias Jakobsson, Fadi Bitar, Jakob Helbrink, Per-Erik Springfeldt, Rachel Walsh, Andrea Badano, Emma Eriksson, Alla Evdokimova
For further inquiries, please contact:
Niclas Damsgaard
E-mail: [email protected] Tel: +46-8-695 6433
February, 2014 6 A Sweco Multiclient Study
Capacity Markets in Europe: Impacts on Trade and Investments
Table of Contents Key Abbreviations and Terms 7 Executive summary 9 1 A changing market 16 2 Scope of the study 17 3 Scenarios and policies 18 4 Security of supply in a historical context 24 5 Investments under risk and uncertainty 27 6 Comparative analysis of some existing and planned capacity remuneration mechanisms 29 7 The Russian capacity mechanism – Impact on trade 34 8 Interconnectors and cross-border trade in capacity 36 9 Impact on overall system cost 42 10 Price impact and customer costs 47 11 Impact on investment in electricity generation capacity 58 12 Investment in interconnectors 62 13 Security of supply 68 14 Additional impacts 71 15 Final discussions 76 16 Conclusions 79 Appendix 84

February, 2014 7 A Sweco Multiclient Study
Capacity Markets in Europe: Impacts on Trade and Investments
Key Abbreviations and Terms
CPI Current Policy Initiatives
CPS Coordinated Policy Scenario
CRM capacity remuneration mechanism
DST Diversified Supply Technologies
ICM Integrated Capacity Market
NP National Policy
RES renewable energy sources
TM Target Model
Term Standard Unit Description
System cost EUR The sum of the total costs of generation and the total capital costs of all new thermal capacity installed. It does not include the capital costs of existing generation or new renewable capacity.
Customer cost EUR/MWh This cost includes the combined payments for electricity (energy), renewables subsidies and any capacity payment (excluding grid costs), divided by the total consumption for each bidding area.
Capacity cost EUR/MWh The total cost of all capacity accepted into the capacity market in each respective region, divided by the total consumption there.
Capacity price EUR/kW The marginal bid of capacity into each of the national capacity markets.
RES subsidies EUR/MWh The sum of the subsidy needs for each RES technology, calculated as the difference between the technology’s expected costs in 2030 and the market revenues that it can earn, divided by the total consumption.

February, 2014 8 A Sweco Multiclient Study
Capacity Markets in Europe: Impacts on Trade and Investments
February, 2014 9 A Sweco Multiclient Study
Capacity Markets in Europe: Impacts on Trade and Investments
Executive summary
This Sweco Multiclient Study was carried out against the backdrop of the large changes that the European power markets are undergoing. The phase-in of large volumes of subsidized renewable electricity with low marginal costs is changing the way power markets operate fundamentally. It is likely that we will see much more volatile markets in which extreme prices become much more frequent.
Conventional thermal power plants are likely to be used much less, while the renewable energy subsidization policies put pressure on the price level in the wholesale market. This provides challenges for financing investment in conventional thermal power plants that are needed for the stability of the system.
In this study we made use of Sweco’s European power market model Apollo, in order to quantify various effects of the introduction of capacity markets. We have analysed two different supply technology scenarios and four different market design policies, to provide a thorough understanding of the consequences of different choices.
The two supply scenarios – the Current Policy Initiatives (CPI) and the Diversified Supply Technologies (DST) – represent two possible decarbonisation futures; they are distinguished by a much larger quantity of renewable energy technologies in the DST, as well as different fuel prices and higher carbon prices than the in CPI scenario.
The four market designs represent different ways in which capacity markets could be introduced in Europe – with the Target Model having no capacity market, the Integrated Capacity Market involving a European-wide capacity market, and two “patchwork” designs in which selected countries have capacity markets but differ in how capacity and energy is traded between the different market regions.
The following Lessons Learned summarise the main insights and conclusions from the study. They have arisen through the development of the scenarios and detailed assumptions to input to the model, the analysis of the model results, and key discussions with study members.
Lessons learned
As long as capacity markets are implemented correctly and do not allow for too significant distortions, the different market design choices have limited impacts on the European system cost, which includes costs for production and capital for new thermal capacity.
The analysis shows that at the European level the system costs are similar in different market designs. The presence of a capacity market leads overall to a greater quantity of capacity being introduced. On the one hand, this increased volume of new capacity increases capital costs but, on the other, reduces variable costs of production as more technologies with lower variable costs are available.
Overall, if capacity markets are present the system cost is slightly higher; with a European-wide capacity market the European system cost increase by approximately 2%, with increased capital costs outweighing reduced production costs and reduced cost of shortages. The model setting, however, is deterministic; in practice

February, 2014 10 A Sweco Multiclient Study
Capacity Markets in Europe: Impacts on Trade and Investments
these increased costs may be offset by a larger reduction in the risk of electricity shortages than captured by the model.
Moving from the European perspective to individual countries, the regional system costs are affected to a larger extent by the different capacity market designs. When taking cross-border trade into account the differences do become smaller but are still present, with different countries seeing different effects. These changes arise from the relocation of investments between the market designs. These give an indication as to how each market design can affect individual regions in different ways, and can each change the relative proportions of costs of production, imports, and capital expenditure that make up the regional system costs.
In our analysis, both the Target Model and the different capacity market designs are implemented without significant regulatory or market failures. Additionally, the model setting is deterministic, with investment levels being those considered optimal for the given assumptions. In reality, these could look somewhat different with more extreme effects possible.
In the coming decade, the need to support new investment in generation is limited in most countries, but there is a risk of closing or mothballing of excessive amounts of existing capacity due to lacking profitability.
In the short to medium run, power prices are likely to be low due to a combination of factors. Subsidisation of renewable power generation and the financial crises all are contributing causes. Coal-powered generation is in a better position than gas-powered generation as it sits lower in the merit order, at least at the foreseeable carbon prices in this timeframe.
In most countries there is no, or a very limited, need for investment in new thermal generation in the next 10 years, but there is a clear risk that existing units will be closed or mothballed. Some closure or mothballing is likely needed and makes for a more efficient system; however there is a risk, with the many uncertainties about future revenues in this shorter term, that too much capacity will be closed. This would increase the vulnerability of the system and could cause capacity shortages. Solutions would be found by TSOs, but the costs could be significant. Capacity remuneration mechanisms may serve to
maintain capacity that otherwise would be closed or mothballed.
Regardless of the market designs, there is a substantial amount of investment in generation needed to avoid very high prices in the longer run.
In the Target Model, there are a few hours in many regions in which demand cannot be met by that generation capacity installed based on wholesale electricity revenues. With lack of perfect foresight, there will likely be over- or underinvestment compared to an optimal level. Underinvestment would significantly increase the amount of unserved demand, and is perhaps more likely than overinvestment given the current risks and uncertainties facing conventional thermal generation plants.
The introduction of a capacity market is likely to increase the amount of generation capacity installed towards 2030, compared to the Target Model, since it is designed to reduce the amount of physical shortage in the system and thus will limit high peak prices on the spot market.
Policy uncertainty for investors will remain even with the introduction of capacity mechanisms –

February, 2014 11 A Sweco Multiclient Study
Capacity Markets in Europe: Impacts on Trade and Investments
different technologies are preferred under different policy and market assumptions – and investing in the “wrong” technology is still possible. Additionally, investors must believe in the credibility and longevity of the capacity market design if they are to invest expecting to receive revenues in the future from the mechanism.
An investor’s cash flow, however, is likely to be less negatively affected by wrong investment choices under a capacity mechanism, as a plant is likely to earn revenue from the capacity market even if it is mostly out of the merit order.
Total customer costs are typically higher in countries introducing capacity markets, while they may be reduced in neighbouring countries.
Wholesale power prices are reduced when capacity markets are introduced, and the spillovers between countries are in some cases substantial.
Customer costs include the wholesale power price, the capacity cost for the additional capacity if a region has a capacity market, and the cost of subsidies for renewable energy sources (RES)
which are calculated as the missing money for these technologies given the wholesale power price.
In those regions that introduce capacity markets, this decrease in wholesale price is typically more than offset by the cost of capacity in the capacity markets. In addition, the need for subsidies to RES generation increases when capacity markets are introduced. This is explained by the fall in wholesale power price in combination with the fact that most RES technologies will earn limited revenues from the capacity market.
In capacity-market regions, despite the fall in wholesale power prices, the capacity costs and the increased costs for renewable subsidies both result in a small increase in the overall customer cost, in our model results typically in the range of 2-5%, compared to the Target Model. However, the presence of a capacity market could lower the risk of shortages and of an investment cycle. There is however also a risk for regulatory failure leading to overinvestments and increased costs with the introduction of capacity markets.
In areas where additional capacity is not needed, such as the Nordics, the impact of a European-wide capacity market on the wholesale electricity
price is small, but the capacity price would typically also be low in such areas. Conversely, in areas that are capacity constrained, and in which an integrated European capacity market results in relatively high capacity prices, we see an overall cost impact of between 2% to 8%. These higher cost impacts also occur in Southern Sweden and Denmark, which, although not capacity constrained, are strongly influenced by their interconnections to the continent, especially in the capacity market.
Spillovers may reduce customer costs in countries without capacity markets when capacity markets are introduced in surrounding regions. Given that these regions do not need to pay for the additional capacity in the neighbouring regions, there can be quite large drops in wholesale power price which are then passed on to the customer in these non-capacity-market regions.
Security of supply in neighbouring countries may be negatively affected by the introduction of national capacity markets.
The capacity market designs in the analysis are implemented so that any country that introduces

February, 2014 12 A Sweco Multiclient Study
Capacity Markets in Europe: Impacts on Trade and Investments
a capacity market would not experience unserved demand or prices far in excess of marginal cost.
In the patchwork capacity market designs in which not all countries have a capacity market, this criteria leads to the capacity-market regions needing to install sufficient capacity to compensate for leaks to neighbouring regions which do not have capacity markets. Whilst this may not be a perfect design feature in reality, it forms an interesting discussion point as to how far a country would go to ensure security of supply, whilst also bearing in mind that there would also be more extreme prices in reality.
Capacity markets may, however, reduce the security of supply in neighbouring markets. If a capacity market is introduced in one (large) country, the wholesale electricity price is reduced in the neighbouring countries, which may crowd out investment there.
The analysis shows that this may lead to a situation in which security of supply decreases in the neighbouring countries, increasing the volume of unserved demand. While the customers in these neighbouring countries may benefit in terms of lower electricity prices, they
also face a risk of a somewhat worsened security of supply situation.
The introduction of capacity markets may significantly reduce congestion revenues on interconnectors, potentially distorting the incentives between building interconnectors and generation.
Our analysis shows that for a given set of interconnector capacity, when capacity markets are introduced across Europe, the revenues earned by the interconnectors from the energy markets are significantly reduced compared to the Target Model.
The story, however, becomes a little more complicated when patchwork capacity market designs are considered. The above is true when capacity markets are introduced in areas that are net importers on that interconnector – here the interconnector congestion revenues decrease. This is driven by the fact that price volatility and price spread between areas are reduced. Conversely, however, when a net export area introduces a capacity market, congestion revenues on that interconnector could increase as both volume and price spreads increase in this situation.
Interconnector rents from the capacity market could improve the situation for certain interconnectors between regions with markets in abundance of capacity and markets where capacity is scarce. Whilst this may not be sufficient to offset the reduction in congestion rent from the wholesale power market, it illustrates the importance of including interconnectors in capacity remuneration schemes in order to avoid distortion in investment decisions between interconnectors and generation capacity.
Within the Target Model, our analysis shows that additional interconnector investments are called for. Furthermore, prices drift apart, primarily between the Nordics and Continental Europe, without additional interconnectors above the levels suggested in e.g. the TYNDP 2012.
While our analysis only captures cross-border transmission between countries or bid areas, it is reasonable to expect that similar reinforcements will also be needed internally within many countries. For instance, in the countries where locational pricing is present – Norway and Sweden – the analysis indicates a need for reinforcements between bidding areas.

February, 2014 13 A Sweco Multiclient Study
Capacity Markets in Europe: Impacts on Trade and Investments
In addition, there are substantial differences in the need for interconnector capacity between the supply scenarios, depending on the decarbonisation policies realised. As interconnector investments are long term, this illustrates the importance of stability in the policy framework in order to properly dimension the European power system.
Final remarks
The renewed interest for capacity remuneration mechanisms in Europe is affected by the current low power prices. Those are the result of the combined effect of a low electricity demand, subsidized renewable generation and a collapsed carbon price.
Future development of all these factors is of course uncertain. Is the low electricity demand only an effect of the slow economy? Or are we also seeing a more permanent shift e.g. due to increased energy efficiency?
In any case, in the long term investment levels in new generation and phase-out of older generation will be affected if it is permanent shift we are seeing. This implies that in the long run
the impact on power prices is likely to be less than what we are currently observing.
Carbon price development is ultimately depending on the policy framework. Independently of the demand development and phase-in of subsidized renewable generation, the carbon emission cap could in principle be set sufficiently tight so that a meaningful carbon price is achieved. If the uncertainties around volumes are too large, carbon price floors or a move to a carbon tax are alternative policy measures to achieve an effective carbon price signal.
The changes in the power system with more renewable generation may also put pressure on the current market model, independently of whether the renewable generation is subsidised or not. Many of the renewable technologies have very low, close to zero, marginal cost. In a competitive market, one would expect these market participants to bid at their marginal cost. If these technologies to a larger extent become price setting it would change the price dynamics in the market. In the hours when the renewable technologies set the price, we would expect a price around zero. In the hours when the renewable capacity is not sufficient the price would instead be set at some very high level. It
would be likely that demand side bids would become crucial for balancing the market. Such highly volatile prices could prove to be a challenge to the market. While subsidies reinforce these problems, it is not necessarily the subsidies alone that give rise to difficulties.
Finally, profitability in power generation on a local level may also be affected by the degree of locational pricing. In cases where there are internal bottlenecks within one bidding area and significant differences in the supply-demand balance between the different parts of the bidding area, necessary investments in the deficit area may not be profitable. This however has little to do with capacity markets. Lack of locational pricing within capacity markets has previously also been a problem, e.g. within the PJM market in the US, and can lead to a situation where capacity is located in the wrong areas. The same is of course the case for the energy market, and natural solutions to the problem would be to strengthen the grid or to introduce locational pricing to a larger degree. This has however been outside the scope of this study.

February, 2014 14 A Sweco Multiclient Study
Capacity Markets in Europe: Impacts on Trade and Investments
A note following the Jan 2014 EC proposal for the EU 2030 framework on climate and energy goals
The European Commission’s proposal for 2030 targets were presented on 22 January 2014, after the analysis in this report was finalized. We can note that the scenarios analysed here differ somewhat from Commission’s proposal.
According to the impact assessment of the proposal, the carbon price with a 40% GHG reduction target and focusing only on a GHG target will be about 10 EUR/tonne higher in 2030 than we have assumed for the “lower-decarbonisation” scenario analysed here (the CPI scenario). Combining with energy efficiency and RES policies the carbon price could however be significantly lower.
Furthermore, the Commission’s proposal includes a EU wide RES target of at least 27% of consumption in 2030, which for the electricity sector would be at least 45%. The assumptions used in our analysis imply a RES share of 46% in the “lower-decarbonisation” CPI scenario and 52% in the “higher-decarbonisation” DST scenario (including Norway and Switzerland).
While our assumptions do not exactly match the proposal from the Commission in all aspects, we believe that the conclusions in this study are not altered by these differences. Indeed the most interesting results in the study are seen between the different market designs and not the different supply scenarios.
Rather of greater interest following this proposal, with the substantial differences in carbon price that the impact assessment presents, depending on whether separate energy efficiency and RES policies are implemented or if there is only a GHG target, again illustrates the large policy uncertainties.

February, 2014 15 A Sweco Multiclient Study
Capacity Markets in Europe: Impacts on Trade and Investments
PART I
INTRODUCTION

February, 2014 16 A Sweco Multiclient Study
Capacity Markets in Europe: Impacts on Trade and Investments
1 A changing market
The European power markets are undergoing fundamental changes. On the one hand there is a strong push towards market integration through the implementation of the common Target Model for the internal European electricity market. At the same time, new challenges are arising which put the selected model under pressure.
As part of the decarbonisation strategies, a substantial amount of subsidised renewable electricity generation is being phased in. Together with the economic downturn this has caused a large drop in power prices which has put many power companies under financial pressure. Current market expectations also point at low prices for a sustained period of time.
In the longer run the changing conditions are also believed to make investments in new generation more difficult. First of all there are large uncertainties around the policy development. How stringent will the future climate policy be and what policies and measures will be used in order to decrease carbon emissions?
If policies aim mainly at increasing the amount of renewable generation through subsidies, we can
expect an environment with a very large share of renewables and highly volatile prices. While such a situation may require a substantial amount of back-up generation, conventional thermal generation will then typically function as back-up with very few hours of operation. Investments will then have to rely on very high prices during some hours in order to compensate for the few hours of operation. Relatively small changes in supply and demand conditions may then have a substantial impact on the revenues and profitability of these power plants and investments will thus be very risky.
Alongside a rapid introduction of renewable technologies, there will be need for developments of grids and interconnectors. But whilst renewable technologies can enter the power system within less than 5 years from planning, the grid will typically take much longer to develop, with renewables not always placed in the optimal locations for grid developments. Uncertainty around the introduction of renewables will only serve to delay the necessary improvements.
If policies instead focus on achieving climate objectives through more technology-neutral
polices, such as cap-and-trade schemes or carbon taxes the situation is likely to be different. While renewable electricity generation would still be supported through an increase in power prices, the same support would also benefit other carbon-free or low-carbon technologies. The supply mix would thus be more diversified, and the problems related to very volatile generation and prices would be less severe. At the same time, as shown since the introduction of the EU ETS, carbon prices may be highly volatile and investments based on the carbon price may thus still be considered as risky.
Whichever future is realised, the uncertainty and increasing subjection of market players to regulatory changes and political goals makes investments in the European power system increasingly risky.
Given this situation several countries have opted to introduce capacity remuneration mechanisms, and others are considering it. This has also led to a heated discussion on the European level regarding their compatibility with the Target Model and how it will affect the integrated electricity market.

February, 2014 17 A Sweco Multiclient Study
Capacity Markets in Europe: Impacts on Trade and Investments
2 Scope of the study
The development in the European power market is giving rise to many questions. This Sweco Multiclient Study aims at addressing key issues related to the introduction of capacity remuneration mechanisms (CRM) in general, and cross-border effects in particular.
First of all, on the overall level one could ask what the potential is for an “energy only” market design to function in a future environment with much larger share of intermittent power generation. Will there be sufficient investments in flexible generation and demand side resources that can meet the variations in the intermittent generation? What are the requirements for demand flexibility for the market to function and how often would we expect that demand side resources are setting the price in an energy only market? Should we expect a significant number of hours with either physical power shortage or at least extreme power prices?
Secondly, there are many important cross-border effects of introducing capacity remuneration mechanisms. These effects will partly depend on how such mechanisms are introduced – whether it is in a harmonised/coordinated manner or as a
patchwork of national solutions, and which type of mechanism is introduced.
Particularly with national implementation there could be spillover effects where customers in one country may free-ride on the measures implemented and paid for in other countries. The same spill-over effects may disincentivise investments in new power generation in countries without capacity remuneration mechanisms. From a qualitative point of view it is easy to see these effects, the question is rather how important they are from a quantitative point of view and how different design choices impact.
Related to this we also ask whether the introduction of a CRM in one country forces neighbouring countries to act, or if they still can make independent decisions?
Thirdly, investments in interconnectors and in peak generation capacity are to some extent substitutes. Increased interconnector capacity, in particular between areas with substantial flexible capacity such as hydro-dominated areas and areas where flexible capacity is scarcer, will help in solving capacity problems. The profitability of
such interconnectors is also dependent on the price volatility, which will be reduced if additional flexible generation capacity is added. Capacity remuneration mechanisms could skew the incentives in favour of generation, while it is not necessarily the most economical solution.
Fourth, both in order to compensate for some of the spill-over effects and to secure that the capacity paid for by the domestic customers also benefits those customers, different mechanisms to affect short term trade may be introduced. Those mechanisms could in principle range from very simplistic solutions in which export is restricted during critical events to sophisticated changes in the market coupling algorithms.
Finally, it is of course of utmost importance to assess the overall economic implications, and in particular what the total costs will be for the customers in different scenarios and designs.
While the modelling work covers all of Europe, the study is focused on Northern and Central Europe which is also reflected in the conclusions.

February, 2014 18 A Sweco Multiclient Study
Capacity Markets in Europe: Impacts on Trade and Investments
3 Scenarios and policies
3.1 Supply technology scenarios For the purpose of the analysis we have used two different supply technology scenarios, with scenarios from the Energy Roadmap 2050 as a starting point. These scenarios have then been adapted and some assumptions have been changed. To some extent we have also been forced to make our own assumptions, e.g. regarding country specific renewables development as the aggregate levels presented in the Energy Roadmap 2050 has not been sufficient for our purpose.
The first scenario is the Current Policy Initiative (CPI) scenario. The scenario can be seen as a reference scenario, but includes a substantial growth in renewable electricity generation.
The second scenario is a decarbonisation scenario – the Diversified Supply Technologies (DST) scenario. It is a scenario in which aggressive decarbonisation targets are met, and the policy measures mainly rely on market incentives such as carbon prices/taxes and to a lesser degree on direct subsidies. The carbon
price rises dramatically in the longer run in this scenario.
In the CPI scenario the wind and solar generation cover 29% of demand in 2030, which increases to 36% in 2040. In the DST scenario the corresponding numbers are 36% and 47%.
Fuel prices have to some extent been adjusted compared with the Energy Roadmap 2050
scenarios. The Energy Roadmap scenarios are partly based on assumptions on global climate policies, which in turn affect world fuel prices. In this study we have focused on European policies. We have therefore assumed that globally traded fuels, e.g. coal and oil, are not significantly different in the two scenarios. Natural gas is to a lesser extent traded globally, although this might increase in the future, which gives more room for price differences between the scenarios. For gas
Figure 1. Installed wind and solar generation, 2030 and 2040
Source: Sweco Energy Markets assumptions
560 685 667871
247313 324
445289
404 348
530
24
27 26
29
29%36% 36%
47%
0%5%10%15%20%25%30%35%40%45%50%
0200400600800
100012001400160018002000
2030CPI 2040CPI 2030Diversified 2040Diversified
Share of dem
and
TWh
Wind_Onshore Wind_Offshore Solar_PV Solar_CSP Demand share

February, 2014 19 A Sweco Multiclient Study
Capacity Markets in Europe: Impacts on Trade and Investments
we have therefore used the price assumptions in the respective Energy Roadmap scenario.
Carbon prices are also affected by European policies. For 2030 and 2040 we have used the assumptions/results from the Energy Roadmap scenarios. For 2020 we have however kept closer to current market prices.
3.2 Market design policies Four market design policies are used in the study. The Target Model Policy describes a stylised energy only market. In this scenario we disregard any existing capacity remuneration mechanism (CRM). In practice almost all power markets have some type of mechanism based on capacity, if nothing else than to secure regulation power and system stability. These mechanisms may also have an impact on investment behaviour and for upholding capacity.
Three CRM policies outline various options for the use of CRMs in terms of policy coordination across Europe.
The Integrated Capacity Market Policy describes a European-wide capacity market. Target capacities are set in relation to (national) peak
demand. The target capacity can be reached either through domestic resources or through external resources. In the latter case, available transmission capacity sets the limits to how much capacity can be procured from external resources.
In the Coordinated Policy all countries are free to introduce a CRM, but subject to the criteria developed by the European Commission:
■ Necessity ■ Appropriate instrument ■ Proportionality ■ Non-distortion of competition.
This is possible with differentiated security of supply targets/capacity margins. Here, capacity
can be traded into a capacity market from neighbouring regions, subject to the same transmission limit as in the Integrated Capacity Market Policy.
The National Policy describes a future where CRMs are introduced on a national level, without European level restrictions. In this scenario we foresee that capacity targets are met by domestic resources. Furthermore, under this policy we allow for countries to introduce various measures to ensure that the capacities procured (and paid for) domestically primarily benefits domestic customers.
Table 1. Assumed fuel prices, CPI and DST scenarios
Fuel prices 2020 2030 2040
CPI DST CPI DST CPI DST
Coal [€/MWh] 9.9 10.1 10.2
Natural gas [€/MWh] 28.2 26.5 29.9 24.5 36.4 22.6
Carbon [€/tonne] 5.0 28.7 68.3 36.4 108.9
Source: Sweco Energy Markets assumptions

February, 2014 20 A Sweco Multiclient Study
Capacity Markets in Europe: Impacts on Trade and Investments
3.3 Power Market Model Sweco’s European power market model Apollo is the tool used to quantitatively analyse the different scenarios and capacity market designs.
It is a fundamental model that evaluates the long-term effect of different market and policy scenarios on heat and power production, price structures, trade patterns, and plant profitability in the European energy markets.
Within it are simulated 38 price regions within Europe as well as establishing trade between Europe and seven regions outside of Europe, which are represented as fixed price regions.
The price regions are mainly individual countries, but Sweden, Norway, and Denmark are internally split into price regions. The separate modelling of Germany and Austria is solely done for simulation reasons and is no indication for future developments in the question of price zones.
Internal bottlenecks are not considered in the analysis. Except for the Nordic countries mentioned above, all countries are treated as one price region.
Any new thermal investments are input through an iterative process and only if profitable are they added to the system.
Plant-based demand response is considered in all countries. Further details of the model and modelling assumptions can be found in the Appendix.
It should also be noted that whilst the price cap in this modelling is set at 3000 EUR/MWh, there are some market areas where the price cap is much lower. We expect that in the long run price caps are likely to be harmonised as the market is further integrated.
3.4 Modelling of market designs The modelling of a capacity market in each bidding region is done in a module separate to the power market model. The market is designed somewhat in line with the GB proposal, insomuch as the form of the demand curve.
The demand curve is determined by two figures: the net cost of new entry (net-CONE), taken to be that of a CCGT plant, and a target demand. This target demand is set at a value equal to peak demand in each region, though it varies for some
regions and some policy designs. It is a sloping demand curve, and its cap is twice the value of net-CONE.
As for the supply curve, a plant bids into this market at a price equal to its missing money – that is the difference between the plant’s costs and the expected revenues it can earn from the energy-only market.
The quantity of capacity that a specific plant can bid into the capacity market is defined according to an assumed availability. In this market, it is possible for certain RES to participate, but – except for hydro – this is generally at a very low availability.
As described within the previous section, in the Integrated Capacity Market, all countries have a capacity market and can freely trade between regions – limited only by available transmission capacity.
In the Coordinated Policy Scenario (CPS), there are three cases of which countries have capacity markets:
■ Case 1: France, UK, Italy, Spain, and Portugal

February, 2014 21 A Sweco Multiclient Study
Capacity Markets in Europe: Impacts on Trade and Investments
■ Case 2: Same as case 1, plus Germany
■ Case 3: Same as case 2, plus Poland
In all three configurations, external capacity can bid into the capacity market, even if the region in which it is physically located has no capacity market itself.
In the National Policy, there is only one case considered – that of case 1 in the CPS. In these markets there is also the limitation that only domestic capacity can bid into each capacity market.
In these markets, investments are input to a level that is dependent on two conditions – that there it is accepted into the market until some plant is marginal, and that there are no scarcity prices – classed as those above 1000 EUR/MWh – in the regions with the capacity markets.
February, 2014 22 A Sweco Multiclient Study
Capacity Markets in Europe: Impacts on Trade and Investments

February, 2014 23 A Sweco Multiclient Study
Capacity Markets in Europe: Impacts on Trade and Investments
PART II
QUALITATIVE DISCUSSIONS

February, 2014 24 A Sweco Multiclient Study
Capacity Markets in Europe: Impacts on Trade and Investments
In this qualitative part of the study, we discuss in some depth the issue of ensuring adequacy and security of supply – how this was managed in a historical context – and how investments are being made in this sector at current times – the possible lack of which is cause for some concern in maintaining a well-functioning power market. Capacity remuneration mechanisms are a possible solution for some of these issues and are currently being designed to enter certain European countries in the not-so-distant future – a comparison of these designs serves to inform the discussion of how these mechanisms can function. Of particular interest in considering capacity market design and how it can affect trade is the Russian capacity mechanism, and so its impact on Finland is analysed in more depth. And finally, one of the trickiest aspects of capacity market design – that of if and how to include external generation capacity in a national capacity market – is considered qualitatively.
4 Security of supply in a historical context
Security of supply has always been a fundamental issue in the organisation of power markets. Following the market liberalisation the TSOs do have the short term system responsibility, but typically not the responsibility for ensuring the long term system adequacy. As a background to the discussion on capacity markets this chapter provides a short overview of how security of supply was dealt with in the past in some example markets.
Pre liberalisation, generation adequacy was never really a concern although it was achieved at high costs given the monopoly structure in the industry. With some variations between countries the model for securing security of supply can be described as follows.
The cost for society of the non-delivered kWh and the non-delivered kW was estimated. The supply margin, i.e., the margin above forecasted peak demand, was determined based on cost of shortage. The supply margin could also be expressed as a probability that a shortage would occur, e.g. a shortage should not occur more often than once in 33 years.
While the above process was similar in many countries, the institutional arrangements differed. In some countries the government took an active role, while in others it was left to agreements within the industry. However, energy regulators as we see them today did not exist.
The generators had a monopoly in their service territory. They could therefore plan the generation capacity they needed to fulfil the security of supply criteria. The monopoly situation and average cost pricing solved possible financial problems. The normally more expensive new capacity was added to the old generation resources and a new generation cost was calculated. The generation cost together with transmission, distribution and administrative costs then resulted in the tariff the customers had to pay. As all costs could be included in the tariff and be passed on to the customers the model stimulated overcapacity, as was seen in most European countries at the beginning of liberalisation.
February, 2014 25 A Sweco Multiclient Study
Capacity Markets in Europe: Impacts on Trade and Investments
We will now briefly describe how generation adequacy was handled in three countries, England, Germany and Sweden.
There are some fundamental differences between these three countries. England had a 100% state owned structure with the transmission grid integrated. Germany had a more diversified structure. There were seven so called Verbundunternehmen with generation and transmission, plus a large number of local companies with generation but without access to the transmission grid. The sector was dominated by municipal ownership. In Sweden there was a mix between state-owned, private and municipal companies. The transmission grid was owned by the largest generator, Vattenfall (state-owned). In Germany and Sweden distribution followed the same structure with large municipal ownership.
In England the standard expected that in three or four winters in every 100 years, there would have to be disconnections and in about 20 of 100 winters some form of load shedding, voltage reduction or disconnection. In a report from 1981 the Monopolies and Mergers Commission showed that in the 1970s the margin above peak demand ranged from 21% to 42%. The large margin was probably a result of a cautious
approach to the planning margin stimulated by the monopoly structure. In the beginning of liberalisation in the 1990s there was a capacity element included in the pool price based on the regulators judgement of the value of lost load (VOLL) and the loss of load probability (LOLP).
As Germany was part of the Continental European power system, generation adequacy was handled with some coordination. The association for generators/transmission companies, UCPTE, issued rules for the control areas (each transmission system). In Germany there were seven control areas at the time of market opening. A control area was also a supply area, constituting the regional monopoly. These seven control areas, also called Verbundunternehmen, agreed among themselves to have a capacity margin of 7% above forecasted peak demand to fulfil the UCPTE rules.
The seven Verbundunternehmen did 10 year load forecasts for their control area. They could relatively easy get figures from their customers, large industrials and regional networks, since the customers had to pay a demand charge based on the average of the three highest values during the year. If they exceeded the forecasted
demand they had to pay a penalty. The system worked without intervention of any external parties and gave stimulated too high demand forecasts and consequently overinvestments, the cost of which was carried by the customers. Similar to other countries the customers had to carry most of the risk, with very limited risk put on generators.
In Sweden, cooperation between the large generators was advanced. These 11 companies formed a joint operation agreement supervised by a joint committee, SKN. The purpose of the cooperation was to optimise the overall operation of the system and to coordinate joint actions in the event of shortfall situations. The tool to achieve this was to exchange temporary power between the members. However, in order to avoid free riders each company had to be able to meet the contracted demand in its service territory to be allowed into the cooperation. The demand could be met by own generation resources or by long-term contracts with other generators. To be part of the cooperation companies also had to have an operational organisation basically active on a 24 hour basis. On an annual basis the SKN followed up that the members fulfilled the rules.
February, 2014 26 A Sweco Multiclient Study
Capacity Markets in Europe: Impacts on Trade and Investments
To calculate the supply margin the socioeconomic value of power shortage and energy shortage was estimated. As an example the resulted figures could be that power shortage risk must not exceed 0.1% and the risk for energy shortage not 3%. In practise 3% means that energy shortage should not occur more often than 3 years of 100 or once every 33 years. It is interesting to notice that also then politicians had difficulties to accept a shortage once in 33 years, but at the same time also difficult to accept the higher costs needed to have an even higher security of supply.
.

February, 2014 27 A Sweco Multiclient Study
Capacity Markets in Europe: Impacts on Trade and Investments
5 Investments under risk and uncertainty
In the development of policy, it is crucial to consider the perspectives of investors, and how increases in uncertainty affect them. Provided policies wish to encourage investment, the policies themselves, their credibility, and the wider context of the investment environment must not create or increase levels of uncertainty and risk, as this section goes on to describe.
Investments in power generation projects typically involve many risks and uncertainties, with the large sums of capital input representing a sunk cost; returns are spread over many years into the future during which these risks and uncertainties can develop and change. Many resources are dedicated to better understanding the possible futures and attempts to ensure the profitability of these large investments.
Whilst the terms of risks and uncertainties are used by many interchangeably, it is useful in this discussion to distinguish between the two. To risks it is possible to assign known distributions and probabilities, allowing for a prediction of the values of these unknowns in future times. With uncertainties, however, it is not possible to do so.
Risks that threaten the future revenues of thermal generators are many and include fuel prices, electricity demand, and electricity prices. Risks can be managed by various well-developed and complex processes by the different market players, uncertainties however are much harder to judge and most often evaluated using scenario analysis and, more subjectively, experienced judgement.
The uncertainties faced by the European power industry are unprecedented, with European-wide decarbonisation, large-scale introduction of renewables supported by subsidies, amongst a backdrop of other changing factors such as reduced demand, with probability distributions not easily assigned to them, if at all. In some way, these uncertainties can be evaluated by scenario analysis, but not all eventualities can be foreseen.
In face of the large uncertainty, the most common action is to wait for some of the uncertainty to be resolved. When considering the possible futures of policy, there appears very little upside to investing in thermal generation at this point in time. Most of the uncertainty poses negative
outcomes for carbon-producing mid-merit plants in energy only markets – increased carbon prices, increased renewable technologies causing less running hours and lowering of spot prices.
One possible action that many investors are taking is to increasingly engage with policy makers in governments and regulatory bodies to understand more about possible futures and to ensure that their side is also heard by them.
For investors in renewable energy projects, their future revenues are generally reliant on subsidies, most often in the form of feed-in tariffs or certificate schemes; uncertainty here is more based on changes in subsidy support, and worries of retroactive changes which pose a stronger threat in certain countries than others in continental Europe. Investors move away from those countries that have already made such unwelcome changes, and focus more on markets perceived as making more stable and long-term policies.
New investments are evaluated in several ways; financially, many traditional financial methods are

February, 2014 28 A Sweco Multiclient Study
Capacity Markets in Europe: Impacts on Trade and Investments
employed, such as net present value and return on investment, ensuring that the company’s financial goals can be met; often these require a discount rate, or a required rate of return, to be stated and applied – essentially evaluating whether an investment is expected to make sufficient returns to cover all costs including the cost of capital. This rate will typically vary between projects with different perceived risk – whether in different countries, or different parts of the value chain; if risks are perceived to become greater, this rate of return likely increases.
Risks are handled in these financial assessments with model predictions, sensitivity analyses, and an increased discount rate should the investment be considered riskier than the usual. In order to consider uncertainties, scenario analyses can be conducted. In addition to these, decisions are not made solely based on the financial calculations; there are various goals of company strategy that an investment project must also fulfil – whether it be in aim of upholding company reputation, expanding into a new market, increasing market share, or diversifying risk over a portfolio of power generation plants.
The greater the uncertainty about policy, the longer investors will wait to make their decisions
and their investments; there is a perceived value in waiting until some of the uncertainty is resolved, if there is deemed to be a point in time in which this will happen and a possible benefit in investing. And of course, if the uncertainty level is just too high, they will not invest at all.
The current situation of much policy uncertainty, increased political intervention in the sector, the wider uncertainty surrounding decarbonisation of Europe, all put questions on the future revenues of investments, deflating shareholder confidence, and increasing the reluctance of investments in this sector.
Capacity mechanisms can serve as tools for reducing investor uncertainty, and increasing security of supply, in a transitional phase until the European power system is properly dimensioned. Capacity markets are of course not the only measure, but perhaps the least understood in terms of how their introduction will impact the European power market. And it is here that the quantitative part of the work will focus.
February, 2014 29 A Sweco Multiclient Study
Capacity Markets in Europe: Impacts on Trade and Investments
6 Comparative analysis of some existing and planned capacity remuneration mechanisms
Capacity remuneration mechanisms are already being introduced in several European countries and a review of three cases – Great Britain (GB), France, and Italy – allows for a better grasp of how they can be implemented.
6.1 Considerations for the introduction of CRMs
The main purpose of all studied CRMs is to address the problem of generation adequacy expected to occur at some time in the future. This is especially true in Great Britain where environmental legislation will force the closure of coal-fired plants amounting to a fifth of existing capacity in the coming decade. The British Government reckons that a large proportion of the new capacity will be either intermittent or less flexible, as it expects that it will be harder for reliable, dispatchable capacity to capture revenue, leading to underinvestment.
Both France and Italy have identified additional aims, and these additional aims have determined the choice of CRM scheme.
In France, demand for electricity is increasingly thermosensitive due to the increased use of electricity in heating, raising concerns that exceptionally low temperatures could lead to demand peaks that could pose a risk to the supply-demand balance.
In Italy, the Regulator has argued that the market has failed in its role as coordinator of the investment choices of market participants. Concerns include boom-and-bust investment cycles, price volatility, revenue uncertainty and that despite zonal prices for generation, investments in renewable generation have not always happened where generation is needed the most, but where it is easiest to obtain permits.
6.2 Chosen designs and capacity to contract
Great Britain has opted for a centralised capacity auction scheme. To guide how much capacity to contract at each auction, Britain will establish an enduring reliability standard – Loss of Load Expectation (LOLE) of 3 hours - that the TSO, after forecasting peak demand, will translate into a capacity requirement to meet the reliability
standard. An argument for adopting LOLE as a reliability standard is that it forms the basis of the reliability standard in all of GB’s interconnected neighbours. The final decision over how much capacity to procure will be taken by the Government 4.5 years ahead of delivery. Adequacy targets will be variable and the demand curve will be constructed using the net Cost of New Entry (net-CONE).
Participation in the auctions will be voluntary. Auctions will be descending clock and pay-as-clear, so all successful bidders receive the same compensation for a commitment to be available at times of system stress, or pay a penalty. However, in order to avoid abuse by dominant capacity providers, capacity providers will be classified as either price takers (who cannot set the price) and price makers. Existing generation will likely be considered price takers by default, while new capacity and demand response resources will be considered price makers. Price takers will only be able to bid up to a pre-determined threshold while price makers will be able to bid up to an auction’s price cap, which will be set as a multiple of the CONE.
February, 2014 30 A Sweco Multiclient Study
Capacity Markets in Europe: Impacts on Trade and Investments
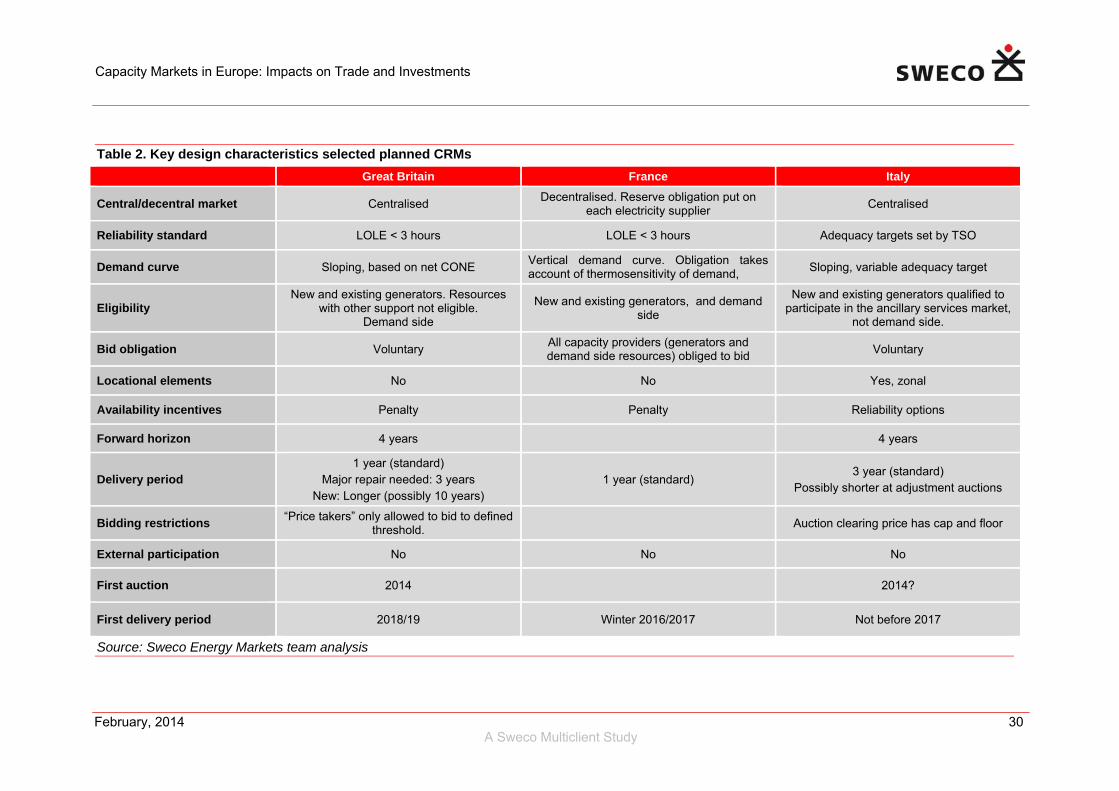
Table 2. Key design characteristics selected planned CRMs Great Britain France Italy
Central/decentral market Centralised Decentralised. Reserve obligation put on each electricity supplier Centralised
Reliability standard LOLE < 3 hours LOLE < 3 hours Adequacy targets set by TSO
Demand curve Sloping, based on net CONE Vertical demand curve. Obligation takes account of thermosensitivity of demand, Sloping, variable adequacy target
Eligibility New and existing generators. Resources
with other support not eligible. Demand side
New and existing generators, and demand side
New and existing generators qualified to participate in the ancillary services market,
not demand side.
Bid obligation Voluntary All capacity providers (generators and demand side resources) obliged to bid Voluntary
Locational elements No No Yes, zonal
Availability incentives Penalty Penalty Reliability options
Forward horizon 4 years 4 years
Delivery period 1 year (standard)
Major repair needed: 3 years New: Longer (possibly 10 years)
1 year (standard) 3 year (standard)
Possibly shorter at adjustment auctions
Bidding restrictions “Price takers” only allowed to bid to defined threshold. Auction clearing price has cap and floor
External participation No No No
First auction 2014 2014?
First delivery period 2018/19 Winter 2016/2017 Not before 2017
Source: Sweco Energy Markets team analysis
February, 2014 31 A Sweco Multiclient Study
Capacity Markets in Europe: Impacts on Trade and Investments
Generation facilities that already receive some level of support, such as renewables receiving support via the Renewables Obligation scheme, will not be able to participate in the CRM.
France has opted for a decentralised capacity obligation that places a capacity obligation on electricity suppliers. Each year, all capacity providers in French territory – generators and demand-side resources – will be obliged to seek the TSO’s certification and commit to provide a certain level (MW) of capacity at times of peak demand, or pay a penalty.
In return capacity providers will receive a corresponding number of tradable capacity certificates with a market value. Electricity suppliers will be required to present enough capacity certificates to comply with an annual capacity obligation. Suppliers can obtain capacity certificates by investing in own capacity, by obtaining bilateral contracts from generators, or by buying them in secondary markets.
A supplier’s capacity obligation will be determined by the expected aggregated demand of the supplier’s customers during a pre-defined peaking period in the delivery year, when the risk of system failure is highest. In this way, electricity
suppliers themselves will need to forecast their expected obligations.
The obligation will be then corrected to include an administratively set reserve margin to account for the thermosensitivity of the demand, for demand resources that can be activated during peaking hours, and for exchanges with neighbouring countries. After the delivery period the French TSO will check whether each electricity supplier has purchased sufficient certificates to cover consumption during the global peak or instead must face penalties for the shortfall.
France considers the demand obligation approach design to be the most suitable from a peak demand management perspective, as suppliers will be able to reduce their capacity obligation by encouraging its customers to reduce their peak demand. The TSO’s estimates of required capacity will be based on the reliability standard set by the government – a LOLE of 3 hours.
Italy has opted for a zonal CRM with variable adequacy targets and reliability options. Each year, the TSO will determine adequacy targets for each of the coming ten years for each transmission-constrained zone and for the whole
country. The TSO will procure capacity to meet the adequacy targets through descending clock auctions. Participation will be voluntary.
In return for their commitment to provide capacity to the day-ahead and ancillary services markets at times of system stress, generators will receive an annual premium (EUR/MW) – the clearing price at the auction for the specific delivery zone – which will be subject to a cap and floor determined by the Regulator. However, an ex-post adjustment mechanism will require that generators pay back to the TSO an amount equal to the difference (EUR/MWh) between a reference price and a strike price each time the reference price rises above the strike price. The strike price will be set out, for every hour of the delivery period, in the contract acquired at the capacity auctions, while the reference price will depend on whether the generator has made its capacity available as contracted, and whether it was cleared in the day-ahead or in the ancillary services market.
The rationale behind this design is to encourage generators to be available during peak periods as well as to reduce a generator’s incentive to exercise market power by withholding capacity and driving prices on the day-ahead and ancillary
February, 2014 32 A Sweco Multiclient Study
Capacity Markets in Europe: Impacts on Trade and Investments
services markets higher. It is also meant to act as a hedge for consumers against price spikes, as the amounts paid back to the TSO will be discounted from consumers’ electricity bills.
All adequacy targets will be variable. This means that the downward-sloping demand curves representing the adequacy targets will effectively signal to market participants that if prices are too high, the TSO will buy less capacity than otherwise intended, but if prices are sufficiently low, the TSO will buy excess capacity, above and beyond that required for safety reasons only. The case for buying excess capacity is that it has value for consumers as that excess capacity may reduce prices in day-ahead markets. However, because Italy is currently in a situation of excess generation capacity, the TSO will not be buying more capacity than actually needed at least until 2017. The shape of the demand curve will be computed using the Value of Lost Load.
6.3 Possibility of cross-border participation
The European Commission has recommended that national capacity mechanisms should be open to cross-border capacity resources with physical or financial cross-zonal transmission
rights. At the same time, the Commission has acknowledged the practical difficulties of implementing a framework for the cross-border certification of capacities and is recommending that, until these difficulties can be solved, cross-border resources should be integrated implicitly by taking into account their contribution to generation adequacy.
In France, participation is only open to capacity resources in French territory. Capacity resources located outside France are integrated implicitly, i.e. their contribution to capacity adequacy is taken into account when calculating a supplier’s capacity obligation. This is done by multiplying the capacity obligation with a security coefficient calculated to account for imports during peaking hours. The security coefficient for the first year of the capacity mechanism has been set to 0.93.
Great Britain has expressed interest in finding a way for interconnected capacity to participate in the capacity market; however it will not be possible for cross-border resources to participate in the first capacity auction. As in France, cross-border capacity will be integrated implicitly: for example if imports at times of system stress are expected to reach 2 GW, the amount of capacity auctioned will be reduced by 2 GW.
In Italy, the capacity mechanism will only be open to resources in Italian territory. Imports will be taken into account when establishing the adequacy target “in a conservative manner”.
6.4 Contract lengths and adjustments
In all three countries both new and existing capacity will be able to participate in the CRM. Demand resources will be able to participate in both the French and the British schemes, but not in the Italian.
In order to allow generating capacity not yet built to participate in the auctions, auctioning for a delivery period will start four years ahead of delivery in both Italy and Britain. In France, the TSO will publish an estimate of the required capacity for a delivery year also in the four years leading up to delivery. All countries will be holding further auctions, allowing re-qualification, and/or setting up secondary markets in which capacity providers will be able to adjust their positions.
In Britain and France, the standard delivery period will be one year. In Britain, existing capacity that requires major repairs in order to

February, 2014 33 A Sweco Multiclient Study
Capacity Markets in Europe: Impacts on Trade and Investments
participate will be awarded three-year contracts, and not-yet-built generating capacity will probably receive even longer contracts, possibly up to ten years. In Italy the standard contract duration will be three years, but shorter contracts may be offered at adjustment auctions and a weekly secondary market.
6.5 French backstop mechanism France will implement a backstop mechanism for the first 6 years of the main CRM. Six months prior to the start of a delivery year, if the TSO forecasts that capacity will be insufficient to ensure reliability in the three years following the actual delivery year, the government may – within two months – launch a tender to procure additional capacity resources. This means that the expected capacity shortage (i.e. a certain number of capacity certificates) will be auctioned. The French regulator, CRE, will take in bids for new capacity that include a request for certification of capacity for the relevant delivery year and a bid price (EUR/capacity certificate) subject to a bid cap. The level of the bid cap will be set by the CRE based on the cost of new capacity, estimated by an expert, adequate to reducing the capacity shortage risk.
6.6 Timing In Britain, the first delivery period is planned to the winter 2018/2019, and the first auction will be held in 2014. In Italy, the first delivery period will be no earlier than 2017. In France, the first delivery period is planned for winter 2016-2017.
February, 2014 34 A Sweco Multiclient Study
Capacity Markets in Europe: Impacts on Trade and Investments
7 The Russian capacity mechanism – Impact on trade
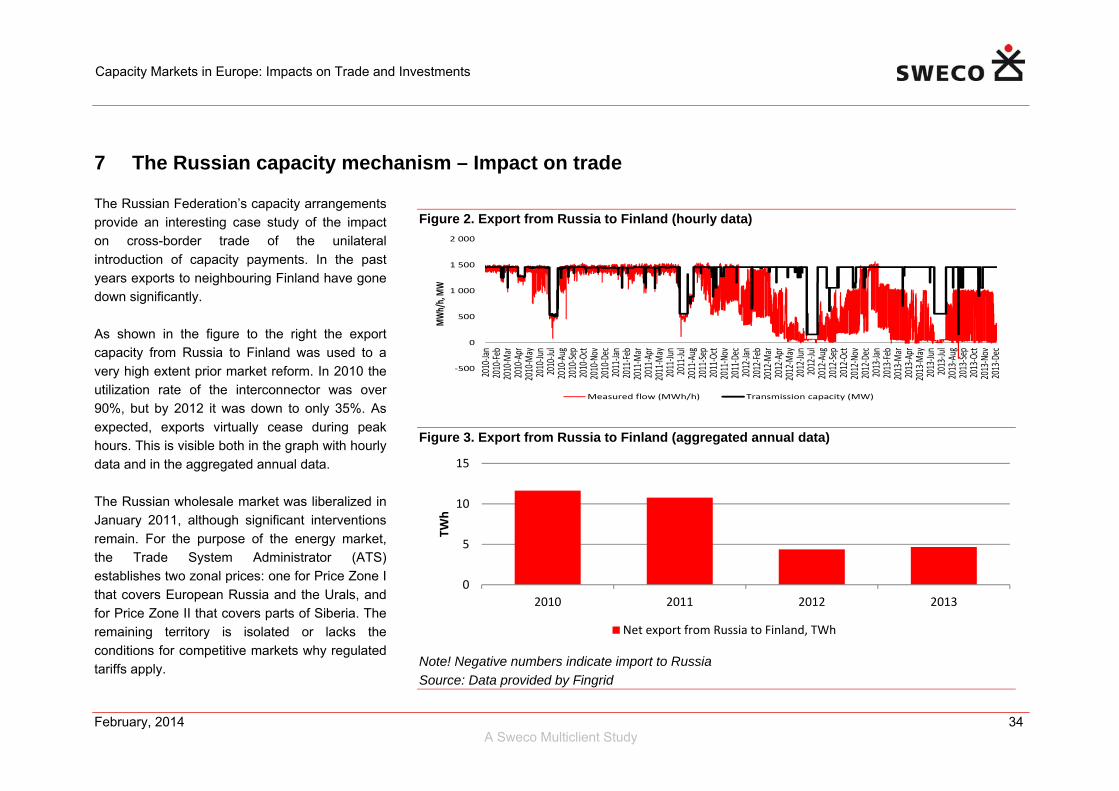
The Russian Federation’s capacity arrangements provide an interesting case study of the impact on cross-border trade of the unilateral introduction of capacity payments. In the past years exports to neighbouring Finland have gone down significantly.
As shown in the figure to the right the export capacity from Russia to Finland was used to a very high extent prior market reform. In 2010 the utilization rate of the interconnector was over 90%, but by 2012 it was down to only 35%. As expected, exports virtually cease during peak hours. This is visible both in the graph with hourly data and in the aggregated annual data.
The Russian wholesale market was liberalized in January 2011, although significant interventions remain. For the purpose of the energy market, the Trade System Administrator (ATS) establishes two zonal prices: one for Price Zone I that covers European Russia and the Urals, and for Price Zone II that covers parts of Siberia. The remaining territory is isolated or lacks the conditions for competitive markets why regulated tariffs apply.
Figure 2. Export from Russia to Finland (hourly data)
Figure 3. Export from Russia to Finland (aggregated annual data)
Note! Negative numbers indicate import to Russia Source: Data provided by Fingrid
‐500
0
500
1 000
1 500
2 000
2010
‐Jan
2010
‐Feb
2010
‐Mar
2010
‐Apr
2010
‐May
2010
‐Jun
2010
‐Jul
2010
‐Aug
2010
‐Sep
2010
‐Oct
2010
‐Nov
2010
‐Dec
2011
‐Jan
2011
‐Feb
2011
‐Mar
2011
‐Apr
2011
‐May
2011
‐Jun
2011
‐Jul
2011
‐Aug
2011
‐Sep
2011
‐Oct
2011
‐Nov
2011
‐Dec
2012
‐Jan
2012
‐Feb
2012
‐Mar
2012
‐Apr
2012
‐May
2012
‐Jun
2012
‐Jul
2012
‐Aug
2012
‐Sep
2012
‐Oct
2012
‐Nov
2012
‐Dec
2013
‐Jan
2013
‐Feb
2013
‐Mar
2013
‐Apr
2013
‐May
2013
‐Jun
2013
‐Jul
2013
‐Aug
2013
‐Sep
2013
‐Oct
2013
‐Nov
2013
‐Dec
MWh/h,
MW
Measured flow (MWh/h) Transmission capacity (MW)
0
5
10
15
2010 2011 2012 2013
TWh
Net export from Russia to Finland, TWh
February, 2014 35 A Sweco Multiclient Study
Capacity Markets in Europe: Impacts on Trade and Investments
Capacity is remunerated in two ways: through capacity supply agreements with the Government or through zonal capacity auctions. For the purpose of the capacity auctions, the two price zones are further divided into 29 zones within which there are no transmission constraints. Ideally, a zonal capacity market should provide price signals for investment, but because of limited competition within zones, 26 out of 29 zones have price caps of about 3000 Euro/MW per month. Practically all generation entering the market 2007-2017 will have a capacity supply agreement with the Government.
The costs for the procurement of capacity are met by Russian consumers, who pay a monthly capacity fee calculated to discourage consumption at times of peak demand. The consumer’s capacity fee for a given month is determined by the highest demand peak during any of the peak hours (pre-defined) during the month. Electricity exports are regarded as domestic consumption and are subject to the same capacity fee. This means that exports during peak hours are also “discouraged”.
The exporter however has to notify the system operator about planned capacity export in advance of the capacity auction, which is taken
into account when calculating total capacity demand. The capacity payments are then determined by the actual export during peak hours, but with a penalty for deviations. However, the planned capacities also becomes binding two days prior to delivery, and the exporter has to pay for the capacity, even if it is not used.
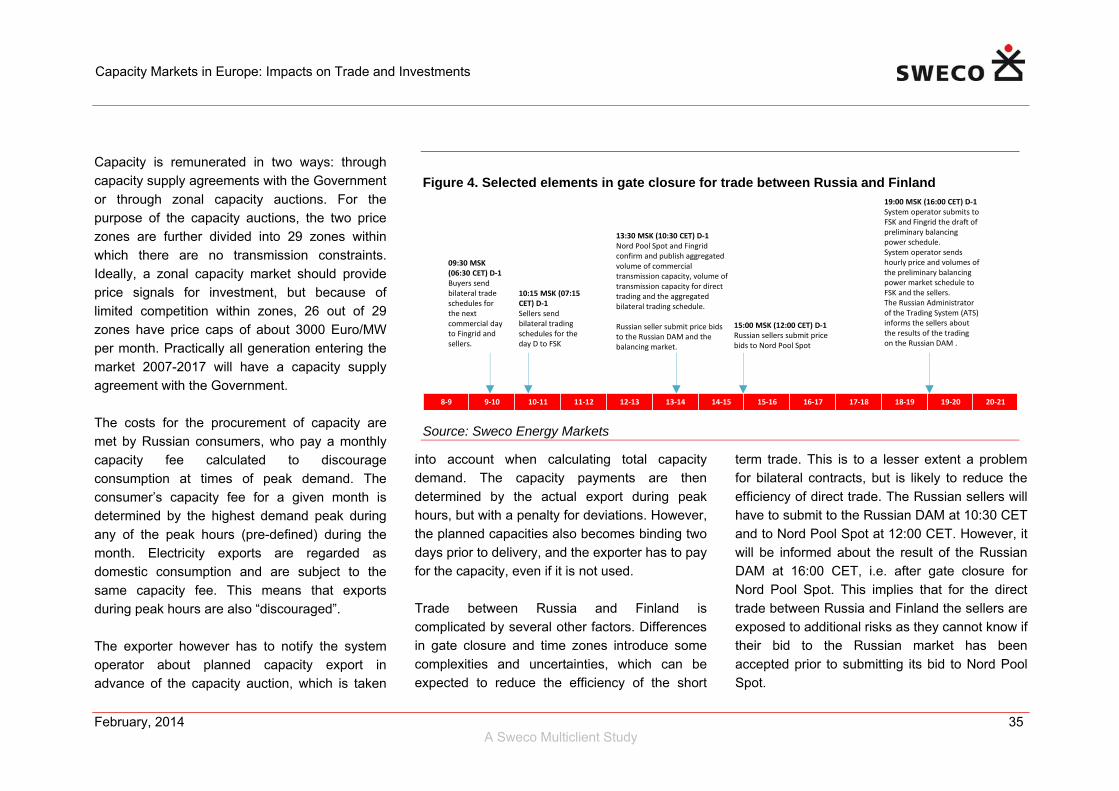
Trade between Russia and Finland is complicated by several other factors. Differences in gate closure and time zones introduce some complexities and uncertainties, which can be expected to reduce the efficiency of the short
term trade. This is to a lesser extent a problem for bilateral contracts, but is likely to reduce the efficiency of direct trade. The Russian sellers will have to submit to the Russian DAM at 10:30 CET and to Nord Pool Spot at 12:00 CET. However, it will be informed about the result of the Russian DAM at 16:00 CET, i.e. after gate closure for Nord Pool Spot. This implies that for the direct trade between Russia and Finland the sellers are exposed to additional risks as they cannot know if their bid to the Russian market has been accepted prior to submitting its bid to Nord Pool Spot.
Figure 4. Selected elements in gate closure for trade between Russia and Finland
Source: Sweco Energy Markets
8‐9 9‐10 10‐11 11‐12 12‐13 13‐14 14‐15 15‐16 16‐17 17‐18 18‐19 19‐20
09:30 MSK (06:30 CET) D‐1Buyers send bilateral trade schedules for the next commercial day to Fingrid and sellers.
20‐21
10:15 MSK (07:15 CET) D‐1Sellers send bilateral trading schedules for the day D to FSK
13:30 MSK (10:30 CET) D‐1Nord Pool Spot and Fingrid confirm and publish aggregated volume of commercial transmission capacity, volume of transmission capacity for direct trading and the aggregated bilateral trading schedule.
Russian seller submit price bids to the Russian DAM and the balancing market.
15:00 MSK (12:00 CET) D‐1Russian sellers submit price bids to Nord Pool Spot
19:00 MSK (16:00 CET) D‐1System operator submits to FSK and Fingrid the draft of preliminary balancing power schedule.System operator sends hourly price and volumes of the preliminary balancing power market schedule to FSK and the sellers.The Russian Administrator of the Trading System (ATS) informs the sellers about the results of the trading on the Russian DAM .

February, 2014 36 A Sweco Multiclient Study
Capacity Markets in Europe: Impacts on Trade and Investments
8 Interconnectors and cross-border trade in capacity
Inclusion of external generation capacity in a national capacity market is far from simple. In a European context with the market coupling arrangements of the Target Model, energy flows will be determined by spot energy prices. Under such an arrangement there is no guarantee that generation capacity sourced externally will actually be made available to the market area that has bought the capacity. The product is thus incompletely defined. However, with well-designed power markets one would expect that prices would be pushed up during periods of shortages directing the flows towards the region with the largest shortage, but this may not be the region which has procured the capacity.
There are several possible models for cross-border trade in generation capacity that are or have been under consideration. Four main models can be identified that in different way handles cross-border issues in relation to capacity markets. None of them are yet fully developed.
Model 1: External market participants participate directly in the capacity market
Under this model generators in one country would bid directly into a capacity market in another country. The maximum external capacity that would be accepted into the capacity market would be restricted by the interconnector capacity. The interconnector owner would receive revenues based on the price difference between external and domestic capacity bids.
A major issue with this arrangement is how the external resource owners can ensure delivery. Under arrangements based more on bilateral trade and use of physical transmission rights, a seller of capacity in one area could acquire point-to-point transmission rights and nominate capacity according to its commitments.
With implicit auctions this is no longer possible, as no individual market participant is actually trading cross-border. Everyone sells into and buys its local market, and the trade is determined by the price differentials. It is the coupled markets that trade, rather than any single market participant.
A market based solution could come from the use of call options, so called reliability contracts. With reliability options the customers could potentially be protected from prices above the strike price of the call option. If so, these customers would always outbid competing customers without the similar hedge. However, this would require that the customers are compensated for the actual consumed volume.
If the reliability option instead works as normal financial contracts where a fixed volume is hedged, the customers would still have incentives to place a price dependent bid independent of the separate financial compensation from the reliability contract. This would also support a flexible demand side, which is increasingly important from a security of supply perspective.
One can also discuss what the actual commitment of an external resource owner would be. In a situation where there is no domestic capacity market, the domestic demand (in the exporting country) for capacity credits would essentially be zero. For a supplier of capacity to an external market, the actual commitment by the
February, 2014 37 A Sweco Multiclient Study
Capacity Markets in Europe: Impacts on Trade and Investments
supplier is very limited given an imperfectly specified product.
There is a possibility that the buyer of the capacity can monitor and control that the supplier is available during shortage hours. That would imply a commitment. At the same time it is reasonable to expect that in most of these cases the price level would be such that the supplier would anyhow like to be available and produce. There is, however, a possibility that the commitment of capacity would to some extent limit the possibility to act e.g. in the balancing market. Nonetheless, our expectation is that the marginal bid of the external suppliers would be very low under these circumstances.
With a reliability options model the supplier of the capacity would have a financial commitment independent of where its generation is located. Under risk neutrality this would mainly be a swap of revenue streams, substituting a volatile revenue stream (energy price) for a more stable revenue stream (the capacity payment). For an external supplier of capacity this would however also imply a financial exposure, as they are selling the production in one market area and have issued a call option in another market.
Model 2: Interconnectors bid into the capacity market
An alternative set up would be that the interconnector bids into the capacity market, which is a model put forward as a possibility for the market in Great Britain (December, 2013). The interconnector owner (presumably the TSO) would then be backed by the entire system on the exporting side, but the individual resource owners on the exporting side would not be involved.
Under this model the interconnector would be responsible for the interconnector being technically available, and thus have to pay a penalty in case of unavailability. The interconnector would also be responsible for balancing in case energy is not delivered during a stressed situation.
The interconnector would be derated in a similar way as internal resources (generation or demand side), based on the expected contribution of the interconnector. This would primarily depend on the expected availability of the interconnector. A further derating based on expected direction of the flows in a scarcity situation is also likely.
The model would be consistent with the Target Model, as it would not interfere with the short term trade. While it cannot guarantee delivery in a stressed situation, energy prices would provide signals of scarcity and direct the flows towards the more scarce market. However, the introduction of a capacity market would likely lead to increased capacity margins, which would reduce peak prices. This would strengthen the incentives to export from the market with the capacity market to markets without capacity markets.
Furthermore, there could be a stressed situation in both markets at the same time. It is then not certain that flows would be directed towards the market that has the capacity market. The likelihood of simultaneous stressed situations would depend on how similar the systems are in terms of generation, demand and weather characteristics. If the markets are very similar, the likelihood of simultaneous stressed situations would be relatively high, which would call for a high derating of the interconnector between the areas. If the markets are very different, the likelihood of simultaneous stressed situations would instead be low, calling for a low derating of the interconnector capacity.

February, 2014 38 A Sweco Multiclient Study
Capacity Markets in Europe: Impacts on Trade and Investments
As the resource owners in the exporting market do not participate in this mechanism, there is no natural direct source of revenue from the capacity market for the resource owners (primarily the generators). Generators would primarily benefit from the fact that this model could strengthen the incentives to build interconnectors which would increase the possibilities of export and increase the price in the export market.
Model 3: Hybrid model
A hybrid model in which the capacity market adds back a capacity element on the spot price has also been considered. This would increase the price in stressed situation, and increase the likelihood of import to the market with the capacity market.
This model has previously been considered for the capacity market in Great Britain, although it does not reflect the latest thinking. That model consisted of two main elements:
The first element would be in the auction process for the GB capacity market. The rules for participation of external capacity would then be modified compared with domestic capacity. While non-GB suppliers cannot guarantee the direction
of flows, they should demonstrate a commitment to deliver and take steps to do so.
Non-GB participation would firstly be limited to the maximum capacity of the import capacity of the relevant interconnector. A pre-qualification criterion would be that the supplier would have a PTR to support the bid and they should undertake no to participate in any other market or mechanism.
The non-GB plant would have to generate to meet its capacity obligation and nominate energy using the PTRs in the direction of GB.
Furthermore the non-GB plant would be required to undergo the same testing and verification criteria as GB plants.
The second element is characterised as an incentive element utilising short term price signals. A capacity revenue fund would be established, which would be available to interconnector users. An annual capacity value would then be allocated to each settlement period throughout the year through the use of stress probabilities generated by the system operator. Capacity prices would then be paid to any interconnector user nominating energy in the
direction of GB and would be charged to anyone nominating energy out of GB.
The proposed model would allow for the inclusion of external resources and would be non-discriminatory, provided that the implementation is correct. It would furthermore support revenues of interconnectors, offsetting a possible reduction of congestion rents. This could also support the construction of new interconnectors. From a short term perspective, the uplift on the energy prices (the second element of the model) would distort energy flows across interconnectors. Those would no longer be based on the variable cost of generation, leading to a less efficient short term trade. A key issue with this model is that it probably is not in line with the Target Model.
Model 4: Payment to interconnector
A fourth model aiming at restoring the revenues for new interconnectors has also been considered. This model only has an indirect connection to the capacity market. A country with a capacity market would then acknowledge that a new interconnector would contribute to security of supply, and provide compensation for this. The compensation could then be linked to the security

February, 2014 39 A Sweco Multiclient Study
Capacity Markets in Europe: Impacts on Trade and Investments
of supply contribution, as well as the prices in the capacity market.
Two alternatives could be considered. In an ex ante model the parties would agree on expected contribution and provide compensation accordingly. In an ex post model one would instead calculate actual contribution and provide compensation for this. The latter model would naturally imply larger risk for the interconnector owner, as the contribution would not be known in advance.

February, 2014 40 A Sweco Multiclient Study
Capacity Markets in Europe: Impacts on Trade and Investments

February, 2014 41 A Sweco Multiclient Study
Capacity Markets in Europe: Impacts on Trade and Investments
PART III
QUANTITATIVE ANALYSIS

February, 2014 42 A Sweco Multiclient Study
Capacity Markets in Europe: Impacts on Trade and Investments
Following the qualitative discussions, in this Part III of the study we move to the quantitative modelling of the analysis. The modelling process was briefly described in section 3; as mentioned there, the work centres around two supply scenarios – the Current Policy Initiatives and the Diversified Supply Technologies scenarios – and four capacity market policy designs – the Target Model, the Integrated Capacity Market, the Coordinated Policy Scenario, and the National Policy. The results presented focus on the CPI supply scenario and the medium-term perspective of 2030, with the DST scenario and the years 2020 and 2040 brought into the discussion when of particular note.
9 Impact on system costs
9.1 Limited impact on total system cost with efficient implementation
Our analysis is based on the assumption that the different market design alternatives are implemented efficiently. As long as this is valid, the total system costs of the different market designs are relatively similar. In theory, this should be the case – indeed, if costs of shortages were also factored in, the system costs in the market designs may become even more similar.
The European system cost calculated refers to the sum of the variable costs of generation, the total capital costs of all new thermal capacity installed and the cost of non-delivered energy. It does not include the capital costs of existing generation or new renewable capacity. The European system cost of the designs with
capacity markets is slightly higher than the total system cost in the Target Model (TM). This arises because in our modelling of the capacity markets,
Figure 5. European system cost - Comparison between scenarios, relative to TM – CPI (year 2030)
Source: Sweco Energy Markets
0%10%20%30%40%50%60%70%80%90%
100%
Target Model Integrated CapacityMarket
CPS case 1 (FR,UK, IT, ES, PT))
CPS case 2 (case 1+ Germany)
CPS case 3 (case 1+ Germany +
Poland)
NP case 1 (FR, UK,IT, ES, PT)
Generation Costs CAPEX Costs Shortage cost
February, 2014 43 A Sweco Multiclient Study
Capacity Markets in Europe: Impacts on Trade and Investments
investments occur until there are no scarcity prices, whereas an economically optimal market has some (infrequent) periods of scarcity. In reality, regulators of capacity markets may indeed tend towards a limited degree of over-investment in order to avoid the greater risk of shortages. Additionally, as the modelling is deterministic, there could indeed be more outages in reality which would likely increase the system cost most in the Target Model.
The European system cost is highest in the Integrated Capacity Market (ICM), which is because most capacity is added in this policy design. The total system cost in the ICM is however only about 2% above the total system cost in the TM.
The different cases in the Coordinated Policy Scenario (CPS) policy designs are also slightly more expensive than the TM, but less so than the ICM. National Policy (NP) case 1 is also slightly more expensive than CPS case 1. This shows that even the relatively small changes between these two scenarios – not allowing for import of capacity credits nor an uplift on export in scarcity hours in the NP – increases the costs somewhat.
In reality, efficient implementation is naturally difficult. One example is in estimating the correct reserve margin. Requiring too high reserve margins would increase overall costs, but our results support that a slight over capacity would not have a major impact on the investment cost. Given the uncertainty about future demand, slight over investment may be less costly, socially than the risk of shortages; the problem is that the latter are difficult to quantify.
A key challenge for national capacity markets is how one should deal with the regional nature of capacity without restricting trade unduly. Trading capacity between regions would require long-term access to congested interconnectors (PTRs or FTRs).
Finally, there are many design variables in capacity markets, which inevitably leads to national variations (if implementation occurs at a national level). This alone would be a barrier to trade due to the reduced transparency.
In our approach, we assumed that in each capacity market design, sufficient capacity is added in the markets with a capacity market to avoid shortages. In our modelling it is also difficult to take all possible all details in the
designs into account. A relatively efficient outcome can then be expected.
Furthermore, the available technologies are similar in the different market areas. In our analysis, investments in renewable generation, nuclear capacity and hydro power are driven by our assumptions and not the profitability as such. This implies that the available additional investments in the modelling are mainly conventional thermal generation of different types. While in reality fuel prices may differ somewhat between the European market areas, the total costs of the different conventional thermal technologies are relatively similar across these areas.
Between the market designs there is also no difference in the cost of capital. On the one hand, one of the aims of capacity markets is to reduce some uncertainty around future revenues, which should reduce the cost of capital in designs with capacity markets since it should be seen as a less risky investment. On the other hand, however, capacity markets also introduce a new policy uncertainty, and risk would only be reduced if investors had faith in the policy framework and there being less regulatory changes in the future.
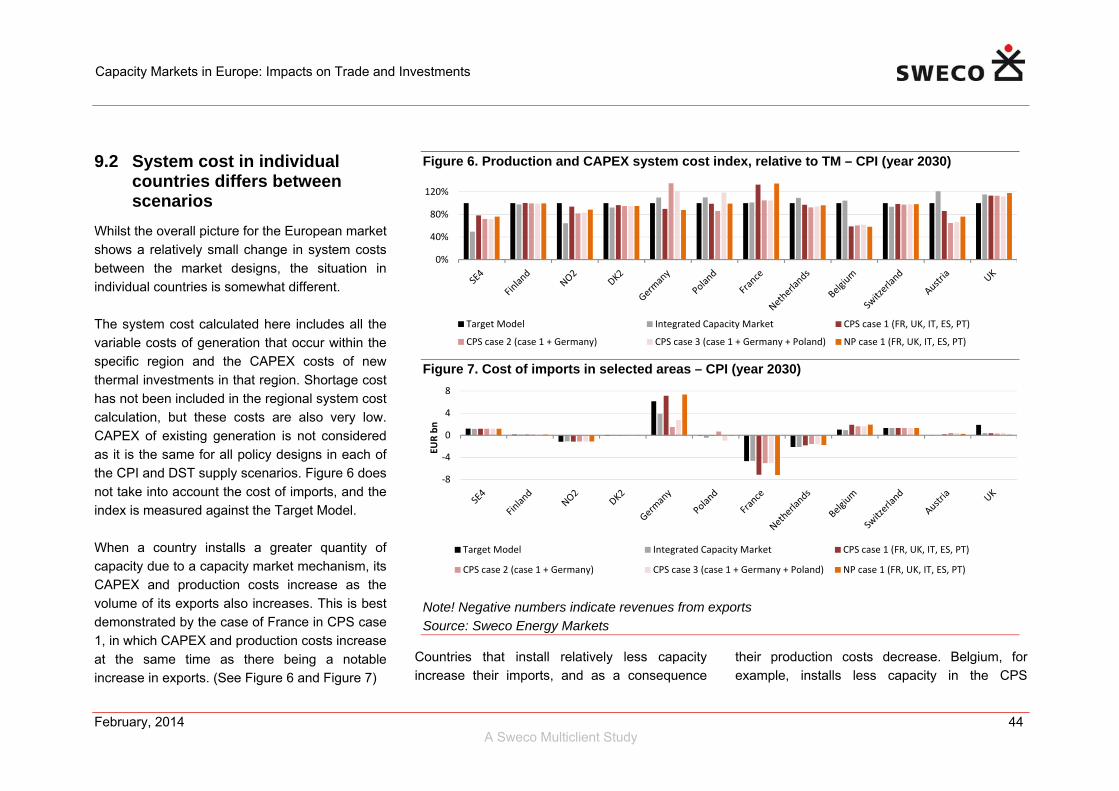
February, 2014 44 A Sweco Multiclient Study
Capacity Markets in Europe: Impacts on Trade and Investments
9.2 System cost in individual countries differs between scenarios
Whilst the overall picture for the European market shows a relatively small change in system costs between the market designs, the situation in individual countries is somewhat different.
The system cost calculated here includes all the variable costs of generation that occur within the specific region and the CAPEX costs of new thermal investments in that region. Shortage cost has not been included in the regional system cost calculation, but these costs are also very low. CAPEX of existing generation is not considered as it is the same for all policy designs in each of the CPI and DST supply scenarios. Figure 6 does not take into account the cost of imports, and the index is measured against the Target Model.
When a country installs a greater quantity of capacity due to a capacity market mechanism, its CAPEX and production costs increase as the volume of its exports also increases. This is best demonstrated by the case of France in CPS case 1, in which CAPEX and production costs increase at the same time as there being a notable increase in exports. (See Figure 6 and Figure 7)
Countries that install relatively less capacity increase their imports, and as a consequence
their production costs decrease. Belgium, for example, installs less capacity in the CPS
Figure 6. Production and CAPEX system cost index, relative to TM – CPI (year 2030)
Figure 7. Cost of imports in selected areas – CPI (year 2030)
Note! Negative numbers indicate revenues from exports Source: Sweco Energy Markets
0%
40%
80%
120%
Target Model Integrated Capacity Market CPS case 1 (FR, UK, IT, ES, PT)
CPS case 2 (case 1 + Germany) CPS case 3 (case 1 + Germany + Poland) NP case 1 (FR, UK, IT, ES, PT)
‐8
‐4
0
4
8
EUR bn
Target Model Integrated Capacity Market CPS case 1 (FR, UK, IT, ES, PT)
CPS case 2 (case 1 + Germany) CPS case 3 (case 1 + Germany + Poland) NP case 1 (FR, UK, IT, ES, PT)

February, 2014 45 A Sweco Multiclient Study
Capacity Markets in Europe: Impacts on Trade and Investments
policies and sees a decrease in production and CAPEX costs, whilst its cost of imports increases as it takes advantage of the significant investments in France.
In the NP, the system costs in the countries implementing a capacity market increase quite significantly in some cases, due to the increased local generation, but again they may be (partly) offset by revenues from exports.
Adjusting the system cost for the value of import/export provides a possibly more interesting comparison at the national level.
The costs of imports, shown in Figure 7, can vary significantly – according to who has implemented a capacity market – which is driven by the change in location of investments. For example, Poland in most designs is a net exporter, but in CPS case 2, when Germany implements a capacity market, it becomes a net importer as it takes advantage of the lower prices in Germany where a much greater capacity has been installed.
For France the system cost adjusted for net imports are essentially the same in the CPS case 1 and NP case 1. In the CPS case 1 the cost
increases by 12% compared with TM and in the NP case 1 the increase is about 13%.
For the UK, the cost difference between the CPS case 1 and NP case 1 is somewhat larger in relative terms. In the CPS case 1 the total costs increase by slightly less than 3% and in the NP case 1 the total costs increase by slightly less than 5%, compared with the TM.
The results show that it is difficult to draw general conclusions on the impact at a national level. For instance, German system costs adjusted for import fall slightly in the CPS case 1, but even
more in the CPS case 2 (when Germany also introduces a capacity market) and even further in the CPS case 3 (when Poland also introduces a capacity market). This is in contrast to France and UK, both of which have higher total costs in the different CPS policies than in the TM. Poland also seems to lose from the introduction of a capacity market when neighbouring countries also implement one.
When studying the domestic system cost (production), it seems clear that system costs fall in a country when its neighbours introduce capacity markets. However, when adjusting for
Figure 8. System cost index adjusted for net import (valued at market prices) – CPI (year 2030)
Source: Sweco Energy Markets
0%
20%
40%
60%
80%
100%
120%
Target Model Integrated Capacity Market CPS case 1 (FR, UK, IT, ES, PT)
CPS case 2 (case 1 + Germany) CPS case 3 (case 1 + Germany + Poland) NP case 1 (FR, UK, IT, ES, PT)

February, 2014 46 A Sweco Multiclient Study
Capacity Markets in Europe: Impacts on Trade and Investments
net imports there is no longer an obvious conclusion.
Some market areas still gain when adjusting for net imports, such as SE4 and NO2. In many cases the net effect is close to zero. This is the case for such different countries as Finland and Switzerland. Other market areas seem to lose, e.g. the net effect on Austria when Germany introduces a capacity market seems to be negative.
In this latter example, in Austria when Germany introduces a capacity mechanism in CPS cases 2 and 3, we see that the system cost increases. Here, there is no capacity installed, and the increase in the cost of imports more than offsets the decrease in local generation costs, thus increasing the system cost. There is a large increase in trade involving Austria – Austria both imports more and generates less, but also greatly increases transit trade, this means that transmission losses, although small, become more important.
Additionally, Austria is a hydro-dominated country and the share of thermal generation is low. In the system cost calculation generation is valued at marginal cost which implies that e.g. hydro, wind
and solar come in at zero, or very low, cost. Small changes in any costs thus result in large percentage changes. This is also true for other hydro-dominated countries. So whilst this is striking in Figure 8 and seems counterintuitive, it has a simple explanation.

February, 2014 47 A Sweco Multiclient Study
Capacity Markets in Europe: Impacts on Trade and Investments
10 Price impact and customer costs
10.1 Total customer cost The total cost to customers consists of the combined payments for electricity (energy), renewables subsidies and any capacity payment (excluding grid costs). As previously noted, the introduction of a capacity market reduces the energy price, but on the other hand the capacity payments are added. In addition, a reduced energy price will typically require higher subsidies for intermittent renewable power generation as they will earn relatively little, if anything, from the capacity market.
Comparing the total cost to customers for the different policies, we first note that customers in the non-hydro dominated part of the Nordics (Denmark, SE3 and SE4) clearly lose from the introduction of an Integrated Capacity Market (ICM), with cost increases of 6-11 EUR/MWh in the market areas in Denmark, Finland and Southern Sweden, compared with the Target Model (TM). This is caused by the fact that no capacity is added in the Nordics and that the wholesale price effect from the continent –pushing wholesale prices down – is relatively
small. Additionally, in SE3, SE4 and DK2, the capacity price is lower than in Continental Europe, but several times greater than the decrease in wholesale price in these regions, and hence still high enough to increase the total cost. DK1 experiences the largest cost increase in the ICM compared to the TM [not shown in diagram]. This is explained by the fact that the capacity price reaches the German level, while the wholesale electricity price reduction is less than in Germany.
In the hydro-dominated parts of the Nordic (Norway, SE1 and SE2), the total customer cost is changed relatively little. The wholesale electricity price falls somewhat due to the increased capacity in Continental Europe, while there is sufficient capacity in order to hold capacity prices at a low level. Which effect dominates depends on the area. In some market areas we observe a slight decrease in the total customer costs (less than 1 EUR/MWh) in the ICM compared with the TM, while in other market
Figure 9. Customer cost change (relative to cost in TM scenario), EUR/MWh – CPI (year 2030)
Source: Sweco Energy Markets
‐10
‐5
0
5
10
EUR/MWh
Integrated Capacity Market CPS case 1 (FR, UK, IT, ES, PT) CPS case 2 (case 1 + Germany)CPS case 3 (case 1 + Germany + Poland) NP case 1 (FR, UK, IT, ES, PT)

February, 2014 48 A Sweco Multiclient Study
Capacity Markets in Europe: Impacts on Trade and Investments
areas there is a slight increase (up to around 1 EUR/MWh).
In Continental Europe, the picture is also less clear. In countries which have more limited need for new capacity and where the wholesale price effect is more limited, e.g. Netherlands, the customers lose quite significantly in the ICM, with an overall cost increase of slightly more than 8 EUR/MWh, i.e. much like in the thermal dominated parts of the Nordic region.
In other continental European countries the effect is less clear. In the ICM the costs increase with 3-5 EUR/MWh, depending on country, compared with the TM.
In general we see an interesting free-rider effect from the introduction of capacity markets in individual countries. Particularly for countries in continental Europe, the customers in countries that do not introduce capacity markets gain through overall reduced costs when other countries introduce capacity markets.
This effect is particularly strong for countries such as Austria, Switzerland, Belgium and the Netherlands in the different Coordinated Policy Scenarios (CPS), but it can also be observed for
Germany in the CPS case 1, when capacity markets are introduced in France, UK, Italy, Spain and Portugal. In this case, the total customer costs decrease slightly in Germany as it can rely on the additional investments made in other countries.
The Nordic customers also gain from the introduction of capacity markets in Continental Europe and UK, although the effect is relatively small in the different cases under the CPS.
The impact of the National Policy (NP) design on customer cost is relatively limited. However, for a country such as France the customer costs are reduced in the NP case 1 compared with the CPS case 1. The reason is that buying external resources results in a leakage from France, i.e. French customers pay for capacity that is used in other countries.
Consider for instance the case when German producers offer capacity into the French market. Under the market design assumptions made, trade is purely determined by the energy prices in the CPS. There are no possibilities for a generator in one area to commit to a physical delivery in another area.
Additional capacity in German firstly benefits the German market and as a secondary effect neighbouring markets through increased (net) exports from Germany.
As the capacity margin in the model is set such that shortage situations are avoided in the markets with a capacity mechanism, France has to acquire more capacity in the CPS compared with the NP. While more resources are available, which potentially could reduce the price of capacity, the volume effect of acquiring additional resources dominate.
However, if Germany also introduces a capacity market, such as in CPS case 2, the cost for French customers are reduced as they share the cost with German customers of the additional generation capacity.
The assumption of optimal investment levels could impact these conclusions greatly – if there are over- or under-investments, especially the latter within the TM, then it could very well turn out that the TM does create the most expensive cost to customers. This is considered in more depth in section 10.7.
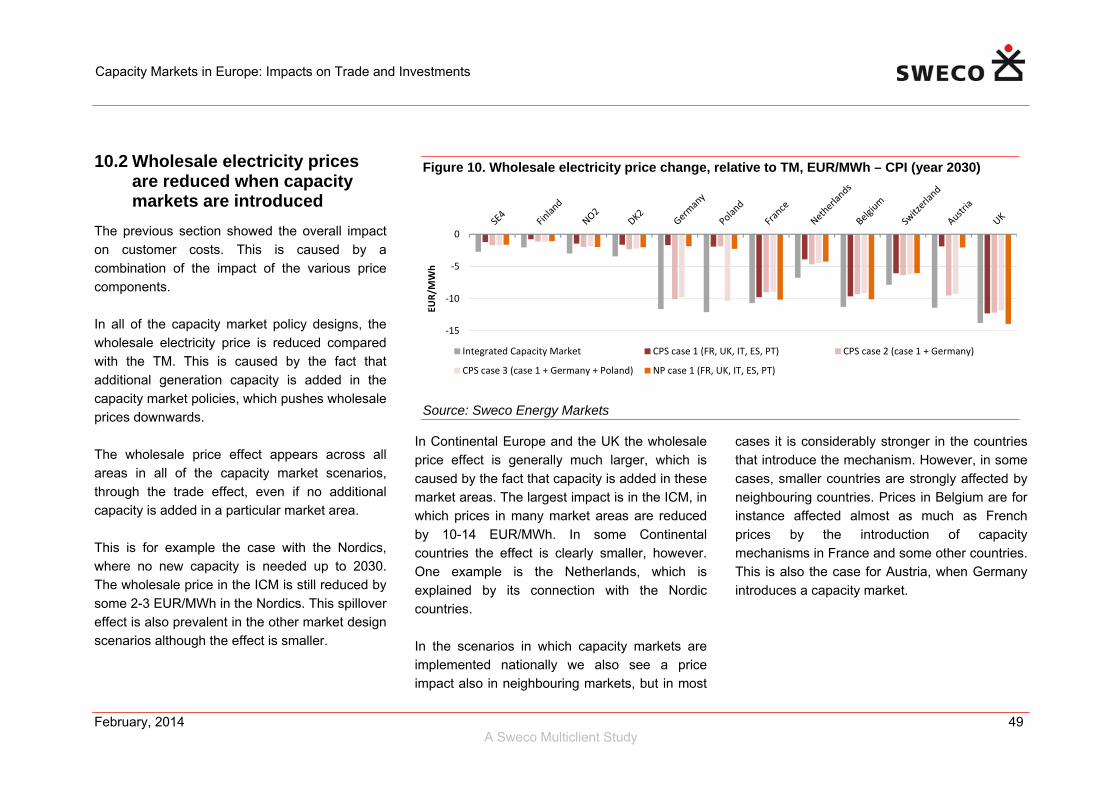
February, 2014 49 A Sweco Multiclient Study
Capacity Markets in Europe: Impacts on Trade and Investments
10.2 Wholesale electricity prices are reduced when capacity markets are introduced
The previous section showed the overall impact on customer costs. This is caused by a combination of the impact of the various price components.
In all of the capacity market policy designs, the wholesale electricity price is reduced compared with the TM. This is caused by the fact that additional generation capacity is added in the capacity market policies, which pushes wholesale prices downwards.
The wholesale price effect appears across all areas in all of the capacity market scenarios, through the trade effect, even if no additional capacity is added in a particular market area.
This is for example the case with the Nordics, where no new capacity is needed up to 2030. The wholesale price in the ICM is still reduced by some 2-3 EUR/MWh in the Nordics. This spillover effect is also prevalent in the other market design scenarios although the effect is smaller.
In Continental Europe and the UK the wholesale price effect is generally much larger, which is caused by the fact that capacity is added in these market areas. The largest impact is in the ICM, in which prices in many market areas are reduced by 10-14 EUR/MWh. In some Continental countries the effect is clearly smaller, however. One example is the Netherlands, which is explained by its connection with the Nordic countries.
In the scenarios in which capacity markets are implemented nationally we also see a price impact also in neighbouring markets, but in most
cases it is considerably stronger in the countries that introduce the mechanism. However, in some cases, smaller countries are strongly affected by neighbouring countries. Prices in Belgium are for instance affected almost as much as French prices by the introduction of capacity mechanisms in France and some other countries. This is also the case for Austria, when Germany introduces a capacity market.
Figure 10. Wholesale electricity price change, relative to TM, EUR/MWh – CPI (year 2030)
Source: Sweco Energy Markets
‐15
‐10
‐5
0
EUR/MWh
Integrated Capacity Market CPS case 1 (FR, UK, IT, ES, PT) CPS case 2 (case 1 + Germany)
CPS case 3 (case 1 + Germany + Poland) NP case 1 (FR, UK, IT, ES, PT)

February, 2014 50 A Sweco Multiclient Study
Capacity Markets in Europe: Impacts on Trade and Investments
10.3 Capacity prices vary greatly between capacity market designs
The capacity price is the marginal bid into each of the national capacity markets – in all but the NP design, this price may be set by a technology inside or outside of the region in question.
In the ICM, the capacity price is almost the same in most market areas. This is due to the fact that the internal demand for capacity plus the potential for export of “capacity credits” is sufficient to equalize the price across most markets. We have restricted the trade in capacity credits by the available transmission capacity. In reality it is possible that the allowed volume of trade would be reduced further, due to other restrictions. Nevertheless, it indicates that in this policy capacity prices would be relatively similar across many European market areas.
In all the patchwork policy designs, there are national capacity markets in certain regions. In those regions with no national capacity market, the capacity price is zero. In the CPS policy design, however, there is the possibility to export capacity credits into the national capacity markets, whether or not the exporting region has
a capacity market itself. The marginal bid in the exporting areas under the CPS policy design is typically low. This is explained by the fact that there is no internal demand for capacity credits in the exporting country and the actual commitment of the producers is limited. They would prefer to produce at maximum level during shortage hours in any case, so the downside of committing resources is limited. In reality, there is a possibility that the commitment would lead to some costs, but we expect that these costs would be limited. Depending on the market structure, there is a possibility that the winning bidder would be paid something different than the marginal bid under perfect competition.
The most important implication of allowing trade in capacity credits is that, under the right market design, it could create a demand for transmission capacity. If the bidder of generation capacity would also have to acquire transmission capacity, it would increase the demand for transmission capacity. Given a market design with implicit auctioning of transmission capacity, it is however unclear how this demand for transmission capacity would be realized. Financial transmission rights could provide a solution. Whatever the solution, if it could be realized, it would allow for a possibility of increased interconnector revenues.
Figure 11. Capacity price, EUR/kW/year – CPI (year 2030)
Source: Sweco Energy Markets
0
20
40
60
80
EUR/kW
Integrated Capacity Market CPS case 1 (FR, UK, IT, ES, PT) CPS case 2 (case 1 + Germany)
CPS case 3 (case 1 + Germany + Poland) NP case 1 (FR, UK, IT, ES, PT)
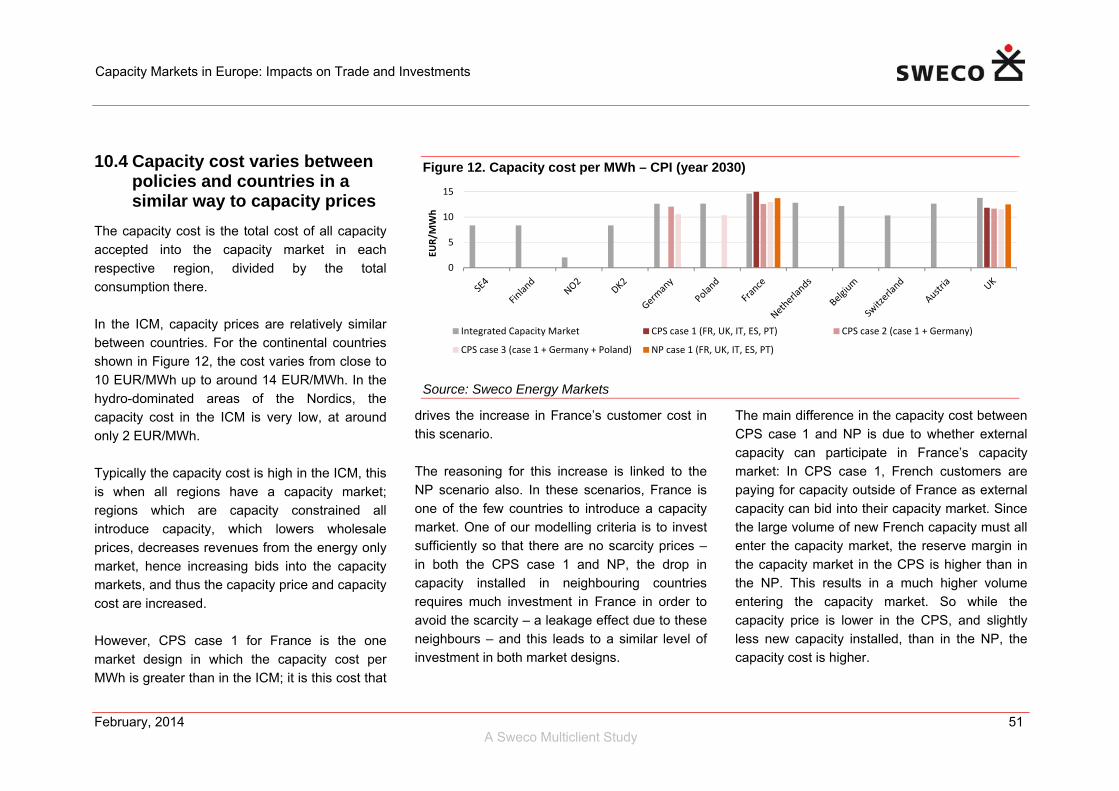
February, 2014 51 A Sweco Multiclient Study
Capacity Markets in Europe: Impacts on Trade and Investments
10.4 Capacity cost varies between policies and countries in a similar way to capacity prices
The capacity cost is the total cost of all capacity accepted into the capacity market in each respective region, divided by the total consumption there.
In the ICM, capacity prices are relatively similar between countries. For the continental countries shown in Figure 12, the cost varies from close to 10 EUR/MWh up to around 14 EUR/MWh. In the hydro-dominated areas of the Nordics, the capacity cost in the ICM is very low, at around only 2 EUR/MWh.
Typically the capacity cost is high in the ICM, this is when all regions have a capacity market; regions which are capacity constrained all introduce capacity, which lowers wholesale prices, decreases revenues from the energy only market, hence increasing bids into the capacity markets, and thus the capacity price and capacity cost are increased.
However, CPS case 1 for France is the one market design in which the capacity cost per MWh is greater than in the ICM; it is this cost that
drives the increase in France’s customer cost in this scenario.
The reasoning for this increase is linked to the NP scenario also. In these scenarios, France is one of the few countries to introduce a capacity market. One of our modelling criteria is to invest sufficiently so that there are no scarcity prices – in both the CPS case 1 and NP, the drop in capacity installed in neighbouring countries requires much investment in France in order to avoid the scarcity – a leakage effect due to these neighbours – and this leads to a similar level of investment in both market designs.
The main difference in the capacity cost between CPS case 1 and NP is due to whether external capacity can participate in France’s capacity market: In CPS case 1, French customers are paying for capacity outside of France as external capacity can bid into their capacity market. Since the large volume of new French capacity must all enter the capacity market, the reserve margin in the capacity market in the CPS is higher than in the NP. This results in a much higher volume entering the capacity market. So while the capacity price is lower in the CPS, and slightly less new capacity installed, than in the NP, the capacity cost is higher.
Figure 12. Capacity cost per MWh – CPI (year 2030)
Source: Sweco Energy Markets
0
5
10
15
EUR/MWh
Integrated Capacity Market CPS case 1 (FR, UK, IT, ES, PT) CPS case 2 (case 1 + Germany)
CPS case 3 (case 1 + Germany + Poland) NP case 1 (FR, UK, IT, ES, PT)
February, 2014 52 A Sweco Multiclient Study
Capacity Markets in Europe: Impacts on Trade and Investments
The French situation can be compared with the UK case, in which the customer cost in the NP is higher than in the CPS case 1. As the UK is less interconnected with neighbouring countries than France, the leakage is limited but UK customers can benefit from acquiring resources abroad in the capacity market. The UK can also acquire resources from the Norway, for which there is no competition in CPS case 1.
This shows how the same market design choices can have different impacts in different countries due to factors such as relative market size, how interconnected the markets are, and which alternative resources are available.
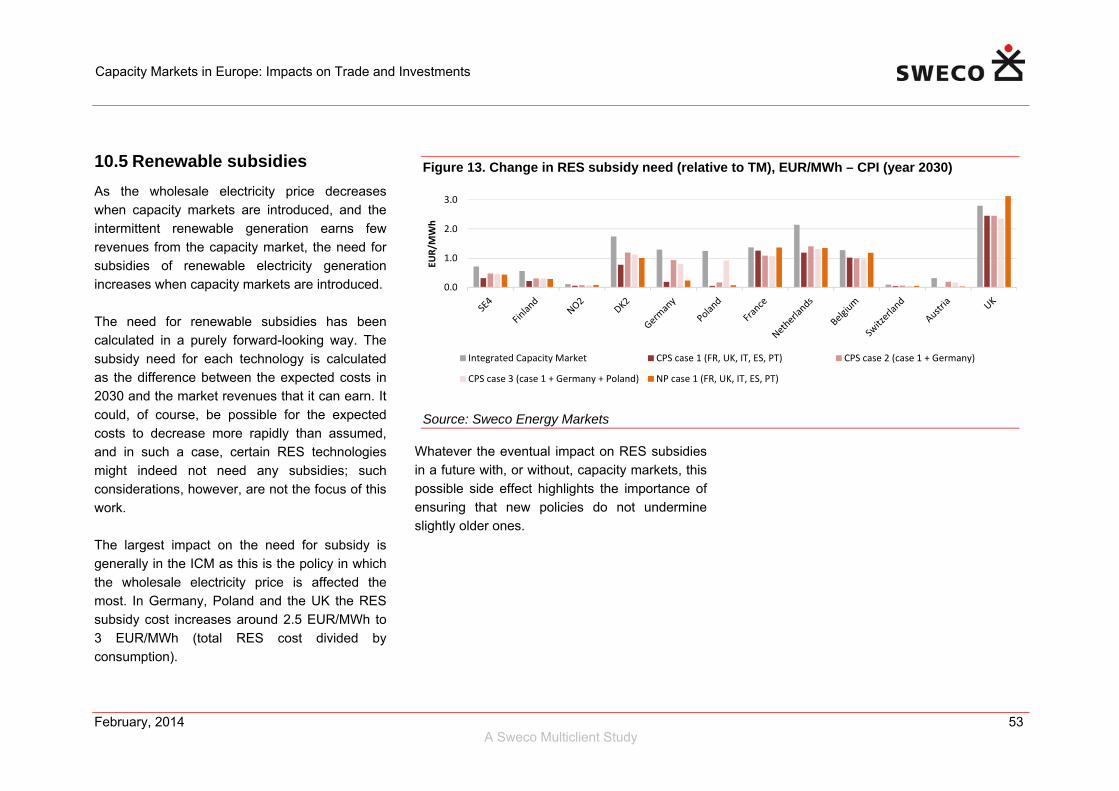
February, 2014 53 A Sweco Multiclient Study
Capacity Markets in Europe: Impacts on Trade and Investments
10.5 Renewable subsidies As the wholesale electricity price decreases when capacity markets are introduced, and the intermittent renewable generation earns few revenues from the capacity market, the need for subsidies of renewable electricity generation increases when capacity markets are introduced.
The need for renewable subsidies has been calculated in a purely forward-looking way. The subsidy need for each technology is calculated as the difference between the expected costs in 2030 and the market revenues that it can earn. It could, of course, be possible for the expected costs to decrease more rapidly than assumed, and in such a case, certain RES technologies might indeed not need any subsidies; such considerations, however, are not the focus of this work.
The largest impact on the need for subsidy is generally in the ICM as this is the policy in which the wholesale electricity price is affected the most. In Germany, Poland and the UK the RES subsidy cost increases around 2.5 EUR/MWh to 3 EUR/MWh (total RES cost divided by consumption).
Whatever the eventual impact on RES subsidies in a future with, or without, capacity markets, this possible side effect highlights the importance of ensuring that new policies do not undermine slightly older ones.
Figure 13. Change in RES subsidy need (relative to TM), EUR/MWh – CPI (year 2030)
Source: Sweco Energy Markets
0.0
1.0
2.0
3.0
EUR/MWh
Integrated Capacity Market CPS case 1 (FR, UK, IT, ES, PT) CPS case 2 (case 1 + Germany)
CPS case 3 (case 1 + Germany + Poland) NP case 1 (FR, UK, IT, ES, PT)
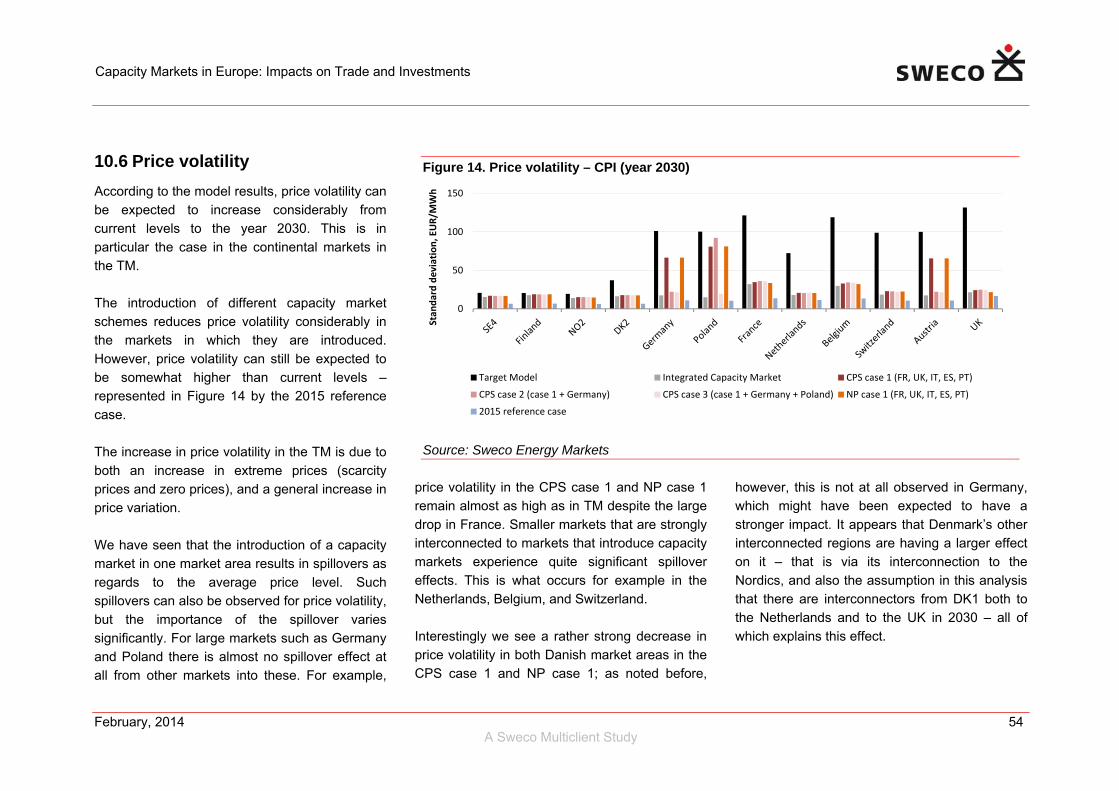
February, 2014 54 A Sweco Multiclient Study
Capacity Markets in Europe: Impacts on Trade and Investments
10.6 Price volatility According to the model results, price volatility can be expected to increase considerably from current levels to the year 2030. This is in particular the case in the continental markets in the TM.
The introduction of different capacity market schemes reduces price volatility considerably in the markets in which they are introduced. However, price volatility can still be expected to be somewhat higher than current levels – represented in Figure 14 by the 2015 reference case.
The increase in price volatility in the TM is due to both an increase in extreme prices (scarcity prices and zero prices), and a general increase in price variation.
We have seen that the introduction of a capacity market in one market area results in spillovers as regards to the average price level. Such spillovers can also be observed for price volatility, but the importance of the spillover varies significantly. For large markets such as Germany and Poland there is almost no spillover effect at all from other markets into these. For example,
price volatility in the CPS case 1 and NP case 1 remain almost as high as in TM despite the large drop in France. Smaller markets that are strongly interconnected to markets that introduce capacity markets experience quite significant spillover effects. This is what occurs for example in the Netherlands, Belgium, and Switzerland.
Interestingly we see a rather strong decrease in price volatility in both Danish market areas in the CPS case 1 and NP case 1; as noted before,
however, this is not at all observed in Germany, which might have been expected to have a stronger impact. It appears that Denmark’s other interconnected regions are having a larger effect on it – that is via its interconnection to the Nordics, and also the assumption in this analysis that there are interconnectors from DK1 both to the Netherlands and to the UK in 2030 – all of which explains this effect.
Figure 14. Price volatility – CPI (year 2030)
Source: Sweco Energy Markets
0
50
100
150
Stan
dard deviatio
n, EUR/MWh
Target Model Integrated Capacity Market CPS case 1 (FR, UK, IT, ES, PT)
CPS case 2 (case 1 + Germany) CPS case 3 (case 1 + Germany + Poland) NP case 1 (FR, UK, IT, ES, PT)
2015 reference case

February, 2014 55 A Sweco Multiclient Study
Capacity Markets in Europe: Impacts on Trade and Investments
10.7 Impact of non-optimal investments
The previously presented results rest on a long-run equilibrium scenario, in which optimal investments are made for the respective policies. In reality there is policy and market uncertainty and investments will not be optimal.
We have applied two generation scenarios, which result in different investment patterns. There is some difference in the total level of investments, but also a difference in the technology mix. In general there are fewer investments in the DST scenario than in the CPI scenario and investments are more steered towards gas-fired power plants in the DST scenario and more towards coal-fired power plants in the CPI scenario.
In order to analyse non-optimal investments we have switched investments between the two generation scenarios for the Target Model case, i.e. for the CPI scenario we have used the optimal investments from the DST scenario, and vice versa.
In the TM, in every region which has investments, there are more investments in the CPI scenario
Figure 15. Change in average price with non-optimal investments, percentage change relative to optimal (year 2030) – DST investments into the CPI scenario
Figure 16. Change in average price with non-optimal investments, percentage change relative to optimal (year 2030) – CPI investments into the DST scenario
Source: Sweco Energy Markets
‐5%
5%
15%
25%
35%
SE4 Finland NO2 DK2 Germany Poland France Netherlands Belgium Switzerland Austria UK
Target Model Integrated Capacity Market CPS case 1 (FR, UK, IT, ES, PT)
CPS case 2 (case 1 + Germany) CPS case 3 (case 1 + Germany + Poland) NP case 1 (FR, UK, IT, ES, PT)
‐7%
‐5%
‐3%
‐1%
1%
SE4 Finland NO2 DK2 Germany Poland France Netherlands Belgium Switzerland Austria UK
Target Model Integrated Capacity Market CPS case 1 (FR, UK, IT, ES, PT)
CPS case 2 (case 1 + Germany) CPS case 3 (case 1 + Germany + Poland) NP case 1 (FR, UK, IT, ES, PT)

February, 2014 56 A Sweco Multiclient Study
Capacity Markets in Europe: Impacts on Trade and Investments
than the DST. This means that under-investments occur in the CPI scenario if investors assume the DST scenario, resulting in higher prices and more scarcity. And vice versa, over-investments occur in the DST scenario if investors assume the CPI scenario, engendering lower prices and less scarcity, but also poorer recovery of investment costs.
In the ICM, several countries actually invest slightly less in the CPI than the DST, most notably Germany and the Netherlands. In these cases, when there is “too much” investment with DST investments in the CPI scenario, these countries show little change in prices, but when too little investment takes place with CPI assumed by investors and the DST actually happening, there is a slightly greater effect with marginally higher prices.
For the Nordic countries this has little effect on average prices and the frequency of either zero prices or very high prices. In this region there is no new investment in thermal generation, so the observed impact is due to imports from the continent.
In continental Europe there is an increase in the average wholesale power price of around 10%
Figure 17. Change in number of scarcity prices with non-optimal investments, relative to optimal (year 2030) – DST investments into the CPI scenario
Figure 18. Change in number of scarcity prices with non-optimal investments, relative to optimal (year 2030) – CPI investments into the DST scenario
Source: Sweco Energy Markets
0
20
40
60
SE4 Finland NO2 DK2 Germany Poland France Netherlands Belgium Switzerland Austria UK
Target Model Integrated Capacity Market CPS case 1 (FR, UK, IT, ES, PT)
CPS case 2 (case 1 + Germany) CPS case 3 (case 1 + Germany + Poland) NP case 1 (FR, UK, IT, ES, PT)
‐12
‐8
‐4
0SE4 Finland NO2 DK2 Germany Poland France Netherlands Belgium Switzerland Austria UK
Target Model Integrated Capacity Market CPS case 1 (FR, UK, IT, ES, PT)
CPS case 2 (case 1 + Germany) CPS case 3 (case 1 + Germany + Poland) NP case 1 (FR, UK, IT, ES, PT)

February, 2014 57 A Sweco Multiclient Study
Capacity Markets in Europe: Impacts on Trade and Investments
when DST investments are used in the CPI scenario, and there is an increase in the frequency of very high prices by 30-40%. This is the natural impact of under-investment due to errors in expectations about policy and market developments.
The flip side would be over-investment due to errors in policy and market expectations, which would be the case when the CPI investments are used in the DST scenario. Again, the Nordics are hardly affected at all, and the number of zero prices is not affected in any country. This is natural since the errors in investments only concern investments in conventional thermal generation.
Hours with very high prices however almost disappear. Throughout Continental Europe we see that the number of hours with prices at 1,000 EUR/MWh or higher decreases by around 70-80%, from a relatively low initial level.
These results represent how prices and security of supply can be affected when investments are non-optimal, which is more likely to happen the more uncertainty there is. The results show a greater impact with under-investments than with over-investments, with much greater increases in
price levels and number of scarcity prices with under-investment (DST into CPI) than decreases in these values with over-investment (CPI into DST).
When taking into account the social costs of under- or over-investment, with high costs of outages, it could be expected that the costs of under-investment would be even higher. So if there is a risk of under-investment, the case for a capacity market becomes stronger than we calculated here.

February, 2014 58 A Sweco Multiclient Study
Capacity Markets in Europe: Impacts on Trade and Investments
11 Impact on investment in electricity generation capacity
11.1 Power companies are facing a difficult situation in the short term
The first important question is whether an energy-only market can be expected to maintain adequate generation capacity and deliver sufficient investment for maintaining the current high level of security of supply?
Our analysis suggests that this question has different answers depending on the time horizon.
In the shorter time frame – up to 2020 – the key issue is to avoid possible excessive closure or mothballing. Current market expectations indicate that power prices will be low at least until 2020. Our model yields somewhat higher power prices, which can be explained from various input assumptions, but still it would be difficult to uphold flexible CCGT and OCGT power plants.
CCGT and OCGT as well as older condensing units will have significant difficulties covering their fixed operating expenditures according to our analysis. We have assumed that plants that are not covering their fixed opex are closed or
mothballed. This is however a kind of worst case scenario, given that any remunerations for balancing and redispatching are not considered.
There are large differences in mothballed capacities between countries. One country that stands out is Germany. According to our analysis, a total of almost 12 GW of conventional generation in Germany that does not cover its fixed opex and that thus is mothballed in our model. This means that almost all CCGT and gas turbine capacity in Germany is mothballed. Some of this mothballed capacity would become part of
the German strategic reserve, which is not taken into account here. Significant CCGT capacity is also being mothballed in other Continental European countries.
In some countries, such as Poland, mothballing is limited. In this analysis it is assumed that older units will be decommissioned according to standard lifetime expectations. The generation fleet in Poland is relatively old and we thus assume high levels of decommissioning, leaving less capacity which can in fact be mothballed. In reality, several plants may be kept in the system
Figure 19. Mothballed or early retired capacity – CPI (year 2020)
Source: Sweco Energy Markets
0
2
4
6
8
10
12
DK Germany Poland France Switzerland Austria Netherlands Belgium
GW
CHP Condensing Coal CCGT Condensing Other Condensing Gas
Condensing Fuel Oil Condensing Gas Oil OCGT_Gas OCGT_Gasoil

February, 2014 59 A Sweco Multiclient Study
Capacity Markets in Europe: Impacts on Trade and Investments
longer than these assumptions – these plants might then be mothballed if they were to be present in 2020 according to our analysis here, and this would hence increase the total volume mothballed in Poland.
To some extent this is also true for Denmark. In addition to this we have also mothballed a further 1.5 GW of capacity in Denmark. Since most of remaining thermal capacity in Denmark consists of CHP units it is more challenging to assess their profitability. We have however assumed that roughly 1 GW of mainly gas-fired CHP is mothballed.
Mothballing has a clear but limited impact on average prices. The price increase in most of continental Europe is around 1 EUR/MWh and over 2 EUR/MWh in Denmark, but is lower in the rest of the Nordics.
More importantly, mothballing increases price volatility and gives rise to periods with shortage prices. In continental Europe, the maximum price (3 000 EUR/MWh) is reached for a few hours each year.
Power companies are facing a difficult financial situation as a result of which closure or
mothballing of power plants can be expected in an energy-only market. Our analysis indicates that shortage prices will occur during a few hours each year in continental Europe, even under normal situations, which is in line with expectations for optimal investments in an energy-only market.
It is important to realise that the model is based on the assumption that the power system is working “normally”, i.e. that there are no grid or generation-related disturbances which we would
expect to occur in a real power system. In addition, it is possible that some of the mothballed OCGT capacity may be maintained if we take revenues from regulation markets more into account.
The key issue in the shorter time frame is, with some exceptions, not as much to stimulate new investments as it is to maintain sufficient capacity in a low-price environment.
Figure 20. Price duration curves with mothballing/early retirement, first 50 hours, CPI 2020
Source: Sweco Energy Markets
0
500
1000
1500
2000
2500
3000
3500
EUR/MWh
SE4 Finland NO2 DK1 DK2 Germany
Poland France Netherlands Belgium Switzerland Ireland

February, 2014 60 A Sweco Multiclient Study
Capacity Markets in Europe: Impacts on Trade and Investments
11.2 Long-run impact on generation investment
In the Target Model (TM), a substantial volume of generation is added in Europe in the period until 2030. In our model, investment takes place as long as it is profitable in a given scenario, which could be interpreted as perfect foresight. The rate of return requirement is set relatively high (10% real). We do not assume any market failures or “excessive” risk aversion in the TM.
Given this starting situation, we have assumed that a capacity market would be aimed at increasing the capacity margin in the system. Under the capacity market policies, we have assumed that capacity is added so that scarcity pricing is avoided.
With this approach, any capacity mechanism would increase overall generation capacity in Europe as a whole compared to the TM, with the Integrated Capacity Market (ICM) inducing the largest quantity. This trend is the same for both the CPI and DST scenarios.
At a regional level, however, the investment patterns are not the same in different regions. In those countries with capacity markets only in the
ICM, it is in this policy that the capacity level installed is highest in that region. In the patchwork national capacity markets, a country will generally install the most when they have the capacity market. Taking the case of Germany,
they install very little when France has a capacity market in CPS case 1 and NP, whereas in CPS case 2 and 3, they installs the highest level. The reasons for these differing levels are discussed in more detail in section 10.
Figure 21. Total new investments in thermal generation in Europe (up to year 2030)
Figure 22. New thermal generation investments in selected regions – CPI (up to year 2030)
Source: Sweco Energy Markets
0
20
40
60
80
100
Target Model Integrated CapacityMarket
CPS case 1 (FR, UK,IT, ES, PT)
CPS case 2 (case 1+ Germany)
CPS case 3 (case 1+ Germany + Poland)
NP case 1 (FR, UK,IT, ES, PT)
Cap
acity
, GW
CPI DST
0
10
20
Capa
city, G
W
Target Model Integrated Capacity Market CPS case 1 (FR, UK, IT, ES, PT)
CPS case 2 (case 1 + Germany) CPS case 3 (case 1 + Germany + Poland) NP case 1 (FR, UK, IT, ES, PT)

February, 2014 61 A Sweco Multiclient Study
Capacity Markets in Europe: Impacts on Trade and Investments
As mentioned earlier, the modelling is done under perfect foresight, and we have not assumed market failures that would lead to under-investment in the TM.
In this respect it is interesting to note that the energy-only model results indicate that investment cost recovery depends on a few hours with very high prices. Figure 21 shows the cumulative contribution of the hours in a year to the net revenues of a CCGT (56% efficiency) in Germany in the year 2030 for the two supply scenarios; the x-axis shows the hours per year, ranked from highest to lowest electricity price. In the CPI scenario 45% of the annual net revenues are earned in the 20 hours with the highest revenues. The situation is less extreme in the DST scenario, but there is still a high dependency on the 20-30 hours with the highest revenues. The situation is similar for other countries.
This illustrates that there is a significant risk related to the investments. An investment based on 50 very high prices annually is much more risky than one based on 2000 hours. Relatively small changes could easily reduce the revenues in those hours, undermining the financial viability of the investments. This means that an energy-
only market may provide less investment than in our model and that the benefits of a capacity market are greater than we calculated.
Figure 23. Cumulative share of net revenues for a CCGT (56% efficiency) in Germany in the year 2030, CPI and DST scenarios (first 200 hours)
Source: Sweco Energy Markets
0%
10%
20%
30%
40%
50%
60%
70%
1 6 11 16 21 26 31 36 41 46 51 56 61 66 71 76 81 86 91 96 101
106
111
116
121
126
131
136
141
146
151
156
161
166
171
176
181
186
191
196
CPI DST
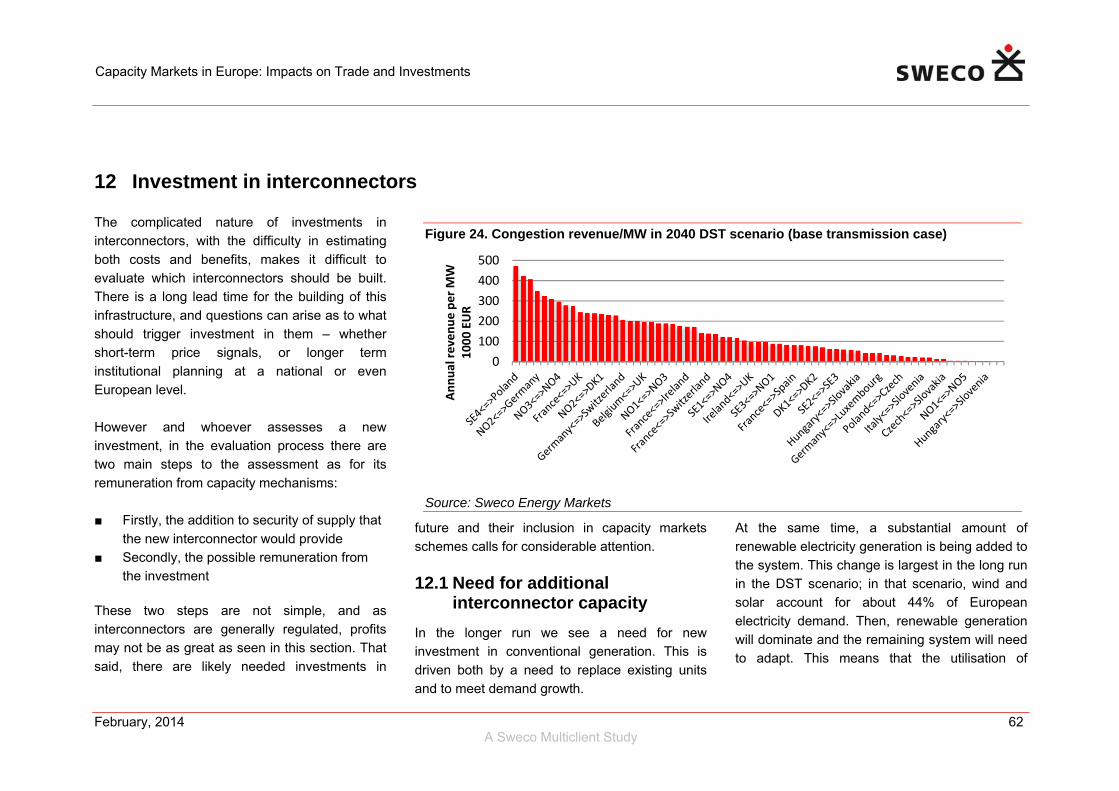
February, 2014 62 A Sweco Multiclient Study
Capacity Markets in Europe: Impacts on Trade and Investments
12 Investment in interconnectors
The complicated nature of investments in interconnectors, with the difficulty in estimating both costs and benefits, makes it difficult to evaluate which interconnectors should be built. There is a long lead time for the building of this infrastructure, and questions can arise as to what should trigger investment in them – whether short-term price signals, or longer term institutional planning at a national or even European level.
However and whoever assesses a new investment, in the evaluation process there are two main steps to the assessment as for its remuneration from capacity mechanisms:
■ Firstly, the addition to security of supply that the new interconnector would provide
■ Secondly, the possible remuneration from the investment
These two steps are not simple, and as interconnectors are generally regulated, profits may not be as great as seen in this section. That said, there are likely needed investments in
future and their inclusion in capacity markets schemes calls for considerable attention.
12.1 Need for additional interconnector capacity
In the longer run we see a need for new investment in conventional generation. This is driven both by a need to replace existing units and to meet demand growth.
At the same time, a substantial amount of renewable electricity generation is being added to the system. This change is largest in the long run in the DST scenario; in that scenario, wind and solar account for about 44% of European electricity demand. Then, renewable generation will dominate and the remaining system will need to adapt. This means that the utilisation of
Figure 24. Congestion revenue/MW in 2040 DST scenario (base transmission case)
Source: Sweco Energy Markets
0100200300400500
Annu
al re
venu
e pe
r MW
1000
EUR
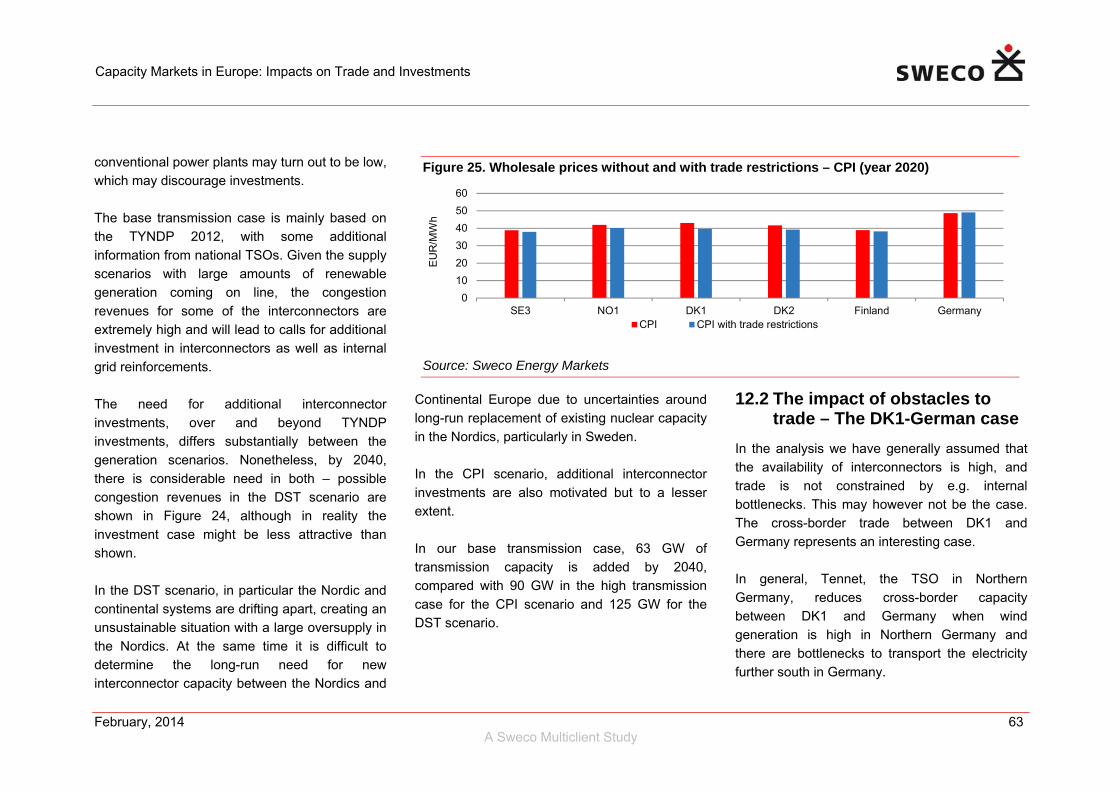
February, 2014 63 A Sweco Multiclient Study
Capacity Markets in Europe: Impacts on Trade and Investments
conventional power plants may turn out to be low, which may discourage investments.
The base transmission case is mainly based on the TYNDP 2012, with some additional information from national TSOs. Given the supply scenarios with large amounts of renewable generation coming on line, the congestion revenues for some of the interconnectors are extremely high and will lead to calls for additional investment in interconnectors as well as internal grid reinforcements.
The need for additional interconnector investments, over and beyond TYNDP investments, differs substantially between the generation scenarios. Nonetheless, by 2040, there is considerable need in both – possible congestion revenues in the DST scenario are shown in Figure 24, although in reality the investment case might be less attractive than shown.
In the DST scenario, in particular the Nordic and continental systems are drifting apart, creating an unsustainable situation with a large oversupply in the Nordics. At the same time it is difficult to determine the long-run need for new interconnector capacity between the Nordics and
Continental Europe due to uncertainties around long-run replacement of existing nuclear capacity in the Nordics, particularly in Sweden.
In the CPI scenario, additional interconnector investments are also motivated but to a lesser extent.
In our base transmission case, 63 GW of transmission capacity is added by 2040, compared with 90 GW in the high transmission case for the CPI scenario and 125 GW for the DST scenario.
12.2 The impact of obstacles to trade – The DK1-German case
In the analysis we have generally assumed that the availability of interconnectors is high, and trade is not constrained by e.g. internal bottlenecks. This may however not be the case. The cross-border trade between DK1 and Germany represents an interesting case.
In general, Tennet, the TSO in Northern Germany, reduces cross-border capacity between DK1 and Germany when wind generation is high in Northern Germany and there are bottlenecks to transport the electricity further south in Germany.
Figure 25. Wholesale prices without and with trade restrictions – CPI (year 2020)
Source: Sweco Energy Markets
0102030405060
SE3 NO1 DK1 DK2 Finland Germany
EU
R/M
Wh
CPI CPI with trade restrictions

February, 2014 64 A Sweco Multiclient Study
Capacity Markets in Europe: Impacts on Trade and Investments
In order to show the outcome of such a situation in the future we have simulated the impact of trade restrictions between DK1 and Germany. This is implemented by enforcing a trade restriction on the interconnector when there is a high wind generation in Germany. On average the availability on the interconnector from DK1 to Germany is around 45%.
Our analysis show that trade restrictions could have an important impact on the general price level. Our simulation shows that prices in DK1 could decrease by around 3 EUR/MWh if cross-border capacity is being reduced between DK1 and Germany compared to the non-trade-restricted CPI scenario in 2020.
This case shows how a large quantity of wind generation can prevent interconnectors from being used to full capacity. This is of particular interest in light of the previous section 12.1 where we show a great need for an increase in interconnector capacity and have assumed a high availability on this interconnector. If such restrictions exist on trade during times when there are high levels of wind generation, then the bottlenecks spoken of there will be even greater in reality.
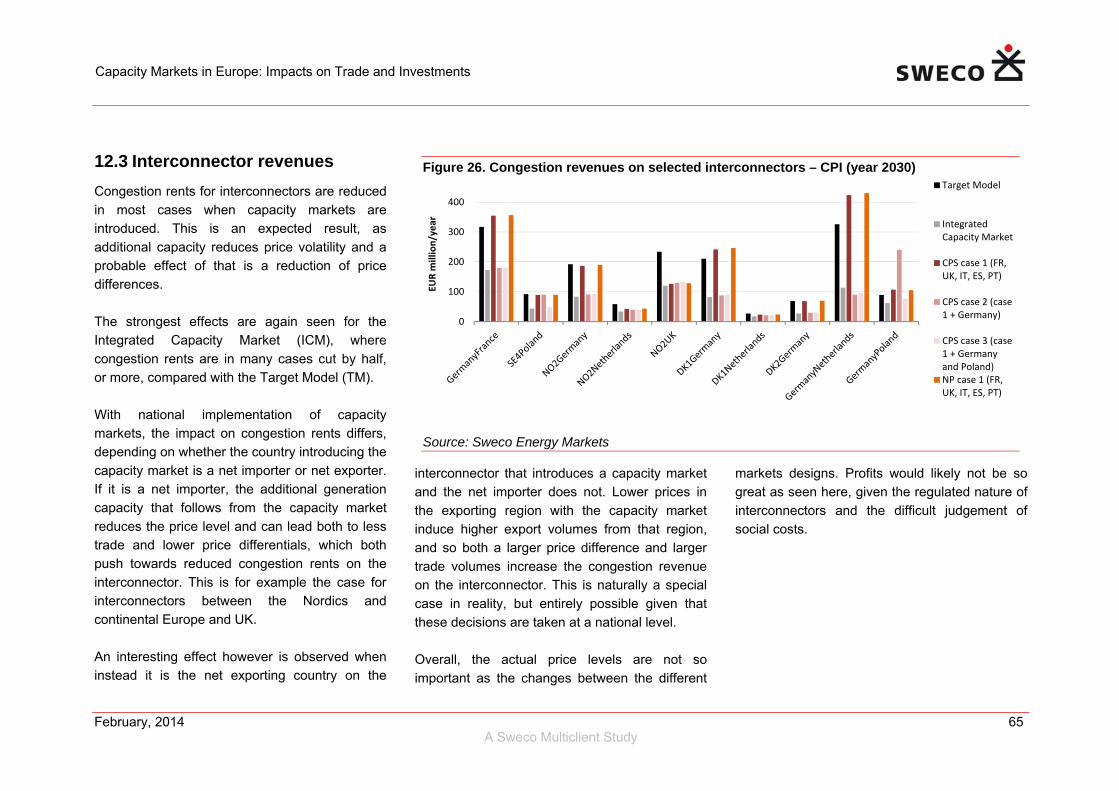
February, 2014 65 A Sweco Multiclient Study
Capacity Markets in Europe: Impacts on Trade and Investments
12.3 Interconnector revenues Congestion rents for interconnectors are reduced in most cases when capacity markets are introduced. This is an expected result, as additional capacity reduces price volatility and a probable effect of that is a reduction of price differences.
The strongest effects are again seen for the Integrated Capacity Market (ICM), where congestion rents are in many cases cut by half, or more, compared with the Target Model (TM).
With national implementation of capacity markets, the impact on congestion rents differs, depending on whether the country introducing the capacity market is a net importer or net exporter. If it is a net importer, the additional generation capacity that follows from the capacity market reduces the price level and can lead both to less trade and lower price differentials, which both push towards reduced congestion rents on the interconnector. This is for example the case for interconnectors between the Nordics and continental Europe and UK.
An interesting effect however is observed when instead it is the net exporting country on the
interconnector that introduces a capacity market and the net importer does not. Lower prices in the exporting region with the capacity market induce higher export volumes from that region, and so both a larger price difference and larger trade volumes increase the congestion revenue on the interconnector. This is naturally a special case in reality, but entirely possible given that these decisions are taken at a national level.
Overall, the actual price levels are not so important as the changes between the different
markets designs. Profits would likely not be so great as seen here, given the regulated nature of interconnectors and the difficult judgement of social costs.
Figure 26. Congestion revenues on selected interconnectors – CPI (year 2030)
Source: Sweco Energy Markets
0
100
200
300
400
EUR million/year
Target Model
IntegratedCapacity Market
CPS case 1 (FR,UK, IT, ES, PT)
CPS case 2 (case1 + Germany)
CPS case 3 (case1 + Germanyand Poland)NP case 1 (FR,UK, IT, ES, PT)

February, 2014 66 A Sweco Multiclient Study
Capacity Markets in Europe: Impacts on Trade and Investments
12.4 Possible interconnector revenues from the capacity market
In addition to congestion rents from the energy only market, there are also possible revenues from the capacity price differences between regions. For some interconnectors this could provide a relatively substantial compensation, but this is not true for all interconnectors.
Our results indicate that this is likely to be the case in the ICM for example for the interconnectors between Norway (NO2) and both Germany and the UK. It is however not sufficient to offset the fall in congestion rents from the wholesale market, and particularly not in the case for the Norway-UK interconnector. This is also the case for the interconnectors between Sweden (SE4) and both Germany and Poland.
Congestion rents from the capacity market would naturally only occur between regions with different prices for capacity, which imply very low, or no, revenues for many interconnectors. This also implies that the ICM, in many cases, reduces the capacity market congestion rent compared with the different CPS policies. In the ICM there is a positive price for capacity in all
market areas, albeit very low in some, while in the CPS the price is usually zero (or negligible) in market areas without capacity markets.
While the capacity price might not be zero in reality, we would expect it to be close to zero in market areas that do not have capacity markets themselves. This would be reinforced by the fact that some market areas are not capacity constrained.
Without a domestic capacity market there would not be domestic demand for capacity credits, so
all demand would come from outside. Assuming a reasonable degree of competition, our assessment is that in this case the capacity price will likely be low.
Delivery of capacity from one market area to another is a combined product of generation and transmission capacity. With low domestic demand for generation capacity, most of the value of exporting capacity credits is therefore likely to come as a capacity market congestion rent to the interconnector owner. Therefore we expect that these revenues would be higher in
Figure 27. Capacity market congestion rent – CPI (year 2030)
Source: Sweco Energy Markets
0
100
200
300
EUR million/year
Integrated Capacity Market CPS case 1 (FR, UK, IT, ES, PT) CPS case 2 (case 1 + Germany)
CPS case 3 (case 1 + Germany + Poland) NP case 1 (FR, UK, IT, ES, PT)

February, 2014 67 A Sweco Multiclient Study
Capacity Markets in Europe: Impacts on Trade and Investments
the different CPS scenarios than in the ICM scenario for interconnectors between areas with and without capacity markets.
Just how interconnectors could participate in capacity markets is discussed in more depth in section 8 in the qualitative discussions. Worthy of explicit note here, however, is the question of derating – an interconnector would only be allowed to participate in a national capacity market if it were considered to be able to contribute to security of supply – and this would affect the interconnector revenues seen in the figure.
For example, the derating of the Germany-Netherlands interconnector would likely be far higher than that of the NO2-UK interconnector. Germany and the Netherlands share similar weather, generation and demand profiles – times of stress in Germany are likely to coincide with higher stress times in Netherlands, so it would be questionable how much additional security of supply such an interconnector could provide.
On the other hand, NO2 and the UK have quite different power systems – times of high stress in the UK are far less likely to coincide with stress situations in Norway, and so the NO2-UK
interconnector would likely not be so derated. Hence, looking at the revenue levels in the figure, it is likely that some of the interconnectors are hardly derated and their revenues could be similar to those levels, whilst others’ revenues would be considerably less.

February, 2014 68 A Sweco Multiclient Study
Capacity Markets in Europe: Impacts on Trade and Investments
13 Security of supply
Within the Target Model (TM) there is insufficient investment to avoid some hours of physical shortage in some regions. This is by itself not an indication of under-investment from an economic point of view, as curtailment could be an optimal solution. Moreover, curtailment could be avoided in these scenarios if demand price-elasticity increases more than we assumed.
On the other hand, however, given the deterministic nature of the model, it could also be expected that there would be more hours with shortage in reality, as investment is not likely to be optimal.
Naturally, in the Integrated Capacity Market (ICM), there are no hours of shortage given the modelling technique applied. Likewise, whenever a country has introduced a capacity market, there is no unserved demand.
In the TM scenario there is unserved demand corresponding to 0.02 o/oo of the total demand in Germany. In the Coordinated Policy Scenario (CPS) case 1, when France introduces a capacity market, the unserved demand in Germany
doubles due to a reduction of investments in Germany.
Figure 28. Unserved demand, % of total consumption – CPI (year 2030)
Figure 29. Hours with physical shortage – CPI (year 2030)
Source: Sweco Energy Markets
0.000%
0.002%
0.004%
0.006%
Germany Poland Czech France UK
Share of to
tal con
sumption
Target Model Integrated Capacity Market CPS case 1 (FR, UK, IT, ES, PT)
CPS case 2 (case 1 + Germany) CPS case 3 (case 1 + Germany + Poland) NP case 1 (FR, UK, IT, ES, PT)
0
4
8
12
Germany Poland Czech France UK
Num
ber o
f hou
rs/yr
Target Model Integrated Capacity Market CPS case 1 (FR, UK, IT, ES, PT)
CPS case 2 (case 1 + Germany) CPS case 3 (case 1 + Germany + Poland) NP case 1 (FR, UK, IT, ES, PT)

February, 2014 69 A Sweco Multiclient Study
Capacity Markets in Europe: Impacts on Trade and Investments
While a country may be able to benefit in terms of investment levels and system cost when a neighbouring country has a capacity market, for some of the larger countries the results also indicate a risk of an increase in unserved demand.
Both the numbers of hours with physical shortage and the unserved demand are relatively low, ranging in the TM between 0.01 o/oo in the Czech Republic to over 0.05 o/oo in France. In many European countries there are no hours with physical shortage, including for example the Nordics, Austria, Switzerland, Netherlands and Belgium. Whether such volumes of unserved energy are acceptable or not is ultimately a social choice.
An interesting consideration is the volume of additional capacity or demand response that would be needed in each region to avoid such load curtailments – given as the maximum unserved demand in a single hour. As Figure 28 shows, the amount could be substantial.
The economic value of the unserved demand is low compared to the total market size. Assuming a Value of Lost Load (VOLL) of 10,000 EUR/MWh, the total value of the unserved
demand in Germany in the TM is about EUR 115 million, increasing to about EUR 240 million in the CPS case 1, equating to between 0.2% to around 0.5% of their annual market turnover.
In Poland, the value of unserved demand is in the range of EUR 40 to 70 million (0.26% - 0.47% of annual market turnover) in the different scenarios when it has no capacity market. In the only policy in which France has no capacity market, the TM,
Figure 30. Capacity to avoid hour with maximum unserved demand, MW – CPI (year 2030)
Figure 31. Value of unserved demand, relative to market turnover in region – CPI (year 2030)
Source: Sweco Energy Markets
0
4,000
8,000
12,000
Germany Poland Czech France UK
MWh/h
Target Model Integrated Capacity Market CPS case 1 (FR, UK, IT, ES, PT)
CPS case 2 (case 1 + Germany) CPS case 3 (case 1 + Germany + Poland) NP case 1 (FR, UK, IT, ES, PT)
0.0%0.1%0.2%0.3%0.4%0.5%0.6%0.7%
Germany Poland France UK
Non
‐served en
ergy,
share of m
arket
turnover
Target Model Integrated Capacity Market CPS case 1 (FR, UK, IT, ES, PT)CPS case 2 (case 1 + Germany) CPS case 3 (case 1 + Germany + Poland) NP case 1 (FR, UK, IT, ES, PT)
February, 2014 70 A Sweco Multiclient Study
Capacity Markets in Europe: Impacts on Trade and Investments
it is above EUR 300 million (0.66% of annual market turnover).
The “true” VOLL is of course difficult to estimate, indeed many would argue that it should be greater than the 10,000 EUR/MWh used here. But by varying the assumed VOLL different estimates of the total value of the unserved demand can easily be calculated and the numbers used here at least give an idea of the orders of magnitude. Additionally, as noted before, given the deterministic nature of the modelling and the optimal investments installed, in reality these values and percentages figures could be somewhat higher.

February, 2014 71 A Sweco Multiclient Study
Capacity Markets in Europe: Impacts on Trade and Investments
14 Additional impacts
14.1 Increase in CO2 emissions from the power sector
In all the capacity market policies, our analysis shows an increase in the CO2 emissions from the power sector in Europe, relative to the Target Model policy (TM). In the ICM and the CPS the increase is around 3%, while it is around 4.5% in the NP case 1.
This result is not by itself obvious. In the capacity market scenarios, there are more investments in conventional thermal generation and the reduced price volatility leads to less demand response. This would likely lead to more generation by conventional thermal units, and in particular more generation by peakers, which would increase CO2 emissions.
At the same time, the increased investments in conventional thermal generation could mean that more high-efficiency plants are available, leading to less use of older plants and of less-efficient peakers. This would decrease CO2 emissions. However, the combined effect in our analysis is an increase.
Figure 32. Increase in CO2 emissions from the power sector, relative to TM – CPI (year 2030)
Figure 33. Additional investments under the ICM policy compared to TM – CPI (year 2030)
Source: Sweco Energy Markets
0.0%0.5%1.0%1.5%2.0%2.5%3.0%3.5%4.0%4.5%5.0%
ICM CPS case 1 (FR, UK, IT, ES, PT) CPS case 2 (case 1 + Germany) CPS case 3 (case 1 + Germany +Poland)
NP case 1 (FR, UK, IT, ES, PT)
Index, % change
-20000
2000400060008000
10000120001400016000
Germany Netherlands Poland Austria Belgium France Switzerland UK
MW
Coal CCGT OCGT

February, 2014 72 A Sweco Multiclient Study
Capacity Markets in Europe: Impacts on Trade and Investments
14.2 Reduction in competitiveness of intermittent renewable generation
As previously noted the need for subsidies for RES generation would increase under the capacity market policies. This is due to the fact that the wholesale electricity price would fall, and that the RES technologies typically would not earn any substantial revenues from the capacity market.
In the longer run it is reasonable to expect that the RES technologies become competitive without subsidies, although it can be questioned when this will happen for different technologies (and it may not happen for all technologies).
In a world without subsidies and with a capacity market, RES generation would instead become less competitive vis-à-vis conventional thermal generation and reservoir hydro, which are the generation sources most likely to earn substantial revenues from a capacity market.
Figure 34. Loss in competitiveness for RES – CPI (year 2030)
Source: Sweco Energy Markets
0.0
1.0
2.0
3.0
RES subsidy, re
lativ
e to TM
EUR/MWh
Integrated Capacity Market CPS case 1 (FR, UK, IT, ES, PT) CPS case 2 (case 1 + Germany)
CPS case 3 (case 1 + Germany + Poland) NP case 1 (FR, UK, IT, ES, PT)

February, 2014 73 A Sweco Multiclient Study
Capacity Markets in Europe: Impacts on Trade and Investments
14.3 Demand response – impacts and need for inclusion
The introduction of a capacity market in which only generation plants can operate will naturally threaten the future revenues for demand response – if capacity levels are significantly higher and scarcity prices avoided, wholesale prices don’t reach a sufficient level for the demand response to be enacted.
This effect can be seen when the demand response volumes are considered for the examples of France and Germany. Levels of use are highest in the Target Model and when a region does not have a capacity market. Once an area does have a capacity market, our assumption of no scarcity prices above 1000 EUR/MWh means that the highest brackets of demand response are not used at all.
The effect of the introducing a capacity market in a neighbouring country can be seen in Germany in figure 36 in the CPS case 1 and NP case 1 policies – with reduced levels of use compared to the TM for every level of demand response.
This highlights the importance of considering demand response in the design of a capacity
market mechanism. If such an inclusion is uncertain, then demand response represents a riskier investment that might take longer to be invested in, if at all.
Figure 35. Annual volumes of demand response levels used – France, CPI (year 2030)
Figure 36. Annual volumes of demand response levels used – Germany, CPI (year 2030)
Source: Sweco Energy Markets
0
10,000
20,000
30,000
200 250 300 400 500 700 900 1,100 1,500 2,000
MWh/yr
EUR/MWh
Target Model Integrated Capacity Market CPS case 1 (FR, UK, IT, ES, PT)CPS case 2 (case 1 + Germany) CPS case 3 (case 1 + Germany + Poland) NP case 1 (FR, UK, IT, ES, PT)
0
10,000
20,000
30,000
200 250 300 400 500 700 900 1,100 1,500 2,000
MWh/yr
EUR/MWhTarget Model Integrated Capacity Market CPS case 1 (FR, UK, IT, ES, PT)
CPS case 2 (case 1 + Germany) CPS case 3 (case 1 + Germany + Poland) NP case 1 (FR, UK, IT, ES, PT)

February, 2014 74 A Sweco Multiclient Study
Capacity Markets in Europe: Impacts on Trade and Investments
February, 2014 75 A Sweco Multiclient Study
Capacity Markets in Europe: Impacts on Trade and Investments
PART IV
CONCLUDING REMARKS

February, 2014 76 A Sweco Multiclient Study
Capacity Markets in Europe: Impacts on Trade and Investments
Following the results of the quantitative work of Part III and the qualitative discussions of Part II, this section first discusses certain aspects of capacity market design and then alternative types of capacity mechanisms that merit consideration in light of the results presented in the study’s earlier parts. This section, and the main body of the report, is then drawn to a close with the main conclusions of this study.
15 Final discussions
Inclusion of external capacity
In the course of analysing the various capacity market designs, one of the biggest points of discussion is who can participate in a region’s capacity market. This concerns external generation, interconnector capacity, and demand response resources. If none of these are allowed to participate, it must first be decided if such a policy is in line with EU requirements, and then considered if such a policy would be the most efficient and effective solution for the region – both of these are questionable. Though how these entities could be included also does also raise questions.
Inclusion of external generation capacity in a national capacity market is far from easy. Selling a complete capacity product from one area to another would require both generation and long term transmission capacity as a bundled product. Given the European market model with market
coupling, no individual market participant can guarantee that power flows in any particular direction.
The bundled product of generation capacity and transmission capacity would result in a sharing of the capacity market revenues between suppliers of generation capacity and suppliers of transmission capacity. In the case of export of “capacity credits” from a capacity surplus area such as the Nordics, competition between suppliers of generation capacity is likely to lead to low capacity prices. Most of the capacity market revenues would likely end up with the owner of the transmission capacity.
Another proposal for capacity market designs, included in our modelling in the National Policy market design, are “uplifts” in shortage hours. In this market, there is an uplift placed on short-term trade at stress times in this region in order to limit the amount of energy that flows out to other
regions. This potentially could restore the wholesale prices to what would be the case without capacity markets. It is however questionable if this model is compatible with the Target Model, and it would result in a less efficient short term trade.
A third option is to allow interconnectors to participate in the capacity market, being backed by the entire system on the exporting side. This model could restore the incentives between building interconnectors and generation, but it would not directly provide revenues to external generators. Those could however potentially benefit from increased export possibilities.
While the designs for inclusion of external capacity are far from ready, this should in principle be done in a two-step process.
The first step would be to analyse and assess the contribution to security of supply that inclusion of

February, 2014 77 A Sweco Multiclient Study
Capacity Markets in Europe: Impacts on Trade and Investments
external generation capacity or interconnectors would have. This would naturally depend on e.g. the availability of resources, in a similar way as for internal resources. However, it is also necessary to assess to what extent the resources will actually contribute in a strained situation. This would depend on system characteristics in the interconnected systems, such as the generation structure, demand profile and weather pattern. This would call for a further derating of the external capacity.
The second step would be to ensure that the external resources are adequately remunerated for their security of supply contribution. The preferred option would be to build this into any capacity market design.
Impact on different resources
While it is easily said that a capacity market should be designed in a technology neutral way, there is a clear risk that different technologies will be affected in different ways depending on the design of the capacity market and other institutional factors.
Lead time from auctions to delivery period is one such factor, where technologies that can be built
during the lead time will be more favourable positioned than technologies with a longer lead time. For example, interconnectors typically have longer lead time than a CCGT. In the same way, the impact of capacity markets on investments in nuclear power is probably lower than on CCGT.
The institutional setting will also be important. Merchant interconnector investments would be highly dependent on receiving adequate remuneration from capacity markets. Interconnectors that are allowed to be included in a regulated asset base would not be as dependent on direct market remuneration from energy and/or capacity markets. This could imply that the importance of timely investments in interconnectors from TSOs increase if capacity markets are introduced. However, there are also differences in the possibilities of TSOs to include interconnectors in its rate base.
Alternative solutions to capacity markets
There are several types of capacity mechanisms that have not been modelled in this study, such as reliability options, capacity payments, and strategic reserves. They were not modelled as they either cannot be modelled to useful effect, or
the effect of their inclusion is almost entirely based on one or two input assumptions.
So called reliability contracts could to some extent relieve the situations, as the capacity suppliers at least have a firm financial commitment. In the deterministic setup used in the modelling the differences between reliability contracts and a standard capacity market would be very small, if any.
Within the study we have only to a limited extent analysed the option of strategic reserves. In our view, strategic reserves are mainly a vehicle for either ensuring that a limited amount of older capacity is kept for security of supply reasons or that relatively small amounts of capacity are added, still for security of supply reasons.
The analysis we have done on strategic reserves shows a very small impact on the market. This is however assuming a “high” activation price for the strategic reserve, which is an important assumption.
From an economic perspective the strategic reserves should optimally be activated at the Value of Loss Load (VOLL), not to undermine the viability of market based investments. While
February, 2014 78 A Sweco Multiclient Study
Capacity Markets in Europe: Impacts on Trade and Investments
VOLL is always hard to estimate, for practical reasons the activation could take place at the DAM price cap.
In Sweden and Finland the strategic reserve (generation resources) is activated after the last commercial bid. This typically results in a “high” price. While the design choice limits the distortions, some distortions are still possible. Firstly, it typically means that the DAM price is prevented from reaching the price cap, and thus leads to a reduced profitability for commercial investments. As the strategic reserve is activated on very few occasions, and at a relatively high price, this distortion is probably of limited importance in the Nordics at the moment.
Secondly, the fact that the last commercial bid determines the price of the strategic reserve may lead to other distortions. Consider for example the case when a demand-side market participant is considering submitting a price-dependent bid. If that market participant expects to be the marginal bidder, and there is a risk that the strategic reserve is activated, it may be more beneficial to not submit the price-dependent bid. If it does not, the price of the strategic reserve (and the market clearing price) would instead be set by the second highest price. More demand-
side participation may in these situations lead to an increase in the market clearing price.
On the other hand, in constrained situations the potential for generators to exploit market power is typically high. The higher the price cap is, the more potential and the stronger are the incentives for exploiting market power. Price caps are, however, an inefficient way of mitigating market prices, as the method itself distorts the prices.
February, 2014 79 A Sweco Multiclient Study
Capacity Markets in Europe: Impacts on Trade and Investments
16 Conclusions
This Sweco Multiclient Study has examined the cross-border effects of the introduction of capacity markets. Focus has been placed on the impacts to system costs and prices, and implications for generators, interconnectors, and customers at a European and regional level.
Each of the different policy options considered in the study has been introduced while assuming no significant market or regulatory failures. In this context, it is natural that when considering European system costs, the different options are relatively similar. The capacity market policies are somewhat more expensive, which is explained by the increased volumes of capacity installed and consequently a somewhat higher security of supply margin.
While there are many detailed design parameters for capacity markets that have not been captured in the analysis, the overall results still show that national implementation of capacity markets have important cross-border effects. At a regional level, system costs vary depending on which countries have implemented a capacity market. Those with capacity markets tend to install more capacity, increase local generation, and export
more or import less (depending on if the country is a net exporter or net importer, respectively).
From a customer perspective, the European-wide integrated capacity market is the most expensive in almost all regions, given the geographic scope of the market and the degree of harmonisation between the capacity markets. The costs associated with the large increase in capacity are greater than the decrease in wholesale prices and lack of unserved demand.
When considering the patchwork capacity market designs, the cross-border effects may be both positive and negative for customers. On the one hand, customers in neighbouring markets may free-ride on customers in regions that introduce a capacity market. The additional installed capacity in the capacity-market region, paid for by customers there, decreases wholesale prices in that region and this effect naturally spills over to neighbours in an integrated European power market.
On the other hand, these cross-border effects can influence investments in generation capacity. The spillover of the drop in wholesale power
prices from capacity-market regions will also reduce the level of investments in neighbouring markets, and in some cases this results in a slight increase in the frequency and volume of shortages there, to the detriment of these customers.
Security of supply is a key motivator in the possible introduction of capacity mechanisms. In the long term, in several countries there is a need for additional capacity in flexible generation if security of supply is to be achieved and hours of unserved demand avoided. The investment environment must be such as to encourage investment in such technologies by limiting the amount of uncertainty that investors experience. Capacity mechanisms can go some way to reduce uncertainty around future revenues, but many uncertainties and risks would remain for investors.
Another important cross-border effect is that on the profitability of interconnectors. This is of particular importance as there is a need for additional interconnector capacity in Europe. The introduction of capacity markets may distort the incentives between building transmission and
February, 2014 80 A Sweco Multiclient Study
Capacity Markets in Europe: Impacts on Trade and Investments
generation capacity, leading to a less efficient market.
Typically we expect that capacity markets will reduce the profitability of interconnectors, as both interconnectors and generation capacity in many cases are substitutes.
This effect is clearly visible when considering an integrated European capacity market. Reduced wholesale price volatility and reduced wholesale price differentials between market areas result in lower congestion revenues for all interconnectors.
When considering the national capacity market designs, the above result also occurs for certain interconnectors, such as between the Nordics and the UK, where the net importer introduces the capacity market. The increased generation capacity in the capacity-market country leads to a decrease in both the price levels and the price volatility there. This results in a decrease in the congestion rents and a lower profitability of such interconnectors.
When, however, it is the net exporter on an interconnector that introduces the capacity mechanism, such as between France and
Germany (when the latter has no capacity market), the result is quite different. The increased generation capacity in the capacity-market region leads to an increased export volume from this region and an increased price differential, resulting in an increase in the congestion rent.
Nonetheless, if the introduction of capacity markets reduces investments in such interconnectors, it is a more severe problem. These interconnectors to a large extent can supply capacity and contribute to the balancing of the European power system. Our analysis does show, however, that if the interconnectors can earn revenues from the national capacity market, this could at least partially offset the reduction in revenues from the wholesale power market.
Finally, if capacity markets are being introduced, they should be seen as a long-term market design, not as a temporary fix, since it will be difficult to back out of once in place. Furthermore if capacity markets are to be an effective tool for stimulating investments the investors need to believe in the longevity of the scheme which also calls for a long-term perspective.
In a short to medium time perspective, the need for additional generation capacity is limited in most of Europe, with the UK being a notable exception. This study suggests therefore that there is no immediate need to introduce such markets in most European countries, but rather that there is time to think through the designs and long term implications more carefully.
An alternative solution could be strategic reserves, since they are easier to back out from as they cover only a limited amount of capacity. If well-designed, they would seem to be a better option to solve temporary problems than the rushed introduction of fully fledged capacity markets.
On a broader note, resolving deficiencies in the market design of the “energy only” market, as well as the policy set-up, could likely contribute to solving some of the problems. Some important considerations are:
■ While policies will always be subject to changes, more long term stability in the policy framework would facilitate investments. This could for example include trajectories for carbon emission caps or the introduction of a price band for emission
February, 2014 81 A Sweco Multiclient Study
Capacity Markets in Europe: Impacts on Trade and Investments
allowances (in particular a trajectory for a price floor).
■ Ensuring that all technologies participate in the market at the same conditions, e.g. requiring that all producers independent of technology have the same requirements for balancing etc.
■ Subsidisation of some generation undermines the financial viability of commercial investments. A phase out of subsidies would therefore help restoring the stability of the power market. At a minimum one should move away from subsidisation models that distort the short term functionality of the power market would, i.e. subsidised technologies should also be exposed to the short term market price signals.
■ Locational pricing is important. In large price areas with fundamentally different supply-demand situations within the area, the profitability of needed generation capacity in the deficit areas will be undermined.

February, 2014 82 A Sweco Multiclient Study
Capacity Markets in Europe: Impacts on Trade and Investments
February, 2014 83 A Sweco Multiclient Study
Capacity Markets in Europe: Impacts on Trade and Investments
APPENDIX

February, 2014 84 A Sweco Multiclient Study
Capacity Markets in Europe: Impacts on Trade and Investments
Appendix
A. Model description
The Apollo model is an intuitive power market model which lets the user simulate the entire European power market with an hourly resolution. A simple user interface allows the user a great deal of flexibility in terms of changing resolution, introducing new technologies, changing the regions included etc.
The model has been programmed in-house by Sweco using C++ for the model engine and Java for the application itself.
Application areas
Short term analysis:
■ Price forecasts per bidding area ■ Volatility analysis ■ Sensitivity analysis – e.g. Power plant or
interconnector outages ■ Wet- and dry year sensitivities ■ Financial risk calculations based on hourly
prices
Long term analysis
■ Long term price forecasts ■ Scenario analysis ■ The implications on price volatility due to a
larger share of RES in the electricity system
Interconnector analysis:
■ The profitability of interconnectors ■ Welfare analysis of interconnectors
Investment analysis:
■ Income stream per technology
Resolution
The flexible nature of the model allows the user to change resolution between weekly, load blocks or hourly resolution depending on the aim of the analysis.
Regional structure
Currently the most general version includes EU-28 plus Norway and Switzerland where Sweden is split into four bidding areas, Norway five
bidding areas and Denmark two bidding areas. The smaller version includes the Nordic countries (split into bidding areas), the Baltic countries plus Germany, Poland, Netherlands and the UK. Exogenous regions, i.e. countries that are not simulated by the model, are added by setting an exogenous price structure on the interconnectors.
Trade
Transmission capacity models the ability of price areas to trade energy. In the model, individual price areas are assumed to be single nodes with no internal congestions. Price areas can be linked by an interconnector with given import and export capacities, along with availability figures which can be changed by the user. There is also a possibility to include trade restrictions by setting a power margin.
Demand
Annual gross demand is split per bidding area. Demand profiles exist for both the weekly and the hourly module which set the demand constraints.
February, 2014 85 A Sweco Multiclient Study
Capacity Markets in Europe: Impacts on Trade and Investments
The hourly model also includes demand response in the form of plant based demand response as well as the possibility to shift demand over the next 6 hours.
Installed capacity
The model currently uses 381 different generic technologies. This means that power plants are aggregated according to technology and efficiency. However users have the possibility to add further technologies if necessary or even add a specific power plant as a unique technology. The input side includes the following base technologies:
■ Hydro (Reservoir, Run of River, Pumped Storage)
■ Condensing (including Carbon Capture and Storage)
■ Extraction (condensing CHP) ■ Must-run (CHP and RES)
Availabilities are also set for each technology and time step.
Plant costs
The model includes a sophisticated treatment of the thermal power system by including start-up
costs, part-load efficiencies, minimum load as well as ramping restrictions.
Hydro
The model is currently using deterministic linear programming for the hydro optimisation. When the long- and medium-term planning of water is finished hydro production is allocated weekly. Then the short-term hydropower simulation is used and the hydro production can be allocated optimally within the week. In the short-term simulation the time-resolution is hourly and the level of uncertainty is reduced.
Capacity market module
The capacity market module (CMM) is formulated as a linear optimization problem, which maximizes the social benefit subject to meeting the demand. The social benefit is the product integral between the supply (capacity) and demand (capacity) function. The CMM includes function of capacity trade between interconnected regions/countries.
Demand
The expected demand (ED) is defined as the calculated (hourly) peak load plus a user defined percent margin. The demand function was then assumed to be elastic with a (linear) sloping curve. The expected price of capacity is defined as the NetCONE (Net Cost Of New Entry), which varies for each scenario.
Price and volume of bids
The supply bids (generation capacity) are defined by two variables; the price and volume. The volume is calculated as the Net Generation Capacity (NGC), which is differentiated between technologies. The price of a particular supply bid is calculated as the implicit CAPEX (Capital Expenditure) in order to cover the full costs of a given technology. Bids are strictly positive, or zero based.
Trade
The CMM includes trading between regions. The CMM assumes an availability of 90% of the nominal capacity on a given interconnector, between two eligible trading regions. If an interconnector is not congested between two regions, then the price of capacity will be equal in both regions.

February, 2014 86 A Sweco Multiclient Study
Capacity Markets in Europe: Impacts on Trade and Investments
B. Detailed assumptions - Transmission
Figure A.1. Transmission capacity in 2020, CPI and DST Figure A.2 Transmission capacity in base case 2030, CPI and DST
Figure A.3. Transmission capacity in high case in 2030, CPI Figure A.4. Transmission capacity in high case in 2030, DST
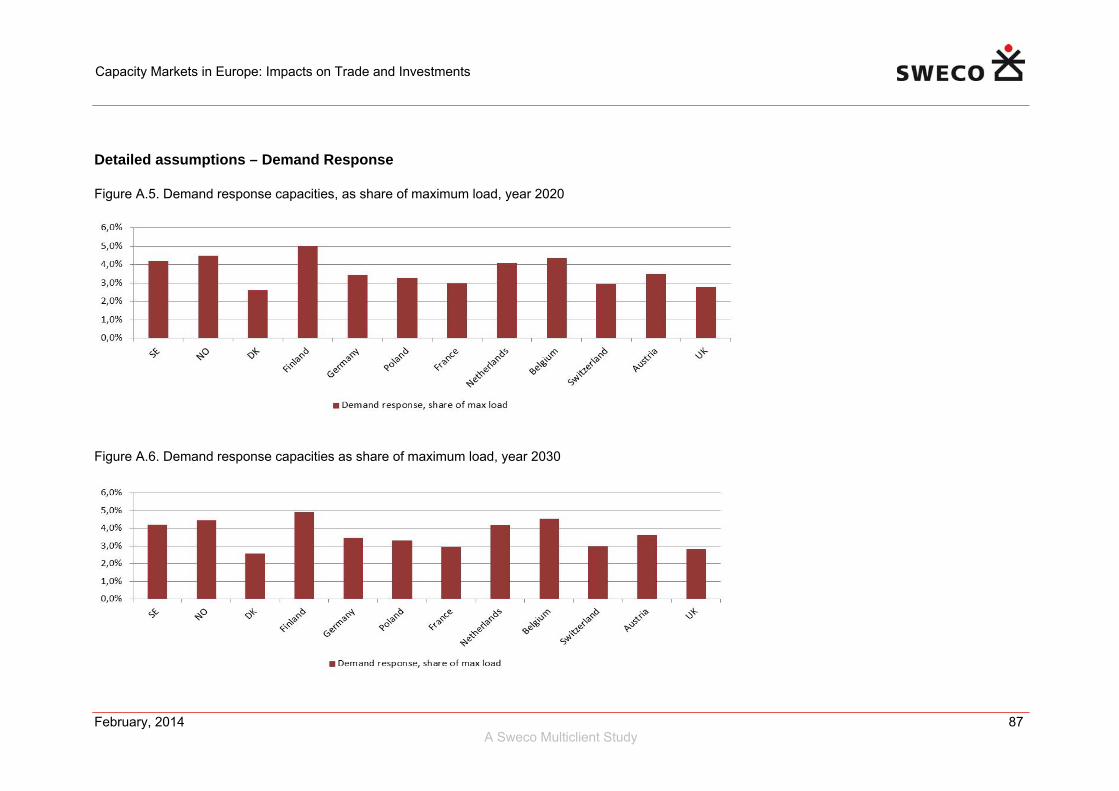
February, 2014 87 A Sweco Multiclient Study
Capacity Markets in Europe: Impacts on Trade and Investments
Detailed assumptions – Demand Response Figure A.5. Demand response capacities, as share of maximum load, year 2020
Figure A.6. Demand response capacities as share of maximum load, year 2030

February, 2014 88 A Sweco Multiclient Study
Capacity Markets in Europe: Impacts on Trade and Investments
C. Additional Results – Capacity investments Figure A.7. Installed capacity: total capacity and technology mix in each country, Target Model, CPI (year 2030)
Figure A.8. Installed capacity: total capacity and technology mix in each country, Target Model, DST (year 2030)
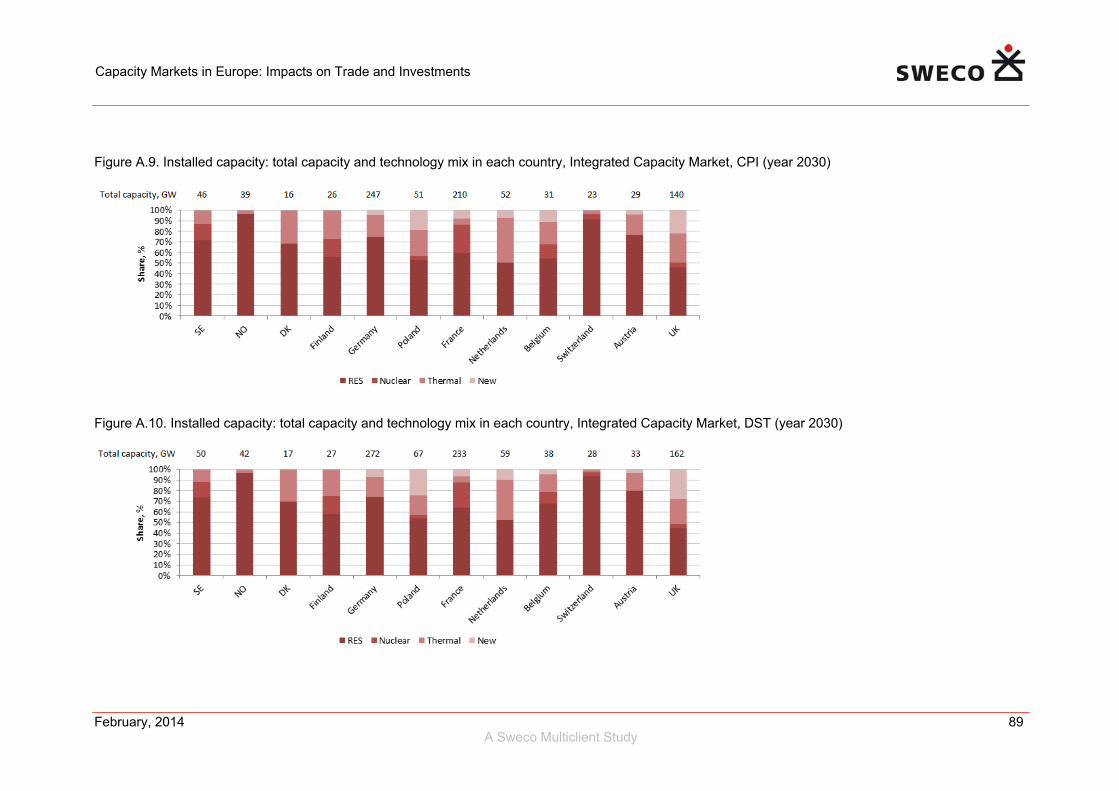
February, 2014 89 A Sweco Multiclient Study
Capacity Markets in Europe: Impacts on Trade and Investments
Figure A.9. Installed capacity: total capacity and technology mix in each country, Integrated Capacity Market, CPI (year 2030)
Figure A.10. Installed capacity: total capacity and technology mix in each country, Integrated Capacity Market, DST (year 2030)
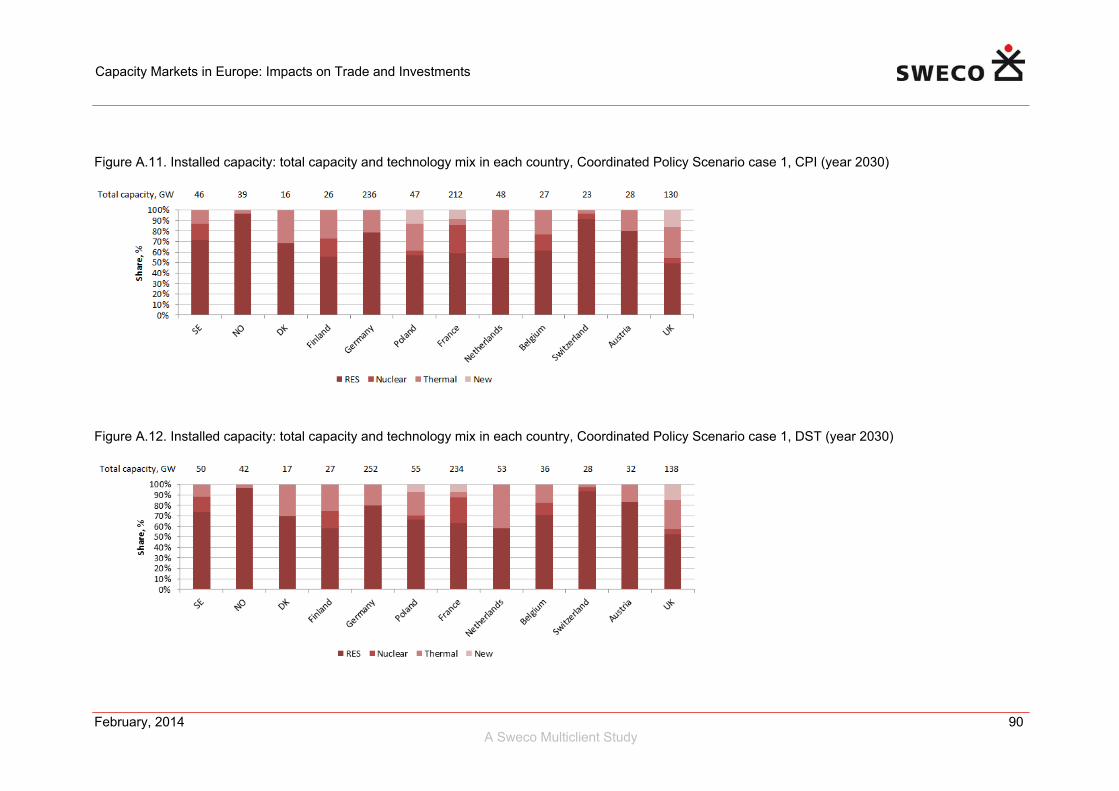
February, 2014 90 A Sweco Multiclient Study
Capacity Markets in Europe: Impacts on Trade and Investments
Figure A.11. Installed capacity: total capacity and technology mix in each country, Coordinated Policy Scenario case 1, CPI (year 2030)
Figure A.12. Installed capacity: total capacity and technology mix in each country, Coordinated Policy Scenario case 1, DST (year 2030)

February, 2014 91 A Sweco Multiclient Study
Capacity Markets in Europe: Impacts on Trade and Investments
Figure A.13. Installed capacity: total capacity and technology mix in each country, Coordinated Policy Scenario case 2, CPI (year 2030)
Figure A.14. Installed capacity: total capacity and technology mix in each country, Coordinated Policy Scenario case 2, DST (year 2030)
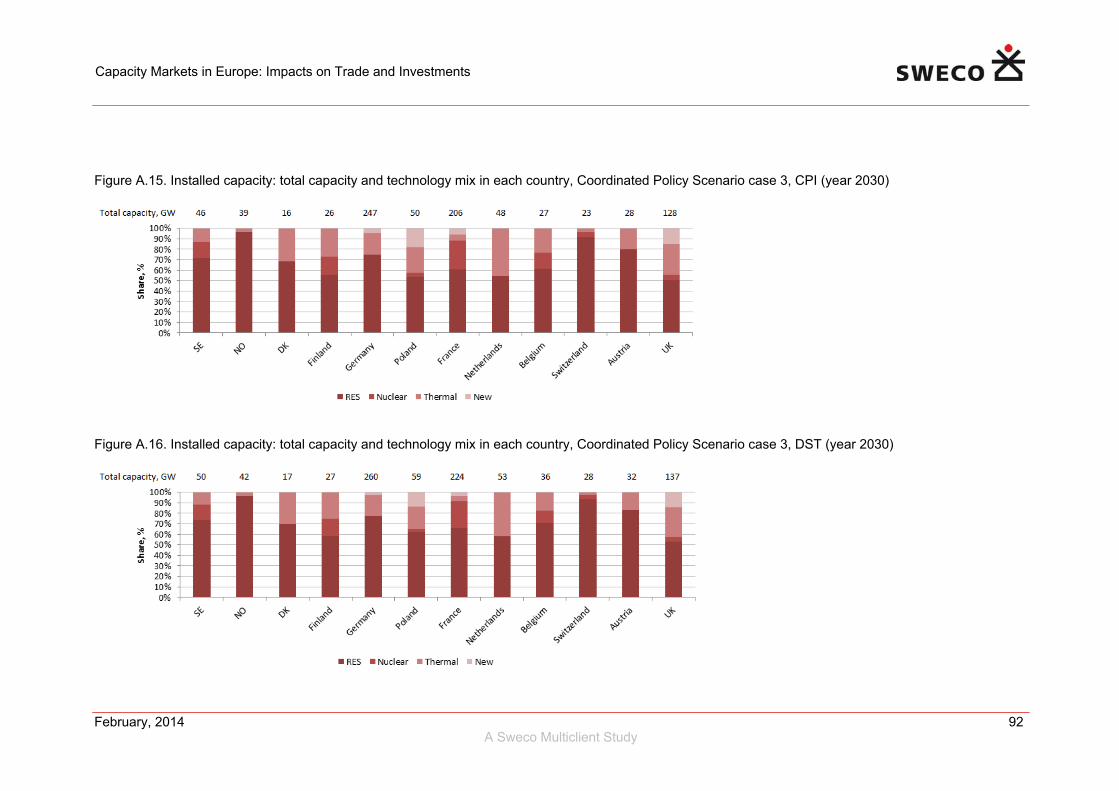
February, 2014 92 A Sweco Multiclient Study
Capacity Markets in Europe: Impacts on Trade and Investments
Figure A.15. Installed capacity: total capacity and technology mix in each country, Coordinated Policy Scenario case 3, CPI (year 2030)
Figure A.16. Installed capacity: total capacity and technology mix in each country, Coordinated Policy Scenario case 3, DST (year 2030)
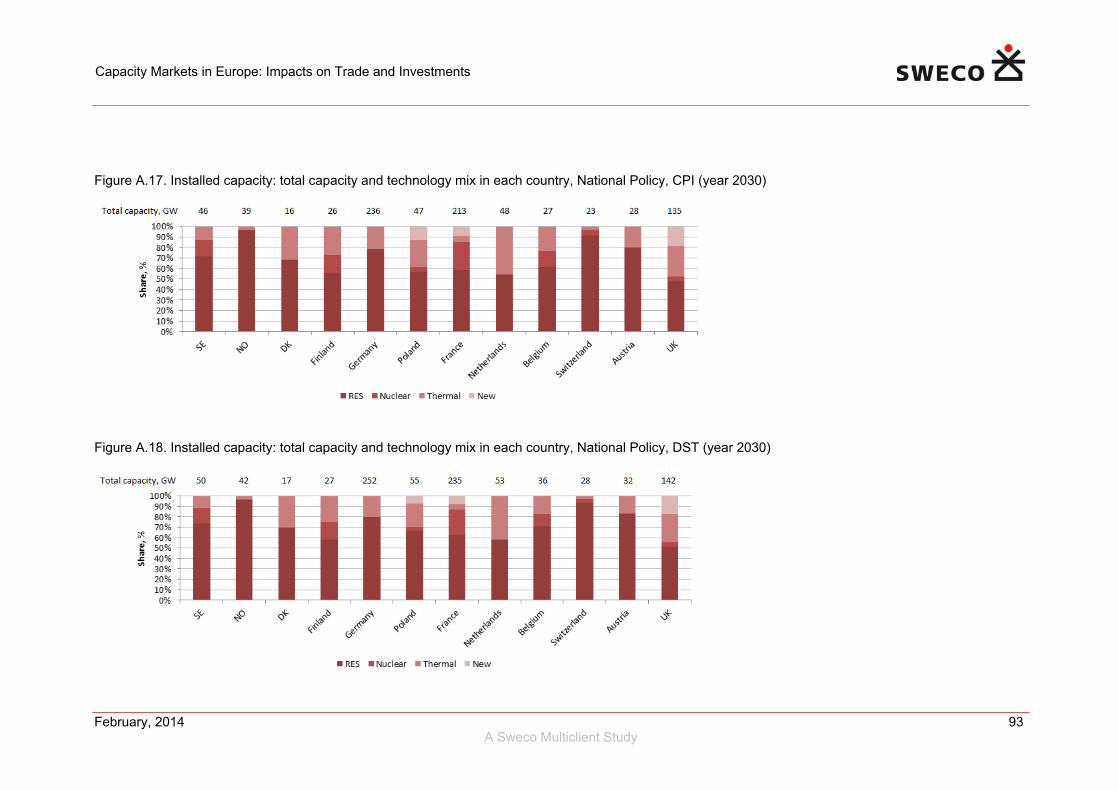
February, 2014 93 A Sweco Multiclient Study
Capacity Markets in Europe: Impacts on Trade and Investments
Figure A.17. Installed capacity: total capacity and technology mix in each country, National Policy, CPI (year 2030)
Figure A.18. Installed capacity: total capacity and technology mix in each country, National Policy, DST (year 2030)

About Sweco
Sweco’s experts are working together to develop total solutions that contribute to the creation of a sustainable society. We
call it sustainable engineering and design. We make it possible for our clients to carry out their projects not only with high
quality and good economy but also with the best possible conditions for sustainable development.
With around 9,000 employees, Sweco is among the largest players in Europe and a leader in several market segments in
the Nordic region and Central and Eastern Europe.
Sweco Energy Markets delivers value to our clients through deep insights on energy markets. We work with market
design, regulation and market analysis. We support a continuous development of the market and help our clients to
effectively participate on the energy markets.
Insights. Delivered.
Contact Niclas Damsgaard, Head of Energy Markets Tel: +46-8-695 6433
Email: [email protected]