528 air pollution monitoring, simulation and control · 528 air pollution monitoring, simulation...
TRANSCRIPT
Measurement of the contribution of a single plant
to air pollution using the SF6-tracer technique
H. Roetzer, J. Riesing
Physics Department, Seibersdorf Research Centre, A-2444
Seibersdorf, Austria
Abstract
Many regional and local monitoring networks exist for controlling of air-quality.However the measured concentrations of pollutants are usually the sum of thecontributions of a large number of sources of air pollution and therefore yield noinformation about individual plumes. The SF̂ -tracer method is used toinvestigate the dispersion of single plumes and to assess their contributions tooverall air pollution without interference by other emitters. The exhaust gasesare labelled by adding continuously minute quantities of the tracer gas. Thetracer gas SF6 is a chemically stable, non toxic gas that can be detected to a veryhigh sensitivity. Measurements of the tracer concentration in air samplesindicate the dilution of the plume at the sampling points. A description of theapplied techniques and three case studies are presented in the paper. For a largethermal power plant the contributions of the scrubbed flue-gases to ground levelconcentrations of air pollutants in the surroundings could be measured andturned out to be quite small. At a highway tunnel the dispersion of theexhausted air from the ventilation was measured to assess the impact on airquality in a neighbouring town. Measurements were carried out during stableweather conditions and the concentrations of pollutants rising near to the limit-values. At a sanitary landfill the dispersion of the emitted landfill-gas and theresulting concentrations of odorous substances in the surrounding communitieswere measured. By a comparison of the results with values of odour thresholdsthe odour impact of the landfill could be checked in this area although thereexisted other sources of odour too.
Transactions on Ecology and the Environment vol 8, © 1996 WIT Press, www.witpress.com, ISSN 1743-3541
528 Air Pollution Monitoring, Simulation and Control
1 Introduction
For controlling the quality of air, there exist many regional and local networkswhere the concentrations of pollutants are continuously monitored. However,the measured immission concentrations, especially in highly industrialized ordensely populated regions, are usually the sum total of the contributions of alarge number of air pollution sources, such as industrial facilities, craft tradeenterprises, thermal power plants, road traffic and domestic heating. Moreover,considerable amounts are added by the long-range transport of pollutants. Themeasured values of pollutant concentrations in air therefore give no informationabout the dispersion of individual plumes and their contribution to these values.Yet for decisions concerning measures to improve air quality, well foundedinformation is needed about the contributions of single sources of pollutants tothe immission concentrations.
By application of a tracer method, the dispersion of individual plumes can bemeasured without interferences from other sources of air pollution. The flue-gases of the plant in question are labelled uniformly by adding a constant flow oftracer gas. The plume can then be detected selectively by measuring the tracerconcentration in air.
In the past various aerosols and gaseous tracers were used for this purpose,e.g. Sladefl]. Among all these substances sulfur hexafluoride (SF6) was foundto be a nearly ideal tracer for a number of advantageous attributes, e.g. Dietz &Cote[2], Drivas & Shair[3], Binenboym & Gilath[4].
The Research Centre Seibersdorf has designed a mobile set of equipment tocarry out tracer experiments for studying the environmental impact of singlesources of air pollution. The method has been applied successfully to variousemitters like industrial facilities, thermal power plants and sanitary landfills.
2 Measuring principle
The principle of the tracer method is, to label exhaust gases by adding minutequantities of a tracer gas not found in nature or in other plumes. The tracer gasconcentration is then measured in air samples collected at discrete positionsdownwind from the emission source. The measured concentrations indicate thedilution of the plume at the sampling points. The ratio immission/emissionconcentration for the tracer gas is applied to pollutants with known emissionconcentration in order to calculate the specific immission concentration for theplant in question. By a comparison of these results with the total concentrationvalues recorded by air pollution networks, the contribution of a single emitter tothe overall air pollution of the region can be assessed,
Thereby it is assumed that during dispersion no loss of the pollutants occurs.Otherwise the results would represent upper limits of the contribution of thepollutants.
Transactions on Ecology and the Environment vol 8, © 1996 WIT Press, www.witpress.com, ISSN 1743-3541
Air Pollution Monitoring, Simulation and Control 529
During all measurements meteorological data have to be recorded becausethe atmospheric dispersion of a plume depends on the actual meteorologicalconditions.
3 Tracer gas
The tracer gas used is sulfur hexafloride (SFe). It is most suitable for thispurpose because of the following advantages:• SFe is a chemically inert and thermally stable gas which does not undergo
chemical changes during atmospheric dispersion.• SFe is non toxic, the TLV is 1000 ppm.• SFe does not exist in nature. It's background concentration is less than 10"̂
parts SFe per part air.• SFe can be detected at very low concentrations of about 10"" parts SFe per
part air, using gas chromatography and an electron capture detector. Onaccount of this high detection sensitivity it is possible to effect tracerconcentration measurements even at fairly large distances from the emissionsource (up to 100 km).
• SFe is commercially available at a reasonable price.• The density of SFe is about 5,1 times that of air. No separation takes place
because of the high dilution of the tracer gas in the exhaust gases and thesubsequent turbulent atmospheric diffusion.
4 Execution of measurements
4.1 Injection of the tracer gas
Sulfur hexafluoride with a purity of 99,8 % is used as tracer gas for themeasurements. The gas is injected into the flow of flue-gases by using a thermalmass flow controller. The desired flow-rate of the tracer gas can be preselectedand during dosing is kept constant to within 2 %, independent of temperatureand pressure fluctuations. It is important to achieve a uniform mixing of tracergas and exhaust gases before emission from the stack. The tracer gas flow-rateis monitored continuously in order to assure constant injection.
4.2 Equipment for SFe-analysis
The measurements of the SFe ground-level concentrations are effected by usinga gas chromatograph with an electron capture detector. The detection limit ofthe measuring device is 1,5x10"" parts SFe per part air. One air sample takesapproximately 1,5 minutes to analyze. The gas chromatograph is calibrated withSFe-gas-standards at regular intervals. The whole measuring equipment isinstalled in a laboratory car. This ensures the mobility necessary to follow thetrajectories of the plume emitted by the plant and reduces the time of transportfor air samples collected in bags.
Transactions on Ecology and the Environment vol 8, © 1996 WIT Press, www.witpress.com, ISSN 1743-3541
530 Air Pollution Monitoring, Simulation and Control
An accuracy test of the tracer method has been carried out at an unit foracceptance tests of large blowers, e.g. Roetzer & Riesing[5]. The air-flow inthis unit is measured with an accuracy of ±1 % by the help of a restrictor. Thisair-flow was in comparison also measured by the tracer dilution method. Themaximum difference between the results of the two methods was 2 %.Therefore it can be concluded that the tracer method using the describedequipment gives results with an accuracy similar to that of the restrictormethod.
4.3 Collection of air samples
Two methods of air sample collection are applied. Instantaneous SFe-groundlevel concentrations are obtained by sucking in air from the vicinity ofthe laboratory car and analyzing the samples. These instantaneous values of SF6concentration are taken while crossing the trajectories of the plume with themeasuring car at different distances downwind from the emission source.
Half-hour mean-value groundlevel concentrations are measured in air samplescollected in bags. These samples are taken by programmable, automatic airsampling units which are placed at preselected locations covering the diffusiondomain of the plant's plume. The start of air sample collection is triggeredautomatically at the preselected time. Each air sampling unit gives 8consecutively collected samples. With a sampling interval of 30 minutes halfhour mean values of SFe-groundlevel concentration are obtained.
5 Case studies of tracer measurements
5.1 Flue gases from a thermal power station
The thermal power station at Duernrohr is located about 40 km in the west ofVienna in an area characterized by both agriculture and industry. According topublic opinion the power station at Duernrohr causes the overwhelming portionof the air pollution in this region, despite the fact that the power station isequipped with highly efficient scrubbers for sulfur dioxide and nitrogen oxidesas well as with electrostatic precipitators for the particles and with a 210 m highstack. Due to these environmental protection installations only relatively lowcontributions of the plant to the groundlevel concentrations could be expected,particularly with respect to the already existing significant backgroundconcentrations in the region. Altogether 17 plume dispersion measurementswere carried out at various weather conditions and stability classes, e.g. Roetzer& Riesing[6].
The tracer experiment on January 30, 1986 is described as an example. Onthis day wind was blowing from SE at a mean wind speed of 5 m/sec, theprevailing stability class was neutral. The mean flue-gas emission rate was878.000 nrVh (STP) with an SOz-concentration of 100 mg/nf. Within thedispersion region of the plume more than 100 instantaneous groundlevel
Transactions on Ecology and the Environment vol 8, © 1996 WIT Press, www.witpress.com, ISSN 1743-3541
Air Pollution Monitoring, Simulation and Control 531
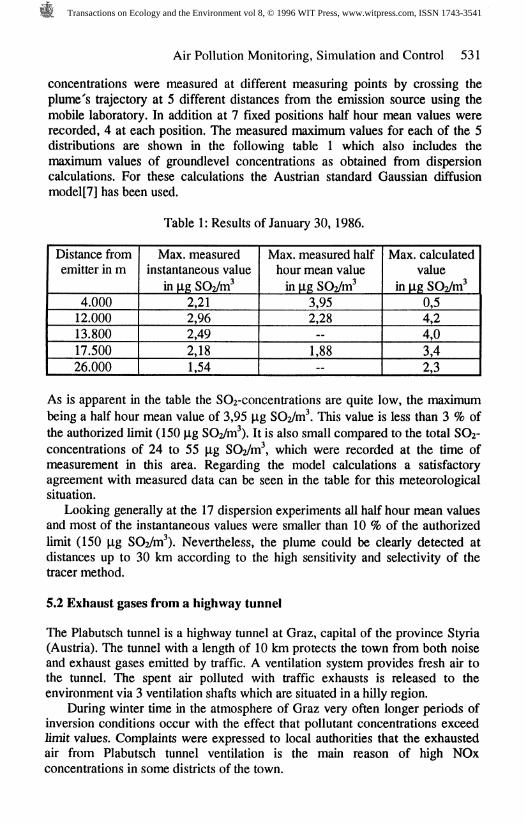
concentrations were measured at different measuring points by crossing theplume's trajectory at 5 different distances from the emission source using themobile laboratory. In addition at 7 fixed positions half hour mean values wererecorded, 4 at each position. The measured maximum values for each of the 5distributions are shown in the following table 1 which also includes themaximum values of groundlevel concentrations as obtained from dispersioncalculations. For these calculations the Austrian standard Gaussian diffusionmodel[7] has been used.
Table 1: Results of January 30,1986.
Distance fromemitter in m
4.00012.00013.80017.50026.000
Max. measuredinstantaneous value
in ng SOz/nf2,212,962,492,181,54
Max. measured halfhour mean valuein |ig SOz/nf
3,952,28
—1,88-
Max. calculatedvalue
in |o.g SOz/nf0,54,24,03,42,3
As is apparent in the table the SCVconcentrations are quite low, the maximumbeing a half hour mean value of 3,95 |ig SCVnv*. This value is less than 3 % ofthe authorized limit (150 jag SOz/nf). It is also small compared to the total SO%-concentrations of 24 to 55 |ig SCVm*, which were recorded at the time ofmeasurement in this area. Regarding the model calculations a satisfactoryagreement with measured data can be seen in the table for this meteorologicalsituation.
Looking generally at the 17 dispersion experiments all half hour mean valuesand most of the instantaneous values were smaller than 10 % of the authorizedlimit (150 |ig SOVnf). Nevertheless, the plume could be clearly detected atdistances up to 30 km according to the high sensitivity and selectivity of thetracer method.
5.2 Exhaust gases from a highway tunnel
The Plabutsch tunnel is a highway tunnel at Graz, capital of the province Styria(Austria). The tunnel with a length of 10 km protects the town from both noiseand exhaust gases emitted by traffic. A ventilation system provides fresh air tothe tunnel. The spent air polluted with traffic exhausts is released to theenvironment via 3 ventilation shafts which are situated in a hilly region.
During winter time in the atmosphere of Graz very often longer periods ofinversion conditions occur with the effect that pollutant concentrations exceedlimit values. Complaints were expressed to local authorities that the exhaustedair from Plabutsch tunnel ventilation is the main reason of high NOxconcentrations in some districts of the town.
Transactions on Ecology and the Environment vol 8, © 1996 WIT Press, www.witpress.com, ISSN 1743-3541
532 Air Pollution Monitoring, Simulation and Control
Tracer technique was applied to measure the contribution of the tunnelexhausts to pollutant concentrations and to compare the values with the totalconcentrations obtained at the air monitoring stations, e.g. Roetzer &Donhoffer[8]. Five tracer experiments were carried out at the ventilation shaft,,Buchkogel", which is situated on a hill therefore effecting an emission height of200 m above the inhabitated area. The maximum flow rate of the exhausted airwas 1,200.000 m3/h (STP) with a NO-concentration of 10 mg/m3. The tracergas was injected into the blowers transporting the exhausted air.
The experiments showed that in the case of continuous inversion conditionsthe contribution of the tunnel to the groundlevel NOx-concentrations wasnegligible.
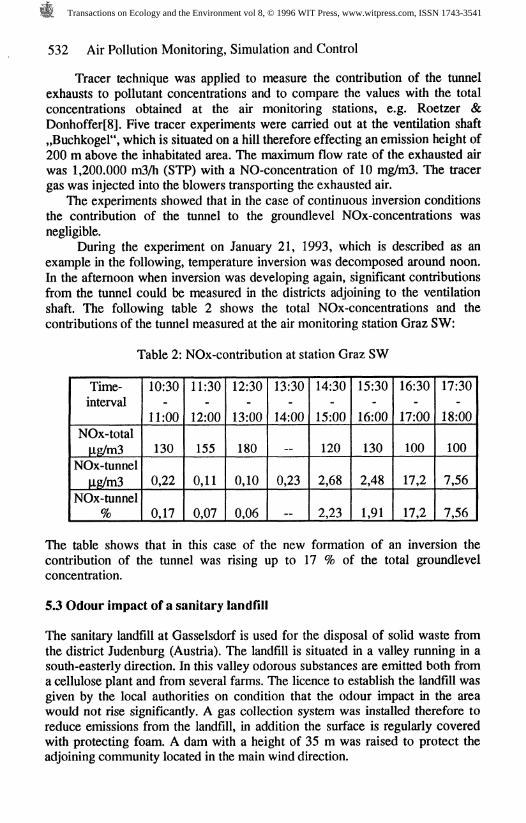
During the experiment on January 21, 1993, which is described as anexample in the following, temperature inversion was decomposed around noon.In the afternoon when inversion was developing again, significant contributionsfrom the tunnel could be measured in the districts adjoining to the ventilationshaft. The following table 2 shows the total NOx-concentrations and thecontributions of the tunnel measured at the air monitoring station Graz SW:
Table 2: NOx-contribution at station Graz SW
Time-interval
NOx-totalUg/m3
NOx-tunnelHg/m3
NOx-tunnel%
10:30
11:00
130
0,22
0,17
11:30
12:00
155
0,11
0,07
12:30
13:00
180
0,10
0,06
13:30
14:00
0,23
14:30
15:00
120
2,68
2,23
15:30
16:00
130
2,48
1,91
16:30
17:00
100
17,2
17,2
17:30
18:00
100
7,56
7,56
The table shows that in this case of the new formation of an inversion thecontribution of the tunnel was rising up to 17 % of the total groundlevelconcentration.
5.3 Odour impact of a sanitary landfill
The sanitary landfill at Gasselsdorf is used for the disposal of solid waste fromthe district Judenburg (Austria). The landfill is situated in a valley running in asouth-easterly direction. In this valley odorous substances are emitted both froma cellulose plant and from several farms. The licence to establish the landfill wasgiven by the local authorities on condition that the odour impact in the areawould not rise significantly. A gas collection system was installed therefore toreduce emissions from the landfill, in addition the surface is regularly coveredwith protecting foam. A dam with a height of 35 m was raised to protect theadjoining community located in the main wind direction.
Transactions on Ecology and the Environment vol 8, © 1996 WIT Press, www.witpress.com, ISSN 1743-3541
Air Pollution Monitoring, Simulation and Control 533
For judging, if the additional odour impact from the landfill would betolerable, the contributions of the landfill had to be assessed. As the frequentlyused olfactometric methods give no information about a single source of odour,tracer technique was applied to get selectively the odour impact of the landfille.g. Roetzer, Muehldorf & Riesing[9].
The tracer experiments had to be carried out during the most unfavourablemeteorological conditions with regard to the odour impact, i.e. when theatmosphere is only slightly mixed and the concentrations of pollutants increase.Local meteorological data showed that during high atmospheric pressure localair flows prevail. The direction of flow is upvalley (SE) during daytime anddownvalley (NW) in the night. When the direction of flow is reversed,stagnations and a local increase of pollutant concentrations occur. Therefore thetracer experiments had to include the situations of flow reversion.
Besides the tracer experiments the following measurement program wascarried out to collect additional data.• Monitoring of meteorological data at 6 significant points around the landfill.• Qualitative and quantitative analysis of the gases emitted from the landfill.• Olfactometric determination of odour in ambient air by field inspections.
• Dispersion experiments with smoke.Fifteen tracer experiments were conducted under different weather
conditions. The tracer gas was released at ten points equally distributed on thelandfill. The flow of tracer gas was the same at each point. Air samples werecollected at 15 preselected positions in the surrounding communities. The tracerresults were used to calculate the concentrations of N% and HzS, which hadbeen selected as leading substances for odour nuisance.
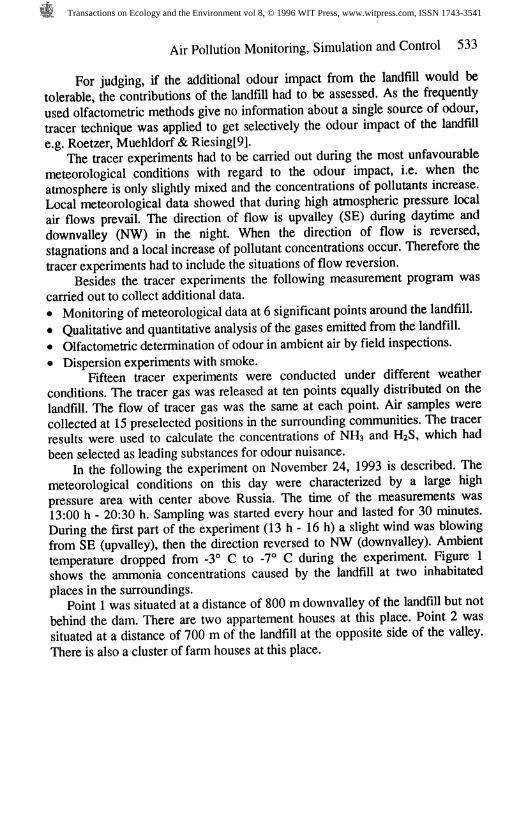
In the following the experiment on November 24, 1993 is described. Themeteorological conditions on this day were characterized by a large highpressure area with center above Russia. The time of the measurements was13:00 h - 20:30 h. Sampling was started every hour and lasted for 30 minutes.During the first part of the experiment (13 h - 16 h) a slight wind was blowingfrom SE (upvalley), then the direction reversed to NW (downvalley). Ambienttemperature dropped from -3° C to -T C during the experiment Figure 1shows the ammonia concentrations caused by the landfill at two inhabitatedplaces in the surroundings.
Point 1 was situated at a distance of 800 m downvalley of the landfill but notbehind the dam. There are two appartement houses at this place. Point 2 wassituated at a distance of 700 m of the landfill at the opposite side of the valley.There is also a cluster of farm houses at this place.
Transactions on Ecology and the Environment vol 8, © 1996 WIT Press, www.witpress.com, ISSN 1743-3541
534 Air Pollution Monitoring, Simulation and Control
1,005-08
1.00E-13
16:30 17:30Clock time
Figure 1: NHg concentrations at points 1 and 2 - Nov. 24, 1993
The figure shows the ammonia concentrations determined at the points 1 and 2.In accordance with the registered wind data the values at point 1 are low forthree hours and rise after the flow reversion at 16 h. The measured ammoniaconcentrations are the highest values obtained outside of the landfill during allexperiments. At point 2 only small concentrations were measured. These resultsprove that there is only a very small impact of the landfill emissions at a rightangle to the main flow direction on the opposite side of the valley.
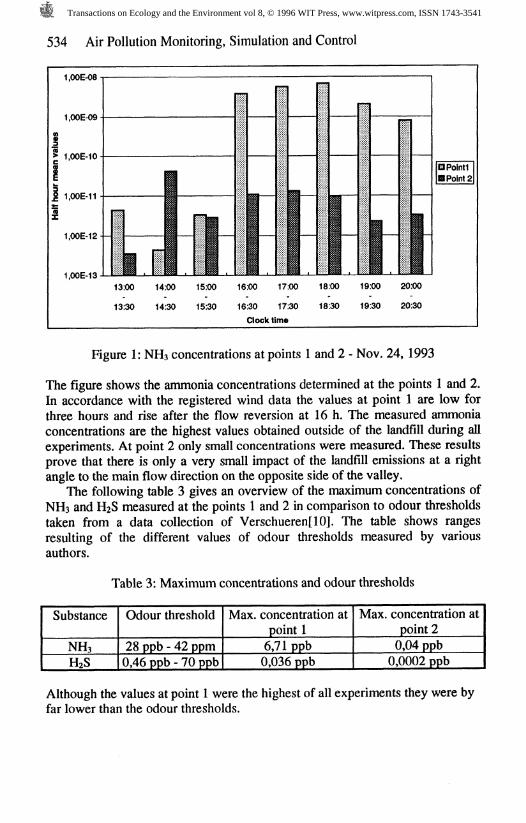
The following table 3 gives an overview of the maximum concentrations ofNHs and RbS measured at the points 1 and 2 in comparison to odour thresholdstaken from a data collection of Verschueren[10]. The table shows rangesresulting of the different values of odour thresholds measured by variousauthors.
Table 3: Maximum concentrations and odour thresholds
Substance
NHaHzS
Odour threshold
28 ppb - 42 ppm0,46 ppb - 70 ppb
Max. concentration atpoint 16,71 ppb0,036 ppb
Max. concentration atpoint 20,04 ppb0,0002 ppb
Although the values at point 1 were the highest of all experiments they were byfar lower than the odour thresholds.
Transactions on Ecology and the Environment vol 8, © 1996 WIT Press, www.witpress.com, ISSN 1743-3541
Air Pollution Monitoring, Simulation and Control 535
6 Concluding remarks
The given examples prove that the tracer gas method is excellently suited tomeasure the atmospheric dispersion of a single plume without interferencesfrom other emitters. The method can be used to assess the environmental impactof single sources of air pollution and therefore provides valuable informations toauthorities and inhabitants. Furthermore, by comparing tracer results with modelpredictions, dispersion models can be evaluated and model parameters beadapted to local conditions.
7 References
1. Slade, D.H. Meteorology and Atomic Energy,TID-24190,USAEC, 1968.
2. Dietz, R.N. & Cote, E.A. Tracing atmospheric pollutants by gaschromatographic determination of sulfur hexafluoride,Environ. Sci. andTechnol., 1973,7, 338.
3. Drivas, PJ. & Shair, F.H. A tracer study of pollutant transport anddispersion in the Los Angeles area, Atmosph. Environ., 1974,8,1115.
4. Binenboym, J. & Gilath, I. Use of Gaseous Tracers for Air PollutionStudies in Urban Areas, Israel Atomic Energy Commission, 1975.
5. Roetzer, H. & Riesing, J. Air flow measurements by a tracer method inroad tunnels with longitudinal ventilation, paper D4 in Proceedings of the5th Int. Symp. on the Aerodynamics & Ventilation of Vehicle Tunnels,Lille, France, 1985.
6. Roetzer, H., Riesing, J., Nentwich, A. & Szeless, A. Measurements ofthe contribution of a coal-fired power plant to the overall groundlevelconcentration of air pollutants by using the SFe-tracer technique, inEnvironmental Meteorology (ed. K. Grefen & J. Loebel), pp. 75-92,Proceedings of an Int. Symp. on Environm. Meteorology, Wuerzburg,Germany, 1987, Kluwer Academic Publishers, 1988.
7. Dispersion of pollutants in the atmosphere - Calculation of ambient airconcentrations and determination of stack heights, ONORM M 9444(Austrian Standard Specifications), Wien, 1992.
8. Roetzer, H., Donhoffer, D. & Semmelrock, G. Messung der AusbreitungderAbluftdes Plabutschtunnels, Report 10/94 of the Austrian FederalMinistry for Environment, Youth and Family, Vienna, 1994.
Transactions on Ecology and the Environment vol 8, © 1996 WIT Press, www.witpress.com, ISSN 1743-3541
536 Air Pollution Monitoring, Simulation and Control
9. Roetzer, H., Muehldorf, V. & Riesing, J. Measurement of the OdourImpact of a Waste Deposit Using the Sp6-Tracer Method, Proceedings ofthe 2nd Int. Symposium on Environmental Contamination in Central andEastern Europe, Budapest, 1994.
10. Verschueren, K. Handbook of Environmental Data on OrganicChemicals, Van Nostrand Reinhold Company Inc., New York, 1983.
Transactions on Ecology and the Environment vol 8, © 1996 WIT Press, www.witpress.com, ISSN 1743-3541